

![Two-dimensional simulations of magma ascent in volcanic ... · the magma flux arriving from below [1,2]. Furthermore, stresses are found to be significant only in the vicinity of](https://static.fdocuments.in/doc/165x107/5ecc6d48c4cec1760059c53f/two-dimensional-simulations-of-magma-ascent-in-volcanic-the-magma-flux-arriving.jpg)

Languages
Pages
Legal


Originally published as:
Lühr, B.‐G., Koulakov, I., Rabbel, W., Zschau, J., Ratdomopurbo, A., Kirbani Sri Brotopuspito, Pak
Fauzi, Sahara, D. P. (2013): Fluid ascent and magma storage beneath Gunung Merapi revealed by
multiscale seismic imaging. ‐ Journal of Volcanology and Geothermal Research, 261, 7‐19
DOI: 10.1016/j.jvolgeores.2013.03.015

1
Fluid ascent and magma storage beneath Gunung Merapi 1
revealed by multi-scale seismic imaging 2
3
4
Birger-G. LUEHR1, Ivan Koulakov
2, W. Rabbel
3, Jochen Zschau
1, Antonius Ratdomopurbo
4, Kirbani Sri 5
Brotopuspito5, Pak Fauzi
6, David P. Sahara
7 6
7
1 Helmholtz Centre Potsdam GFZ German Research Centre for Geosciences, 8
14473 Potsdam, Germany, email: [email protected]) 9
2 Inst. of Petroleum Geol. & Geophys., SB RAS, 3, Novosibirsk, 630090, Russia 10
3 Institute of Geosciences, CAU, Otto-Hahn-Platz 1, 24098 Kiel, Germany 11
4 EOS, Nanyang Techn. University, 50 Nanyang Avenue, Block N2-01a-15, Singapore 639798 12
5 FMIPA, Universitas Gadjah Mada, Sekip Unit III, Yogyakarta 55281, Indonesia 13
6 Meteorological & Geophys. Agency (BMG), Jl Angkasa I, Kemayoran, Jakarta 10720, Indonesia 14
7 Dept. Geophys. & Meteorology, Inst. of Technology Bandung (ITB), Bandung 40132, Indonesia 15
16
17
Abstract 18
Magma is fed to a volcano through a complex “plumbing” system that involves not only shallow 19
structures beneath the volcano edifice, but also deep structures and processes within the underlying crust and 20
upper mantle. This paper summarizes seismic experiments carried out over many years at Gunung Merapi in 21
Central Java. These have resolved the 3D seismic velocity structure of the Merapi edifice, and provided a 3D 22
structural image of the lithosphere and subduction zone beneath Central Java. Earthquake locations reveal 23
that with distance from the trench, the dip of the subducting slab steepens from nearly horizontal (0-150 km), 24
through 45 degrees (150 - 250 km), to 70 degrees (>250 km). The slab appears as a 30 km thick double layer 25
of seismicity in a depth range of 80 km to 150 km, and it can be identified seismically to a depth of more 26
than 600 km. The active volcanoes of Merapi, Sumbing, and Lawu are located at the edge of a large low 27
velocity body that extends from the upper crust to the upper mantle beneath Central Java. Shear wave signals 28
recorded above this anomaly are strongly attenuated compared to neighboring areas. The anomalous body 29
2
has a detected volume of >50,000 km3 and a decrease in P and S velocities relative to adjacent regions of up 30
to 30%. The resulting Vp/Vs ratio of up to 1.9 is unusually high for lower crust. Additionally, the anomaly 31
extends along a 45 degree-slope downward from beneath the volcanic arc and meets the slab at 100 km 32
depth. We interpret this sloping anomaly as a pathway for fluids and partial melts. Increased seismicity is 33
observed at depths of ~100 km, possibly as a result of dehydration of the subducting slab with related fluid 34
releases causing partial melting of overlying mantle material. The large velocity reduction and high Vp/Vs 35
ratio in the region are consistent with an increase in temperature, a reduction of shear strength, and the 36
presence of fluids or melts of 13 to 25 vol. %. The detected strong anomaly beneath Central Java is unique in 37
size and amplitude compared to other subduction zones. The geophysical evidence suggests that this segment 38
of the arc has a high magma flux and is thus capable of developing even larger shallow crustal reservoirs and 39
more voluminous explosive eruptions in the future. 40
41
42
1. Introduction 43
44
Gunung Merapi, located in Central Java, is one of the most active volcanoes in the world. It is one of 45
~98 active volcanoes located along the Sunda Arc (Simkin and Siebert, 1994), a 5,000-km-long collision belt 46
between the Eurasian and the Indo-Australian tectonic plates (Figure 1), where the Australian plate is being 47
subducted beneath the Sunda block at a rate of about 6.5 cm/year (DeMets et al., 1990). Merapi’s dominant 48
type of volcanism is andesitic and its frequent eruptions threaten the surrounding densely populated area, 49
mainly with pyroclastic flows, surges and lahars. For decades, researchers have investigated this volcano to 50
understand the dynamics and structure of its magmatic system. Such knowledge about the volcanic system 51
provides an important framework for improved assessment of related hazards. 52
The high seismic and volcanic hazard potential of Central Java was demonstrated by the disastrous 53
Bantul earthquake (M=6.3) on May 26, 2006, which resulted in 5,750 fatalities, and most recently by the last 54
eruption of Gunung Merapi in late October and early November 2010. This last eruption was unusually 55
strong, classified as a VEI 4 event, comparable to the eruption of 1872. The volume of erupted lava of about 56
0.12 cubic kilometres (Surono et al., 2012) was ten times larger than all other eruptions during the 20th 57
century. Pyroclastic density currents ran out to 16 km from the summit and devastated populated areas. 58
3
Fortunately, due to telemetric data from monitoring instruments analyzed by Indonesian experts and satellite 59
radar data on the rate and size of a rapidly growing summit lava dome, an exclusion zone around the 60
southern slope of the volcano was increased finally to a radius of 20 km prior to the paroxysmal eruption on 61
4-5 November 2010. As a result of the eruption, a total of about 400,000 residents were displaced according 62
to data from Indonesia’s National Agency for Disaster Management (BNPB; see also Mei et al., 2013), and 63
only 367 people lost their lives. Approximately 10,000 to 20,000 lives were likely saved by the accurate 64
eruption forecast (Surono et al., 2012). 65
Here we provide a broad geophysical context for future studies of Merapi, and the other papers in 66
this special issue, by summarizing our current understanding of structure of the crust and mantle beneath 67
Central Java. Our review is based heavily on our previous geophysical studies (Koulakov et al., 2007, 2009b, 68
Wagner et al., 2007). The ascent of fluids and the formation and distribution of partial melts in the crust can 69
be detected by seismic and seismological methods, and imaged with seismic tomography. In particular, as 70
has been shown elsewhere in volcanic arcs, areas of partial melt are indicated by reduced seismic velocities 71
and attenuation of seismic waves.We firstly focus on results from studies of global seismological data, local 72
earthquake tomography of Central Java, and gravity modelling – studies that have revealed the geometry of 73
the subducting slab beneath the magmatic arc. We then present a regional scale tomographic structure of the 74
Java subduction zone section in which Merapi is embedded, and we review the seismic experiment 75
(MERAMEX project) carried out to investigate the structure beneath Central Java. We then focus on the 76
region directly beneath Merapi by presenting results from seismic studies that were particularly designed to 77
illuminate the deep structure and magmatic plumbing of the volcano. Finally, in the discussion section, we 78
combine the seismic results with petrological findings on magma genesis in order to arrive at new 79
conclusions on the dimensions, depths and hazard potential of the Merapi volcanic zone. 80
81
82
2. The Central Java subduction zone 83
84
2.1. Distribution of slab-related seismicity 85
The largest databank of worldwide seismicity is the ISC catalogue (ISC 2001), which includes 86
information on earthquakes and travel times of recorded seismic waves since 1964. The ISC catalogue data 87

4
provide fairly good coverage in most seismically active regions of the world, which makes it suitable for 88
performing tomographic inversions on regional and global scales. However, the data quality in the initial ISC 89
catalogue is rather poor due to a significant amount of erroneous data, which may bias the locations of 90
sources. Therefore, special efforts have been made to reprocess the ISC catalogue and as a result many 91
specialists use a relocation method developed by Engdahl, van der Hilst, and Buland (the EHB method, 92
Engdahl et al., 1998). With these or similar corrections, the revised ISC catalogue is widely used for 93
earthquake analysis and tomographic inversion. In our studies, we used a similar relocation method 94
developed by Koulakov and Sobolev (2006), which is specially oriented to detection and rejection of outliers 95
in the data. The locations of events according to this procedure are based on travel times in a 1D spherical 96
velocity model (here AK135 by Kennett et al., 1995) corrected for the Earth ellipticity, station elevations, 97
and Moho depth. 98
In Figure 2 we present the distribution of seismicity beneath Java from the revised ISC catalogue for 99
the period from 1964 to 2001, consisting mainly of large and moderate events recorded by worldwide 100
networks. Despite our pre-processing, the location quality of these events is still low compared to the 101
locations determined with data from the MERAMEX project, which used more than 100 local stations 102
temporarily installed in Central Java (see description of MERAMEX in section 6). However, the very long 103
period of recording makes the ISC data more representative. For example, due to the relatively short five 104
month period of the MERAMEX project relative to the periodicity of seismicity along the arc, some seismic 105
clusters in Figure 2 are poorly defined by MERAMEX, but well defined in the longer term ISC catalogue. 106
Thus, both global and local catalogues provide valuable data which supplement each other. 107
It can be seen in Figure 2 that the events form clearly separated linear segments which mark the 108
seismicity in different depth intervals. Shallow seismicity (down to 50 km depth) occurred mostly along the 109
trench and in the accretionary prism beneath the offshore area. We suggest that the shallow seismicity in 110
these areas is related to a high asperity of the slab, which generates strong stresses and resulting deformation 111
in the overriding plate above the shallowest segments of the subducting slab. Note that the record presented 112
in Figure 2 stops at 2001; it does not include the M 6.3 Bantul earthquake of 27 May 2006. The area where 113
this onshore event took place, southeast of Merapi, had little seismicity during the years 1964-2006. This 114
suggests that the crustal stresses released during this event had accumulated for fairly long time, i.e., more 115
than the forty year coverage of the ISC catalogue. 116
Based on Figure 2 we can define several deep clusters of slab-related seismicity beneath Java. The 117
5
first level corresponds to a 50-100 km depth interval (purple zone) that is observed beneath the offshore part 118
south of Java. The second zone is located along the southern coast of Java at a depth interval between 100 119
and 200 km (orange zone). The next zone is beneath the northern coast (red zone) at depths of 200 to 250 120
km. Finally, the deepest cluster is located along a fairly narrow zone beneath the Java Sea (brown zone) at 121
550-650 km depth. These four levels possibly mark the different stages of rock transformations occurring in 122
the slab. It can be seen that most of the volcanoes of Java are located above the second seismic zone (orange) 123
at 100-200 km depth. 124
In the distribution of seismicity in the 50-100 km and 100-200 km zones we observe a seismic gap 125
beneath central Java that coincides onshore with the location of Merapi volcano. In addition, the oceanic 126
plate subducting beneath Central Java is segmented into two subplates of considerably different ages (e.g. 127
Müller et al., 1997). These two oceanic plate segments may be subducting independently of each other 128
opening a lateral slab window located beneath the Merapi volcanic complex. This window could form the 129
pathway for deep-sourced magmas (e.g., Costa et al., 2013) and may be the cause of the high eruption 130
frequency of Merapi. Slab windows have been suggested previously as a mechanism to explain unusual 131
characteristics of volcanic systems, for example for the Kluchevskoy volcano group in Kamchatka (e.g., 132
Levin et al., 2003, Koulakov et al., 2011a,b). 133
134
135
2.2. Insights from regional tomography 136
Additional information regarding the geometry of the subducting slab can be determined from 137
seismic tomography. There are several published global and regional models that provide consistent images 138
of the subducted lithosphere beneath the Sunda arc (Bijwaard et al., 1998, Widiyantoro et al., 1999, 139
Gorbatov and Kennett, 2003, Pesicek et al., 2008). Here, we present a model of P and S velocity anomalies 140
based on travel time data from the revised ISC catalogue and calculated with an algorithm for regional 141
tomographic inversion (Koulakov et al., 2002; Koulakov and Sobolev 2006) for the Sunda Arc down to 1000 142
km depth. The inversion is performed in a series of overlapping circular windows using data on body waves 143
that travel, at least partly, through the studied volume. We include rays from events located in the 144
investigated region that are recorded by worldwide stations, and rays from remote events recorded by 145
regional stations. This algorithm has been successfully implemented for studying the upper mantle beneath 146
Europe (Koulakov et al., 2009c), Asia (Koulakov, 2011), Kurile-Kamchatka subduction zone (Koulakov et 147
6
al., 2011b), and many other regions. 148
Our tomographic inversion results are presented in Figure 3. As in most previous tomographic studies, our P 149
and S-seismic models for the Sunda Arc provide clear images of the subducting Indo-Australian plate, which 150
is visible as a high-velocity anomaly aligned with seismicity in the Benioff-Wadati zone. However, some 151
details in our model differ from the previously created models and provide new information on the structure 152
of the slab. Here, we mostly focus on results related to the Central Java segment. In Figure 3 we present two 153
vertical sections for P and S anomalies to the west and to the east of the Merapi. We can see that the slab 154
appears to vary in thickness. 155
For the western section in the region from the surface down to 350 km depth, the slab is clearly 156
imaged as prominent P and S anomalies. In the eastern section the anomalies are less prominent, especially 157
the S-wave velocity anomaly. This diminution of the anomalies favours the hypothesis for a slab window 158
beneath the Merapi area, as discussed in the previous section. This zone has a thickness of 200 km – thicker 159
than expected for subducting oceanic lithosphere. The great thickness could result in part from a smearing 160
effect due to insufficient model resolution; however, our synthetic tests show that smearing in this area is not 161
a major factor. Another possible explanation is that unusual cooling of the mantle above and below the slab 162
produces a much thicker high-velocity area than that of the slab itself. 163
Between 350 and 450 km depth, the slab-related high-velocity anomaly is weaker. We suggest that 164
the lower velocity might be related to the geometry of olivine phase transition interfaces to spinel minerals, 165
which theoretically begin at about 410 km depth. Seismic tomography is not capable of resolving the 166
geometry of such first-order interfaces, but these features can bias a 3D velocity structure. 167
Below 450 km depth in both sections, we observe a large high-velocity anomaly, which extends to 168
the base of the model at 1000 km depth. For the eastern section the high-velocity anomaly appears to be 169
much thicker and appear as an isometric body rather than a slab. We propose that this large high-velocity 170
body represents an accumulation zone for remains of the subducted slab. The transition of mantle minerals 171
from spinel to perovskite at about 670 km depth should create a considerable density and viscosity contrast, 172
such that the subducting plate cannot pass directly through this interface. In theory, only after a long period 173
of crystallization of the denser perovskite phase a critical mass is generated such that the remains of the slab 174
and surrounding upper mantle rocks can penetrate to the lower mantle (e.g., Goes et al., 2008). However, the 175
process of dense-phase accumulation and descent is not synchronous beneath different segments of the 176
subduction zone. Thus we observe rather big differences in the shape of the high-velocity body in the 177
7
transition zone and uppermost part of the lower mantle. Similar features were observed in other subduction 178
zones, such as beneath the Kurile-Kamchatka arc (Koulakov et al., 2011b). 179
Regional-scale seismic tomography, as well as the distribution of Benioff-Wadati seismicity from 180
the revised ISC catalogue, provides the shape of the subducting slab down to 1000 km depth. However, the 181
robustness of these determinations is much lower for the uppermost part of the model (roughly down to 150 182
km). This lack of robust data at this shallow depth interval is compensated by using the local earthquake 183
data, which provide the fine structure of the slab-related Benioff-Wadati zone beneath Central Java and the 184
Merapi. 185
As we can see from the results of regional tomography, the subducting slab cannot be represented by 186
an oversimplified conveyer-type 2D model. The considerable lateral and vertical variations in the slab 187
thickness probably have effects upon the surface tectonics. In particular, the arc volcanism, which is 188
ultimately fed from the subducting slab, has a link with the slab behaviour. In particular, we believe that the 189
specific character of Merapi volcano could be caused by a slab window formed in the contact zone between 190
two autonomously subducting oceanic plates. 191
However, in the upper part of the mantle and even in the crust, the resolution of the global data 192
cannot provide the detail we need to resolve the magmatic plumbing of the volcanic zone. This limitation led 193
to a seismic tomography experiment, designed to resolve the crust and upper mantle below the volcanoes of 194
Central Java from the surface down to 150 km depths (Bohm et al., 2005). 195
196
197
3. Imaging the crustal and upper mantle plumbing system beneath Central Java 198
199
3.1. The MERAMEX project 200
Between May and October 2004, combined amphibious seismological investigations at 110°E were 201
performed as part of the MERAMEX (MERapi AMphibious EXperiment) project (Reichert and Luehr, 2005). 202
The measurements were carried out in co-operation with Indonesian research institutions to investigate the 203
tectonic setting and the volcanic feeding system beneath Central Java. A temporarily installed seismic 204
network of 134 continuously recording stations (triangles in Figure 4), 106 short period Mark L4 205
seismometers, 14 broadband Guralp seismometers, 8 ocean bottom hydrophones (OBH), and 6 ocean bottom 206

8
seismometers (OBS), covered a region of about 150x200 km. OBH’s and OBS’s were deployed during the 207
RV SONNE cruise SO176 to extend the land network offshore to the south of Central Java. The average 208
onshore station spacing was about 20 km. Two of the stations were installed 60 km to the north of the main 209
network on the Karimun Jawa island group in the Java Sea above a cluster of hypocenters at 600 km depth. 210
Offshore, the spacing of the ocean bottom instruments was about 40-90 km. Active seismic experiments 211
were carried out offshore during a second cruise in September/October 2004, SO179. The amphibious data 212
consist of 50,060 first arrival travel time picks of airgun shots fired along three seismic wide-angle profiles 213
and recorded with the onshore MERAMEX network. Four to 5 local earthquake events could be recorded per 214
day, in addition to regional and teleseismic events. The clearest signals were observed at southern and 215
northern coastal areas. In the interior of Central Java, north to Merapi and Lawu volcanoes, the recorded 216
shear wave phases were strongly attenuated. Thus, even a preliminary qualitative evaluation of the 217
seismograms from the experiment showed that there is a significant anomaly beneath Central Java. 218
219
3.2. Results of the MERAMEX tomographic inversion 220
For the passive source tomographic inversion, 292 earthquake events were used. In total, 13,800 221
phases (8,000 P- and 5,800 S-phases) were selected for simultaneous iterative source location and 222
tomographic inversion. A detailed description of this study can be found in Koulakov et al. (2007, 2009b). 223
The P velocity reference model down to the depth of 20 km was estimated based on results of an active 224
seismic experiment performed in the off-shore part of MERAMEX (Wagner et al., 2007). For deeper parts, no 225
reliable constraints were available, therefore, for the range below 20 km depth, the velocity model was 226
defined based on the global AK135 model (Kennett et al., 1995). A first S velocity distribution was 227
determined according to a fixed Vp/Vs ratio of 1.74. 228
Final earthquake locations are shown in Figure 4 in map view (upper plot) and cross section (lower 229
plot). In the vertical section of Figure 4 it can be recognized that the earthquakes line up along the Benioff-230
Wadati zone. The events depict variable dipping angles of the slab. For the first 150 km distance from the 231
trench (50-250 km in the profile P1-P2) the slab appears to be almost horizontal. From 250 km to 450 km 232
along profile P1-P2, the dip angle of the slab becomes about 45˚. Between 40 and 130 km depth this branch 233
shows a rather clear double seismic zone with a thickness of 20-30 km that decreases with depth. Similar 234
doubled seismicity zones with spacing of ~30 km have been observed at other subduction zones, e.g. Japan 235
(Okada and Hasegawa, 2000; Nakajima et al., 2001), New Zealand (Okaya et al., 2002). It is assumed that 236
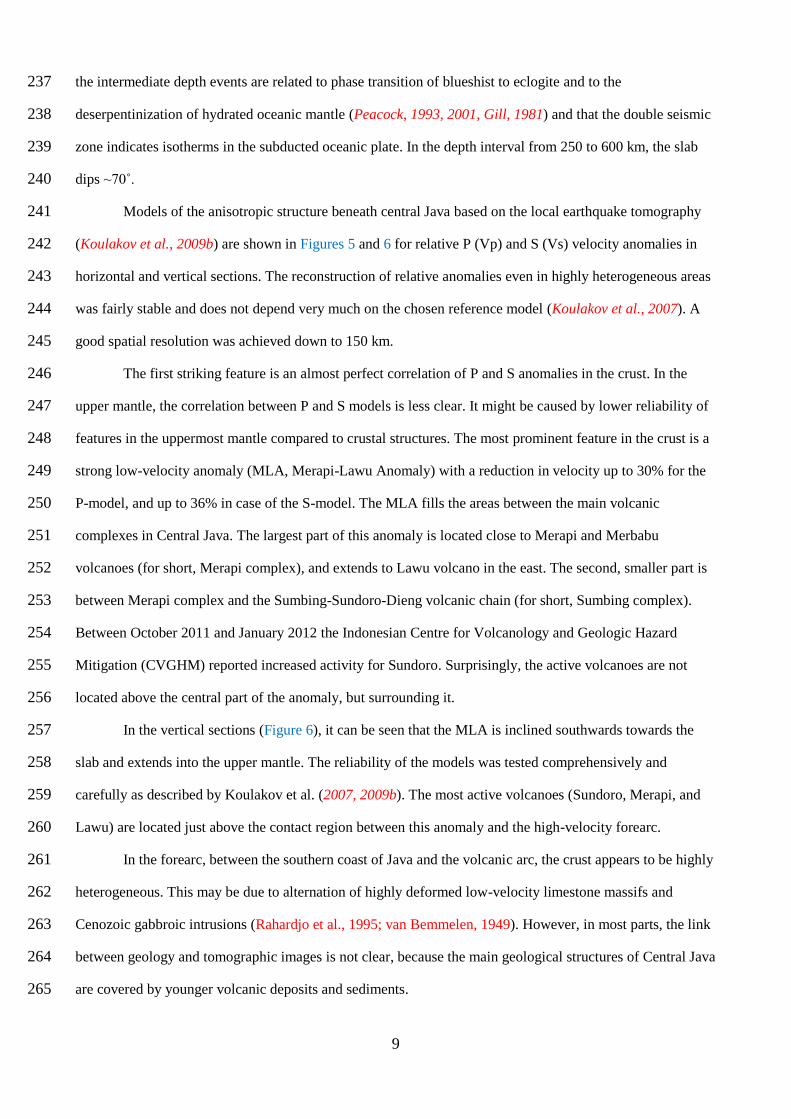
9
the intermediate depth events are related to phase transition of blueshist to eclogite and to the 237
deserpentinization of hydrated oceanic mantle (Peacock, 1993, 2001, Gill, 1981) and that the double seismic 238
zone indicates isotherms in the subducted oceanic plate. In the depth interval from 250 to 600 km, the slab 239
dips ~70˚. 240
Models of the anisotropic structure beneath central Java based on the local earthquake tomography 241
(Koulakov et al., 2009b) are shown in Figures 5 and 6 for relative P (Vp) and S (Vs) velocity anomalies in 242
horizontal and vertical sections. The reconstruction of relative anomalies even in highly heterogeneous areas 243
was fairly stable and does not depend very much on the chosen reference model (Koulakov et al., 2007). A 244
good spatial resolution was achieved down to 150 km. 245
The first striking feature is an almost perfect correlation of P and S anomalies in the crust. In the 246
upper mantle, the correlation between P and S models is less clear. It might be caused by lower reliability of 247
features in the uppermost mantle compared to crustal structures. The most prominent feature in the crust is a 248
strong low-velocity anomaly (MLA, Merapi-Lawu Anomaly) with a reduction in velocity up to 30% for the 249
P-model, and up to 36% in case of the S-model. The MLA fills the areas between the main volcanic 250
complexes in Central Java. The largest part of this anomaly is located close to Merapi and Merbabu 251
volcanoes (for short, Merapi complex), and extends to Lawu volcano in the east. The second, smaller part is 252
between Merapi complex and the Sumbing-Sundoro-Dieng volcanic chain (for short, Sumbing complex). 253
Between October 2011 and January 2012 the Indonesian Centre for Volcanology and Geologic Hazard 254
Mitigation (CVGHM) reported increased activity for Sundoro. Surprisingly, the active volcanoes are not 255
located above the central part of the anomaly, but surrounding it. 256
In the vertical sections (Figure 6), it can be seen that the MLA is inclined southwards towards the 257
slab and extends into the upper mantle. The reliability of the models was tested comprehensively and 258
carefully as described by Koulakov et al. (2007, 2009b). The most active volcanoes (Sundoro, Merapi, and 259
Lawu) are located just above the contact region between this anomaly and the high-velocity forearc. 260
In the forearc, between the southern coast of Java and the volcanic arc, the crust appears to be highly 261
heterogeneous. This may be due to alternation of highly deformed low-velocity limestone massifs and 262
Cenozoic gabbroic intrusions (Rahardjo et al., 1995; van Bemmelen, 1949). However, in most parts, the link 263
between geology and tomographic images is not clear, because the main geological structures of Central Java 264
are covered by younger volcanic deposits and sediments. 265

10
Anomalies within the slab could not be resolved, because events in the Benioff-Wadati zone are 266
located mainly at the uppermost boundary of the slab. Therefore, only few upward travelling seismic rays 267
pass through the slab, and the corresponding travel time data provide almost no information about the inner 268
structure of the slab. 269
270
271
3.3. Gravity modelling 272
The obtained seismic anomalies were compared with the Bouguer gravity anomalies of Smith and 273
Sandwell (1997), as illustrated in Figure 7A. It can be seen that the main features of gravity and seismic 274
models correspond well to one another. For example, the strong negative seismic anomaly located north of 275
Merapi and Lawu volcanoes (MLA) corresponds to a negative gravity anomaly. In the forearc, dominantly 276
positive seismic anomalies correspond to positive gravity anomalies. To quantify this link, we have 277
performed gravity modelling with the aim of estimating values of /d dv coefficients (anomalies of density 278
over anomalies of seismic velocity) for different crustal zones. When performing this modelling, we presume 279
that on this scale of anomalies, the observed gravity effect is only due to the crustal patterns; the mantle 280
anomalies were not included in the modelling. 281
For the modelling, the crust was subdivided into several zones representing the main geological and 282
geophysical features. For example, zones 1 and 2 represent two segments of the offshore crust, zone 3 283
corresponds to the onshore part of the forearc, zone 4 passes through the main arc volcanoes in Central Java, 284
zone 5 coincides with the MLA and low-gravity anomaly, zone 6 represents the onshore backarc area, and 285
zone 7 is located in the offshore area north of Java. The contours of these zones are shown in Figure 7B and 286
C. All zones were defined down to 25 km depth. The gravity effects of each of these zones were computed 287
separately by using P or S anomalies obtained from local earthquake tomography (Figure 5) and by assuming 288
constant values for the coefficients converting seismic velocity to density. Calculations of the gravity effect 289
on the surface from 3D velocity distributions were performed by using a direct 3D integration in a regular 290
grid. Then the gravity effects of all zones were summed with manually defined /d dv coefficients for each 291
zone. The values of these parameters were optimized to achieve the best fit of the observed and computed 292
gravity fields. The final computed gravity fields derived from the P- or S-velocity anomalies are shown in 293
Figure 7 B and C. 294
11
Although the derived coefficients determined by this modelling are not expected to be highly 295
accurate, they do provide semi-quantitative information concerning geological processes in the crust of 296
Central Java. The highest values for the P and S models are obtained for zone 3, representing the forearc. 297
Here, the seismic anomalies are mostly caused by alternation of sedimentary and igneous rocks, which give 298
much stronger differences in density than in seismic velocities. For the arc anomalies and for the MLA 299
(zones 4 and 5) the values of /d dv are quite low. Volcanic conduits in these zones contain magma and 300
other fluids, materials that can produce a strong decrease of seismic velocities. In addition, the integral effect 301
of a sharply heterogeneous crust in these zones also contributes to a general decrease of seismic velocity. 302
However, these structures are not always related to significant low densities. In zone 6 the correlation of 303
gravity and seismic anomalies is low which explains a low value of the /d dv coefficient. 304
305
306
4. The Internal Structure of the Merapi edfice 307
308
4.1. The MERAPI project 309
During the past several decades many research projects have yielded information about the eruption 310
history, volcanic processes, magmatic evolution, and internal structure of Merapi. These studies have had a 311
common goal of contributing to an improved hazard assessment. The MERAPI (Mechanism Evaluation, Risk 312
Assessment, and Prediction Improvement) project (1997-2002) was one of these activities, providing a better 313
understanding of the eruption history and the explosive behaviour, thereby contributing to an improved early 314
warning capability, and risk assessment (Zschau, et al., 1998, 2003; Gertisser and Keller, 2003). 315
Merapi is known as a frequently erupting volcano, with 105 to 108 eruption phases during the 316
Holocene (Siebert et al., 2010; c.f., Badan Geologi, 2011). Small eruptions have occurred every two to five 317
years, while larger eruptions occurred in 50 to 80 year intervals. Historically, 71 eruptions were documented 318
since the year 1548 with the most violent ones in 1786, 1822, 1872, 1930, and 2010. The volume of erupted 319
material compared to other volcanoes is low. The annual erupted volume is in a range of 1.2 million cubic 320
meters of potassium rich basaltic andesite with varying SiO2 content (52 – 57 wt. %) (Siswowidjoyo et al., 321
1995; Andreastuti et al,, 2000; Gertisser and Keller, 2003). 322
323

12
324
4.2. Geophysical results for Merapi edifice 325
For a better understanding of the volcanic activity, the geophysical structure of the volcanic edifice 326
was intensively investigated (Müller and Haak, 2004; Müller et al., 2002; Wegler and Lühr, 2001; 327
Maercklin et al., 2000) with a particular focus on imaging the magmatic system. Seismological 328
investigations carried out by Ratdomopurbo and Poupinet (1995) revealed a zone with unexpectedly low 329
seismic activity at a depth of 1-2 km, just below the summit. Ratdomopurbo and Poupinet (1995) associated 330
this zone with a shallow magma reservoir (Figure 8), while a deeper chamber was assumed to lie at depths 331
extending to 10 km or more. Later, the hypothesis of a deeper chamber was supported by petrologic data 332
(Purbawinata et al., 1997), and several additional petrologic studies have shown that Merapi magmas are 333
staged at multiple levels, ranging from the shallow conduit down to ~30 km (Chadwick et al., 2007, 2008; 334
Deegan et al., 2011; Costa et al., 2013). On the basis of modelling GPS and tilt data, Beauducel and Cornet 335
(1999) concluded that the magma reservoir responsible for feeding the eruptions of the 1990’s was located 336
between 6 km to 9 km below summit. In addition, high resolution gravity modelling (Tiede et al., 2005) 337
provided evidence for high-density bodies, which may be interpreted as solidified magma intrusions or 338
former reservoirs beneath the summits of Merapi, Merbabu, and Telemoyo volcanoes. 339
In contrast to the work by Ratdomopurbo and Poupinet (1995), geoelectric soundings and active 340
seismic investigations (Wegler et al., 1999; Wegler and Lühr, 2001) have found no evidence for a shallow 341
magma reservoir within the edifice. Instead a 4 km wide structure in the centre of the edifice with reduced 342
seismic velocity and high electrical conductivity (Müller and Haak, 2004) was interpreted as a narrow 343
alteration zone surrounding the conduit where conductive fluids circulate (Maercklin et al., 2000, Müller et 344
al., 2002). Precise investigations of soil temperature and CO2 gas flux at the summit area carried out during 345
the inter-eruption period of 2002 to 2007 (Toutain et al., 2009) support this idea. This study found degassing 346
anomalies that appear to be controlled by structures identified as concentric historical caldera rims (1932, 347
1872, and 1768), which have undergone a hydrothermal self-sealing process that lowers permeability and 348
porosity. Variations of fluid mass contents in these regions are sufficient to explain observed gravity changes 349
(Westerhaus et al., 2007). Based on these findings and those by Ratdomopurbo and Poupinet (1995), it was 350
suggested that volcanic earthquakes could not be generated at depths much greater than 5 km, because the 351
aseismic main “magma chamber” is located below this depth. 352
Gossler (2000) analyzed teleseismic events recorded at the broadband stations of the MERAPI 353
13
monitoring network with the Receiver Function method. However, the results revealed little about the 354
shallow structure – a result that we now know is due to a highly complicated structure beneath Merapi. In 355
addition, limitations of the method itself precluded any detailed insights about the deeper structure. Besides, 356
the heterogeneous eruptive material of Merapi, like alternating deposits of pyroclastic flows, lahars, ash falls, 357
and lava flows, causes strong multi scattering effects on seismic waves (Wegler and Lühr, 2001; Wegler et 358
al., 2006). The seismograms from artificial aigun shots (Wegler, et al., 1999) recorded on the slopes of 359
Merapi volcano are characterized by spindle-like envelopes, small or missing P- wave onsets, missing S-360
wave onsets, and long codas, and demonstrate, that multiple scattering is an important effect, which cannot 361
be neglected in the modelling of seismic wave propagation at Merapi volcano. Assuming the dominance of 362
shear waves in the coda and a typical S-wave velocity of around 1.5 km/s for the shallow volcano this 363
corresponds to a transport mean free path length L of only 0.1 km, which is 3 orders of magnitude smaller 364
than for normal Earth crust, where L is typically of the order of 100 km. The corresponding length scales for 365
intrinsic attenuation derived for Merapi volcano depend on frequency and are at least one order of magnitude 366
larger than the transport mean free path (Wegler and Lühr, 2001). Magnetotelluric and geomagnetic profiles 367
were carried out crossing Central Java (Hoffmann-Rothe et al., 2001). Modelling of the data revealed zones 368
of high electrical conductivity in the upper crust, but the depth penetration faded away below a few 369
kilometres. Consequently, there was little geophysical information about the deeper parts beneath Merapi 370
and Central Java until the more recent, larger-scale seismic experiments described in Sections 2 and 3 above. 371
372
373
5. Discussion 374
375
Syracuse and Abers (2006) have analyzed the variations in vertical distance between arc volcanoes 376
at the surface and the slap at depth for nearly all subduction zones. They found that the average slab depth is 377
around 100 km below the volcanoes. Discrepancies were found only in a few cases, as in Central Java, where 378
the vertical distance from the surface to the slab is around 150 km. They attempt to explain such deviations 379
from the average depth by calling on special physical conditions. Another common feature of subduction 380
zones is the observation that earthquake hypocentre distributions show two maxima in depth. A shallow 381
clustering around 20 to 50 km is related to tectonic stress release. Another increase in the frequency of 382
14
earthquakes occurs at 100 km depth on average (ISC, 2001). This peak in seismicity is observed in the same 383
depth range below Central Java. 384
In the Central Andes, seismicity clusters are found at 100-120 km beneath the main volcanic arc 385
linked with low P- and S-velocity zones (Dzierma et al., 2012; Koulakov et al., 2006; Schurr et al., 2003; 386
Husen and Kissling, 2001). It is presumed that these zones trace the upward migration of fluids released from 387
the slab due to phase transitions. These ascending fluids cause decreasing viscosity, and possibly, partial 388
melting. The partially molten materials penetrate into the crust and form magma reservoirs, and in some 389
cases ascend to the surface and cause volcanic eruptions. 390
The most important feature of the MERAMEX tomographic models is an unusually strong low-391
velocity anomaly located in the backarc crust just north of the volcanoes Sumbing, Merapi, and Lawu 392
(Figures 5 and 6). The main part of this anomaly extends about 80 km from east to west and 30 km from 393
north to south, as well as to a depth of over 50 km, from where it further extends as an inclined tongue with 394
decreasing amplitude toward the slab at a depth of 100 km. The active volcanoes are located at the edge of 395
this anomaly between high and low velocity regions. The low velocity body has a volume of more than 396
50,000 km3 and is characterised by a reduction in velocity of up to 20% for the P-model, and up to 25% for 397
the S-model. Shear wave signals recorded above this zone are strongly attenuated compared to areas outside 398
the anomaly. Additionally, there is a good correlation between the distribution of velocity anomalies in the 399
crust and gravity anomalies (Untung and Sato, 1978; Smith and Sandwell, 1997), as shown in the previous 400
section. High-velocity seismic anomalies in the forearc correspond to gravity highs, and the low-velocity 401
MLA fits well with a distinct gravity low (Figure 7). The low gravity region corresponds to the Kendeng 402
Basin, which is located behind and aligned parallel to the volcanic front of Central and East Java. The 403
Kendeng Basin succession is not well exposed but contains much volcanic debris. The deposits have an 404
estimated thickness up to 10 km based on gravity modelling (Waltham et al. 2008). Consequently, we 405
interpret this behind-the-volcanic-front anomaly as the combined product of a thick package of low-velocity 406
sediments in the upper crust, as well as increased temperatures and magmatic fluids in the middle and lower 407
crust. 408
As mentioned above, there is an increase in seismicity at a depth of around 100 km along the top of 409
the down-going slab. This increase in seismicity can be explained by mineralogical phase transitions 410
resulting in dehydration. Mineralogical investigations of Mierdel et al. (2007) provide a better understanding 411
of the role of water and the storage capacity of water in minerals within the Earth’s shallow mantle. They 412

15
showed that the ratio of water saturation versus depth has a pronounced minimum between 100 and 200 km 413
(Bolfan-Casanova, 2007). Depending on the tectonic environment and temperature, the minimum in 414
solubility may be shallow, as in the case of oceanic mantle, but deeper in case of cold continental 415
lithosphere. We propose that for Central Java in a depth range near 100 km, where seismicity is increased, 416
fluids (mainly water) are released from the slab and begin to ascend, leading to a reduction in melting 417
temperature in the overlying mantle wedge (Poli and Schmidt, 1995). The ascent path is imaged 418
tomographically as a zone of low seismic velocity. In the case of Central Java, this path is not vertical but 419
has a 45 degree dip back toward the trench (Figure 9). 420
Synthetic tests (Koulakov et al., 2007) have proven that the MLA cannot be explained simply by a 421
10-km-thick low-velocity sedimentary basin (thickness inferred by gravity modelling; Untung, M., and Y. 422
Sato, 1978). Such a basin, even with seismic velocities lowered by fluid or gas reservoirs, would not be able 423
to generate the high amplitudes observed in our model down to depth of 20-25 km. Hence, the deeper parts 424
of the crust must also have low velocities, and active seismic studies confirm this (Wagner et al., 2007). 425
Unfortunately, aside from gravity modelling, which is non-unique with respect to source material, there is no 426
other quantitative information about the thickness of the sedimentary basin in the literature. As mentioned 427
above, the very low P- and S-velocities within the shallowest part of the MLA could in part result from a 428
high content of fluids (gas and liquids) in the sediment layers. Mud volcanoes in northern Central Java with 429
active release of methane favour this hypothesis. 430
The velocity perturbations, the attenuation of P- and S- waves, as well as the high Vp/Vs ratio of the 431
MLA indicate a high Poisson’s ratio of 0.3, and correlation with a gravity low indicates an area of increased 432
temperature and reduced shear strength in the crust. Depending on the elastic modulus, a content of fluids 433
and partial melts of 13% to 25% is estimated for the MLA volume. Possibly, the regions of the MLA below 434
the sedimentary basin consist of a rigid matrix with pockets of magmatic mush or nearly molten material. 435
The sediments my act as a seal so fluids from the mantle wedge just beneath the MLA cannot pass vertically 436
to the surface. This hypothesis is indirectly supported by relatively strong, randomly looking travel time 437
residuals after inversion (Koulakov et al., 2007). An explanation for this noise could be the existence of 438
relatively small bodies of contrasting material causing scattering. They affect the travel times of seismic rays, 439
but cannot be resolved by the tomographic inversion. On the hand, taking into account realistic frequencies 440
of seismic signals from natural sources, a significant scattering induced effect on the travel time can be 441
expected only for anomalies of a minimum diameter of 1-2 km. On the other hand, anomalies of 15-20 km 442

16
would be resolved in the images and the signals would be more coherent. Therefore, we interpret the lower 443
part of the MLA as a zone composed of a solid matrix, or “reservoir”, that contains pockets of 2 – 15 km 444
diameter that are filled with molten or partially molten material. 445
This model is supported by petrological investigations. Chadwick and Troll (Chadwick et al., 2007) 446
found a lot of minerals in Merapi lavas crystallized at pressures of between 400 and 800 MPa, corresponding 447
to a depth of 15–25 km, with a total range from 100 to 1,350 MPa, corresponding to a depth of 4-40 km. 448
Similar wide ranges in petrologic equilibration depths were estimated by Costa et al. (2013). Two types of 449
amphiboles are identified in the 2010 Merapi deposits, indicating depths ranges of crystallisation of 200 to 450
300 MPa (5 to 6 km depth) and 500 to 700 MPa (~10 to 20 km depth), respectively (Surono et al., 2012; 451
Costa, et al., 2013). Furthermore, the analysis of Chadwick et al. (2007, 2008) and Deegan et al. (2011) 452
indicate that Merapi eruptives are contaminated by crustal fragments in a depth range between 3 km and 11 453
km. The assimilated sediment fragments for instance contribute to CO2 emissions at Merapi volcano. 454
Significant contribution to the volatile budget of magma via limestone assimilation could have profound 455
effect on our understanding of the driving mechanism of eruptions at Merapi and other volcanoes sited on 456
carbonate crust. For example, the highly explosive 2010 eruption was preceded by increased CO2 emissions, 457
which were interpreted as the result of some combination of deep degassing of basaltic magma and limestone 458
reaction (Surono et al., 2012; Costa et al., 2013). 459
Our synthesis model images a velocity section crossing Merapi (Figure 9), and demonstrates the link 460
between volcanism in Central Java and the subduction process. Above 60 km depth, we observe an inclined 461
negative velocity anomaly, most probably caused by fluids and partial melts ascending to the surface. When 462
the fluids and melts reach the bottom of the rigid forearc, expressed by a positive velocity anomaly, they are 463
not able to pass through. Instead they follow its bottom contour. Fluids probably behave in the same manner 464
inside the MLA. As a result of such a migration from beneath the forearc and MLA, the highest 465
concentration of melts would occur along the boundary between them. This appears to be the most 466
favourable location for active volcanism where it is indeed observed today. 467
The velocity anomaly amplitudes found beneath Central Java are exceptionally high compared to 468
anomalies found at other subduction zones. Toba volcano located in northern Sumatra is the source of the 469
largest eruption on Earth within the last two million years. The resulting caldera is 30 x 100 km and has a 470
total relief of 1,700 m. In one eruptive phase at around 75,000 BP, Toba produced the Young Toba Tuff, 471
which has a volume of 2,800 km3. Tomographic investigations of the Toba area (Koulakov et al., 2009a) lead 472
17
to a model that images patches of negative anomalies beneath Toba with velocity reduction values not more 473
than 15% (Koulakov et al., 2009a). Such a velocity reduction appears to be typical for volcanic areas at 474
subduction zones, and for instance comparable to anomalies found in the Andes (Schurr et al., 2003; 475
Koulakov et al., 2006) or Kamchatka (Koulakov et al., 2011a). 476
Therefore, if our model for magma and magmatic fluids being largely responsible for the MLA 477
anomaly is correct, it raises an intriguing question: Can the fluids and melts within the MLA be mobilized in 478
an eruption? We note that if only a few percent of fluids and melts in our model for the MLA were 479
mobilized and erupted in a single event, it would be larger than the 100 km3 Tambora eruption of 1815. 480
Solving this question needs further interdisciplinary and multi-parameter investigations with a focus on this 481
low-velocity anomaly now identified beneath Central Java. 482
483
484
6. Summary and Conclusions 485
486
(1) Seismic experiments carried out over many years at Merapi have resolved the 3D velocity 487
structure of the volcano edifice, and provided a 3D image of the lithospheric structure and the subduction 488
zone of beneath Central Java. 489
(2) Local earthquakes trace the subducting slab beneath Central Java as a 30 km thick double layer in 490
a depth range of 80 km to 150 km. At a distance of up to 150 km from the trench, the slab is nearly 491
horizontal. Between 150 km and 250 km distance, slab dip increases to 45 degrees and beyond 250 km it 492
steepens to 70 degrees. The slap can be identified seismically to a depth of 600 km. 493
(3) A large low velocity body extends from the upper crust to the upper mantle beneath Central Java. 494
The active volcanoes Merapi, Sumbing, and Lawu are located at the edge of this anomaly. Shear wave 495
signals recorded above this anomaly are strongly attenuated compared to neighboring areas The anomalous 496
body has a volume of >50,000 km3 and a decrease in P and S velocities relative to adjacent regions of up to 497
30%. The resulting Vp/Vs ratio of up to 1.9 is unusually high for lower crust. 498
(4) A 45 degree-sloping anomaly extends downward from beneath the volcanic arc and meets the 499
slab at 100 km depth. We interpret this sloping anomaly as an ascent pathway for slab-derived fluids and 500
partial melts. Increased seismicity is observed at depths of ~100 km, possibly as a result of dehydration of 501

18
the subducting slab. Such dehydration releases fluids that ascend from the down-going slab, cause a 502
decrease of melting temperature of overlying mantle material, and induce melting. 503
(5) The large velocity reduction combined with a high Vp/Vs ratio in the region below Central Java 504
is consistent with an increase in temperature, a reduction of shear strength, and the presence of fluids or 505
melts of 13 to 25 vol. %. The strong anomaly beneath Central Java is unique in size and amplitude compared 506
to findings at other subduction zones. This suggests that this segment of the arc has a high magma flux and is 507
thus capable in the future of developing even larger shallow crustal reservoirs and more voluminous 508
explosive eruptions. 509
(6) A main conclusion of our work on Merapi and its surrounding is that the plumbing system of 510
such highly active volcanoes cannot be seen solely from volcano-scale observation but must be understood 511
within the regional tectonic context. 512
513
514
Acknowledgements 515
516
This research project was funded by the German Federal Ministry of Education and Research 517
(BMBF) within the special program GEOTECHNOLOGIEN, and the GeoForschungsZentrum Potsdam 518
(GFZ). Ivan Koulakov was supported by projects IP SB RAS #20 and ONZ-7.3 RAS. Essential support of 519
the project was provided by the Center for Volcanology and Geologic Hazard Mitigation (CVGHM) 520
Bandung, the Volcanological Technology Research Center (BPPTK) Yogyakarta, the Gadjah Mada 521
University (UGM) Yogyakarta, Institut Teknologi Bandung (ITB) Bandung, and the Meteorological and 522
Geophysical Agency (BMG) Jakarta. We would like to thank all Indonesian and German colleagues and 523
students participating in the fieldwork. Instruments were provided by the Geophysical Instrument Pool 524
Potsdam (GIPP), the Christian Albrecht University, Kiel, and the GEOMAR Helmholtz Center for Ocean 525
Research, Kiel. Many thanks also to the reviewers for their critical, constructive and helpful comments. Our 526
special thanks are going to John Pallister for his constructive support and hints, and to Eohan Hologhan for 527
improving the structure of the manuscript and the English writing. 528
529
530

19
References 531
532
Andreastuti, S.D., Alloway, B.V., Smith, I.E.M., 2000. A detailed tephrostratigraphic framework at Merapi 533
Volcano, Central Java, Indonesia: implications for eruption predictions and hazard assessment. Journal of 534
Volcanology and Geothermal Research 100, 51–67. 535
Badan Geologi, 2011. Data Dasar Gunung Api Indonesia, Kementerian Energi dan Sumber Daya Mineral, 536
Bandung, Indonesia, vol., 2, 522 pp. 537
Beauducel, F. and F.H. Cornet, 1999. Collection and three-dimensional modeling of GPS and tilt data at 538
Merapi volcano, Java, J. Geophys. Res., 104, B1, 725-736. 539
Bijwaard, H., W. Spakman, and R. Engdahl, 1998. Closing the gap between regional and global travel time 540
tomography, J. Geophys. Res., 103, pp.30,055–30,078. 541
Bohm M., G. Asch, Pak Fauzi, E.R. Flüh, K.S. Brotopuspito, H. Kopp, B.-G. Lühr, N.T. Puspito, A. 542
Ratdomopurbo, W. Rabbel, D. Wagner, and MERAMEX Research Group, 2005. The MERAMEX Project - 543
A Seismological Network in Central Java, Indonesia - Statusseminar des GEOTECHNOLOGIEN PRG. 544
„Kontinentränder: Brennpunkte im Nutzungs- und Gefährdungspotenzial der Erde“, Session: 545
SUNDAARC, GeoForschungsZentrum (GFZ) Potsdam, 09.-10. June, 2005 546
Bolfan-Casanova, Nathalie, 2007. Fuel for Plate Tectonics; Science, Vol. 315. no. 5810, pp. 338 - 339, [DOI: 547
10.1126/science.1137738]. 548
Chadwick, J. P., 2008. Magma crust interaction in volcanic systems: Case studies from Merapi Volcano, 549
Indonesia, Taupo Volcanic Zone, New Zealand, and Slieve Gullion, N. Ireland: PhD thesis, Trinity 550
College Dublin, pp. 181. 551
Chadwick, J. P., V.R. Troll, C. Ginibre, D.Morgan, R. Gertisser, T.E. Waight, and J.P. Davidson, 2007. 552
Carbonate Assimilation at Merapi Volcano, Java, Indonesia: Insight from Crystal Isotope Stratigraphy; 553
Journal of Petrology, Vol 48, No. 9, pp. 1793-1812. 554
Costa, F., Andreastuti, S., Bouvet de Maisonneuve, C., Pallister, J,. 2013. Petrological insights into the 555
storage conditions, and magmatic processes that yielded the centennial 2010 Merapi explosive eruption 556
(this issue), http://dx.doi.org/10.1016/j.jvolgeores.2012.12.025. 557
Deegan, F.M., V.R. Troll, C. Freda, V. Misiti, J.P. Chadwick, 2011. Fast and furious: crustal CO2 release at 558
Merapi volcano, Indonesia, Geology Today, 27 (2011), pp. 63–64 559

20
DeMets, C., R. Gordon, D. Argus, and S. Stein, 1990. Current plate motions, Geophys. J. Int., 101, pp.425-560
478. 561
Dzierma, Y., W. Rabbel, M. Thorwart, I. Koulakov, H. Wehrmann, K. Hoernle and D. Comte, 2012. 562
Seismic velocity structure of the slab and continental plate in the region of the 1960 Valdivia (Chile) slip 563
maximum—Insights into fluid release and plate coupling. Earth and Planetary Science Letters, 331, 164-564
176. 565
Engdahl, E.R., R. van der Hilst, and R. Buland, 1998. Global teleseismic earthquake relocation with 566
improved travel times and procedures for depth determination, Bull. Seism. Soc. Am. 88, pp. 722–743. 567
Gertisser, R., and J. Keller, 2003. Temporal variations in magma composition at Merapi Volcano (Central 568
Java, Indonesia): magmatic cycles during the past 2000 years of explosive activity. Journal of Volcanology 569
and Geothermal Research, 123, pp. 1-23. 570
Gill, J.B., 1981, Orogenic Andesites and Plate Tectonics, Springer Verlag, Berlin. 571
Goes S., F. A. Capitanio & G. Morra, 2008. Evidence of lower-mantle slab penetration phases in plate 572
motions, Nature 451, 981-984 573
Gorbatov, A., and B.L.N. Kennett, 2003. Joint bulk-sound and shear tomography for Western Pacific 574
subduction zones, Earth and Planetary Science Letters 210, pp.527-543. 575
Gossler J., 2000. Teleseismic Observations at Merapi Volcano, Indonesia, DGG-Mitteilungen, Sonderband 576
IV/2000, pp.17-22. 577
Hoffmann-Rothe, A., O. Ritter, and V. Haak, 2001. Magnetotelluric and geomagnetic modelling reveals 578
zones of very high electrical conductivity in the upper crust of Central Java, Phys. Earth. Planet. Int., Vol. 579
1124/3-4, pp.131-151. 580
Husen, S., and E. Kissling, 2001. Postseismic fluid flow after the large subduction earthquake of 581
Antofagasta, Chile, Geology, 29, pp. 847-850. 582
International Seismological Centre, 2001. Bulletin Disks 1-9 [CD-ROM], Internatl. Seis. Cent., Thatcham, 583
United Kingdom. 584
Kennett, B.L.N., E.R. Engdahl, and R. Buland, 1995. Constraints on seismic velocities in the Earth from 585
traveltimes, Geophys. J. Int., 122, pp.108-124. 586
Koulakov, I. (2011), High-frequency P and S velocity anomalies in the upper mantle beneath Asia from 587
inversion of worldwide traveltime data, J. Geophys. Res., 116, B04301, doi:10.1029/2010JB007938. 588
21
Koulakov, I., Evgeniy I. Gordeev, Nikolay L. Dobretsov, Valery A. Vernikovsky, Sergey Senyukov, and 589
Andrey Jakovlev, 2011a. Feeding volcanoes of the Kluchevskoy group from the results of local earthquake 590
tomography - GEOPHYSICAL RESEARCH LETTERS, VOL. 38, L09305, doi: 10.1029/2011GL046957. 591
Koulakov, I.,N.L. Dobretsov, N.A. Bushenkova , A.V. Yakovlev, (2011b). Slab shape in subduction zones 592
beneath the Kurile–Kamchatka and Aleutian arcs based on regional tomography results, Russian Geology 593
and Geophysics 52, pp. 650–667 594
Koulakov, I., T. Yudistira, B.-G. Luehr, and Wandono, 2009a. P, S velocity and VP/VS ratio beneath the 595
Toba caldera complex (Northern Sumatra) from local earthquake tomography. - Geophys. J. Int., doi: 596
10.1111/j.1365-246X.2009.04114.x. 597
Koulakov, I., A. Jakovlev, and B. G. Luehr, 2009b. Anisotropic structure beneath central Java from local 598
earthquake tomography, Geochem. Geophys. Geosyst., (G3), 10, Q02011, doi:10.1029/2008GC002109. 599
Koulakov I., M.K. Kaban, M. Tesauro, and S. Cloetingh, 2009c, P and S velocity anomalies in the upper 600
mantle beneath Europe from tomographic inversion of ISC data, Geophys. J. Int. 179, 1, p. 345-366. doi: 601
10.1111/j.1365-246X.2009.04279.x 602
Koulakov, I., M. Bohm, G. Asch, B.-G. Luehr, A. Manzanares, K. Brotopuspito, P. Fauzi, M.A. 603
Purbawinata, N. Puspito, A. Ratdomopurbo, H. Kopp, W. Rabbel, E. Shevkunova, 2007. P and S velocity 604
structure of the crust and the upper mantle beneath Central Java from local tomography inversion, J. 605
Geophys. Res., 112, B08310, doi:10.1029/2006JB004712. 606
Koulakov, I., Sobolev, S.V., 2006. A tomographic image of Indian lithosphere break-off beneath the Pamir–607
Hindukush region, Geophys. J. Int. 164 (2), pp. 425–440. 608
Koulakov, I., S.V.Sobolev, and G. Asch, 2005. P- and S-velocity images of the lithosphere-asthenosphere 609
system in the Central Andes from local-source tomographic inversion. Geophys. Journ. Int., 167, pp. 106-610
126. 611
Koulakov, I., Tychkov, S., Bushenkova, N., Vasilevsky, A., 2002. Structure and dynamics of the upper 612
mantle beneath the Alpine–Himalayan orogenic belt, from teleseismic tomography. Tectonophys. 358 (1–613
4), pp. 77–96. 614
Levin V., Shapiro N., Park J., and Ritzwoller M. (2003) Seismic evidence for catastrophic slab loss beneath 615
Kamchatka. Nature 418, pp. 763–767. 616
Maercklin, N., C. Riedel, W. Rabbel, U. Wegler, B.-G. Lühr, J. Zschau, 2000, Structural Investigation of Mt. 617
Merapi by an Active Seismic Experiment, In: Deutsche Geophys. Gesellschaft-Mitteilungen, Sonderband 618

22
IV/2000, pp. 13-16. 619
Mei, Estuning Tyas Wulan, Franck Lavigne, Adrien Picquout, Edouard de Bélizal, Daniel Brunstein, 620
Delphine Grancher, Junun Sartohadi, Noer Cholik, Céline Vidal, 2013. Lessons learned from the 2010 621
Evacuations at Merapi Volcano, Journal of Volcanology and Geothermal Research. (this issue) 622
Mierdel, K., H. Keppler, J. R. Smyth, and F. Langenhorst, 2007. Water Solubility in Aluminous 623
Orthopyroxene and the Origin of Earth's Asthenosphere; Science, Vol. 315. no.5810, pp. 364 - 368, [DOI: 624
10.1126/science.1135422] 625
Müller, R. D., W. R. Roest, J.-Y. Royer, L. M. Gahagan, and J. G. Sclater, 1997. Digital isochrons of the 626
world's ocean floor. Journal of Geophysical Research, 102, 3211-3214, 1997 627
Müller, A., and V. Haak, 2004. 3-D modeling of the deep electrical conductivity of Merapi volcano (Central 628
Java): integrating magnetotellurics, intuction vectors and the effects of steep topography. Journal of 629
Volcanology and Geothermal Research 138, pp.205-222. 630
Müller, M, A. Hördt & F.M. Neubauer, 2002. Internal structure of Mt. Merapi (Indonesia) derived from 631
transient electromagnetic (LOTEM) data, JGR, 107, NO. B9, 2187, doi:10.1029/2001JB000148. 632
Nakajima, J., T. Matsuzawa, A. Hasegawa, and D. Zhao, 2001. Three-dimensional structure of Vp, Vs and 633
Vp/Vs beneath northeastern Japan: Implication for arc magmatism and fluids, J.Geophys.Res., 106, 634
pp.21843-21857. 635
Okada, T., and A. Hasegawa, 2000. Activity of deep low-frequency microearthquakes and their moment 636
tensor in Northwestern Japan (in Japanese with English abstract), Bull. Volcanol. Soc. Jpn., 45, pp.47-63. 637
Okaya, D., S. Henrys, and T. Stern, 2002. "Super-gathers" across the South Island of New Zealand: double-638
sided onshore-offshore seismic imaging of a plate boundary, Tectonophysics, 355, pp.247-263. 639
Peacock, S. M., 2001. Are the lower planes of double seismic zones caused by serpentine dehydration in 640
subducting oceanic mantle, Geology 29, pp.299-302. 641
Peacock, S.M., 1993. The importance of blueshist-eclogite dehydration reactions in subducting oceanic crust, 642
Bull. Seis. Soc. Am., 105, pp.684-694. 643
Pesicek, J., Thurber C., Widiyantoro S., Engdhal E. R., DeShon H., 2008. Complex slab subduction beneath 644
northern Sumatra, Geophys. Res. Lett., 35, L20303, doi: 10.1029/2008GL035262. 645
Poli, S., and M.W. Schmidt, 1995. H2O transport and release in subduction zones: Experimental constrains 646
on basaltic and andesitic systems, J.Geophys. Res., 100, pp. 22299-22314. 647
Purbawinata, M.A., Ratdomopurbo, A., Sinulingga, I.K., Sumarti, S. & Suharno (Ed.), 1997. Merapi 648
Volcano - A Guide Book, Volcanological Survey of Indonesia, Bandung, Indonesia, 64 pp.. 649

23
Rahardjo, Wartono, Sukandarrumidi, Rosidi, H. M. D., 1995. Geologi lembar Yogyakarta skala 1:100.000. 650
Pusat Penelitian dan Pengembangan Geologi, Bandung. 651
Ratdomopurbo, M. A. and G. Poupinet, 1995. Monitoring temporal change of seismic velocity in a volcano: 652
application to the 1992 eruption of Mt. Merapi (Indonesia). Geophys. Res. Lett., 22, (7), pp. 775-778. 653
Reichert Chr., and B.-G. Luehr, 2005. High Risk Volcanism at the Active Margin of the SUNDAARC - 654
BMBF GEOTECHNOLOGIEN Science Reports „Continental Margins - Earth's Focal Points of Usage and 655
Hazard Potential", No. 5, pp.86-87. 656
Schurr B., G. Asch, A. Rietbrock, R. Trumbull, and C. Haberland, 2003. Complex patterns of fluid and melt 657
transport in the central Andean subduction zone revealed by attenuation tomography, Earth and Planetary 658
Science Letters, 215, 105-119. 659
Siebert, Lee, Simpkin, Tom, and Kimberly, Paul, 2010. Volcanoes of the World 3rd Edition, Smithsonian 660
Institution, Washington D.C., 551 pp.. 661
Simkin T., and L. Siebert, 1994. Volcanoes of the World, 2nd edition: Geoscience Press in association with 662
the Smithsonian Institution Global Volcanism Program, Tucson AZ, pp.368. 663
Siswowidjoyo, S., Suryo, I., Yokoyama, I., 1995. Magma eruption rates of Merapi volcano, Central Java, 664
Indonesia during one century (1890–1992). Bulletin of Volcanology 57, 111–116. 665
Smith, W.H.F., and D.T.Sandwell, 1997. Global seafloor topography from satellite altimetry and ship depth 666
soundings, Science, 277, pp.1957–1962. 667
Supriyati Andreastuti, F. Costa, J. Pallister, Sri Sumarti, Sri Subandini, A. Heriwaseso, and Y. Kurniadi, 668
2011. Petrology and pre-eruptive conditions of the 2010 Merapi magma. EGU General Assembly 2011, 669
Vol. 13, EGU2011-5150, Vienna 670
Surono, Phil. Jousset, J. Pallister, M. Boichu, M. F. Buongiorno, A. Budisantoso, F. Costa, S. Andreastuti, F. 671
Prata, D. Schneider, L. Clarisse, H. Humaida, Sri Sumarti, Chr. Bignami, J. Griswold, S. Carn, C. 672
Oppenheimer & F. Lavigne, 2012. The 2010 explosive eruption of Java’s Merapi volcano – a ‘100-year’ 673
event Journal of Volcanology and Geothermal Research, v. 241-242, pp.121-135. 674
Syracuse, E. M., and G. A. Abers, 2006. Global compilation of variations in slab depth beneath arc 675
volcanoes and implications - G3, Volume 7, Number 5, 23 May 2006 676
Tiede, C., A.G. Camacho, and C. Gerstenecker, 2005. J. Fernández: Modelling the density at Merapi volcano 677
area, Indonesia, via the inverse gravimetric problem, Geochemistry, Geophysics, Geosystems (G3), 6(9), 678
pp.1-13. 679

24
Toutain, J.-P., Sortino, F., Baubron, J.-C., Richon, P., Surono, Sumarti, S., Nonell, A.,, 2009. Structure and 680
CO2 budget of Merapi volcano during inter-eruptive periods. Bull. Volcanol. 71, 815-826, 681
doi:10.1007/s00445-009-0266-x. 682
Untung, M., and Y. Sato, 1978. Gravity and geological studies in Java, Indonesia, Geological Survey of 683
Indonesia and Geological Survey of Japan, A joint research program on regional tectonics of Southeast 684
Asia Institute for transfer of industrial technology projects. Special publication, 6, 207 pp. 685
van Bemmelen, R.W. 1949. The Geology of Indonesia. Government Printing Office, Nijhoff, The Hague. 686
Wagner, D., I. Koulakov, W. Rabbel, B.-G. Luehr, A. Wittwer, H. Kopp, M. Bohm, G. Asch and the 687
MERAMEX Scientists, 2007. Joint Inversion of Active and Passive Seismic Data in Central Java. Geoph. J. 688
Int. 170, pp. 923–932. 689
Waltham, D., R. Hall, H. R. Smyth, C. J. Ebinger, 2008. Basin formation by volcanic-arc loading. GSA 690
Special Paper: Formation and applications of the sedimentary record in arc collision zones (ed A Draut), 691
GSA Special Papers, v. 436, pp. 11-26. 692
Wegler, U., B.-G. Lühr, R. Snieder, and A. Ratdomopurbo, 2006. Increase of shear wave velocity before the 693
1998 eruption of Merapi volcano (Indonesia), Geophys. Res. Lett., 33, L09303, 694
doi:10.1029/2006GL025928. 695
Wegler, U., B.-G. Lühr, 2001. Scattering behaviour at Merapi volcano (Java) revealed from an active seismic 696
experiment. –Geophys. J. Int., 145, pp. 579-592. 697
Wegler, U., B.-G. Lühr & A. Ratdomopurbo, 1999. A repeatable seismic source for tomography at volcanoes 698
- Annali di Geofisica, 42, 3, pp. 565-571. 699
Westerhaus, M., B.-G. Lühr, M. Müller, G. Läufer, 2007. Inner structure and fluid transport at Merapi 700
Volcano, Central Java – Festschrift zum 65. Geburtstag von Prof. Dr. Ing. Carl-Erhard Gerstenecker, 701
Schriftenreihe der Fachrichtung Geodäsie Fachbereich Bauing.-wesen & Geodäsie, TU Darmstadt, ISBN 978-702
3-935631-17-4, Heft 28, pp 89-106, Dez. 2007 703
Widiyantoro, S., Kennett, B.L.N., Van der Hilst, R.D., 1999. Seismic tomography with P and S data reveals 704
lateral variations in the rigidity of slabs, Earth and Planetary Science Letters, v. 173, pp. 91-100. 705
Zschau, J R. Sukhyar, M.A. Purbawinata, B.-G. Lühr, 2003. The Merapi-Project – Interdisciplinary 706
Monitoring of a High-Risk Volcano as a Basis for an Early Warning System; in Early Warningsystems for 707
Natural Disaster Reduction, Editors: J. Zschau, A. Küppers, Springer-Verlag, Berlin, Heidelberg, New 708
York, pp.527-534. 709

25
Zschau, J. Sukhyar, R., M.A. Purbawinata, B.-G. Lühr; M. Westerhaus, 1998. Project MERAPI - 710
Interdisciplinary Research at a High-Risk Volcano; DGG-Mitteilungen, Sonderband III/1998, pp.3-8. 711
712
713
714
Figures: 715
716
Figure 1. Map showing the investigation area of Central Java with all volcanoes, geological structures, and 717
settlements mentioned in the text. 718
719
Figure 2. Distribution of the slab-related seismicity at Java. Event data are from the ISC catalogue for the 720
period 1964-2002. Coloured zones highlight the occurrence of events in the four deepest depth intervals as 721
indicated in the scale. Yellow triangles mark volcanoes with Lawu (LW), Sumbing (SMB), Sundoro (SUN), 722
Dieng (DNG) volcanoes, and the red circle marks Merapi volcano (MRP).he black star marks the M=6.3 723
Bantul earthquake happened on 26 May 2006. 724
725
Figure 3. The upper panels show results of the tomographic inversion showing P and S-seismic models 726
based on ISC catalogue data. The four lower panels show the results for P and S anomalies projected into the 727
two vertical sections, one aligned to the west (W) and the other to the east of Merapi (E). The red circle 728
marks Merapi volcano. 729
730
Figure 4. Local earthquakes recorded during the MERAMEX Project during 150 days (May to October 731
2004). (a) Map view. Sources are colour coded according to their depth. Triangles show the position of the 732
MERAMEX seismic stations. The main volcanic complexes are outlined with black contours. (b) Horizontal 733
cross section. Size and darkness of dots represent distance to the profile. Inferred upper limit of the slab and 734
double seismic zone are highlighted with red lines. 735
736
Figure 5. Results of anisotropic inversion after five iterations in two horizontal depth slices. Colours indicate 737
the isotropic velocity perturbations relative to AK 135 velocity model which are computed as average of four 738
anisotropic parameters in each point. Vectors show directions of fast horizontal P velocities. Length of 739
26
vectors reflects difference between fastest and slowest horizontal velocities. The reference vector (10% of 740
anisotropy) is shown below the left figure column. Volcanic complexes are marked for Lawu (LW), 741
Sumbing (SMB), Sundoro (SUN), Dieng (DNG). The yellow star indicates the epicentre of the M=6.3 742
Bantul earthquake 2006. Profiles of two cross sections presented in Figure 6 are shown in maps. Black lines 743
show the coast of Java and position of the main volcanic complexes, same as in Figure 2. Prominent is a 744
strong negative velocity anomaly called MLA (Merapi-Lawu Anomaly). 745
746
Figure 6. Cross sections of anisotropic P and isotropic S models based on five iterations of the model. 747
Positions of sections are shown in Figure 5. The anisotropy vectors for the P model are vertical if the vertical 748
velocity variations are larger than the average horizontal perturbations and horizontal in the opposite case. 749
The reference vector (6% of anisotropy) is shown in the left-bottom corner. Black dots show positions of the 750
relocated sources within 30 km of the profile. Stronger anomalies close to model boundaries are of low 751
significance. 752
753
Figure 7. Result of optimization for ddV coefficients in the crust. Gravity map after Smith and Sandwell 754
(1997) on the left and calculated gravity values derived from Vp and Vs velocities (on the right) showing a 755
strong negative gravity anomaly in Central Java, extending to the east. The gravity anomaly fits well with the 756
seismic velocity anomaly MLA (centered at approximately 7°S, 111°E). 757
758
Figure 8. Cross-section sketch of Merapi volcano according to Radomopurbo and Poupinet (1995) who 759
postulated a shallow magma reservoir inside the edifice of Merapi based on an observed aseismic zone. 760
Volcano tectonic events shown as circles are detected as a lower (VTA) and upper (VTB) cluster, 761
respectively. The main chamber was inferred to be located beneath the VTA seismicity. The dots are 762
intended to show the extent of magma. 763
764
Figure 9. Synoptic model showing the link between the subduction process and Merapi volcano. The 765
background shows P velocities (color code is the same as in Figure 6). Yellow circles show distribution of 766
local seismicity recorded within this study. Blue waved arrows indicate zone of fluid release from the slab. 767
Brown dotted arrows mark the ascent paths of fluid and melt migration. Black dashed lines indicate V-768
shaped weakened zone with lower seismic velocity and higher seismicity which could be related to thrusting 769

27
caused by increasing friction on the upper surface of the slab. Shallow green area to the right of Merapi 770
indicates the sediment cover above the MLA. We have little data to define the position of the Moho, thus it is 771
shown with question marks. 772

Fig. 1
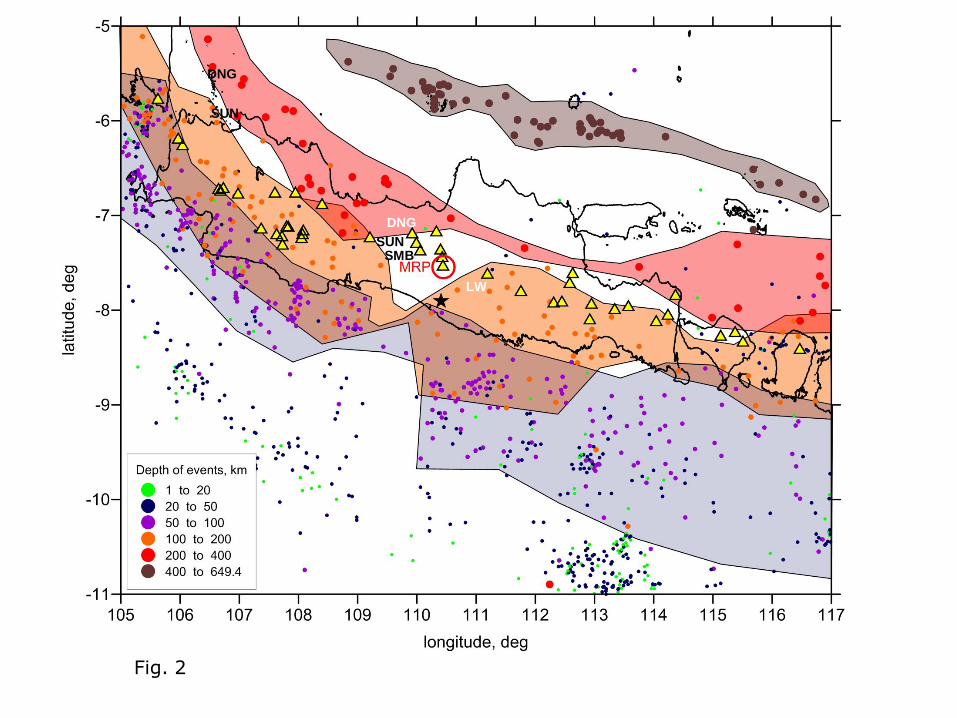
Fig. 2
DNG
SUN
DNG
SMB SUN
LW
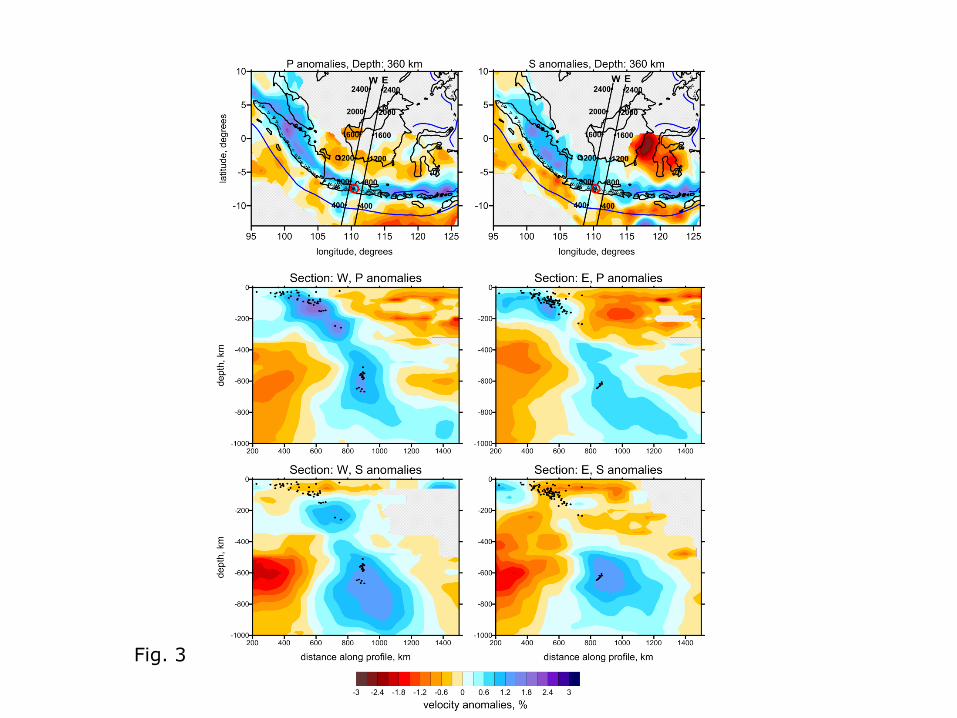
Fig. 3
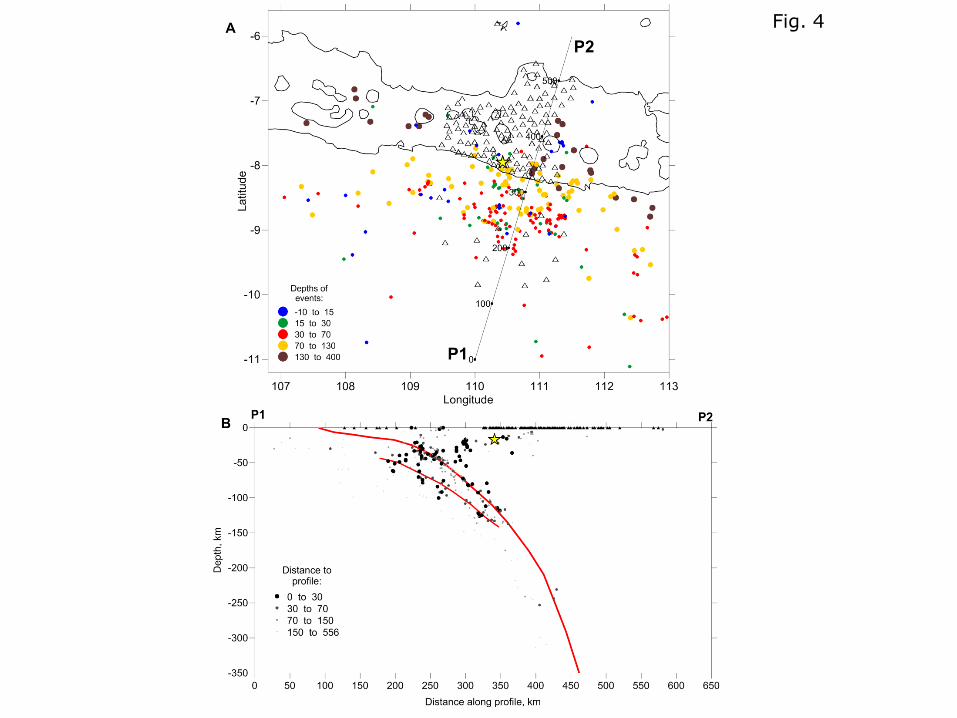
Fig. 4

Fig. 5
MLA
DNG
SUN
DNG
SUN

Fig. 6
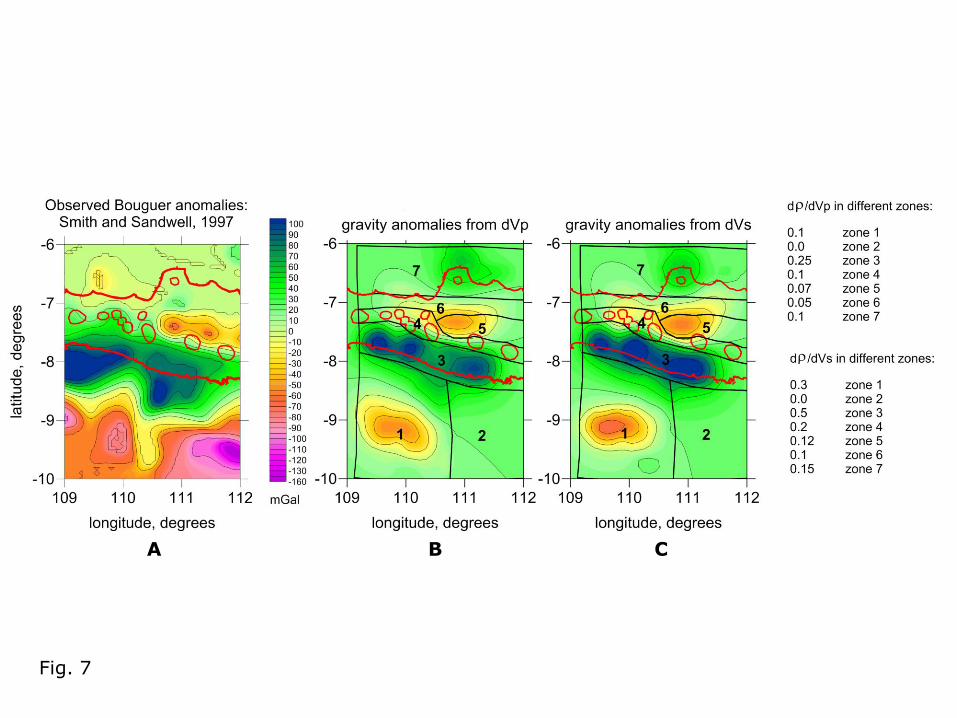
Fig. 7
A C B
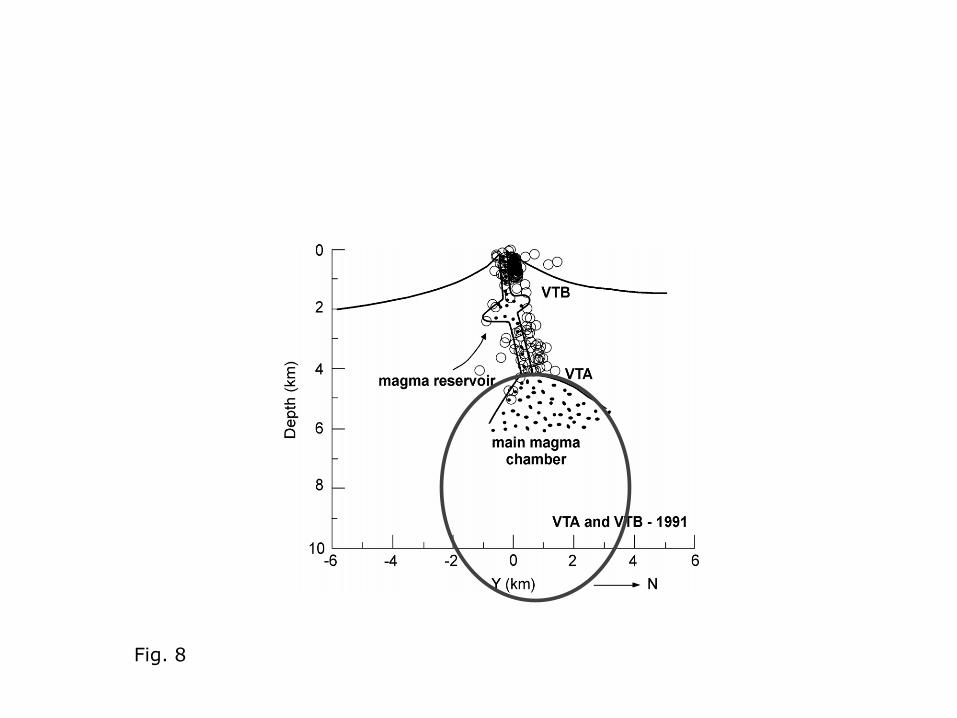
Fig. 8
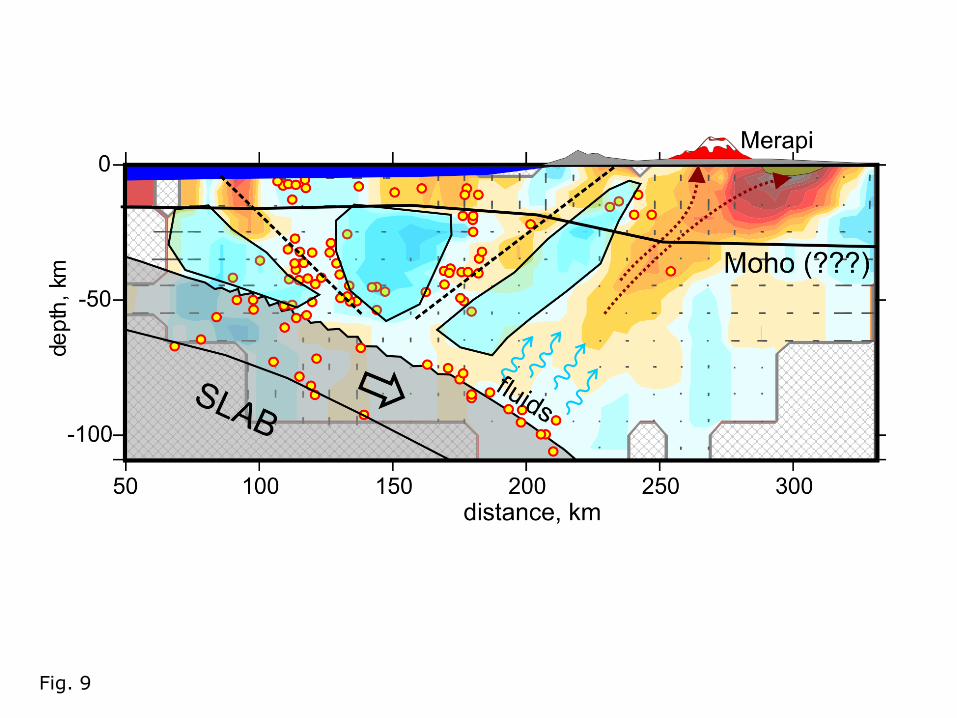
Fig. 9
Top Related