


Languages
Pages
Legal


1
Case for change – HCM Enhancements•Qualifications Verification
SAPO Corporate Strategic Plan
NCOP - Select Committee
27 May 2015
Additional Notes Pack
SAPO Performance Measures
2
2015/16 2016/17 2017/18 2015/16 2015/16 2015/16 2015/16
Annual Target Annual Target Annual Target Quarter 1 Quarter 2 Quarter 3 Quarter 4
Revenue
CostNet income
Capex
OpexSubsidy
Competitive and Market shareConduct a
market analysis
Implement strategies
Implement strategies
N/A N/A N/AConduct a
market analysis
Profitable ProfitabilityConduct a
market analysis
Implement strategies
Implement strategies
N/A N/A N/AConduct a
market analysis
Create a commercially viable business from
the unreserved markets
Develop the financial model
Develop the financial model
Develop the financial model
Develop the financial model
Financial requirements of the reserved market
Develop the financial model
Implement model
Implement model
Develop the financial model
Develop the financial model
Develop the financial model
Strategic Goal 1: Implement the Strategic Turnaround Plan to achieve a sustainable organisation
Strategic Objective Key Performance AreasKey Performance
Indicator
Deliver sustainable developmental obligations funded from reserved market
Financial performance of the reserved market
Develop the financial model
Implement model
Implement model
Develop the financial model
A01
SAPO Performance Measures
3
2015/16 2016/17 2017/18 2015/16 2015/16 2015/16 2015/16
Annual Target Annual Target Annual Target Quarter 1 Quarter 2 Quarter 3 Quarter 4
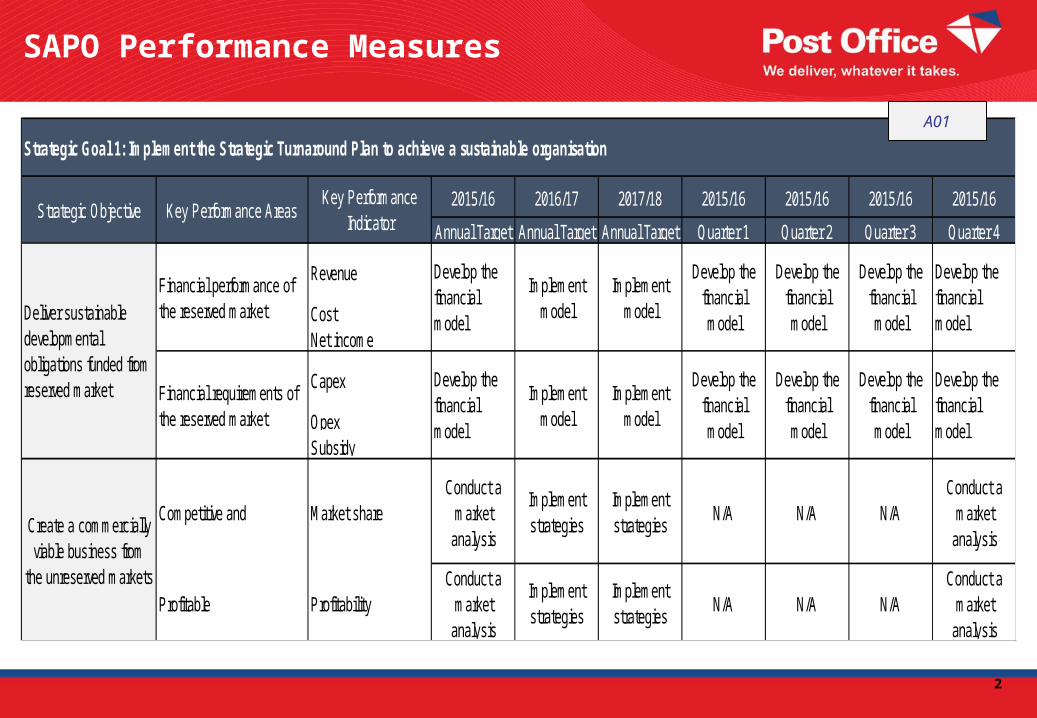
Mail delivery standards
92% 92% 92% 92% 92% 92% 92%
Retail queue waiting times
7 minutes 7 minutes 7 minutes 7 minutes 7 minutes 7 minutes 7 minutes
People
(Mail processing)
Transport
Develop and implement efficiency
ratios
Implement efficiency
ratios
Implement efficiency
ratios
Develop efficiency
ratios
Implement efficiency
ratios
Implement efficiency
ratios
Implement efficiency
ratios
Property
(Retail revenue per square metre)
Time to fill vacancies 90 days 90 days 90 days 90 days 90 days 90 days 90 days
Contracts in place 100% 100% 100% 100% 100% 100% 100%
% of organisational scorecard target achieved
90% 95% 95% 90% 90% 90% 90%
Achieve operational efficiency and effectiveness
10%
Performance management
R791 per square metre
Achieve Leadership stability that ensures continuity and accountability
Vacancies% staff turnover 10% 5% 5% 3% 5% 7%
R791 per square metre
R910 per square metre
R1046 per square metre
R688 per square metre
R713 per square metre
R738 per square metre
Service standards
Productivity
1800 standard letters per hour per person
1800 standard letters per hour per person
1800 standard letters per hour per person
1800 standard letters per hour per person
1800 standard letters per hour per person
1800 standard letters per hour per person
1800 standard letters per hour per person
Strategic Goal 1: Implement the Strategic Turnaround Plan to achieve a sustainable organisation
Strategic Objective Key Performance AreasKey Performance
Indicator
A02

SAPO Performance Measures
4
2015/16 2016/17 2017/18 2015/16 2015/16 2015/16 2015/16
Annual Target Annual Target Annual Target Quarter 1 Quarter 2 Quarter 3 Quarter 4Lost hours due to industrial action
0 0 0 0 0 0 0
Compliance to labour agreements
100% 100% 100% 100% 100% 100% 100%
Time to conclude agreements
90 days 60 days 45 days 90 days 90 days 90 days 90 days
Customer segment
Revenue R6.733bn R8.365bn R 8.86 To be aligned To be aligned To be aligned R6.733bn
Expenses R6.857bn R6.448bn R6.561bn To be aligned To be aligned To be aligned R6.857bn
Net loss / net profitNet loss (R102m)
Net Profit R1.298bn
Net Profit R1.540bn
Net loss (R102m)
Debtors daysDebtors days outstanding of
20 days
Debtors days outstanding of
15 days
Debtors days outstanding of
15 days
Debtors days outstanding of
45 days
Debtors days outstanding of
30 days
Debtors days outstanding of
25 days
Debtors days outstanding of
20 days
ProfitabilityAchieve financial
sustainability
Develop Develop ImplementDevelop and implement
modelChannels
To be aligned
Achieve labour stability and improve labour relations
Effective Labour forums
ProductDevelop and implement
modelImplement Implement
Strategic Goal 1: Implement the Strategic Turnaround Plan to achieve a sustainable organisation
Strategic Objective Key Performance AreasKey Performance
Indicator
A03

SAPO Performance Measures
5
2015/16 2016/17 2017/18 2015/16 2015/16 2015/16 2015/16
Annual Target Annual Target Annual Target Quarter 1 Quarter 2 Quarter 3 Quarter 4
Stock daysImplement efficiency
ratios
Implement efficiency
ratios
Implement efficiency
ratios
Develop efficiency ratios
Implement efficiency
ratios
Implement efficiency
ratios
Implement efficiency ratios
Stock turnoverImplement efficiency
ratios
Implement efficiency
ratios
Implement efficiency
ratios
Develop efficiency ratios
Implement efficiency
ratios
Implement efficiency
ratios
Implement efficiency ratios
Solvency <1Total assets to exceed
total liabilities
Total assets to exceed
total liabilities<1 <1 <1 <1
Liquidity
Current assets / current liabilities
Gearing ratios (Debt /equity)
-143% 932% 93% N/A N/A N/A -143%
Balance sheet (SAPO Group excluding
Postbank)
Achieve financial sustainability
Profitability
Creditors days
outstanding of 60 days
Creditors days
outstanding of 45 days
01:01 01:01 01:01 <1 <1 <1 01:01
Creditors days
Creditors days
outstanding of 45 days
Creditors days
outstanding of 30 days
Creditors days
outstanding of 30 days
Creditors days
outstanding of 90 days
Creditors days
outstanding of 75 days
Strategic Goal 1: Implement the Strategic Turnaround Plan to achieve a sustainable organisation
Strategic Objective Key Performance AreasKey Performance
Indicator
A04

SAPO Performance Measures
6
2015/16 2016/17 2017/18 2015/16 2015/16 2015/16 2015/16
Annual Target Annual Target Annual Target Quarter 1 Quarter 2 Quarter 3 Quarter 4
Improve the customer experience to achieve customer loyalty
CustomersCustomer satisfaction
Customer satisfaction index
40% 50% 60% N/A N/A 40%
Strategic Goal 2: Create a customer centric organisation to restore customer confidence
Strategic ObjectiveKey
Performance Areas
Key Performance
Indicator
2015/16 2016/17 2017/18 2015/16 2015/16 2015/16 2015/16
Annual Target Annual Target Annual Target Quarter 1 Quarter 2 Quarter 3 Quarter 4
Implementation of cabinet memo
30% of Government
business
40% of Government
business
55% of Government
business
10% of Government
business
20% of Government
business
25% of Government
business
30% of Government
businessNumber of accounts
Develop and implement
Implement ImplementDevelop and implement
Implement Implement Implement
Revenue from Government
Develop and implement
Implement ImplementDevelop and implement
Implement Implement Implement
Strategic Goal 3: Position SAPO as a key service partner that delivers government services
Strategic Objective
Key Performance
Areas
Key Performance
Indicator
Grow to levels of 50 - 55% of SAPO revenue per annum
Government business
A05
SAPO Performance Measures
7
2015/16 2016/17 2017/18 2015/16 2015/16 2015/16 2015/16
Annual Target Annual Target Annual Target Quarter 1 Quarter 2 Quarter 3 Quarter 4
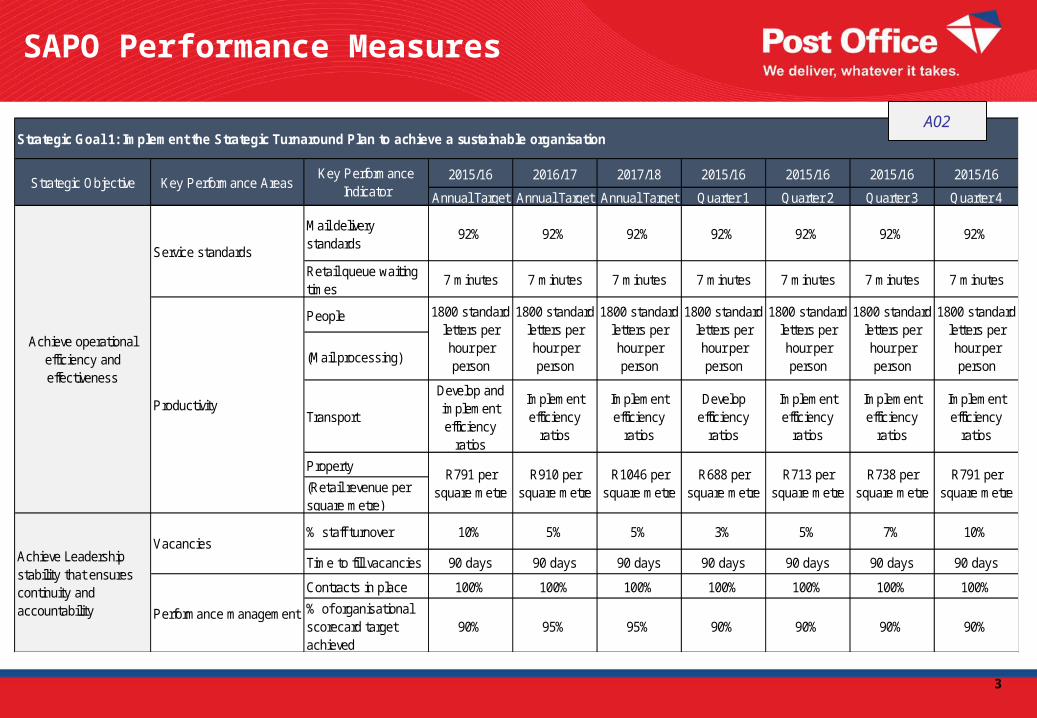
5% 5% 5% 5%
10% 20% 30% 50%
Increase access of financial services to the unbanked
Provide banking services
Growth the Postbank depositors
5% 5% 105%
Strategic Goal 4: Corporatisation of Postbank and increase access to financial services,
Strategic ObjectiveKey Performance
Areas
Key Performance
Indicator
Facilitate the corporatization of Postbank
Bank registration
Obtain section 16 approval to register a bank
50% 75% 100%
A06
SAPO Performance Measures
8
2015/16 2016/17 2017/18 2015/16 2015/16 2015/16 2015/16
Annual Target Annual Target Annual Target Quarter 1 Quarter 2 Quarter 3 Quarter 4
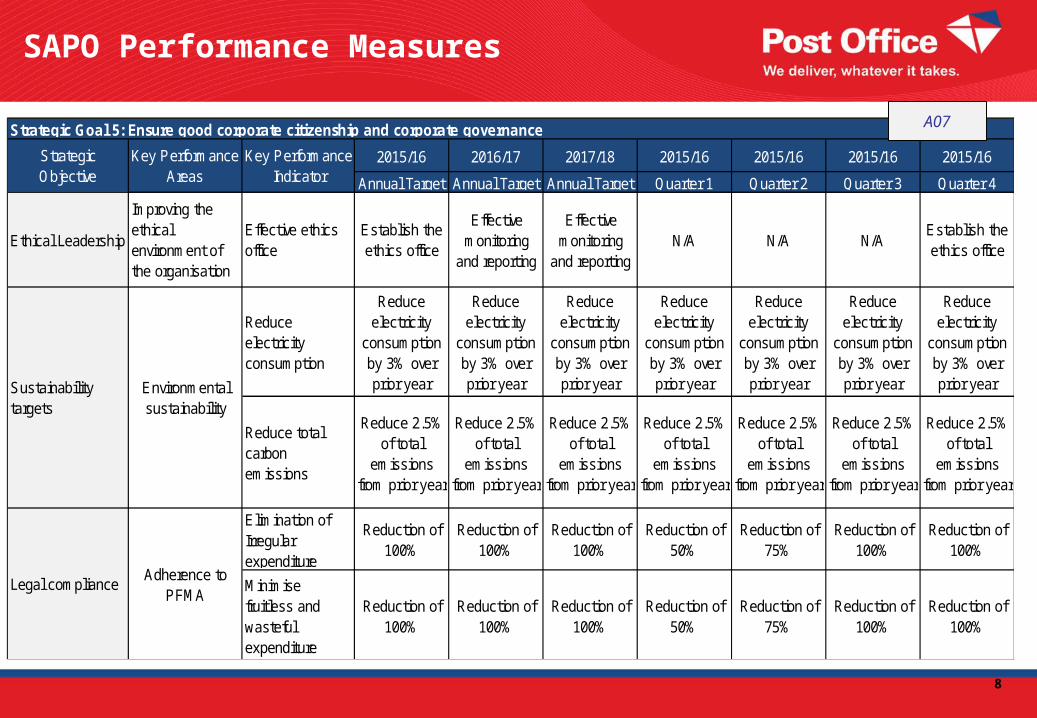
Reduce electricity consumption
Reduce electricity
consumption by 3% over prior year
Reduce electricity
consumption by 3% over prior year
Reduce electricity
consumption by 3% over prior year
Reduce electricity
consumption by 3% over prior year
Reduce electricity
consumption by 3% over prior year
Reduce electricity
consumption by 3% over prior year
Reduce electricity
consumption by 3% over prior year
Reduce total carbon emissions
Reduce 2.5% of total
emissions from prior year
Reduce 2.5% of total
emissions from prior year
Reduce 2.5% of total
emissions from prior year
Reduce 2.5% of total
emissions from prior year
Reduce 2.5% of total
emissions from prior year
Reduce 2.5% of total
emissions from prior year
Reduce 2.5% of total
emissions from prior year
Elimination of Irregular expenditure
Reduction of 100%
Reduction of 100%
Reduction of 100%
Reduction of 50%
Reduction of 75%
Reduction of 100%
Reduction of 100%
Minimise fruitless and wasteful expenditure
Reduction of 100%
Reduction of 100%
Reduction of 100%
Reduction of 50%
Reduction of 75%
Reduction of 100%
Reduction of 100%
Legal complianceAdherence to
PFMA
N/A N/A N/AEstablish the ethics office
Sustainability targets
Environmental sustainability
Strategic Goal 5: Ensure good corporate citizenship and corporate governance
Strategic Objective
Key Performance Areas
Key Performance Indicator
Ethical Leadership
Improving the ethical environment of the organisation
Effective ethics office
Establish the ethics office
Effective monitoring
and reporting
Effective monitoring
and reporting
A07
SAPO Performance Measures
9
2015/16 2016/17 2017/18 2015/16 2015/16 2015/16 2015/16
Annual Target Annual Target Annual Target Quarter 1 Quarter 2 Quarter 3 Quarter 4
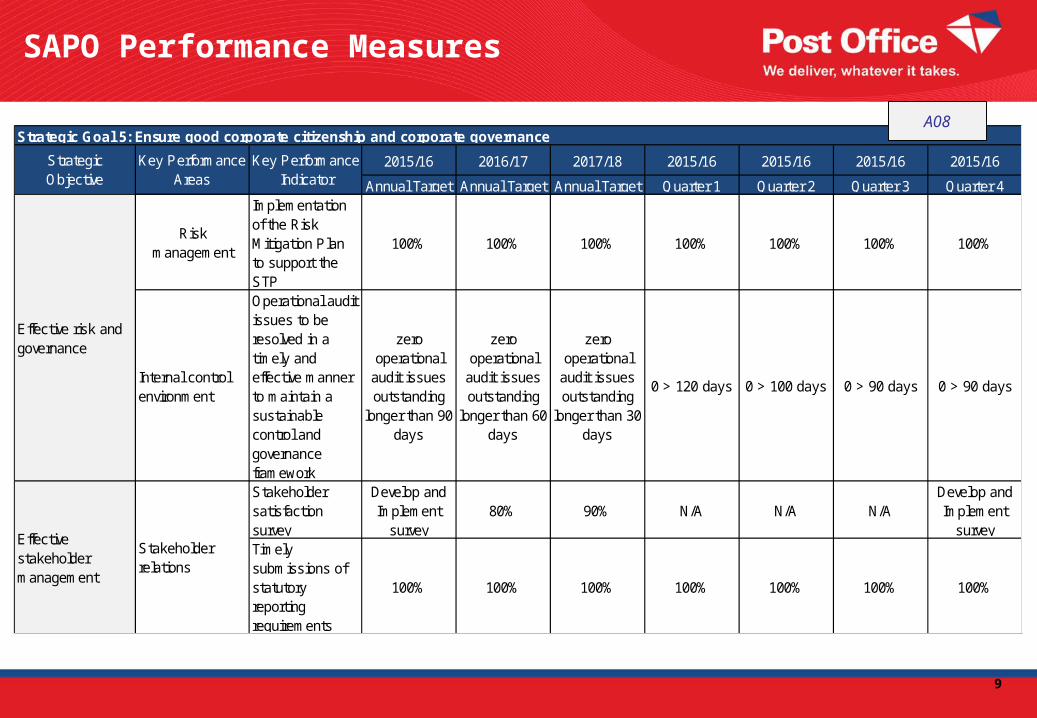
Risk management
Implementation of the Risk Mitigation Plan to support the STP
100% 100% 100% 100% 100% 100% 100%
Internal control environment
Operational audit issues to be resolved in a timely and effective manner to maintain a sustainable control and governance framework
zero operational
audit issues outstanding
longer than 90 days
zero operational
audit issues outstanding
longer than 60 days
zero operational
audit issues outstanding
longer than 30 days
0 > 120 days 0 > 100 days 0 > 90 days 0 > 90 days
Stakeholder satisfaction survey
Develop and Implement
survey80% 90% N/A N/A N/A
Develop and Implement
surveyTimely submissions of statutory reporting requirements
100% 100% 100% 100% 100% 100% 100%
Strategic Goal 5: Ensure good corporate citizenship and corporate governance
Strategic Objective
Key Performance Areas
Key Performance Indicator
Effective risk and governance
Effective stakeholder management
Stakeholder relations
A08
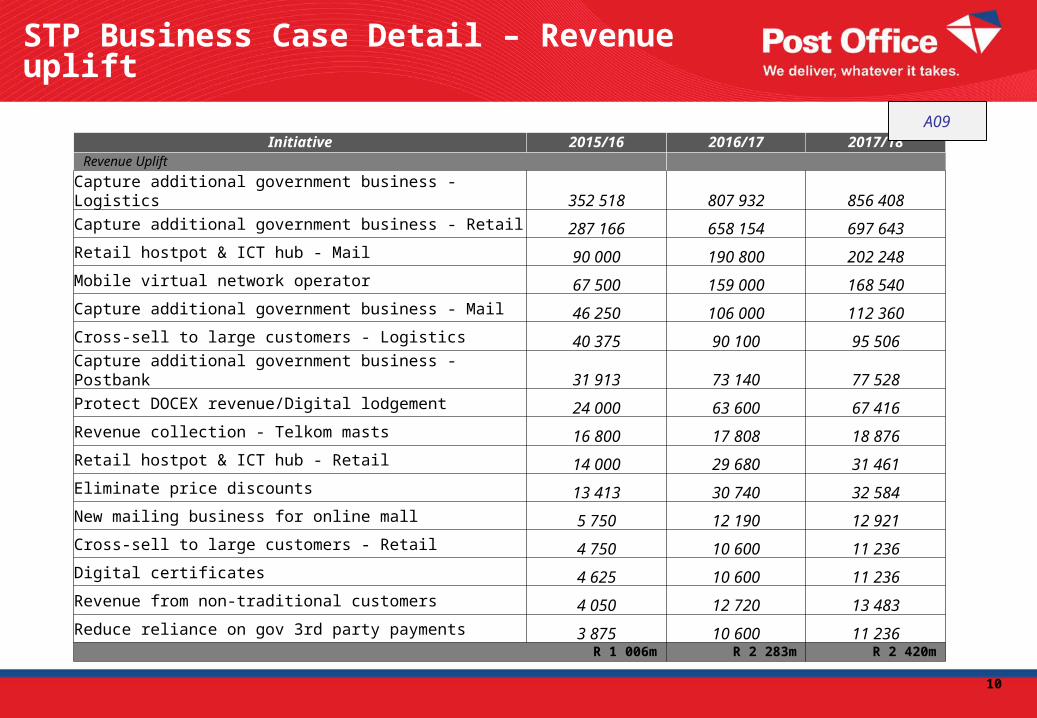
STP Business Case Detail – Revenue uplift
10
Initiative 2015/16 2016/17 2017/18Revenue Uplift
Capture additional government business - Logistics 352 518 807 932 856 408
Capture additional government business - Retail 287 166 658 154 697 643
Retail hostpot & ICT hub - Mail 90 000 190 800 202 248
Mobile virtual network operator 67 500 159 000 168 540
Capture additional government business - Mail 46 250 106 000 112 360
Cross-sell to large customers - Logistics 40 375 90 100 95 506
Capture additional government business - Postbank 31 913 73 140 77 528
Protect DOCEX revenue/Digital lodgement 24 000 63 600 67 416
Revenue collection - Telkom masts 16 800 17 808 18 876
Retail hostpot & ICT hub - Retail 14 000 29 680 31 461
Eliminate price discounts 13 413 30 740 32 584
New mailing business for online mall 5 750 12 190 12 921
Cross-sell to large customers - Retail 4 750 10 600 11 236
Digital certificates 4 625 10 600 11 236
Revenue from non-traditional customers 4 050 12 720 13 483
Reduce reliance on gov 3rd party payments 3 875 10 600 11 236 R 1 006m R 2 283m R 2 420m
A09
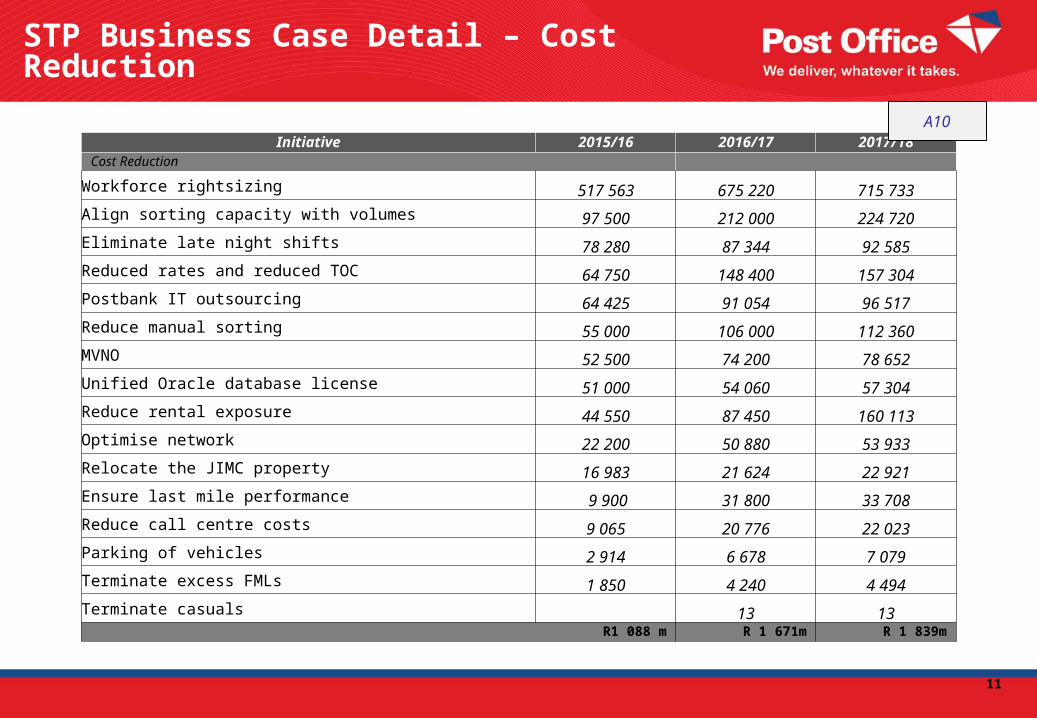
STP Business Case Detail – Cost Reduction
11
Initiative 2015/16 2016/17 2017/18Cost Reduction
Workforce rightsizing 517 563 675 220 715 733
Align sorting capacity with volumes 97 500 212 000 224 720
Eliminate late night shifts 78 280 87 344 92 585
Reduced rates and reduced TOC 64 750 148 400 157 304
Postbank IT outsourcing 64 425 91 054 96 517
Reduce manual sorting 55 000 106 000 112 360
MVNO 52 500 74 200 78 652
Unified Oracle database license 51 000 54 060 57 304
Reduce rental exposure 44 550 87 450 160 113
Optimise network 22 200 50 880 53 933
Relocate the JIMC property 16 983 21 624 22 921
Ensure last mile performance 9 900 31 800 33 708
Reduce call centre costs 9 065 20 776 22 023
Parking of vehicles 2 914 6 678 7 079
Terminate excess FMLs 1 850 4 240 4 494
Terminate casuals 13 13 R1 088 m R 1 671m R 1 839m
A10
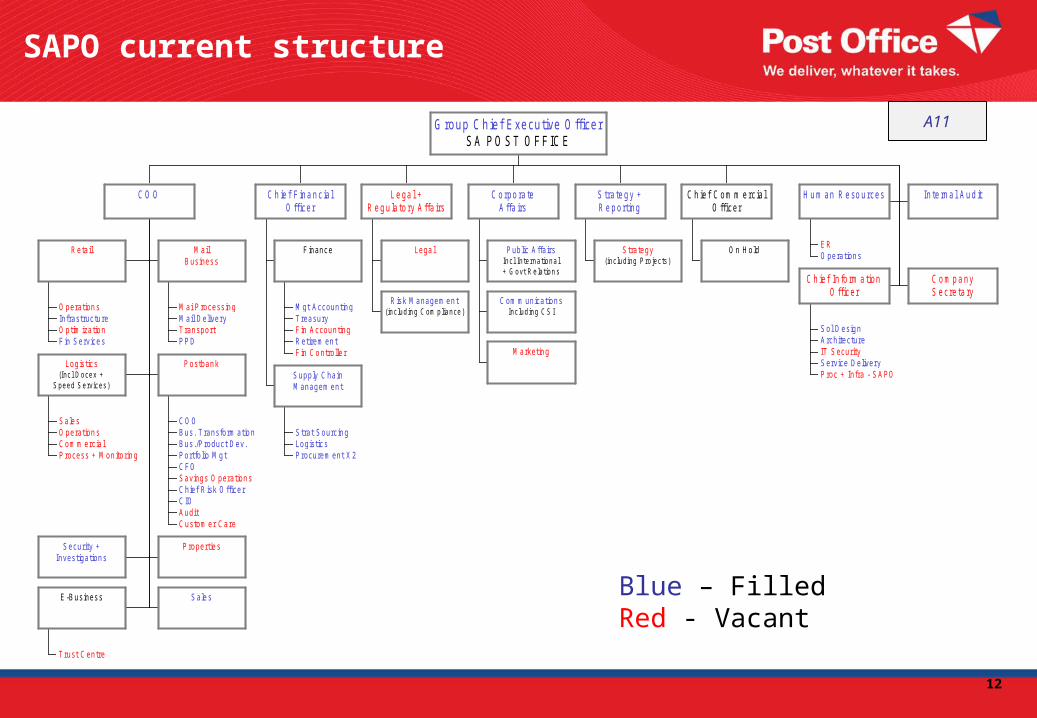
SAPO current structure
12
O peration sInfrastructureO ptim izationF in S ervice s
Retail
M ai P rocessin gM ail DeliveryT ranspor tP PD
M ailB usines s
S ale sO peration sCom m ercia lP rocess + M onitorin g
Logistic s(Inc l D ocex +
S peed S erv ices )
CO OB us. T ransform atio nB us./P roduct Dev.P ortfolio M g tCF OS avings O peration sChief R isk O ffice rC IOA uditCustom er Care
P ostban k
S ecurity +Investigation s
P ropertie s
T rust Centre
E -B usines s S ale s
C O O
M gt A ccountin gT reasuryF in A ccountin gRetirem en tF in Co ntrolle r
F inanc e
S trat S ourcin gLogistic sP rocurem ent X 2
S upply ChainM anagem en t
C h ie f F in a n c ia lO ffice r
Lega l
R isk M anagem en t(inc ludin g C om pliance )
L e ga l +R e g u la to ry A ffa irs
P ublic A ffairsInc l In ternationa l+ G ovt R elation s
Com m unication sInc luding C S I
M arketin g
C o rpo ra teA ffa irs
S trategy(inc luding P ro jects )
S tra te g y +R e p orting
O n Hold
C h ie f C om m e rc ia lO ffice r
E RO peration s
H u m an R e so u rces In te rn a l A u d it
S ol D esig nA rchitectureIT SecurityS ervice DeliveryP roc + Infra - S A PO
C h ie f In fo rm a tionO ffice r
C o m p a nyS e c re ta ry
G roup C hief Executive O fficerSA PO ST O FFIC E
Blue – FilledRed - Vacant
A11

PROPOSED POSITIONS TO BE REDUCED
13
BUSINESS AREAEmployee Numbers Potential Saving
OPERATIONS
Mail Operations - Reduction aligned to productivity and efficiency analysis 2650 325 655 971
Transport reduction aligned to transport optimisation 236 25 736 109
International Mail – reduction in ops. staff only 34 4 666 635
CFG – volume and efficiency aligned reduction 339 49 788 696
Speed Services – volume and efficiency aligned reduction 131 20 333 541
Closing of 8 Mail Processing Hubs 191 22 018 572
Closing of 652 Retail Branches over 5 years 1000 134 427 250
CORPORATE SUPPORT FUNCTIONS 160 51 231 510
- Supply Chain Management reduced by 8,3 % included above
IT – Outsource IT Support function 201 69 322 185
REGIONAL SUPPORT FUNCTIONS aligned to operational structure 96 24 307 864
SALES & CUSTOMER SERVICES 36 9 857 108
TOTAL 5065 R728 223 385
A12

COST TO FILL CRITICAL ROLES
14
BUSINESS AREA Cost
Executive positions
Chief Commercial Officer 1 800 000
Chief Technology officer 1 800 000
GE Legal and Regulatory 1 500 000
GE Strategy and Reporting 1 500 000
Regulatory Compliance positions
Senior Manager 756 530
Manager (2 Positions) 1 015 076
Compliance Analyst (3 positions) 750 450
Total R9 122 056
Net effect of changes
Reduction in staff numbers R728 223 385
Filling of critical vacancies -R9 122 056
Net saving R719 101 329
A13

End End End End
15
Top Related