


Languages
Pages
Legal


[Translation]
Name of Listed Company: MS&AD Insurance Group Holdings, Inc.
Stock Exchange Listing: Tokyo Stock Exchange and Nagoya Stock Exchange
Securities Code Number: 8725
URL: http://www.ms-ad-hd.com
Representative: Toshiaki Egashira, President
Contact: Noriyuki Horie, Manager, Consolidated Accounting Section, Accounting Department
Telephone: 03-6202-5273
Scheduled date to file the quarterly financial report: February 14, 2014
Scheduled date to commence dividend payments: -
Explanatory material for business results: Available
IR Conference (for institutional investors and analysts): To be held
(Note) Amounts of less than one million yen are truncated.
1. Consolidated Financial Highlights for the Nine Months Ended December 31, 2013 (April 1, 2013 to December 31, 2013)
(1) Consolidated business performance (Yen in millions)
Percent figures represent changes from the corresponding period of the preceding year.
(Note) Comprehensive income/(loss)
(Yen)
(2) Consolidated financial conditions (Yen in millions)
(Reference) Net assets less minority interests
2. Dividends (Yen)
(Note) Revision of the latest announced dividends per share forecast: None
3. Consolidated Earnings Forecasts for the Year Ending March 31, 2014 (April 1, 2013 to March 31, 2014)
(Yen in millions)
Percent figures represent changes from the preceding year.
(Note) Revision of the latest announced earnings forecasts: None
%For the nine months ended December 31, 2012:
For the nine months ended December 31, 2013: ¥ 495,654 million 198.3 %
237,100Nine months ended
3,292,620 6.8 %
SUMMARY OF FINANCIAL STATEMENTS
FOR THE NINE MONTHS ENDED DECEMBER 31, 2013
February 14, 2014
Ordinary income Ordinary profit/(loss) Net income/(loss)
69.1 %December 31, 2013
62.5 % 159,587
%December 31, 2012
- % 94,368 -
Nine months ended151.74 -
December 31, 2012
Nine months ended3,084,318 2.8 % 145,875
¥ 166,164 million -
Net income/(loss) per share
- Basic
Net income/(loss) per share
- Diluted
Nine months ended257.05 -
December 31, 2013
%
As of December 31, 2013: ¥ 2,424,882 million
Total assets Net assetsRatio of net assets less minority
interests to total assets
December 31, 2013 16,895,806 2,448,395 14.4 %
As of March 31, 2013: ¥ 1,999,579 million
March 31, 2013 15,914,663 2,021,625 12.6
Year ended March 31, 2013 - 27.00 - 27.00 54.00
Dividends per share
1st quarter 2nd quarter 3rd quarter 4th quarter Annual total
Year ending March 31, 201428.00 56.00
(Forecast)
Year ending March 31, 2014 - 28.00 -
% 201.41
Ordinary profit Net income Net income per share (Yen)
Year ending March 31, 2014 191,000 27.1 % 125,000 49.5
* Notes
(Note) For details, please refer to "(1) Adoption of special accounting methods allowed to be applied to quarterly consolidated financial statements"
on page 2 of the Appendix.
1. Changes in accounting policies due to revisions of accounting standards: None
2. Changes in accounting policies other than above: Yes
3. Changes in accounting estimates: None
4. Restatements: None
(Note) For details, please refer to "(2) Changes in accounting policies and accounting estimates and restatements" on page 2 of the Appendix.
(4) Number of shares of issued stock (common stock)
1. Number of shares of issued stock (including treasury stock)
2. Number of shares of treasury stock
3. Average number of shares of outstanding stock
This report is outside the scope of the external auditor's quarterly review process required by "Financial Instruments and Exchange Act" but the review
process for the quarterly financial statements under "Financial Instruments and Exchange Act" has been completed as of the disclosure date of the
report.
Any earnings forecasts in this report have been made based on the information available to the Company as of the disclosure date of the report and
certain assumptions, and therefore do not guarantee future performance. Actual results may differ substantially from these forecasts depending on
various factors. The forecast of ordinary income is not disclosed due to difficulties in calculating reasonable forecast figures because ordinary income
is highly susceptible to natural disasters and market conditions.
As of March 31, 2013: 633,291,754 shares
As of December 31, 2013: 13,376,754 shares
As of March 31, 2013: 11,403,482 shares
(1) Changes in significant subsidiaries during the period (changes in specified subsidiaries resulting in changes in scope of
consolidation): None
(2) Adoption of special accounting methods allowed to be applied to quarterly consolidated financial statements: Yes
(3) Changes in accounting policies and accounting estimates and restatements
As of December 31, 2013: 633,291,754 shares
For the nine months ended December 31, 2013: 620,830,690 shares
For the nine months ended December 31, 2012: 621,898,129 shares
* Disclosure regarding the execution of the quarterly review process
* Notes to the earnings forecasts

[Appendix]
Page
1. Qualitative Information on Business Results
(1) Explanation for business performance ・・・・・・・・・・・・・・・・・・・・・・・・・・・・・・・・・・・・・・・・・・・・・・・・・・・・・・・・・・・・・・・2
(2) Explanation for financial conditions ・・・・・・・・・・・・・・・・・・・・・・・・・・・・・・・・・・・・・・・・・・・・・・・・・・・・・・・・・・・・・・・・・・・・2
(3) Explanation for future forecast information including consolidated earnings forecasts ・・・・・・・・・・・・・・・・・・・・・・・・・・・・2
2. Notes to Summary of Financial Statements
(1) Adoption of special accounting methods allowed to be applied to quarterly consolidated
financial statements ・・・・・・・・・・・・・・・・・・・・・・・・・・・・・・・・・・・・・・・・・・・・・・・・・・・・・・・・・・・・・・2
(2) Changes in accounting policies and accounting estimates and restatements ・・・・・・・・・・・・・・・・・・・・・・・・・・・・・・・・・・・・・・・・・2
3. Consolidated Financial Statements
(1) Consolidated Balance Sheets ・・・・・・・・・・・・・・・・・・・・・・・・・・・・・・・・・・・・・・・・・・・・・・・・・・・・・・・・・・・・・・・・・・3
(2) Consolidated Statements of Income and Comprehensive Income ・・・・・・・・・・・・・・・・・・・・・・・・・・・・・・・・・・・・・・・・・・・・・・・・・・・・・・・・・・・・・・・・・・・・・・・・・・4
(3) Notes to Consolidated Financial Statements ・・・・・・・・・・・・・・・・・・・・・・・・・・・・・・・・・・・・・・・・・・・・・・・・・・・・・・・・・・・・・・・6
(Notes to Going Concern Assumptions) ・・・・・・・・・・・・・・・・・・・・・・・・・・・・・・・・・・・・・・・・・・・・・・・・・・・・・・・・・・・・・・・・・6
(Notes to Significant Changes in Shareholders' Equity) ・・・・・・・・・・・・・・・・・・・・・・・・・・・・・・・・・・・・・・・・・・・・・・・・・・・・・・6
Explanatory Material for Business Results
1. Summary of Consolidated Business Results ・・・・・・・・・・・・・・・・・・・・・・・・・・・・・・・・・・・・・・・・・ 7
2. Non-Consolidated Business Results of Mitsui Sumitomo Insurance Co., Ltd. ・・・・・・・・・・・・・・・・・・・・・・・・・・・・・・・・・・・・・・・・・10
3. Non-Consolidated Business Results of Aioi Nissay Dowa Insurance Co., Ltd. ・・・・・・・・・・・・・・・・・・・・・・・・・・・・・・・・・・・・・・・・・14
4. Supplementary Information
(1) Supplementary Information on Consolidated Business Results ・・・・・・・・・・・・・・・・・・・・・・・・・・・・・・・・・・・・・・・18
(2) Summary of Business Results of Main Consolidated Subsidiaries ・・・・・・・・・・・・・・・・・・・・・・・・・・・・・・・20
Contents
1

1. Qualitative Information on Business Results
(1)
(2)
(3)
2. Notes to Summary of Financial Statements
(1)
(2)
Explanation for financial conditions
Explanation for business performance
Although there still remains a domestic economic downside risk posed by uncertainties over the global economy, the
Japanese economy has been on a gradual recovery trend during the nine months ended December 31, 2013 with an
improvement in corporate earnings, a pickup in capital expenditures and a growth in consumer spending.
In this business environment, the business performances of the Group for the nine months ended December 31, 2013
were as follows.
Underwriting income was ¥2,694.3 billion (of which net premiums written were ¥2,105.4 billion), investment income
was ¥591.4 billion and other ordinary income was ¥6.8 billion, resulting in total ordinary income of ¥3,292.6 billion.
Ordinary expenses amounted to ¥3,055.5 billion. This breaks down into underwriting expenses of ¥2,611.7 billion (of
which net claims paid were ¥1,245.9 billion), investment expenses of ¥27.6 billion, operating expenses and general
and administrative expenses of ¥397.5 billion and other ordinary expenses of ¥18.5 billion.
As a result, the Company posted an ordinary profit of ¥237.1 billion, marking an increase of ¥91.2 billion from the
same period last year when a large number of impairment losses on securities were posted. After factoring in
extraordinary income and losses, income taxes and other factors, net income of ¥159.5 billion was reported with an
increase of ¥65.2 billion year on year.
As "Accounting Standard for Retirement Benefits" (ASBJ Statement No. 26, May 17, 2012, hereinafter referred to as
the "Retirement Benefits Accounting Standard") and "Guidance on Accounting Standard for Retirement Benefits"
(ASBJ Guidance No. 25, May 17, 2012, hereinafter referred to as the "Guidance on Retirement Benefits") became
applicable from the start of the consolidated fiscal year commencing on or after April 1, 2013, the Company has
adopted them since the first quarter of the current consolidated fiscal year (subject to the provisions set forth in Clause
35 of the Retirement Benefits Accounting Standard and Clause 67 of the Guidance on Retirement Benefits) and made
changes in the method of attributing expected benefit to periods from the straight-line basis to the benefit formula
basis after reviewing the calculation methods of retirement benefit obligations and service costs.
In accordance with the transitional accounting treatments set forth in Clause 37 of the Retirement Benefits
Accounting Standard, the Company has made adjustments to the beginning balance of the retained earnings for the
nine months ended December 31, 2013 by factoring in the effects arising from the changes in the calculation methods
of retirement benefit obligations and service costs.
As a result, the beginning balance of the retained earnings for the nine months ended December 31, 2013 decreased
by ¥30,261 million, and both ordinary profit and income before income taxes and minority interests for the nine
months ended December 31, 2013 increased by ¥232 million.
As of December 31, 2013, total assets stood at ¥16,895.8 billion with an increase of ¥981.1 billion from March 31,
2013 mainly due to an increase in investments in securities stemming from a rise in stock prices, and net assets stood
at ¥2,448.3 billion with an increase of ¥426.7 billion from March 31, 2013 mainly due to an increase in net unrealized
gains on investments in securities.
Explanation for future forecast information including consolidated earnings forecasts
The Company keeps the previously announced forecasts of ordinary profit of ¥191.0 billion and net income of ¥125.0
billion for the year ending March 31, 2014 unchanged.
(Changes in accounting policies)
Adoption of special accounting methods allowed to be applied to quarterly consolidated financial
statements
(Calculation of income tax expenses)
The domestic consolidated companies calculate income tax expenses mainly by multiplying income before income
taxes by the effective income tax rate, after adding or deducting the permanent difference if this amount is significant.
Changes in accounting policies and accounting estimates and restatements
2

3. Consolidated Financial Statements
(1) Consolidated Balance Sheets(Yen in millions)
March 31, 2013 December 31, 2013
Assets
Cash, deposits and savings 536,383 510,801
Call loans 99,709 113,673
Receivables under resale agreements 48,545 87,334
Receivables under securities borrowing transactions 224,025 210,981
Monetary claims bought 93,013 142,989
Money trusts 898,510 680,484
Investments in securities 11,398,945 12,674,742
Loans 867,063 817,480
Tangible fixed assets 488,069 484,190
Intangible fixed assets 177,693 181,223
Other assets 919,857 863,884
Deferred tax assets 132,741 96,237
Customers' liabilities under acceptances and guarantees 39,500 47,500
Bad debt reserve (9,394) (15,717)
Total assets 15,914,663 16,895,806
Liabilities
Policy liabilities: 12,544,284 12,894,155
Outstanding claims 1,384,650 1,395,312
Underwriting reserves 11,159,633 11,498,842
Bonds issued 291,176 291,183
Other liabilities 790,243 867,365
Reserve for pension and retirement benefits 111,130 163,502
Reserve for retirement benefits for officers 1,316 1,152
Accrued bonuses for employees 20,234 2,067
Reserves under the special laws: 33,953 38,391
Reserve for price fluctuation 33,953 38,391
Deferred tax liabilities 61,197 142,091
Acceptances and guarantees 39,500 47,500
Total liabilities 13,893,038 14,447,411
Net assets
Shareholders' equity:
Common stock 100,000 100,000
Capital surplus 682,752 682,752
Retained earnings 353,506 451,454
Treasury stock (24,823) (29,887)
Total shareholders' equity 1,111,435 1,204,319
Accumulated other comprehensive income/(loss):
Net unrealized gains/(losses) on investments in securities 891,253 1,195,434
Net deferred gains/(losses) on hedges 26,428 20,580
Foreign currency translation adjustments (29,539) 4,547
Total accumulated other comprehensive income/(loss) 888,143 1,220,563
Minority interests 22,046 23,512
Total net assets 2,021,625 2,448,395
Total liabilities and net assets 15,914,663 16,895,806
3

(2) Consolidated Statements of Income and Comprehensive Income
(2 (Consolidated Statements of Income)(Yen in millions)
Ordinary income: 3,084,318 3,292,620
Underwriting income: 2,705,984 2,694,391
Net premiums written 1,976,298 2,105,487
Deposit premiums from policyholders 129,456 117,982
Investment income on deposit premiums from policyholders 42,433 39,539
Life insurance premiums 489,418 408,070
Reversal of outstanding claims 58,861 15,308
Investment income: 373,163 591,412
Interest and dividends income 148,410 167,293
Investment gains on money trusts 97,439 20,917
Gains on sales of securities 42,121 55,505
Gains on derivative transactions 3,248 3,646
Investment gains on separate accounts 121,570 373,183
Transfer of investment income on deposit premiums from policyholders (42,433) (39,539)
Other ordinary income 5,170 6,815
Ordinary expenses: 2,938,443 3,055,519
Underwriting expenses: 2,476,838 2,611,764
Net claims paid 1,303,454 1,245,984
Loss adjustment expenses 100,854 106,352
Commissions and collection expenses 382,123 413,616
Maturity refunds to policyholders 307,277 252,466
Life insurance claims 152,623 259,737
Provision for underwriting reserves 226,450 329,489
Investment expenses: 78,279 27,649
Investment losses on money trusts 36 15,163
Losses on sales of securities 7,696 3,593
Impairment losses on securities 61,324 3,907
Operating expenses and general and administrative expenses 371,871 397,594
Other ordinary expenses: 11,949 18,510
Interest expense 5,894 6,186
Deferred expenses under Article 113 of the Insurance Business Act (496) -
Ordinary profit/(loss) 145,875 237,100
Extraordinary income: 1,486 2,053
Gains on sales of fixed assets 1,213 2,053
Reversal of reserves under the special law: 272 -
Reversal of reserve for price fluctuation 272 -
Extraordinary losses: 3,489 7,676
Losses on sales of fixed assets 2,459 2,766
Impairment losses on fixed assets 1,030 471
Provision for reserves under the special law: - 4,437
Provision for reserve for price fluctuation - 4,437
Income/(loss) before income taxes and minority interests 143,872 231,477
Income taxes 48,305 70,286
Income/(loss) before minority interests 95,567 161,191
Minority interests 1,198 1,604
Net income/(loss) 94,368 159,587
Nine months ended
December 31, 2012
Nine months ended
December 31, 2013
4

(Consolidated Statements of Comprehensive Income)(Yen in millions)
Income/(loss) before minority interests 95,567 161,191
Other comprehensive income/(loss):
Net unrealized gains/(losses) on investments in securities 60,571 304,219
Net deferred gains/(losses) on hedges 4,034 (5,848)
Foreign currency translation adjustments 6,372 37,079
Share of other comprehensive income/(loss) of equity method investments (382) (988)
Total other comprehensive income/(loss) 70,596 334,462
Total comprehensive income/(loss) 166,164 495,654
Allocation:
Comprehensive income/(loss) attributable to shareholders of the parent 164,908 493,021
Comprehensive income/(loss) attributable to minority interests 1,255 2,632
Nine months ended
December 31, 2012
Nine months ended
December 31, 2013
5

(3) Notes to Consolidated Financial Statements
(Notes to Going Concern Assumptions)
Not applicable.
(Notes to Significant Changes in Shareholders' Equity)
Not applicable.
6

Explanatory Material for Business Results
1. Summary of Consolidated Business Results
(1) Consolidated Business Performance
(Yen in 100 millions)
1 27,065 26,929 (136) (0.5)
2 19,768 21,040 1,271 6.4
3 1,294 1,179 (114) (8.9)
4 4,894 4,080 (813) (16.6)
5 588 153 (435) (74.0)
6 24,774 26,103 1,328 5.4
7 13,034 12,459 (574) (4.4)
8 1,008 1,063 54 5.5
9 3,821 4,136 314 8.2
10 3,072 2,524 (548) (17.8)
11 1,526 2,597 1,071 70.2
12 2,270 3,280 1,009 44.5
13 3,731 5,914 2,182 58.5
14 1,484 1,672 188 12.7
15 974 209 (765) (78.5)
16 421 555 133 31.8
17 32 36 3 12.3
18 1,215 3,731 2,516 207.0
19 782 276 (506) (64.7)
20 0 151 151 41,530.5
21 76 35 (41) (53.3)
22 613 39 (574) (93.6)
23 3,718 3,975 257 6.9
24 (67) (116) (49) -
25 (26) (37) (10) -
26 (4) - 4 -
27 1,458 2,371 912 62.5
28 14 20 5 38.1
29 34 76 41 120.0
30 (20) (56) (36) -
31 1,438 2,314 876 60.9
32 483 702 219 45.5
33 955 1,611 656 68.7
34 11 16 4 33.8
35 943 1,595 652 69.1
(Note) The figures in the above table are presented exclusive of Good Result Return premiums of Mitsui Sumitomo Insurance's proprietary automobile
insurance product "ModoRich", which contains a special clause related to premium adjustment and refund at maturity.
Income taxes
Income/(loss) before minority interests
Minority interests
Net income/(loss)
Extraordinary income and losses
Income/(loss) before income taxes and minority interests
Extraordinary losses
Ordinary profit/(loss)
Extraordinary income and losses:
Extraordinary income
Gains/(losses) on equity method investments
Deferred expenses under Article 113 of the Insurance
Business Act
Investment income:
Gains on sales of securities
Other ordinary income and expenses:
Investment gains on separate accounts
Investment expenses:
Interest and dividends income
Investment gains on money trusts
Gains on derivative transactions
Investment losses on money trusts
Losses on sales of securities
Impairment losses on securities
Operating expenses and general and administrative
expenses
Underwriting expenses:
Life insurance claims
Change ratio
(%)
Life insurance premiums
Reversal of outstanding claims
Ordinary income and expenses:
Underwriting income:
Net premiums written
Deposit premiums from policyholders
ItemsNine months ended
December 31, 2012 December 31, 2013Change
Nine months ended
Provision for underwriting reserves
Net claims paid
Loss adjustment expenses
Commission and collection expenses
Maturity refunds to policyholders
7

(2) Breakdown of Results by Company (Net Premiums Written, Ordinary Profit and Net Income)
(Yen in 100 millions)
1 19,768 21,040 1,271 6.4
2 9,801 10,309 508 5.2
3 8,295 8,619 324 3.9
4 257 259 1 0.6
5 1,412 1,825 412 29.2
6 1,458 2,371 912 62.5
7 851 1,242 390 45.8
8 274 598 324 118.4
9 943 1,595 652 69.1
10 605 878 273 45.2
11 147 413 265 180.0
12 4 1 (3) (77.1)
13 20 54 34 169.9
14 185 228 42 23.0
15 118 193 74 63.2
16 0 19 19 4,265.6
17 (138) (192) (53) -
(Notes)
(3) Breakdown of Results of Overseas Insurance Subsidiaries by Region
(Yen in 100 millions)
1 1,412 1,825 412 29.2
2 690 892 201 29.3
3 374 508 134 35.9
4 207 270 62 30.3
5 140 153 13 9.3
6 118 193 74 63.2
7 64 76 12 19.8
8 6 40 33 488.1
9 5 12 6 117.7
10 41 63 22 53.2
Europe
Americas
Reinsurance
Americas
Reinsurance
Net income/(loss)
Asia
Net premiums written
Asia
Europe
Consolidation adjustments and holding company
December 31, 2012
1. The figures in the above table are presented exclusive of Good Result Return premiums of Mitsui Sumitomo Insurance's proprietary
automobile insurance product "ModoRich", which contains a special clause related to premium adjustment and refund at maturity.
2. Items 10 to 16 represent the net income or loss on a non-consolidated basis with taking into account the Company’s ownership interests in
its subsidiaries.
December 31, 2013Items
Nine months ended Nine months endedChange
Change ratio
(%)
Overseas insurance subsidiaries
Others
Net income/(loss)
Mitsui Sumitomo Insurance
Aioi Nissay Dowa Insurance
Mitsui Direct General Insurance
Net premiums written Note 1
Mitsui Sumitomo Insurance Note 1
Aioi Nissay Dowa Insurance
Mitsui Direct General Insurance
Mitsui Sumitomo Primary Life Insurance
Ordinary profit/(loss)
Mitsui Sumitomo Insurance
Mitsui Sumitomo Aioi Life Insurance
Overseas insurance subsidiaries
Aioi Nissay Dowa Insurance
December 31, 2012 December 31, 2013
Nine months ended Nine months endedChange
Change ratio
(%)Items
8

(4) Summary of Results of Domestic Life Insurance Business
(Yen in 100 millions)
Amount of new policies
Mitsui Sumitomo Aioi
Life Insurance1 26,370 20,120 (6,249) (23.7) 37,105
Mitsui Sumitomo Primary
Life Insurance2 3,316 5,485 2,168 65.4 4,322
Amount of policies in force
Mitsui Sumitomo Aioi
Life Insurance3 194,098 208,455 7,709 3.8 200,746
Mitsui Sumitomo Primary
Life Insurance4 34,228 39,367 2,752 7.5 36,614
Mitsui Sumitomo Aioi
Life Insurance5 3,092 3,309 112 3.5 3,197
Mitsui Sumitomo Primary
Life Insurance6 4,493 4,364 22 0.5 4,342
(Note) The figures in the above table represent the total sum of individual insurance and individual annuities.
Year ended
March 31, 2013
Annualized premiums for
policies in force
Items ChangeChange ratio
(%)December 31, 2012 December 31, 2013
Nine months ended Nine months ended
9

2. Non-Consolidated Business Results of Mitsui Sumitomo Insurance Co., Ltd.
The figures in the tables below are presented exclusive of Good Result Return premiums of Mitsui Sumitomo Insurance's proprietary
automobile insurance product "ModoRich", which contains a special clause related to premium adjustment and refund at maturity.
(1) Business Performance(Yen in 100 millions)
Items
%
(+) Net premiums written 1 9,801 10,309 508 5.2
(-) Net claims paid 2 6,620 6,181 (438) (6.6)
(-) Loss adjustment expenses 3 563 594 31 5.5
(-) Commissions and collection expenses 4 1,712 1,785 73 4.3
(-) 5 1,452 1,487 35 2.4
6 (547) 260 807 -
(-) Movement in outstanding claims 7 (490) (143) 347 -
(-) Movement in ordinary underwriting reserves 8 (11) 149 160 -
(-) Movement in catastrophe reserve 9 (552) (78) 473 -
(+) Other 10 84 38 (45) (53.9)
Underwriting profit/(loss) 11 591 371 (220) (37.2)
(+) Interest and dividends income 12 777 902 125 16.2
(-) 13 333 310 (23) (7.0)
14 443 592 149 33.6
(+) Gains/(losses) on sales of securities 15 256 335 78 30.8
(-) Impairment losses on securities 16 348 15 (333) (95.7)
(+) Gains/(losses) on derivative transactions 17 66 93 26 39.3
(+) Other 18 (92) (19) 72 -
Investment profit/(loss) 19 326 986 660 202.2
(+) Other ordinary profit/(loss) 20 (66) (115) (49) -
Ordinary profit/(loss) 21 851 1,242 390 45.8
(+) Extraordinary income/(loss): 22 1 (25) (27) (1,520.2)
Reserve for price fluctuation 23 7 (19) (26) (353.5)
24 853 1,216 363 42.5
(-) Income taxes 25 248 338 89 36.1
Net income/(loss) 26 605 878 273 45.2
Net loss ratio 27 73.3 % 65.7 % (7.6) %
Ratios Net expense ratio 28 32.3 % 31.8 % (0.5) %
Combined ratio 29 105.6 % 97.5 % (8.1) %
(Notes) 1. Net loss ratio = (net claims paid + loss adjustment expenses) / net premiums written x 100
2. Net expense ratio = (commissions and collection expenses + operating expenses and general and administrative expenses for underwriting)
/ net premiums written x 100
3. Combined ratio = net loss ratio + net expense ratio
(Reference) Business performance excluding residential earthquake insurance and CALI*
Net premiums written 30 8,612 9,014 401 4.7
Net loss ratio 31 70.4 % 62.7 % (7.7) %
Ratios Net expense ratio 32 34.0 % 33.7 % (0.3) %
Combined ratio 33 104.4 % 96.4 % (8.0) %
* CALI stands for compulsory automobile liability insurance, and the same hereinafter.
Change ratio
Underwriting profit/(loss) before
movements in reserves
Transfer of investment income on deposit
premiums from policyholders
Net interest and dividends income
(item 12 - item 13)
Income/(loss) before income taxes
Operating expenses and general and
administrative expenses for underwriting
Nine months ended
December 31, 2012
Nine months ended
December 31, 2013Change
10

Mitsui Sumitomo Insurance Co., Ltd. (Non-consolidated)
(2) Premiums written(Yen in 100 millions)
Net premiums written Direct premiums written (excluding deposit premiums from policyholders)
Amount Change ratio Amount Change ratio Amount Change ratio
% % % %
1,335 (0.2) 13.7 8.0 8.5
400 0.4 7.8 1.6 11.7
1,058 2.7 0.9 2.7 1.4
4,433 3.7 2.9 3.9 2.9
1,180 9.4 9.2 4.8 12.3
1,393 3.4 3.3 4.5 5.7
9,801 3.5 5.2 4.5 5.6
(3) Net claims paid(Yen in 100 millions)
Nine months ended December 31, 2012
Amount Change ratio Net loss ratio
% %
1,449 (28.2) 111.0 73.2 (37.8)
201 (12.8) 53.9 58.8 4.9
572 0.9 60.4 62.7 2.3
2,706 (2.9) 68.2 64.0 (4.2)
1,030 (0.6) 95.2 87.0 (8.2)
659 (0.2) 50.3 48.4 (1.9)
6,620 (9.3) 73.3 65.7 (7.6)
(Note) Net loss ratio = (net claims paid + loss adjustment expenses) / net premiums written x 100
(Reference) Incurred losses caused by natural disasters in Japan (Yen in 100 millions)
Nine months ended December 31, 2012 Nine months ended December 31, 2013
Net claims paid Net claims paid
239 210 29 169 59
33 31 1 27 0
23 12 11 22 13
296 254 42 219 74
(Reference) Incurred losses caused by flooding in Thailand (Yen in 100 millions)
Nine months ended December 31, 2012 Nine months ended December 31, 2013
Net claims paid Net claims paid
(89) 517 (606) (148) (420)
(4) Expenses<Company expenses> (Yen in 100 millions)
Amount Change Change ratio Amount Change Change ratio
% %
Personnel expenses 1 1,176 (14) (1.2) (0.5)
Non-personnel expenses 2 812 (0) (0.0) 9.2
Taxes and contributions 3 93 (1) (1.8) 3.8
Total 4 2,083 (16) (0.8) 3.5
(Note) Total = loss adjustment expenses + operating expenses and general and administrative expenses
<Expenses for underwriting> (Yen in 100 millions)
Amount Change Change ratio Amount Change Change ratio
% %
Operating expenses and general
and administrative expenses5 1,452 (20) (1.4) 2.4
Commissions and
collection expenses6 1,712 51 3.1 4.3
Total 7 3,164 30 1.0 3.4
Net expense ratio 8 32.3 % (0.8) % 31.8 % %
1,785 73
3,273 108
(0.5)
2,155 72
ItemsNine months ended December 31, 2012 Nine months ended December 31, 2013
1,487 35
1,170 (6)
887 74
97 3
Incurred losses 271
(Notes) 1. Movement in outstanding claims represents provision as a positive number and reversal as a negative number.
2. Incurred losses include influence of exchange rate fluctuations.
ItemsNine months ended December 31, 2012 Nine months ended December 31, 2013
(Note) The above table represents incurred losses caused by natural disasters in Japan during the period.
Net claims paid including claims in previous years (excluding claims relating to the Great East Japan Earthquake) are ¥29.1 billion
(¥24.1 billion in Fire and allied, ¥3.2 billion in Voluntary automobile and ¥1.7 billion in Other) during the nine months ended
December 31, 2012 and ¥17.5 billion (¥13.0 billion in Fire and allied, ¥2.8 billion in Voluntary automobile and ¥1.6 billion in Other)
during the nine months ended December 31, 2013.
Incurred losses Incurred lossesMovement in
outstanding
claims
Movement in
outstanding
claims
Voluntary automobile 26
Other 9
Total 145
Incurred losses Incurred lossesMovement in
outstanding
claims
Movement in
outstanding
claims
Fire and allied 109
Other 654 (0.7)
Total 6,181 (6.6)
Voluntary automobile 2,590 (4.3)
CALI 1,022 (0.8)
Marine 239 18.8
Personal accident 596 4.1
% % %
Fire and allied 1,077 (25.7)
Nine months ended December 31, 2013
Amount Change ratio Net loss ratio Change
Other 1,439 1,508 1,594
Total 10,309 10,604 11,196
Voluntary automobile 4,561 4,452 4,581
CALI 1,289 1,134 1,274
Marine 431 522 583
Personal accident 1,068 1,108 1,123
Fire and allied 1,518 1,878 2,038
Nine months ended
December 31, 2012
Nine months ended
December 31, 2013
Nine months ended
December 31, 2012
Nine months ended
December 31, 2013
Amount Change ratio
11

Mitsui Sumitomo Insurance Co., Ltd. (Non-consolidated)
(5) Catastrophe reserve(Yen in 100 millions)
% %
1,110 59.4 211 136 1,036 51.4
667 124.4 - 19 687 119.4
650 45.5 72 33 611 43.0
189 3.2 189 146 146 2.4
1,388 76.3 19 78 1,446 75.4
4,006 34.7 492 413 3,928 32.7
(6) Investment assets
(Yen in 100 millions)
Domestic bonds
Stock
Foreign securities
Other securities
(Reference)
(7) Breakdown of interest and dividends income(Yen in 100 millions)
Domestic bonds
Stock
Foreign securities
Other securities
Other 39 21 (18)
Total 777 902 125
Loans 76 65 (11)
Land and buildings 40 47 7
113 212 98
18 33 15
196 185 (10)
292 337 45
Nine months ended
December 31, 2012
Nine months ended
December 31, 2013 Change
Investments in securities 620 768 148
Total 53,172 58,078 4,906
Long-term investment assets 16,257 15,594 (662)
Loans 5,760 5,488 (272)
Land and buildings 2,230 2,270 39
7,388 7,991 602
232 198 (33)
17,151 17,671 520
16,406 19,869 3,462
Cash, deposits and savings 4,001 4,590 588
Investments in securities 41,179 45,730 4,550
(Note) Reserve ratio = catastrophe reserve / net premiums written (excluding premiums of residential earthquake insurance and CALI and Good Result Return premiums of the automobile insurance product "ModoRich") x 100 The calculation for the reserve ratio as of December 31, 2013 has been made using four thirds of the net premiums written for the nine months ended December 31, 2013 as a denominator.
March 31, 2013 December 31, 2013Change
Fire and allied
Marine
Personal accident
Voluntary automobile
Other
Total
March 31, 2013 December 31, 2013
Balance Reversal Provision BalanceReserve ratio Reserve ratio
12

Mitsui Sumitomo Insurance Co., Ltd. (Non-consolidated)
(8) Investments in securities
Unrealized gains and losses on investments in securities(Yen in 100 millions)
16,877 17,671 793 (311)
6,983 19,246 12,262 3,685
2,893 3,117 224 31
1,523 1,588 64 (11)
28,278 41,623 13,345 3,393
(Yen in 100 millions)
16,045 17,151 1,105
7,124 15,701 8,576
2,388 2,581 193
1,071 1,147 76
26,631 36,582 9,951
(Notes)
Gains and losses on sales of securities(Yen in 100 millions)
15 28 33 4
241 301 301 0
(0) 5 10 5
- (0) - 0
256 335 345 10
Impairment losses on securities(Yen in 100 millions)
0 - (0)
346 6 (339)
1 4 3
0 4 4
348 15 (333)
Losses
Domestic bonds
Total
Foreign securities
Other securities
Total
Change
Domestic bonds
Stock
Foreign securities
Other securities
Nine months ended
December 31, 2012
Nine months ended
December 31, 2013
Stock
Gains/(losses)
Change from
March 31, 2013
Other securities
Stock
Foreign securities
Other securities
Total
March 31, 2013 Fair value Difference
Domestic bonds
Stock
Foreign securities
Cost
Domestic bonds
December 31, 2013 Cost Fair value Difference
Gains/(losses) Gains
Total
1. The above tables describe available-for-sale securities with practically determinable fair value.
2. "Other securities" includes certificates of deposits included in Cash, deposits and savings and loan receivable trust
beneficiary certificates and commercial papers included in Monetary claims bought on the balance sheets.
Nine months ended
December 31, 2012
Nine months ended
December 31, 2013
13

3. Non-Consolidated Business Results of Aioi Nissay Dowa Insurance Co., Ltd.
(1) Business Performance(Yen in 100 millions)
Items
%
(+) Net premiums written 1 8,295 8,619 324 3.9
(-) Net claims paid 2 5,478 5,165 (312) (5.7)
(-) Loss adjustment expenses 3 387 394 6 1.7
(-) Commissions and collection expenses 4 1,480 1,552 71 4.9
(-) 5 1,328 1,395 67 5.1
6 (380) 111 491 -
(-) Movement in outstanding claims 7 (127) 40 167 -
(-) Movement in ordinary underwriting reserves 8 (145) 5 151 -
(-) Movement in catastrophe reserve 9 (279) (20) 258 -
(+) Other 10 52 56 3 7.4
Underwriting profit/(loss) 11 224 142 (82) (36.5)
(+) Interest and dividends income 12 450 505 55 12.2
(-) 13 153 145 (8) (5.4)
14 297 360 63 21.3
(+) Gains/(losses) on sales of securities 15 70 159 88 124.5
(-) Impairment losses on securities 16 163 22 (141) (86.6)
(+) Gains/(losses) on derivative transactions 17 (18) (8) 9 -
(+) Other 18 (128) (52) 76 -
Investment profit/(loss) 19 56 436 379 667.2
(+) Other ordinary profit/(loss) 20 (7) 19 26 -
Ordinary profit/(loss) 21 274 598 324 118.4
(+) Extraordinary income/(loss): 22 (11) (10) 0 -
Reserve for price fluctuation 23 4 (12) (17) (349.5)
24 262 588 325 124.0
(-) Income taxes 25 114 174 59 52.0
Net income/(loss) 26 147 413 265 180.0
Net loss ratio 27 70.7 % 64.5 % (6.2) %
Ratios Net expense ratio 28 33.9 % 34.2 % 0.3 %
Combined ratio 29 104.6 % 98.7 % (5.9) %
(Notes) 1. Net loss ratio = (net claims paid + loss adjustment expenses) / net premiums written x 100
2. Net expense ratio = (commissions and collection expenses + operating expenses and general and administrative expenses for underwriting)
/ net premiums written x 100
3. Combined ratio = net loss ratio + net expense ratio
(Reference) Business performance excluding residential earthquake insurance and CALI
Net premiums written 30 7,142 7,392 250 3.5
Net loss ratio 31 67.3 % 61.1 % (6.2) %
Ratios Net expense ratio 32 35.4 % 36.1 % 0.7 %
Combined ratio 33 102.7 % 97.2 % (5.5) %
Change ratio
Underwriting profit/(loss) before
movements in reserves
Transfer of investment income on deposit
premiums from policyholders
Net interest and dividends income
(item 12 - item 13)
Income/(loss) before income taxes
Operating expenses and general and
administrative expenses for underwriting
Nine months ended
December 31, 2012
Nine months ended
December 31, 2013Change
14

Aioi Nissay Dowa Insurance Co., Ltd. (Non-consolidated)
(2) Premiums written(Yen in 100 millions)
Net premiums written Direct premiums written (excluding deposit premiums from policyholders)
Amount Change ratio Amount Change ratio Amount Change ratio
% % % %
935 4.8 6.7 7.3 5.5
70 9.1 17.6 1.7 5.3
553 (0.4) 1.4 (0.8) 0.6
4,839 2.0 2.7 2.1 1.9
1,147 6.8 6.6 2.3 10.6
749 0.0 5.0 (4.4) (1.9)
8,295 2.6 3.9 2.0 3.2
(3) Net claims paid(Yen in 100 millions)
Nine months ended December 31, 2012
Amount Change ratio Net loss ratio
% %
772 (44.1) 85.0 63.1 (21.9)
37 8.2 55.5 53.6 (1.9)
263 (2.5) 50.9 48.9 (2.0)
2,986 (2.1) 66.6 63.0 (3.6)
972 (0.1) 92.1 85.3 (6.8)
445 (8.9) 62.4 55.7 (6.7)
5,478 (11.7) 70.7 64.5 (6.2)
(Note) Net loss ratio = (net claims paid + loss adjustment expenses) / net premiums written x 100
(Reference) Incurred losses caused by natural disasters in Japan (Yen in 100 millions)
Nine months ended December 31, 2012 Nine months ended December 31, 2013
Net claims paid Net claims paid
177 160 16 103 21
34 33 1 27 0
7 5 1 7 4
219 199 19 139 26
(Reference) Incurred losses caused by flooding in Thailand (Yen in 100 millions)
Nine months ended December 31, 2012 Nine months ended December 31, 2013
Net claims paid Net claims paid
(23) 61 (84) (18) (49)
(4) Expenses<Company expenses> (Yen in 100 millions)
Amount Change Change ratio Amount Change Change ratio
% %
Personnel expenses 1 909 (48) (5.0) 913 0.5
Non-personnel expenses 2 779 (47) (5.8) 843 8.3
Taxes and contributions 3 82 (3) (4.0) 86 4.4
Total 4 1,771 (99) (5.3) 1,843 4.1
(Note) Total = loss adjustment expenses + operating expenses and general and administrative expenses
<Expenses for underwriting> (Yen in 100 millions)
Amount Change Change ratio Amount Change Change ratio
% %
Operating expenses and general
and administrative expenses5 1,328 (84) (6.0) 1,395 5.1
Commissions and
collection expenses6 1,480 41 2.9 1,552 4.9
Total 7 2,809 (42) (1.5) 2,948 5.0
Net expense ratio 8 33.9 % (1.4) % 34.2 % %
67
71
139
0.3
4
64
3
72
ItemsNine months ended December 31, 2012 Nine months ended December 31, 2013
Incurred losses 31
(Notes) 1. Movement in outstanding claims represents provision as a positive number and reversal as a negative number.
2. Incurred losses include influence of exchange rate fluctuations.
ItemsNine months ended December 31, 2012 Nine months ended December 31, 2013
(Note) The above table represents incurred losses caused by natural disasters in Japan during the period.
Net claims paid including claims in previous years (excluding claims relating to the Great East Japan Earthquake) are ¥21.6 billion
(¥17.5 billion in Fire and allied, ¥3.3 billion in Voluntary automobile and ¥0.7 billion in Other) during the nine months ended
December 31, 2012 and ¥12.4 billion (¥9.2 billion in Fire and allied, ¥2.8 billion in Voluntary automobile and ¥0.4 billion in Other)
during the nine months ended December 31, 2013.
Incurred losses Incurred lossesMovement in
outstanding
claims
Movement in
outstanding
claims
Voluntary automobile 26
Other 3
Total 112
Incurred losses Incurred lossesMovement in
outstanding
claims
Movement in
outstanding
claims
Fire and allied 82
Other 414 (6.9)
Total 5,165 (5.7)
Voluntary automobile 2,888 (3.3)
CALI 956 (1.7)
Marine 42 15.3
Personal accident 257 (2.5)
% % %
Fire and allied 606 (21.5)
Nine months ended December 31, 2013
Amount Change ratio Net loss ratio Change
Other 786 968 949
Total 8,619 9,026 9,317
Voluntary automobile 4,968 4,749 4,842
CALI 1,222 1,228 1,359
Marine 83 71 75
Personal accident 561 582 585
Fire and allied 997 1,425 1,504
Nine months ended
December 31, 2012
Nine months ended
December 31, 2013
Nine months ended
December 31, 2012
Nine months ended
December 31, 2013
Amount Change ratio
15

Aioi Nissay Dowa Insurance Co., Ltd. (Non-consolidated)
(5) Catastrophe reserve(Yen in 100 millions)
% %
1,096 87.3 98 79 1,077 81.3
133 139.1 - 3 137 123.8
566 78.7 - 17 584 78.1
207 3.2 207 160 160 2.4
496 50.8 16 40 520 49.6
2,500 26.3 323 302 2,479 25.2
(6) Investment assets(Yen in 100 millions)
Domestic bonds
Stock
Foreign securities
Other securities
(Reference)
(7) Breakdown of interest and dividends income(Yen in 100 millions)
Domestic bonds
Stock
Foreign securities
Other securities
Other 3 4 0
Total 450 505 55
Loans 33 27 (6)
Land and buildings 36 34 (1)
149 188 39
19 11 (7)
69 78 8
139 160 21
Nine months ended
December 31, 2012
Nine months ended
December 31, 2013 Change
Investments in securities 377 439 61
Total 28,099 29,416 1,316
Long-term investment assets 6,114 5,797 (317)
Loans 2,466 2,242 (223)
Land and buildings 1,755 1,714 (40)
6,396 6,755 359
405 424 19
9,505 9,550 45
6,620 7,545 924
Cash, deposits and savings 950 1,182 231
Investments in securities 22,927 24,276 1,348
(Note) Reserve ratio = catastrophe reserve / net premiums written (excluding premiums of residential earthquake insurance and CALI) x 100
The calculation for the reserve ratio as of December 31, 2013 has been made using four thirds of the net premiums written for the nine
months ended December 31, 2013 as a denominator.
March 31, 2013 December 31, 2013Change
Fire and allied
Marine
Personal accident
Voluntary automobile
Other
Total
March 31, 2013 December 31, 2013
Balance Reversal Provision BalanceReserve ratio Reserve ratio
16

Aioi Nissay Dowa Insurance Co., Ltd. (Non-consolidated)
(8) Investments in securities
Unrealized gains and losses on investments in securities
(Yen in 100 millions)
9,254 9,550 295 (87)
4,316 7,268 2,952 1,002
5,974 6,284 310 87
257 323 65 37
19,802 23,426 3,623 1,039
(Yen in 100 millions)
9,121 9,505 383
4,377 6,327 1,949
5,738 5,961 223
308 336 27
19,546 22,130 2,584
(Notes)
Gains and losses on sales of securities(Yen in 100 millions)
31 12 12 0
22 118 122 4
17 28 35 6
- - - -
70 159 169 10
Impairment losses on securities(Yen in 100 millions)
- - -
156 16 (139)
7 5 (2)
- - -
163 22 (141)
Losses
Domestic bonds
Total
Foreign securities
Other securities
Total
Change
Domestic bonds
Stock
Foreign securities
Other securities
Nine months ended
December 31, 2012
Nine months ended
December 31, 2013
Stock
Gains/(losses)
Change from
March 31, 2013
Other securities
Stock
Foreign securities
Other securities
Total
March 31, 2013 Fair value Difference
Domestic bonds
Stock
Foreign securities
Cost
Domestic bonds
December 31, 2013 Cost Fair value Difference
Gains/(losses) Gains
Total
1. The above tables describe available-for-sale securities with practically determinable fair value.
2. "Other securities" includes certificates of deposits included in Cash, deposits and savings and loan receivable trust
beneficiary certificates included in Monetary claims bought on the balance sheets.
Nine months ended
December 31, 2012
Nine months ended
December 31, 2013
17

4. Supplementary Information
(1) Supplementary Information on Consolidated Business Results
(Yen in millions)
Lines of InsuranceShare
%
Share
%
Fire and allied 17.8 18.2
Marine 3.6 3.8
Personal accident 11.8 11.0
Voluntary automobile 43.5 42.7
CALI 10.3 10.8
Other 13.0 13.5
Total: 100.0 100.0
Deposit premiums from policyholders 5.6 4.9
Voluntary Automobile
Total
Net Premiums Written by Line of Insurance
(Yen in millions)
Lines of InsuranceShare
%
Share
%
Fire and allied 13.1 13.8
Marine 3.3 3.5
Personal accident 8.5 8.1
Voluntary automobile 50.7 49.7
CALI 11.8 12.0
Other 12.6 12.9
Total 100.0 100.0
Voluntary automobile
Total
Net Claims Paid by Line of Insurance
(Yen in millions)
Lines of InsuranceShare
%
Share
%
Fire and allied 18.2 14.7
Marine 2.4 3.0
Personal accident 6.6 7.0
Voluntary automobile 47.5 48.6
CALI 15.4 15.9
Other 9.9 10.8
Total 100.0 100.0
134,173 4.0
1,245,984 (4.4)
87,688 2.5
604,995 (2.3)
198,229 (1.2)
Amount
Change
ratio
%
183,156 (23.0)
37,740 20.3
2,105,487 6.5
1,045,036 4.2
2,104,040 6.4
4.4
251,596 7.9
271,217 8.9
291,508 12.7
74,009 13.0
170,672 2.0
266,610 (1.8)
1,036,324 4.0
263,460 11.5
(14.9)
(10.6)
2.6
2.8
2.6
1,034,877 3.8
2,427,358 5.8
Amount
Change
ratio
%
327,975 9.9
2,428,804 5.9
117,982 (8.9)
1,046,483
Amount
Change
ratio
%
441,756 8.0
92,677 13.8
619,138
200,649
128,998
(2.0)
1.6
2.8
8.1
1.8
2.9
65,469
167,274
1,002,753
233,101
249,120
1,976,298
997,395
2,293,833
2.7
1,303,454
Change
ratio
%
(32.4)
(11.0)
(0.2)
(2.2)
(0.4)
1,003,347
1,976,892
Amount
237,738
31,382
85,546
3.5
298,324
Amount
258,579
Change
ratio
%
2.0
2,293,239
129,456
6.3
0.7
(2.4)
2.9
1.7
2.6
(6.7)
Nine months ended
December 31, 2012
Nine months endedDecember 31, 2013
(a) Premiums Written and Net Claims Paid by Line of Insurance
Direct Premiums Written by Line of Insurance (including Deposit premiums from policyholders)
(Note) The figures in the above tables include elimination of intersegment transactions.
Nine months ended
December 31, 2012
Nine months ended
December 31, 2013
Nine months ended Nine months ended
December 31, 2012 December 31, 2013
(Reference) Net Premiums Written excluding Good Result Return premiums of the automobile insurance product "ModoRich"
Amount
(Reference) Direct Premiums Written excluding Good Result Return premiums of the automobile insurance product "ModoRich"
408,912
81,453
Change
ratio
%
271,387
996,801
236,360
18

(Yen in millions)
6,828,502 8,544,767
91,464
142,278 151,116 8,838 183,713 195,369 11,655
1,190,967 1,271,389 80,421 1,368,546 1,460,010
2. "Other Securities" includes certificates of deposit included in
Cash, deposits and savings, and commercial papers and loan
receivable trust beneficiary certificates included in Monetary
claims bought on the consolidated balance sheet.
2. "Other Securities" includes certificates of deposit included in
Cash, deposits and savings, and commercial papers and loan
receivable trust beneficiary certificates included in Monetary
claims bought on the consolidated balance sheet.
3. 3.The Company and its consolidated subsidiaries recognized
impairment losses of ¥34,030 million on Available-for-sale
securities with practically determinable fair value (comprised of ¥
32,608 million on Stock, ¥1,422 million on Foreign securities and
¥0 million on Other securities) .
In principle, the Company and its domestic consolidated
subsidiaries recognize impairment losses on securities with
practically determinable fair value if the fair value declines by
30% or more from the cost.
The Company and its consolidated subsidiaries recognized
impairment losses of ¥890 million on Available-for-sale securities
with practically determinable fair value (comprised of ¥758
million on Stock and ¥132 million on Foreign securities).
In principle, the Company and its domestic consolidated
subsidiaries recognize impairment losses on securities with
practically determinable fair value if the fair value declines by
30% or more from the cost.
1,439,026
3,913,187
March 31, 2013 December 31, 2013
1. Available-for-sale securities without practically determinable fair
value are not included in the above table.
1. Available-for-sale securities without practically determinable fair
value are not included in the above table.
Stock
Foreign Securities
Other Securities
1,716,265 Total 6,489,481 7,776,760 1,287,278
1,243,047 2,208,611 965,564 1,213,659 2,652,686
Carrying
amountDifference
4,062,583 4,236,701
(b) Available-for-Sale Securities
Items
March 31, 2013 December 31, 2013
CostCarrying
amountDifference Cost
174,118 Domestic Bonds 4,145,642 232,454
19
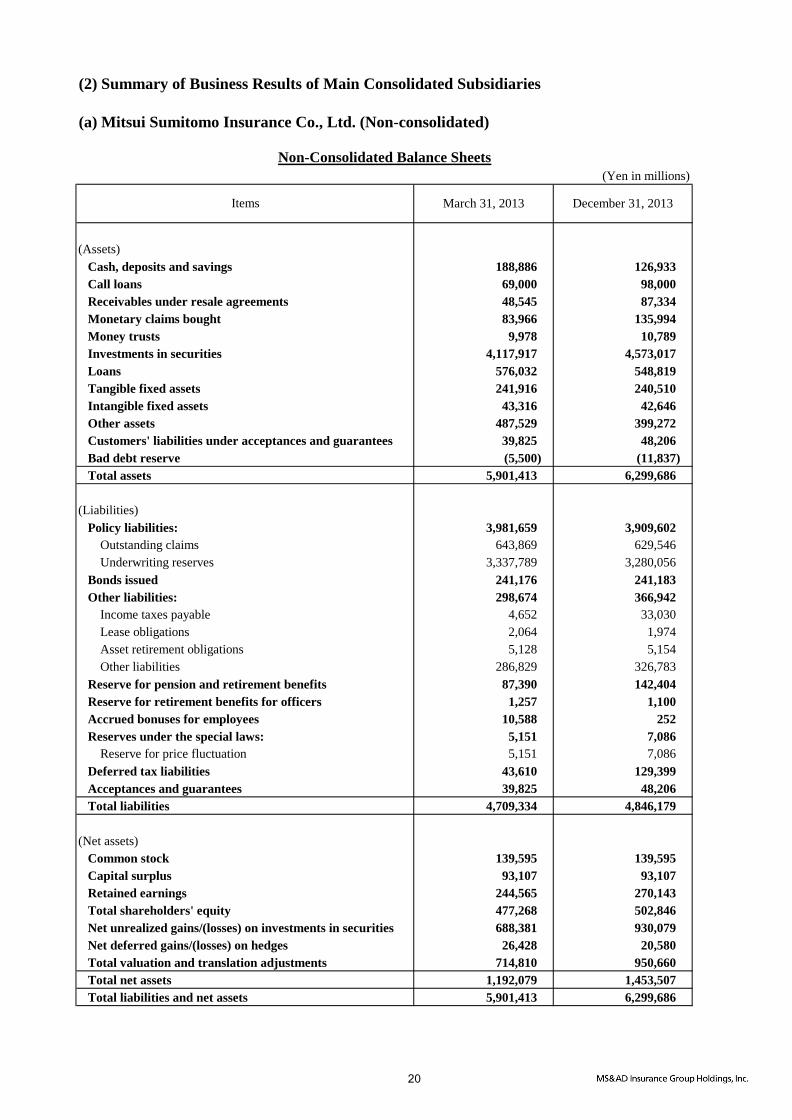
(2) Summary of Business Results of Main Consolidated Subsidiaries
(a) Mitsui Sumitomo Insurance Co., Ltd. (Non-consolidated)
(Yen in millions)
(Assets)
Cash, deposits and savings 188,886 126,933
Call loans 69,000 98,000
Receivables under resale agreements 48,545 87,334
Monetary claims bought 83,966 135,994
Money trusts 9,978 10,789
Investments in securities 4,117,917 4,573,017
Loans 576,032 548,819
Tangible fixed assets 241,916 240,510
Intangible fixed assets 43,316 42,646
Other assets 487,529 399,272
Customers' liabilities under acceptances and guarantees 39,825 48,206
Bad debt reserve (5,500) (11,837)
Total assets 5,901,413 6,299,686
(Liabilities)
Policy liabilities: 3,981,659 3,909,602
Outstanding claims 643,869 629,546
Underwriting reserves 3,337,789 3,280,056
Bonds issued 241,176 241,183
Other liabilities: 298,674 366,942
Income taxes payable 4,652 33,030
Lease obligations 2,064 1,974
Asset retirement obligations 5,128 5,154
Other liabilities 286,829 326,783
Reserve for pension and retirement benefits 87,390 142,404
Reserve for retirement benefits for officers 1,257 1,100
Accrued bonuses for employees 10,588 252
Reserves under the special laws: 5,151 7,086
Reserve for price fluctuation 5,151 7,086
Deferred tax liabilities 43,610 129,399
Acceptances and guarantees 39,825 48,206
Total liabilities 4,709,334 4,846,179
(Net assets)
Common stock 139,595 139,595
Capital surplus 93,107 93,107
Retained earnings 244,565 270,143
Total shareholders' equity 477,268 502,846
Net unrealized gains/(losses) on investments in securities 688,381 930,079
Net deferred gains/(losses) on hedges 26,428 20,580
Total valuation and translation adjustments 714,810 950,660
Total net assets 1,192,079 1,453,507
Total liabilities and net assets 5,901,413 6,299,686
Non-Consolidated Balance Sheets
Items March 31, 2013 December 31, 2013
20

Mitsui Sumitomo Insurance Co., Ltd. (Non-consolidated)
(Yen in millions)
Ordinary income: 1,395,434 1,333,606
Underwriting income: 1,313,256 1,223,080
Net premiums written 979,529 1,032,383
Deposit premiums from policyholders 94,669 87,461
Investment income on deposit premiums from policyholders 33,354 31,017
Reversal of outstanding claims 49,086 14,323
Reversal of underwriting reserves 152,505 57,733
Investment income: 80,199 108,438
Interest and dividends income 77,730 90,294
Investment gains on money trusts 54 613
Gains on sales of securities 27,456 34,564
Gains on derivative transactions 6,693 9,321
Transfer of investment income on deposit premiums from
policyholders (33,354) (31,017)
Other ordinary income 1,978 2,087
Ordinary expenses: 1,310,240 1,209,366
Underwriting expenses: 1,109,818 1,037,565
Net claims paid 662,013 618,127
Loss adjustment expenses 56,335 59,454
Commissions and collection expenses 171,223 178,562
Maturity refunds to policyholders 219,108 180,584
Investment expenses: 42,422 3,905
Investment losses on money trusts 36 -
Losses on sales of securities 1,800 1,009
Impairment losses on securities 34,858 1,511
Operating expenses and general and administrative expenses 151,986 156,077
Other ordinary expenses: 6,012 11,817
Interest expense 5,432 5,288
Ordinary profit 85,193 124,239
Extraordinary income 1,630 1,535
Extraordinary losses 1,449 4,094
Income before income taxes 85,373 121,680
Income taxes 24,868 33,847
Net income 60,505 87,833
Non-Consolidated Statements of Income
ItemsNine months ended
December 31, 2012
Nine months ended
December 31, 2013
21

Mitsui Sumitomo Insurance Co., Ltd. (Non-consolidated)
(Yen in millions)
(A) Total amount of solvency margin 1,958,579 2,322,011
Total net assets 462,870 502,846
Reserve for price fluctuation 5,151 7,086
Contingency reserve - -
Catastrophe reserve 412,208 404,876
General bad debt reserve 1,093 1,372
Net unrealized gains/(losses) on investments in
securities (prior to tax effect deductions)896,469 1,208,068
Net unrealized gains/(losses) on land 33,406 32,333
Excess of policyholders' contract deposits (a) - -
Subordinated debts, etc. (b) 106,191 106,191
Amount excluded from the margin, out of (a) and (b) - -
Deductions 43,152 43,152
Others 84,341 102,389
(B) Total amount of risks 673,800 751,953
General insurance risk (R1) 111,582 112,094
Insurance risk of third sector insurance contracts (R2) - -
Assumed interest rate risk (R3) 20,420 19,745
Asset management risk (R4) 499,540 569,209
Business administration risk (R5) 15,167 16,734
Catastrophe risk (R6) 126,834 135,690
581.3% 617.5%
(Note)
(C) Solvency margin ratio [(A) / {(B) x 1/2}] x 100
The non-consolidated solvency margin ratio for December 31, 2013 is calculated by partially applying the simplified
method where components such as the catastrophe risk (R6) are calculated based on the data used for September 30,
2013.
Non-Consolidated Solvency Margin Ratio
Insurance companies running their business in Japan calculate the non-consolidated solvency margin ratio pursuant
to the provisions of Articles 86 and 87 of the Insurance Business Act Enforcement Regulations and Public Notice
No. 50 issued by the Ministry of Finance in 1996.
While insurance companies set aside reserves to provide for payments of insurance claims should an insured event
occur, they are also required to maintain sufficient funds to pay out in an event outside the normal range of estimates
such as a major catastrophe and a significant drop in the value of their assets.
The non-consolidated solvency margin ratio, or item (C) in each of the tables below, which is calculated in
accordance with the Insurance Business Act, is the ratio of "solvency margin of insurance companies calculated
based on their capital and other reserves", or (A) the total amount of solvency margin, to "risks exceeding the normal
range of estimates", or (B) the total amount of risks.
The non-consolidated solvency margin ratio is one of the objective indicators used by the insurance regulatory
authorities to supervise insurance companies. A non-consolidated solvency margin ratio of 200% or over indicates
adequate ability to satisfy insurance claims and other payment requirements.
March 31, 2013 December 31, 2013
652
432
21 )()( RRRRRR
22

(b) Aioi Nissay Dowa Insurance Co., Ltd. (Non-consolidated)
(Yen in millions)
(Assets)
Cash, deposits and savings 92,013 115,215
Monetary claims bought 977 678
Money trusts 2,128 2,361
Investments in securities 2,292,734 2,427,632
Loans 246,684 224,299
Tangible fixed assets 185,771 183,281
Intangible fixed assets 29,971 34,093
Other assets 280,099 258,444
Deferred tax assets 106,449 71,412
Customers' liabilities under acceptances and guarantees 2,500 2,500
Bad debt reserve (2,479) (2,217)
Total assets 3,236,851 3,317,702
(Liabilities)
Policy liabilities: 2,422,522 2,393,839
Outstanding claims 473,220 477,224
Underwriting reserves 1,949,302 1,916,614
Bonds issued 50,000 50,000
Other liabilities: 182,421 192,328
Income taxes payable 2,630 17,328
Lease obligations 212 353
Asset retirement obligations 528 555
Other liabilities 179,050 174,090
Reserve for pension and retirement benefits 19,313 16,118
Accrued bonuses for employees 6,064 191
Reserves under the special laws: 1,624 2,852
Reserve for price fluctuation 1,624 2,852
Acceptances and guarantees 2,500 2,500
Total liabilities 2,684,446 2,657,830
(Net assets)
Common stock 100,005 100,005
Capital surplus 81,210 81,210
Retained earnings 191,575 225,646
Total shareholders' equity 372,790 406,861
Net unrealized gains/(losses) on investments in securities 179,614 253,009
Total valuation and translation adjustments 179,614 253,009
Total net assets 552,405 659,871
Total liabilities and net assets 3,236,851 3,317,702
Non-Consolidated Balance Sheets
Items March 31, 2013 December 31, 2013
23

Aioi Nissay Dowa Insurance Co., Ltd. (Non-consolidated)
(Yen in millions)
Ordinary income: 1,022,938 999,612
Underwriting income: 979,711 944,052
Net premiums written 829,504 861,987
Deposit premiums from policyholders 34,786 30,520
Investment income on deposit premiums from policyholders 15,362 14,531
Reversal of outstanding claims 12,756 -
Reversal of underwriting reserves 84,949 32,687
Investment income: 41,232 53,300
Interest and dividends income 45,084 50,587
Investment gains on money trusts 0 0
Gains on sales of securities 10,749 16,985
Transfer of investment income on deposit premiums from
policyholders (15,362) (14,531)
Other ordinary income 1,994 2,258
Ordinary expenses: 995,516 939,719
Underwriting expenses: 824,483 788,820
Net claims paid 547,851 516,570
Loss adjustment expenses 38,754 39,419
Commissions and collection expenses 148,084 155,277
Maturity refunds to policyholders 88,169 71,882
Provision for outstanding claims - 4,003
Investment expenses: 30,947 5,151
Losses on sales of securities 3,664 1,080
Impairment losses on securities 16,390 2,203
Losses on derivative transactions 1,833 868
Operating expenses and general and administrative expenses 138,359 144,968
Other ordinary expenses: 1,725 778
Interest expense 198 569
Ordinary profit 27,422 59,893
Extraordinary income 811 881
Extraordinary losses 1,964 1,936
Income before income taxes 26,270 58,838
Income taxes 11,497 17,481
Net income 14,772 41,356
Non-Consolidated Statements of Income
ItemsNine months ended
December 31, 2012
Nine months ended
December 31, 2013
24

Aioi Nissay Dowa Insurance Co., Ltd. (Non-consolidated)
(Yen in millions)
(A) Total amount of solvency margin 965,962 1,120,729
Total net assets 365,590 406,861
Reserve for price fluctuation 1,624 2,852
Contingency reserve 693 693
Catastrophe reserve 257,920 256,287
General bad debt reserve 379 397
Net unrealized gains/(losses) on investments in
securities (prior to tax effect deductions)233,054 328,327
Net unrealized gains/(losses) on land 2,719 2,083
Excess of policyholders' contract deposits (a) - -
Subordinated debts, etc. (b) 50,000 50,000
Amount excluded from the margin, out of (a) and (b) - -
Deductions 11,403 9,944
Others 65,383 83,169
(B) Total amount of risks 297,599 281,322
General insurance risk (R1) 102,694 102,743
Insurance risk of third sector insurance contracts (R2) - -
Assumed interest rate risk (R3) 10,421 10,154
Asset management risk (R4) 169,412 189,164
Business administration risk (R5) 7,314 7,042
Catastrophe risk (R6) 83,193 50,038
649.1% 796.7%
(Note)
Non-Consolidated Solvency Margin Ratio
March 31, 2013 December 31, 2013
(C) Solvency margin ratio [(A) / {(B) x 1/2}] x 100
The non-consolidated solvency margin ratio for December 31, 2013 is calculated by partially applying the simplified
method where components such as the catastrophe risk (R6) are calculated based on the data used for September 30,
2013.
652
432
21 )()( RRRRRR
25

(c) Mitsui Direct General Insurance Co., Ltd. (Non-consolidated)
(Yen in millions)
(Assets)
Cash, deposits and savings 3,541 2,371
Investments in securities 33,674 35,372
Tangible fixed assets 308 235
Intangible fixed assets 1,960 1,612
Other assets 6,115 5,674
Bad debt reserve (3) (3)
Total assets 45,596 45,263
(Liabilities)
Policy liabilities: 33,135 33,273
Outstanding claims 13,593 14,785
Underwriting reserves 19,541 18,488
Other liabilities: 1,092 773
Income taxes payable 135 44
Asset retirement obligations 12 12
Other liabilities 945 715
Accrued bonuses for employees 209 -
Reserves under the special laws: 27 31
Reserve for price fluctuation 27 31
Deferred tax liabilities 51 19
Total liabilities 34,516 34,097
(Net assets)
Common stock 32,600 32,600
Capital surplus 2,500 2,500
Retained earnings (24,286) (24,133)
Total shareholders' equity 10,813 10,966
Net unrealized gains/(losses) on investments in securities 267 198
Total valuation and translation adjustments 267 198
Total net assets 11,080 11,165
Total liabilities and net assets 45,596 45,263
Non-Consolidated Balance Sheets
Items March 31, 2013 December 31, 2013
26

Mitsui Direct General Insurance Co., Ltd. (Non-consolidated)
(Yen in millions)
Ordinary income: 26,912 27,120
Underwriting income: 26,794 27,012
Net premiums written 25,785 25,947
Investment income on deposit premiums from policyholders 10 11
Reversal of outstanding claims 243 -
Reversal of underwriting reserves 755 1,053
Investment income: 116 102
Interest and dividends income 126 113
Transfer of investment income on deposit premiums from
policyholders (10) (11)
Other ordinary income 2 6
Ordinary expenses: 26,210 26,933
Underwriting expenses: 21,129 21,580
Net claims paid 19,224 18,443
Loss adjustment expenses 1,758 1,804
Commissions and collection expenses 146 140
Provision for outstanding claims - 1,191
Investment expenses - -
Operating expenses and general and administrative expenses 5,080 5,351
Other ordinary expenses 0 1
Ordinary profit 701 186
Extraordinary income - -
Extraordinary losses 4 13
Income before income taxes 697 173
Income taxes - current 28 20
Total income taxes 28 20
Net income 668 153
Non-Consolidated Statements of Income
ItemsNine months ended
December 31, 2012
Nine months ended
December 31, 2013
27

Mitsui Direct General Insurance Co., Ltd. (Non-consolidated)
(Yen in millions)
(A) Total amount of solvency margin 12,324 12,101
Total net assets 10,813 10,966
Reserve for price fluctuation 27 31
Contingency reserve 0 0
Catastrophe reserve 1,133 843
General bad debt reserve 0 1
Net unrealized gains/(losses) on investments in
securities (prior to tax effect deductions)349 259
Net unrealized gains/(losses) on land - -
Excess of policyholders' contract deposits (a) - -
Subordinated debts, etc. (b) - -
Amount excluded from the margin, out of (a) and (b) - -
Deductions - -
Others - -
(B) Total amount of risks 5,740 5,743
General insurance risk (R1) 5,233 5,233
Insurance risk of third sector insurance contracts (R2) - -
Assumed interest rate risk (R3) 0 0
Asset management risk (R4) 511 533
Business administration risk (R5) 181 182
Catastrophe risk (R6) 300 300
429.4% 421.4%
(Note)
Non-Consolidated Solvency Margin Ratio
March 31, 2013 December 31, 2013
(C) Solvency margin ratio [(A) / {(B) x 1/2}] x 100
The non-consolidated solvency margin ratio for December 31, 2013 is calculated by partially applying the simplified
method to components such as the assumed interest rate risk (R3).
652
432
21 )()( RRRRRR
28

(d) Mitsui Sumitomo Aioi Life Insurance Co., Ltd. (Non-consolidated)
(Yen in millions)
(Assets)
Cash, deposits and savings 23,815 22,525
Call loans 707 110
Receivables under securities borrowing transactions 224,025 210,981
Investments in securities 2,102,671 2,230,533
Loans 47,656 48,754
Tangible fixed assets 2,224 1,694
Intangible fixed assets 3,297 4,258
Due from agencies 274 143
Reinsurance accounts receivable 265 77
Other assets 31,428 34,280
Bad debt reserve (102) (83)
Total assets 2,436,264 2,553,274
(Liabilities)
Policy liabilities: 2,045,655 2,188,863
Outstanding claims 19,423 20,011
Policy reserves 2,019,481 2,161,812
Reserve for dividends to policyholders 6,750 7,040
Due to agencies 5,854 4,018
Reinsurance accounts payable 213 208
Other liabilities: 234,383 220,106
Payables under securities lending transactions 224,733 211,085
Income taxes payable 315 2,967
Lease obligations 1,010 823
Asset retirement obligations 174 178
Other liabilities 8,149 5,051
Reserve for pension and retirement benefits 1,437 1,541
59 52
Reserves under the special laws: 3,406 3,778
Reserve for price fluctuation 3,406 3,778
Deferred tax liabilities 13,010 8,100
Total liabilities 2,304,020 2,426,670
(Net assets)
Common stock 35,500 35,500
Capital surplus 43,688 43,688
Retained earnings (15,672) (10,162)
Total shareholders' equity 63,515 69,025
Net unrealized gains/(losses) on investments in securities 68,727 57,578
Total valuation and translation adjustments 68,727 57,578
Total net assets 132,243 126,603
Total liabilities and net assets 2,436,264 2,553,274
Reserve for retirement benefits for officers
Non-Consolidated Balance Sheets
Items March 31, 2013 December 31, 2013
29

Mitsui Sumitomo Aioi Life Insurance Co., Ltd. (Non-consolidated)
(Yen in millions)
Ordinary income: 334,548 335,624
Insurance premiums and others: 302,089 304,105
Insurance premiums 301,557 303,887
Investment income: 30,382 30,720
Interest and dividends income 25,449 27,549
Gains on sales of securities 4,921 3,153
Other ordinary income 2,076 798
Ordinary expenses: 326,927 322,827
Insurance claims and others: 122,494 121,812
Insurance claims 31,904 31,675
Annuity payments 6,475 7,357
Benefits 8,223 8,766
Surrender benefits 73,464 71,342
Other refunds 1,633 1,695
Provision for policy reserves and others: 144,028 142,919
Provision for outstanding claims 364 588
Provision for policy reserves 143,661 142,330
Provision for interest portion of reserve for dividends to
policyholders 2 0
Investment expenses: 2,238 951
Interest expense 227 211
Losses on sales of securities 1,497 713
Impairment losses on securities 486 -
Operating expenses 53,047 51,914
Other ordinary expenses 5,118 5,230
Ordinary profit 7,621 12,796
Extraordinary income 1 2
Extraordinary losses 329 401
Provision for reserve for dividends to policyholders 3,868 3,875
Income before income taxes 3,424 8,522
Income taxes 1,413 3,095
Net income 2,010 5,427
Non-Consolidated Statements of Income
ItemsNine months ended
December 31, 2012
Nine months ended
December 31, 2013
30

Mitsui Sumitomo Aioi Life Insurance Co., Ltd. (Non-consolidated)
Amount of Policies in Force and New Policies
(1) Policies in force (Yen in millions)
Amount Amount
Individual insurance
Individual annuities
Group insurance
Group annuities
(2) New policies (Yen in millions)
Individual insurance 231 2,577,706 2,577,706 - 194 1,947,093 1,947,093 -
Individual annuities 11 59,304 59,304 - 8 64,995 64,995 -
Group insurance - 691,598 691,598 - - 54,513 54,513 -
Group annuities - - - - - - - -
Annualized Premiums
(1) Policies in force (Yen in millions)
Individual insurance 277,088 286,989
Individual annuities 42,614 44,007
Total: 319,703 330,996
Medical coverage,
living benefits, etc.55,196 58,888
(2) New policies (Yen in millions)
Individual insurance 29,695 27,208
Individual annuities 3,324 3,298
Total: 33,020 30,506
Medical coverage,
living benefits, etc.4,901 7,042
(Notes) 1. An annualized premium is the annual total of premiums that is obtained by multiplying the amount of a single payment with the number
of payments per year in accordance with the premium payment method. An annualized premium for a single-payment policy is the
premium divided by the number of years of coverage.
2. "Medical coverage, living benefits, etc." represents the portion of annualized premiums that corresponds to medical coverage benefits
(for hospitalization, surgeries, etc.), living benefits (for specified diseases, nursing care, etc.) and premium waiver benefits (excluding
those for disability, but including those for specified diseases, nursing care, etc.).
Business Results
March 31, 2013 December 31, 2013
Number of policies
(in thousands)
Number of policies
(in thousands)
2,262 19,317,482 2,354 20,057,841
183 757,139 186 787,690
- 5,165,629 - 5,093,510
- 429 - 405
Net increase
by conversion
(Note) The amounts of individual annuities represent the funds to be held at the time annuity payments are to commence.
(Notes) 1. The amounts of individual annuities represent the total sum of (a) the funds to be held at the time annuity payments are to commence
for the policies for which annuity payments have not yet commenced and (b) the policy reserves for the policies for which annuity
payments have commenced.
2. The amounts of group annuities represent the policy reserves.
Nine months ended December 31, 2012 Nine months ended December 31, 2013
Number of
policies
(in thousands)
Amount
Number of
policies
(in thousands)
AmountNew policies
Net increase
by conversionNew policies
March 31, 2013 December 31, 2013
Nine months ended
December 31, 2012
Nine months ended
December 31, 2013
31
Mitsui Sumitomo Aioi Life Insurance Co., Ltd. (Non-consolidated)
Non-Consolidated Business Performance
(Yen in millions)
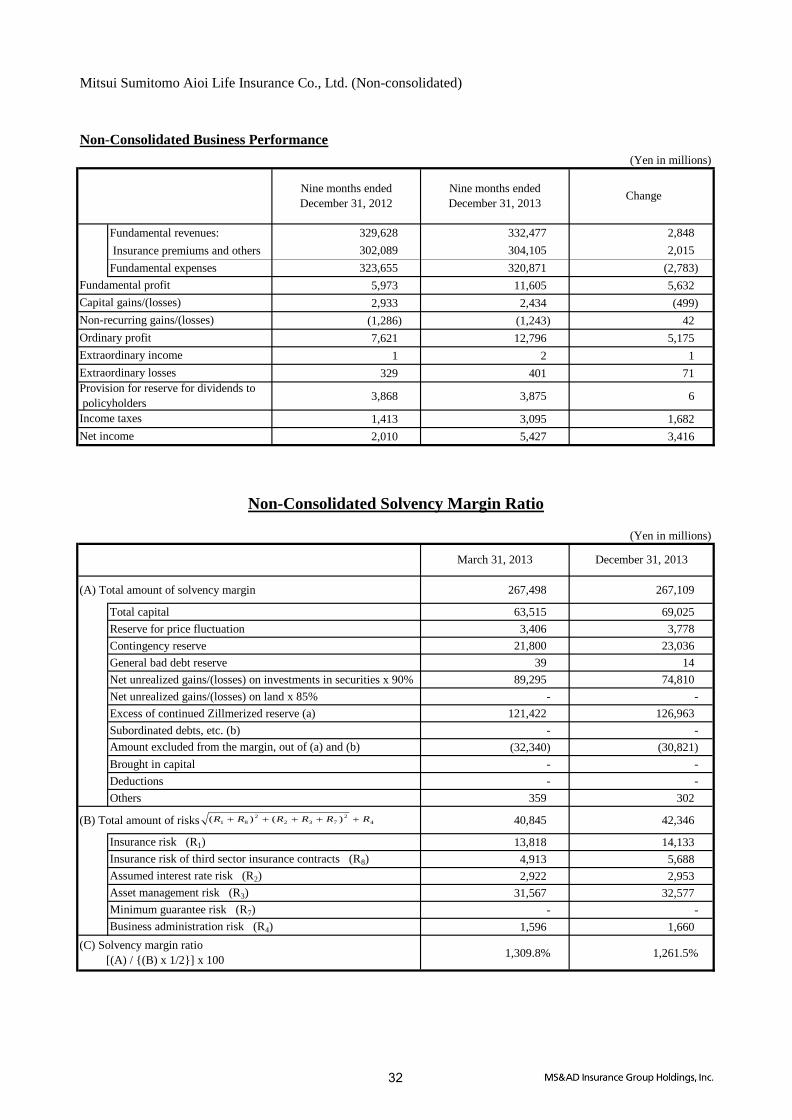
Fundamental revenues: 329,628 332,477 2,848
Insurance premiums and others 302,089 304,105 2,015
Fundamental expenses 323,655 320,871 (2,783)
5,973 11,605 5,632
2,933 2,434 (499)
(1,286) (1,243) 42
7,621 12,796 5,175
1 2 1
329 401 71
3,868 3,875 6
1,413 3,095 1,682
2,010 5,427 3,416
(Yen in millions)
(A) Total amount of solvency margin 267,498 267,109
Total capital 63,515 69,025
Reserve for price fluctuation 3,406 3,778
Contingency reserve 21,800 23,036
General bad debt reserve 39 14
Net unrealized gains/(losses) on investments in securities x 90% 89,295 74,810
Net unrealized gains/(losses) on land x 85% - -
Excess of continued Zillmerized reserve (a) 121,422 126,963
Subordinated debts, etc. (b) - -
(32,340) (30,821)
Brought in capital - -
Deductions - -
Others 359 302
(B) Total amount of risks 40,845 42,346
Insurance risk (R1) 13,818 14,133
Insurance risk of third sector insurance contracts (R8) 4,913 5,688
Assumed interest rate risk (R2) 2,922 2,953
Asset management risk (R3) 31,567 32,577
Minimum guarantee risk (R7) - -
Business administration risk (R4) 1,596 1,660
1,309.8% 1,261.5%
Capital gains/(losses)
Nine months ended
December 31, 2012
Nine months ended
December 31, 2013Change
Fundamental profit
(C) Solvency margin ratio
[(A) / {(B) x 1/2}] x 100
Non-recurring gains/(losses)
Ordinary profit
Extraordinary income
Extraordinary losses
Provision for reserve for dividends to
policyholders
Income taxes
Net income
Non-Consolidated Solvency Margin Ratio
March 31, 2013 December 31, 2013
Amount excluded from the margin, out of (a) and (b)
4
2
732
2
81 )()( RRRRRR
32

(e) Mitsui Sumitomo Primary Life Insurance Co., Ltd. (Non-consolidated)
(Yen in millions)
(Assets)
Cash, deposits and savings 37,291 39,502
Call loans 30,002 15,563
Money trusts 886,301 667,203
Investments in securities 2,777,814 3,277,442
Loans 529 458
Tangible fixed assets 1,099 950
Intangible fixed assets 4,042 4,017
Reinsurance accounts receivable 90 249
Other assets 5,489 30,615
Deferred tax assets 22,914 22,995
Total assets 3,765,574 4,058,998
(Liabilities)
Policy liabilities: 3,645,909 3,914,498
Outstanding claims 12,942 10,378
Policy reserves 3,632,967 3,904,120
Due to agencies 2,858 7,132
Reinsurance accounts payable 1,732 2,534
Other liabilities: 20,045 16,272
Income taxes payable 12,829 -
Lease obligations 839 718
Asset retirement obligations 123 124
Other liabilities 6,253 15,429
Reserves under the special laws: 23,743 24,643
Reserve for price fluctuation 23,743 24,643
Total liabilities 3,694,290 3,965,081
(Net assets)
Common stock 41,060 41,060
Capital surplus 24,735 24,735
Retained earnings 4,740 27,554
Total shareholders' equity 70,535 93,349
Net unrealized gains/(losses) on investments in securities 748 566
Total valuation and translation adjustments 748 566
Total net assets 71,284 93,916
Total liabilities and net assets 3,765,574 4,058,998
Non-Consolidated Balance Sheets
Items March 31, 2013 December 31, 2013
33

Mitsui Sumitomo Primary Life Insurance Co., Ltd. (Non-consolidated)
(Yen in millions)
Ordinary income: 570,760 962,298
Insurance premiums and others: 349,989 571,840
Insurance premiums 344,033 569,418
Investment income: 219,424 385,959
Interest and dividends income 245 2,928
Investment gains on money trusts 97,384 5,140
Gains on sales of securities - 0
Investment gains on separate accounts 121,570 373,183
Other ordinary income: 1,346 4,498
Reversal of outstanding claims - 2,564
Ordinary expenses: 542,194 926,886
Insurance claims and others: 194,442 609,703
Insurance claims 32,792 38,103
Annuity payments 32,499 38,469
Benefits 47,048 137,806
Surrender benefits 63,474 372,361
Other refunds 766 1,368
Provision for policy reserves and others: 317,187 271,152
Provision for outstanding claims 2,736 -
Provision for policy reserves 314,451 271,152
Investment expenses: 438 864
Interest expense 0 0
Losses on derivative transactions - 389
Operating expenses 28,396 40,633
Other ordinary expenses 1,728 4,532
Ordinary profit 28,566 35,411
Extraordinary income - -
Extraordinary losses 662 900
Income before income taxes 27,903 34,510
Income taxes 9,355 11,696
Net income 18,547 22,814
Non-Consolidated Statements of Income
ItemsNine months ended
December 31, 2012
Nine months ended
December 31, 2013
34

Mitsui Sumitomo Primary Life Insurance Co., Ltd. (Non-consolidated)
Amount of Policies in Force and New Policies
(1) Policies in force (Yen in millions)
Amount Amount
Individual insurance
Individual annuities
Group insurance
Group annuities
(b) the policy reserves for the policies for which annuity payments have commenced.
(2) New policies (Yen in millions)
Individual insurance 44 235,541 235,541 - 80 427,833 427,833 -
Individual annuities 17 96,076 96,076 - 19 120,672 120,672 -
Group insurance - - - - - - - -
Group annuities - - - - - - - -
Annualized Premiums
(1) Policies in force (Yen in millions)
Individual insurance 31,509 55,462
Individual annuities 402,731 381,002
Total: 434,240 436,465
Medical coverage,
living benefits, etc.104 117
(2) New policies (Yen in millions)
Individual insurance 14,989 28,229
Individual annuities 72,003 92,199
Total: 86,992 120,428
Medical coverage,
living benefits, etc.- -
(Notes) 1. An annualized premium is the annual total of premiums that is obtained by multiplying the amount of a single payment with the number
of payments per year in accordance with the premium payment method. An annualized premium for a single-payment policy is the
premium divided by the number of years of coverage.
2. "Medical coverage, living benefits, etc." represents the portion of annualized premiums that corresponds to medical coverage benefits
(for hospitalization, surgeries, etc.), living benefits (for specified diseases, nursing care, etc.) and premium waiver benefits (excluding
those for disability, but including those for specified diseases, nursing care, etc.).
Business Results
March 31, 2013 December 31, 2013
Number of policies
(in thousands)
Number of policies
(in thousands)
67 465,049 137 839,913
413 3,196,405 374 3,096,821
- - - -
- - - -
(Note) The amounts of individual annuities represent the total sum of (a) the funds to be held at the time annuity payments are to commence (the
premium reserves in the case of individual variable annuities) for the policies for which annuity payments have not yet commenced and
Nine months ended December 31, 2012 Nine months ended December 31, 2013
Number of
policies
(in thousands)
Amount
Number of
policies
(in thousands)
AmountNew policies
Nine months ended
December 31, 2012
Nine months ended
December 31, 2013
Net increase
by conversionNew policies
Net increase
by conversion
(Note) The amounts of individual annuities represent the funds to be held at the time annuity payments are to commence (the premium
reserves at the time of enrollment in the case of individual variable annuities).
March 31, 2013 December 31, 2013
35

Mitsui Sumitomo Primary Life Insurance Co., Ltd. (Non-consolidated)
Non-Consolidated Business Performance
(Yen in millions)
Fundamental revenues: 559,511 981,553 422,041
Insurance premiums and others 349,989 571,840 221,850
Fundamental expenses 536,243 934,422 398,179
23,268 47,130 23,862
11,248 (3,934) (15,183)
(5,951) (7,784) (1,833)
28,566 35,411 6,845
- - -
662 900 238
- - -
9,355 11,696 2,341
18,547 22,814 4,266
(Yen in millions)
(A) Total amount of solvency margin 267,510 330,371
Total capital 70,535 93,349
Reserve for price fluctuation 23,743 24,643
Contingency reserve 46,722 54,507
General bad debt reserve - -
Net unrealized gains/(losses) on investments in securities x 90% 973 736
Net unrealized gains/(losses) on land x 85% - -
Excess of continued Zillmerized reserve (a) 123,427 144,882
Subordinated debts, etc. (b) - -
- -
Brought in capital - -
Deductions - -
Others 2,107 12,252
(B) Total amount of risks 60,516 62,109
Insurance risk (R1) 53 51
Insurance risk of third sector insurance contracts (R8) 16 13
Assumed interest rate risk (R2) 15,199 21,318
Asset management risk (R3) 22,753 26,120
Minimum guarantee risk (R7) 21,375 13,451
Business administration risk (R4) 1,187 1,219
884.0% 1,063.8%
Capital gains/(losses)
Nine months ended
December 31, 2012
Nine months ended
December 31, 2013Change
Fundamental profit
(C) Solvency margin ratio
[(A) / {(B) x 1/2}] x 100
Non-recurring gains/(losses)
Ordinary profit
Extraordinary income
Extraordinary losses
Provision for reserve for dividends to
policyholders
Income taxes
Net income
Non-Consolidated Solvency Margin Ratio
March 31, 2013 December 31, 2013
Amount excluded from the margin, out of (a) and (b)
4
2
732
2
81 )()( RRRRRR
36
Top Related