


Languages
Pages
Legal


© S
trat
egic
Net
wor
ks G
roup
, Inc
. 201
2
The Impacts of Broadband Research Findings from the Broadband Economists
Michael Curri Doug Adams
President Head of Communications
Blandin Foundation Conference WebinarNovember 8, 2012 - Minnesota

© S
trat
egic
Net
wor
ks G
roup
, Inc
. 201
2
WE ARE a global leader in broadband planning for socio-economic development
WE PROVIDE data and insights to increase broadband utilization and impacts
WE DELIVER strategies for economic development and community transformation through broadband
Some of our clients:
2
We are the “Broadband economists”
UK Department of Trade and Industry

© S
trat
egic
Net
wor
ks G
roup
, Inc
. 201
2
Revenues from client subscriptions- Investment and maintenance costs
= PROFIT
Operators
Local Economy
Increased productivity and competitiveness, increased revenues, new jobs,
better quality of life, etc.- Investment, maintenance, support
= BENEFITS FOR THE COMMUNITY
3
Why we Build Broadband Networks
“Off- balance-sheet”
© S
trat
egic
Net
wor
ks G
roup
, Inc
. 201
2

© S
trat
egic
Net
wor
ks G
roup
, Inc
. 201
2
Broadband Direct ImpactsBenefits from the Digital Economy

© S
trat
egic
Net
wor
ks G
roup
, Inc
. 201
2
5
Broadband’s Profound Impact on Job Creation
Percent of New Jobs Related to InternetBy Size of Employer Group
Broadband is responsible for 22.4% of all new jobs
Source: SNG Digital Economy Database n = 3,574 from NC, VA and KY collected in 2010-12 © S
trat
egic
Net
wor
ks G
roup
, Inc
. 201
2
1 - 1
9
20 -
99
100
- 449
500
or m
ore
Tota
ls
0%
5%
10%
15%
20%
25%
30%
35% 31.5%
21.4%23.1%
19.2%22.4%
Employees
Small businesses create 12x more
Internet jobs relative to large
firms

© S
trat
egic
Net
wor
ks G
roup
, Inc
. 201
2
6
Broadband and Communities
Broadband retains and attracts population and businesses
38% of households said they would definitely, or likely, relocate if broadband was not available
72% of home-based businesses say broadband was essential for their business
32% of households have a home-based business, with 14%
planning to start one in the coming year
55% of business and organizations said broadband is essential for
remaining in current location
Source: SNG Digital Economy Database n = 34,000

© S
trat
egic
Net
wor
ks G
roup
, Inc
. 201
2
Economic ROI from Public Investments in Broadband
Contribution to GDP 10 x the initial public investment
Number of Jobs created and saved Variable
Fiscal revenues increase 3 to 4 x the initial public investment
7
ROI from Broadband Networks
SNG projects have revealed common return on investment (ROI) multipliers from broadband investments
Average multipliers identified from economic impact studies conducted by SNG.

© S
trat
egic
Net
wor
ks G
roup
, Inc
. 201
2
Build It and They Will Come???? The Marketing Theory Behind Why
Building Is NOT Enough

© S
trat
egic
Net
wor
ks G
roup
, Inc
. 201
2
Utility vs.Technology
9
Utility Technology
Basic Need (water, roads, electricity)
A Luxury, a “nice to have” (smart phone, DVR, HD TV)
Basic Internet Service Ultra fast and/or fiber Internet Service
The “Broadband is a Utility” argument discounts the fact that adopting better broadband is a technology upgrade decision.
In 2012, to maximize broadband’s benefits and drive innovation, business, organizations and households must adopt and utilize…
E-Solutions
Ultra-fast broadband

© S
trat
egic
Net
wor
ks G
roup
, Inc
. 201
2
Technology’s Adoption Groups
10
We all tend to fall somewhere on the “technology adoption curve”
“Innovators” alone will not create a sustainable network
This is the “nature part of the equation of broadband’s consumers (stay tuned for the nurture)

© S
trat
egic
Net
wor
ks G
roup
, Inc
. 201
2
11
“Crossing the Chasm” *
Innovators buy features, The rest of us want benefits
“Faster” is not a benefit!
* Geoffrey A. Moore, 1991

© S
trat
egic
Net
wor
ks G
roup
, Inc
. 201
2
2 Simple Steps (But Not 1)
12
Education – driving understanding of the benefits of ultra-fast broadband
Close – getting the household, company, organization to actually signup
So how do we do this????

© S
trat
egic
Net
wor
ks G
roup
, Inc
. 201
2
And to the Nurture…
13
Explain the technology – Distinguishing the difference and the promise of the new technology
Create a communications plan to reach target audience(s)
Reduce the time it takes to realize benefits by ratcheting up Knowledge of ROI, benefits, etc.
Use the social system (Influencers) to tout the technology’s advantages
The theory of “Diffusion of Innovations” tells us that you can NURTURE a person’s nature by doing
the following…

© S
trat
egic
Net
wor
ks G
roup
, Inc
. 201
2
Driving UtilizationTechnology is not enough

© S
trat
egic
Net
wor
ks G
roup
, Inc
. 201
2
15
In the Broadband Equation, the quality of each input affects the output
One Factor is not Enough
Skills AverageLagging Technology
SkillsTechnology BENEFITS
Technology No Skills Average

© S
trat
egic
Net
wor
ks G
roup
, Inc
. 201
2
16
less th
an 1 yr
1 yr up to
2 yrs
2 yrs up to
3 yrs
3 yrs up to
4 yrs
4 yrs up to
5 yrs
more th
an 5 yrs5.00
5.50
6.00
6.50
7.00
5.27
5.66
5.86
6.00
6.26
6.76
Average Broadband utilization from 0 to 10 (DEi Score) / Experience using broadband
Time using broadband
Broa
dban
d uti
lizati
on fr
om 0
to 1
0 (D
Ei s
core
)
Source: SNG Digital Economy Database n = 14,176 from NC, VA, KY and LA collected in 2010 and 2012
Experience Matters as much as Technology
Optimized broadband utilization is not inborn, but acquired

© S
trat
egic
Net
wor
ks G
roup
, Inc
. 201
2
17
Lack of internal expertise and knowledge
High cost of development/maintenance
Available Internet is too slow
Loss of personal contact with clients
Security concerns
Privacy concerns
0% 10% 20% 30% 40% 50%
18.4%
22.5%
23.6%
25.5%
40.3%
41.0%
Percent Establishments defining above barriers to using the Internet as “Very Im-portant”
The Biggest Barrier is Not Knowing
Source: SNG Digital Economy Database n = 12,177 from NC, VA, KY and LA collected in 2010 and 2012
Fear of the unknown overrules slow Internet as a barrier

© S
trat
egic
Net
wor
ks G
roup
, Inc
. 201
2
Adoption and Utilization Is Key How SNG Helps Drive Utilization

© S
trat
egic
Net
wor
ks G
roup
, Inc
. 201
2
We uncover Internet use at a micro-level and benchmark against peers
17 e-solutions1 by organizations30 e-solutions1 by households
Utilization data collected2 by SNG directly From 23,000 businesses / organizations And 11,000 households (a normative database).
Results shown use SNG’s Digital Economy index (DEi), a composite score between 1 and 10 to reflect level of Internet utilization.
How SNG Measures Utilization
1. Internet-enabled applications and processes; 2. Between 2008-201219
DEi scoring process enables comparisons and rankings by sector or region

© S
trat
egic
Net
wor
ks G
roup
, Inc
. 201
2
20
3 up to
4
4 up to
5
5 up to
6
6 up to
7
7 up to
8
8 up to
9
9 up to
10
0%
5%
10%
15%
20%
25%
30%
35%
40%
14.8%
20.0%
15.7%
25.5%
29.4% 30.7%
36.8%
Contribution of Internet to Revenues / Level of utilization
Level of Broadband Utilization (DEi score)
% o
f Rev
enue
s att
ribu
ted
from
Inte
rnet
usa
geIncreased Utilization Directly Correlates to Revenue Growth
Businesses underutilizing the Internet miss significant revenue opportunitiesSource: SNG Digital Economy Database n = 1,202 from NC, VA and KY collected in 2010-12

© S
trat
egic
Net
wor
ks G
roup
, Inc
. 201
2
0 up to 1 1 up to 2 2 up to 3 3 up to 4 4 up to 5 5 up to 6 6 up to 7 7 up to 8 8 up to 9 9 up to 100%
10%
20%
30%
40%
50%
60%
70%
80%
90%
100%
e-Solutions with greatest impact used by those with most experience & skills (i.e. highest DEi Score)
Slow / Late Adoption
Social networking
Rich media or service creation
Selling goods or services
Teleworking Deliver services and contentResearch by staff
Website for organization
Access government information
Purchasing goods and services
Electronic document transfer
Fast / Early Adoption
© Strategic Networks Group, Inc. 2012
Highest value, but requires awareness
and high quality Internet connection
The adoption process for e-solutions by businesses
DEi Score
Util
izati
on
Source: SNG Digital Economy Database n = 9,677 from NC, VA, KY and LA collected in 2010-2012
Fast / Early Adoption
Slow / Late Adoption

© S
trat
egic
Net
wor
ks G
roup
, Inc
. 201
2
5.0
5.5
6.0
6.5
7.0
7.5
0%
10%
20%
30%
40%
50%
60%
70%
80%
90%
100%
Higher value e-solutions being used by fewer households
Average DEi Score Percentage of Households (%)
DEi S
core
Util
izatio
n©
Str
ateg
ic N
etw
orks
Gro
up, I
nc. 2
012
22
Broadband Utilization and Household Earning Power
Biggest benefits!
Highest value, but requires awareness and high quality Internet connection
Source: SNG Digital Economy Database n = 4,638 from NC, VA, KY and LA collected in 2010

© S
trat
egic
Net
wor
ks G
roup
, Inc
. 201
2
23
Driving Adoption and Utilization
DEi Scorecard is delivered to each business and organization
Individualized one page report that presents: benchmarking against peers, potential ROI from increased utilization, local advisors
Data based on the individual’s current broadband utilization and industry average
Shared with local economic development agencies so they can help businesses and organizations throughout the process
Automatically created and distributed by SNG online tools

© S
trat
egic
Net
wor
ks G
roup
, Inc
. 201
2
24
For an individual business or organization, increasing utilization by 10% means :
Increasing revenues by 24%
Decreasing costs by 7%
Why Drive Utilization?
For a Region, it means :
Allowing businesses to be more competitive
Creating a demand for high-skilled workers
Adding fiscal revenues
Average multipliers identified by SNG from over 12,000 data records collected in 2009-10.

© S
trat
egic
Net
wor
ks G
roup
, Inc
. 201
2
25
Reliable, affordable BB
Responsive Customer Service
Meaningful utilization
Local ownership to drive economic development
Economic Growth and quality of life from broadband
The Elements of Success
TO ENSURE
YOU NEED

© S
trat
egic
Net
wor
ks G
roup
, Inc
. 201
2
2626
Thank-you
Let’s connect !www.sngroup.com
Michael Curri, PresidentStrategic Networks Group, Inc.
North America + [email protected]
Doug Adams, VP of CommunicationsStrategic Networks Group, Inc.
North America + [email protected]

© S
trat
egic
Net
wor
ks G
roup
, Inc
. 201
2
Community Anchor Institutions First in line for community improvements

© S
trat
egic
Net
wor
ks G
roup
, Inc
. 201
2Increase teleworking
introduce new products or services
Reduce time to market for products or services
Keep pace with competitors
Reduce cost of products and services
Improve coordination with suppliers
Increase revenues
Lower operating costs
Adopt new operational processes
Reach new customers and clients
Improve staff skills
Improve service to customers and clients
Use existing resources more effectively
Make day-to-day operations easier
0% 10% 20% 30% 40% 50% 60% 70% 80% 90% 100%
35.1%
40.3%
45.4%
48.3%
53.1%
55.6%
57.5%
58.6%
61.3%
61.5%
68.5%
71.0%
74.1%
75.6%
24.6%
25.3%
16.3%
23.0%
20.5%
24.1%
21.2%
22.3%
26.5%
22.6%
22.7%
17.2%
20.1%
17.5%
Internet benefits to health organizations
Very Important Somewhat Important Not Important Not Sure Not Applicable
Internet benefits/ Pct. establishments
28
Better Broadband, Healthier Citizens
Source: SNG Digital Economy Database n = 894 from NC, VA, KY and LA collected in 2010-12

© S
trat
egic
Net
wor
ks G
roup
, Inc
. 201
2
Increase teleworking
Improve coordination with suppliers
Lower operating costs
Reach new customers and clients
Adopt new operational processes
0% 10% 20% 30% 40% 50% 60% 70% 80% 90% 100%
30.8%
46.2%
61.5%
61.5%
61.5%
50.0%
53.8%
65.4%
65.4%
65.4%
62.5%
81.3%
81.3%
81.3%
93.8%
Internet benefits to schools by speed of connection
25Mbps and more 6 to 25Mbps 1.5 to 6Mbps
Somewhat to Very important benefits / Pct. establishments
29
The Impact of Better Broadband on Schools

© S
trat
egic
Net
wor
ks G
roup
, Inc
. 201
2
30
All businesses and organizations
Health
Libraries
Schools
0% 10% 20% 30% 40% 50% 60%
Pct. Establishments having acquired IT skills in the past 12 months
Pct. Establishments
CAIs are Early Adopters and Broadband Savvy

© S
trat
egic
Net
wor
ks G
roup
, Inc
. 201
2
Tools for Economic DevelopmentMaximize broadband impacts
© S
trat
egic
Net
wor
ks G
roup
, Inc
. 201
2
32
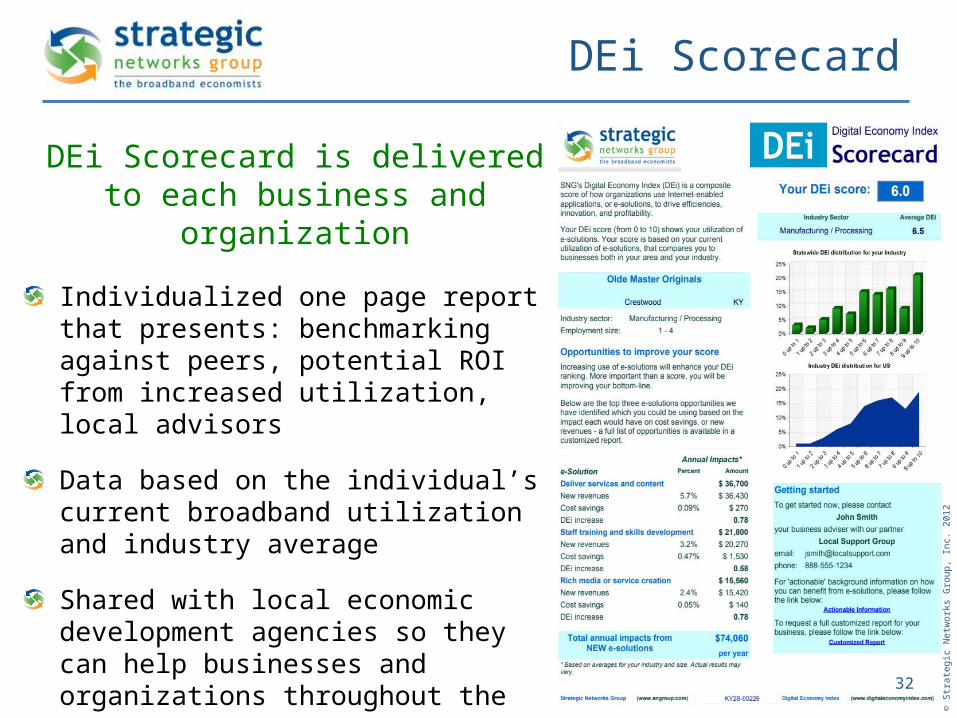
DEi Scorecard
DEi Scorecard is delivered to each business and organization
Individualized one page report that presents: benchmarking against peers, potential ROI from increased utilization, local advisors
Data based on the individual’s current broadband utilization and industry average
Shared with local economic development agencies so they can help businesses and organizations throughout the process
Automatically created and distributed by SNG online tools

© S
trat
egic
Net
wor
ks G
roup
, Inc
. 201
2
DEi Impact Calculator- customize to individual needs -
33
© S
trat
egic
Net
wor
ks G
roup
, Inc
. 201
2
1. Select your organization characteristics
2. Select your actual and needed e-Solutions
Source: SNG Digital Economy Database n = 26,200

© S
trat
egic
Net
wor
ks G
roup
, Inc
. 201
2
DEi Impact Calculator- choose e-strategy based on ROI -
34
© S
trat
egic
Net
wor
ks G
roup
, Inc
. 201
2
4. Details of potential revenues and cost savings
3. See your potential benefits from increased utilization
Source: SNG Digital Economy Database n = 27,200
Top Related