


Languages
Pages
Legal


- SANDIA REPORT ~lcflorlc~SAND95-2141 ● UC-404
‘ Lh!imited Releaset l%,,qcj October 1995
*
1[I Illlllllllllllllllllllllllllulllll
%NI)IA NATION(ILLABORATORIES
TECHNIC(IL LIERfIRY
Fundamental Science of Nanometer-Size Clusters
J. P. Wilcoxon, P. P. Newcomer, G. A. Samara,E. L. Venturini, R. L. Williamson
Preparedby,—Sandia NationalLaboratoriesAlbuquerque,New Mexico87185 and Livermora,California94550br the UnitedStates Departmentof EnergyunderContractDE-AC04-94AL85000
Approvedfor publicrelease; distributionis unlimited.
----

Issued by Sandia National Laboratories, operated for the United StatesDepartment of Energy by Sandia Corporation.NOTICE: This report was prepared as an account of work sponsored by anagency of the United States Government. Neither the United States Gover-nmentnor any agency thereof, nor any of their employees, nor any of theircontractors, subcontractors, or their employees, makes any warranty,express or implied, or assumes any legal liability or responsibility for theaccuracy, completeness, or usefulness of any information, apparatus, prod-uct, or process disclosed, or represents that its use would not infringe pri-vately owned rights. Reference herein to any specific commercial product,process, or service by trade name, trademark, manufacturer, or otherwise,does not necessarily constitute or imply its endorsement, recommendation,or favoring by the United States Government, any agency thereof or any oftheir contractors or subcontractors. The views and opinions expressedherein do not necessady state or reflect those of the United States Gover-nment,any agency thereof or any of their contractors.
Printed in the United States of America. This report has been reproduceddirectly from the best available copy.
Available to DOE and DOE contractors fiwmOfiice of Scientific and Tbchnical InformationPO Box 62Oak Ridge, TN 37831
Prices available from (615) 576-8401, P’I’s 626-8401
Available to the public fromNational Tbchnical Information ServiceUS Department of Commerce5285 Port ROy$dRdSpringfield, VA 22161
NTIS price codesPrinted copy A04Microfiche copy AO1
●
9

SAND95-2141Unlimited Release
Printed October 1995
DistributionCategory UC-404
FUNDAMENTAL SCIENCE OFNANOMETER-SIZE CLUSTERS
J. P. Wilcoxon, P. P. Newcomer, G. A. SamaraNanostructures & Advanced Materials Chemistry Department
E. L. VenturiniAdvanced Materials Physics & Devices Department
R. L. WilliamsonLiquid Metal Processing Department
Sandia National LaboratoriesAlbuquerque, NM 87185
Abstract
This research has produced a variety of monodisperse, nanometer-sizeclusters (nanoclusters for short), characterized their size and crystalstructure and developed a scientific understanding of the size dependenceof their physical properties. Of specific interest were the influence ofquantum electronic confinement on the optical properties, magneticproperties, and dielectric properties. These properties were chosen bothfor their potential practical impact on various applications identified in theNational Critical Technologies list (e.g., catalysis, information storage,sensors, environmental remediation, ...) as well as for their importance tothe fundamental science of clusters. An Executive Summary provides adescription of the major highlights.

Table of Contents
Executive Summary .. . . . . . . . . . . . . . . . . . . . . . . . . . . . . . . . . . . . . . . . . . . . . . . . . . . . . . . . . . . . . . . . . . . . . . . . . . . . . . . . . 3
*
●
I.
II.
III.
IV.
v.
VI.
VII.
htroduction . . . . . . . . . . . . . . . . . . . . . . . . . . . . . . . . . . . . . . . . . . . . . . . . . . . . . . . . . . . . . . . . . . . . . . . . . . . . . . . . . . . . 6
Synthesis and Processing of Nanosize Clusters inInverse Micelles . . . . . . . . . . . . . . . . . . . . . . . . . . . . . . . . . . . . . . . . . . . . . . . . . . . . . . . . . . . . . . . . . . . . . . . . . . . . . . . 9
A. Clus&r Synthesis . . . . . . . . . . . . . . . . . . . . . . . . . . . . . . . . . . . . . . . . . . . . . . . . . . . . . . . . . . . . . . . . . . . . . . ...9B. Cluster Separation mdhtification . . . . . . . . . . . . . . . . . . . . . . . . . . . . . . . . . . . . . . . . . . . . . . . . . . ..ll
Optical Properties of Semiconductor Clusters:S~ong Qumtum Confinement EffecW . . . . . . . . . . . . . . . . . . . . . . . . . . . . . . . . . . . . . . . . . . . . . . . . . . . ..l9
A. Synthesis and Ch~acterimtion of MoS2Clusters . . . . . . . . . . . . . . . . . . . . . . . . . . . . . . . . . ..2OB. @tical Propefiies and Physics of MoS2Clusmrs . . . . . . . . . . . . . . . . . . . . . . . . . . . . . . . . ...22C. Other Semiconductor Clusters . . .. . .. . .. . .. . .. . .. . .. . .. . .. . .. . .. . .. . .. . . .. . .. ... . .. . .. ..3O
Magnetic Propeties of MeMl Cluskrs . . . . . . . . . . . . . . . . . . . . . . . . . . . . . . . . . . . . . . . . . . . . . . . . . . ...33
A. Synthesis and Size Control of cx-Fe Clusters ...... .. ... ... ... ..... ... ... ...... .. .....33
B. Magnetic Pro~fiiw ofa-Fe Causers . . . . . . . . . . . . . . . . . . . . . . . . . . . . . . . . . . . . . . . . . . . . . . ...37C. Control oftie C~stal S~cture of Cluskrs . . . . . . . . . . . . . . . . . . . . . . . . . . . . . . . . . . . . . . . . ..4l
Dielatic Pro~fies of Clusters . . . . . . . . . . . . . . . . . . . . . . . . . . . . . . . . . . . . . . . . . . . . . . . . . . . . . . . . . ...45
A. The Dielectric Constants of Metallic Clusters .... ...... ........ .......................45B. Theoretical Considerations . . . .. . .. . . . . . . . . . . . . . .. . . .. . . . . . . . . . . . . . . . . .. . . .. . . . . .. .. . . ...46C. Results and Discussion: Poland Au Clusters . . . . . . . . . . . . . . . . . . . . . . . . . . . . . . . . . . . . . ...49D. Semiconductor Clus~rs . . . . . . . . . . . . . . . . . . . . . . . . . . . . . . . . . . . . . . . . . . . . . . . . . . . . . . . . . . . . . . ...55
Optical Properties of Metallic Clusters . . . . . . . . . . . . . . . . . . . . . . . . . . . . . . . . . . . . . . . . . . . . . . . . . . ...56
A. Elemenbl Clusters . . . . . . . . . . . . . . . . . . . . . . . . . . . . . . . . . . . . . . . . . . . . . . . . . . . . . . . . . . . . . . . . . . . . ...56B. Composite Clusters . . . . . . . . . . . . . . . . . . . . . . . . . . . . . . . . . . . . . . . . . . . . . . . . . . . . . . . . . . . . . . . . . . . ...59
Future Research Directions . . . ... .. . . .. . . . . . .. . . .. ... . . . . . .. . . . . .. . . . . . .. . . . . . .. . . . . . .. . . . ...64
Acknowledgments . . . . . . . . . . . . . . . . . . . . . . . . . . . . . . . . . . . . . . . . . . . . . . . . . . . . . . . . . . . . . . . . . . . . . . . . . . . . . . . ...64
References .... . . . . . . . . . . . . . . . . . . . . . . . . . . . . . . . . . . . . . . . . . . . . . . . . . . . . . . . . . . . . . . . . . . . . . . . . . . . . . . . . . . . . ...65
Appendix .. ... . . . . . . . . . . . . . . . . . . . . . . . . . . . . . . . . . . . . . . . . . . . . . . . . . . . . . . . . . . . . . . . . . . . . . . . . . . . . . . . . . . . . . ...68
.
#

Executive Summary
The overall objective of this Laboratory-Directed Research and Development (LDRD)
program was to capitalize on our recently-developed inverse micellar synthesis approach
to produce a variety of monodisperse, nanometer-size clusters (nanoclusters for short),
characterize their size and crystal structure and develop a scientific understanding of the
size dependence of their physical properties. Of specific interest is the influence of
quantum electronic confinement on the optical properties, magnetic properties, and
dielectric properties. These properties were chosen both for their potential practical
impact on various applications identified in the National Critical Technologies list (e.g.,
catalysis, information storage, sensors, environmental remediation, ...) as well as for
their importance to the fundamental science of clusters. This report will show that we
have produced some unique materials and have made considerable progress towards the
stated ends.
In our approach, nanoclusters are grown inside inverse micellar cages in non-
aqueous solvents. Inverse micelles are formed when surfactant molecules are dispersed
in a non-polar (e.g., octane, oil) continuous medium. In such a medium, the hydrophilic
ends of the surfactant molecules avoid the oil and form cages whose sizes typically range
from 1 to 10 nanometers depending on the choice of surfactant and solvent. The polar
interiors of these cages are capable of dissolving salts (without the addition of a polar
solvent -- a unique feature of the Sandia process) and serve as the nanoscale reactors in
which chemical reactions take place.
Highlights of the work areas follows:
● Several semiconductors nanoclusters including MoS2, WSe2, CdS and Ti02
were synthesized and studied with emphasis on MoS2 as a model system. The
dependence of its optical properties on cluster size is qualitatively representative
3

of the other semiconductor nanoclusters, hut its layered crystal structure and high
potential for applications in catalysis and photocatalysis made it a unique and
challenging choice. Key results include the observation and interpretation in
terms of the electronic structure of (1) heretofore unseen and well-defined
features in the absorption spectra reflecting the underlying physics as well as the
high quality and monodispersity of our clusters; (2) large blue shifts in the
absorption spectrum with decreasing cluster size resulting from electronic
quantum confinement and affording great tailorability of the bandgap; and (3) a
beautiful demonstration of the crossover from band-like (solid) to molecule-like
spectra as the size of the cluster becomes smaller than that of the Bohr radius of
the exciton (rB = 2.0 nm) in the bulk.
● Iron (Fe), nickel (Ni) and cobalt (Co) nanoclusters were grown, but Fe (et, or
bcc phase) was the model system studied in most detail. The saturation
magnetization, remnant magnetic moment and superparamagnetic blocking
temperature are strong functions of cluster size and differ considerably from
literature results which are plagued by the presence of a surface oxide layer on the
Fe cluster core and poor control over cluster size. Our results appear to be the
only results on pure (x-Fe clusters.
● We demonstrated for the first time the ability to reproducibly control the crystal
structure of a nanocluster by the choice of surfactant and solvent. We grew both
et-Fe and y (fee structure)-Fe nanoclusters x room temne ratu~. In bulk form cx-
Fe is the normal equilibrium phase which transforms to the high temperature y-Fe
phase at961 ‘K. y-Fe has remarkably different magnetic properties from those of
a-Fe.
● Studies of the dielectric properties of gold (Au) and palladium (Pal) nanoclusters
suggest significant enhancements in the electronic polarizabilities of these
materials due to quantum confinement; however, this highly significant result
(from both theoretical and experimental considerations) must be considered
tentative because of the presence of some residual ionic species in the samples
studied. The real part of the dielectric constant (G’) deduced from our
measurements is ~gativ~ for both clusters, as is expected for metals. We do not
see evidence of the puzzling large positiv? c“S recently reported for larger (250
nm) metallic clusters.
*
*
4

“ We have demonstrated relatively large blue shifts in the plasmon resonances of
Au and silver (Ag) nanoclusters with decreasing cluster size below -10 nm. The
shifts are larger than what is predicted by current theory. We have also
succeeded in growing composite nanoclusters consisting of a Au core and Ag
capping layer, or vice versa, and demonstrating that the capping layer has a
strong influence on the optical properties.
c By growing a wide variety of metal and semiconductor nanoclusters, we have
significantly improved the reproducibility and size control of the inverse micellar
synthesis process.
“ To separate the nanoclusters from residual species and reaction byproduct
species, we have established a new high pressure liquid chromatography
capability with on-line optical diagnostics. This separation/purification capability,
which has allowed us to observe previously unobserved features in the optical
properties of many nanoclusters, is unique to Sandia and represents a highly
significant advance in the field of nanoclusters.
Finally, in this LDRD-funded work we have produced some of the highest quality
nanoclusters available as well as new nanoclusters and developed a considerable
understanding of the dependence of their optical, magnetic and dielectric properties on
cluster size. The results have pointed out the richness of the science in this field which
has great technological promise. We have just barely scratched the surface; much of the
scientific and technological excitement lies ahead.

I. Introduction
Nanometer-size clusters (or nanoclusters) offer exciting opportunities in materials
science, a point recently emphasized by the DOE Council on Materials Science in a Panel
Report.[ 1] These opportunities stem from the strong size dependence of the optical,
electronic, and magnetic properties of nanoclusters, which are due to spatial confinement
of the electrons, the large fraction of surface atoms, and/or differences in crystal structure
from the bulk material. Progress in these areas, however, has awaited the ability to
produce significant yields of monodisperse clusters that are surface-stabilized against
aggregation.
As part of an engineering science project on catalysis, [2] we developed a unique
synthesis process, based on using inverse micelles as reaction vessels, that meets these
requirements for clusters down to - 10-15 ~ in size composed of a wide variety of
materials. This process provided the basis for this Laboratory-Directed Research and
Development (LDRD) program.
The overall objective of this LDRD program was to capitalize on our inverse micellar
synthesis approach to produce a variety of monodisperse, nanoclusters, characterize their
size and crystal structure and develop a scientific understanding of the size dependence of
their physical properties. Of specific interest are the size dependence of optical
properties, magnetic properties, dielectric properties and superconductivity. These
properties were chosen both for their potential practical impact on various applications
identified in the National Critical Technologies list as well as for their importance to the
fundamental science of clusters. This report will show that we have produced some
unique materials and have made considerable progress towards the stated ends. During
the oral presentation of this proposal prior to its funding, members of the Technical
Advisory Team (TAT) expressed concern that we were proposing to do too many things
for the proposed level of funding. In view of this concern, we agreed to de-emphasize
the study of superconductivity of clusters unless time permitted us to do so during the
second year. As it turned out, we were not able to study this interesting area with the
exception of demonstrating that we can synthesize nano-size niobium nanoclusters. We
hope to study their superconducting properties in future work.
.
The report is organized as follows. In Sec. II we review briefly the synthesis and
processing of nanoclusters in inverse micelles. In this process the clusters are produced
6

in solution in a nonpolar (oil) medium which generally contains excess surfactant,
residual salts and reaction byproducts. In the latter phases of this program it became
clear that for some of our studies it was necessary to separate the clusters from the
residual and byproduct species. Toward this end we developed a new high pressure
liquid chromatography capability with on-line optical diagnostics. This capability, which
was recently implemented and is discussed in some detail in Sec. II, has resulted in
heretofore unseen features in the optical spectra of several clusters. We believe that this
capability is unique to Sandia and represents a highly significant advance in the field of
nanoclusters.
Section III deals with the optical properties of semiconductor nanoclusters. We
synthesized and studied several clusters (some for the first time) including MoS2, WS2,
CdS and Ti02. In Sec. III we concentrate on MoS2 as a model system. The dependence
of its optical properties on cluster size is qualitatively representative of other
semiconductors, but its layered crystal structure and high potential for applications in
catalysis and photocatalysis made it a unique and challenging choice.
Section IV covers magnetic nanoclusters. We have grown iron (Fe), nickel (Ni) and
cobalt (Co) clusters, but Fe was our model system and was studied in some detail. In
this work we demonstrated for the first time the ability to control not only size but the
crystal structure, synthesizing both a-(bee)- and ‘y-(fee)-phase Fe clusters. et-Fe
clusters prepared by other techniques have been studied by other workers, but such
clusters invariably consist of an oxide layer (of generally unknown thickness and
composition) and an Fe core. Our clusters represent the first oxide-free Fe nanoclusters,
and, as will be shown, their magnetic properties differ significantly from those in the
literature.
The dielectric properties of metallic nanoclusters are discussed in Sec. V. Emphasis
is on palladium (Pal) and gold (Au) clusters which were studied in both liquid and
polymeric matrices. The results suggest enhancement in the electronic polarizability due
to quantum confinement, but this highly significant result (from both experimental and
theoretical considerations) must be considered tentative at this time because of the
presence of some residual ionic species in the samples studied. In future studies we shall
repeat the measurements on chromatographically-purified samples to confirm the results.
Section VI deals with the optical properties of metallic nanoclusters. We have
investigated Au, silver (Ag), Fe and Pd clusters. Some results on Au and Ag will be
7

presented to illustrate the dependence of the plasmon resonance on cluster size. A unique
feature of our work is the synthesis of composite metal clusters and the study of their
optical properties. We illustrate this aspect of the work by results on clusters consisting
of Au cores and Ag shells or vice versa.
Finally, Sec. VII provides some concluding remarks on future directions of this
work. In many respects we have just barely scratched the surface. The work
accomplished under this LDRD program has been exploratory in nature. It has produced
some of the highest quality clusters available as well as new clusters, and it has pointed
out the richness of the science in this field of science.
.
8

II. Synthesis and Processing of Nanosize Clusters In InverseMicelles
A. Cluster Svnthesis
We have developed a new method for the formation of nanosize metal clusters in
organic media and have recently obtained a patent on this technique. [3] Our intent in our
earlier work was to employ these clusters as unsupported catalysts for in situ chemical
reactions such as coal liquefaction, removal of sulfur from coal, and for other catalytic
applications. [4,5] In the present work we have improved the process and extended it to
the formation of a variety of elemental and compound clusters.
Metal clusters are prepared in the microheterogeneous environment of an inverse
micelle solution. [5] Inverse micelles are defined as surfactant aggregate clusters
(droplets) surrounded by an oil-like continuous environment. Polar molecules such as
water are often dissolved in the interior of these micelles forming solutions called
microemulsions. These solutions are clear because the droplet sizes are very small,
typically 2-20 nm, so they do not scatter light strongly. In our method, we use the polar
interiors of the micelles to directly solubilize metal salts (e.g. PdC12). Our process is
shown schematically in figure 1.
< <
Figure 1. Scheme for formation of a palladium metal cluster in an inverse micelle.
Typical interior micelle size of 1-5 nm is indicated. The squiggly hydrocarbon tail
groups form an interface with the continuous oil medium.
9

For most metals no water is used in the solubilization process. The resulting
solution is colored but transparent, demonstrating the microscopic size of the metal salt
encapsulated droplets. These precursor solutions are truly remarkable since they are
homogeneous, stable, transparent dispersions of charged metal ions in oil! Several
methods of reduction may then be used to reduce the metal cation to the zero valence
state. Controlled nucleation and growth in the interior of the micelle droplet occurs
which typically results in a small metal cluster (typical size 1-20 rim). The micelle
environment allows both size control and stabilization of the final clusters against
unwanted aggregation. The surfactant, being a surface active organic molecule, adheres
to the metal cluster preventing aggregation, ye~ might still allow access to the surface for
catalytic reactions.
An inert oil environment also enables unique reduction chemistry. For example,
sodium or lithium metal dispersions may be used for the reduction of the metal ions. We
have applied this reduction method for metal ions which cannot be easily reduced by
conventional chemical agents such as Si(IV). Such strong agents ensure complete
reduction to the zero valance state.
Clusters of compounds such as metal sulfides and oxides can be formed by
mixing two precursor micelle solutions, e.g. Fe(C10)2 and Na2S, which would
ordinarily form a bulk precipitate of FeS2. We also used H2S gas as a sulfiding agent.
Metal oxides (e.g. Ti02) maybe formed by forced hydrolysis of a metal ion (e.g. TiC14)
using a base such as NaOH.
Heterogeneous nucleation and growth of one material on another nanosize
material has also been demonstrated as part of this program. In this process a seed
population of small clusters (e.g. Fe) is first prepared as outlined above and subsequently
coated with another metal (e.g. Ir). Potentially, this could allow, for example,
disposable catalysts to be developed, (such as Pt or Ir on Fe or Ni), which is a major
economic requirement for any successful coal liquefaction process.
It is interesting to note that in the absence of special interrnicellar interactions (i.e.
phase boundaries), the final cluster size closely reflects that of the precursor micelle.
This is because only clusters smaller than the micelle interior diameter can be solubilized
in the hydrophilic micelle interior. In general, our micellar synthesis method allows a
much greater variety of sizes, types of materials, and concentration ranges than classical
methods for colloid formation in homogeneous solution.
●
.
.
10

B. Cluster Separation and purification
One of the characteristics of our inverse micellar synthesis approach is the
presence of reaction byproducts such as inorganic ion pairs and excess surfactant in the
final solution containing the clusters. While we were able to study many properties of
the resulting clusters in the presence of these various species, it became clear in the latter
phases of this work that for some studies it is necessary to separate them from the
clusters.
In a previous SAND report[2], we described simple methods based upon micelle
phase separation in which ionic byproducts could be removed from nonionic ones,
including the clusters. This is illustrated schematically in figure 2. Using GC/MS of the
two coexisting phases shown in this figure, we determined that only 80% of the
surfactant could be removed by this process so we undertook as part of the present work
the development of new methods of high pressure liquid chromatography to separate the
desired products (clusters) from reactants (surfactants, oils, and inorganic salts). We
believe that this development is highly significant for the future study and utilization of
clusters grown by inverse micellar and other solution methods.
Because inorganic clusters with sizes small enough to penetrate the typical pore
sizes of commercially available chromatography columns were not available prior to our
work, villually nothing is known about the interactions between such inorganic materials
and typical organic column materials. Conventionally, two types of retention
mechanisms take place in typical chromatographic separations. In the first, called size-
exclusion chromatography, molecules are sorted by their ability to penetrate into the
pores of the column. Small molecules spend proportionally more time in these pores
and thus elute from the column later than large ones. The most important aspect of these
columns is lack of specitlc physio-chemical interactions between the column material and
the molecules being separated. The second type of retention mechanism is due to a
chemical attraction between the solid column material and the molecule. Such columns
can easily separate identically sized molecules such as toluene and o-xylene, for example.
For our new inorganic clusters it is critically important to understand the mechanism of
interaction with various column materials. These size exclusion columns are of two basic
material types which we now discuss.
11

raiseb
temperature
reduce to form
metal clusters.
Two phase Inverse Homogeneous, single phaseMicelle System with Inverse Micelle system
Metal Salt Encapsulated with Metal Salt lower temperature
Micelles in Lower Phase
upper phase withmetal clusters inoil
lower phase withionic byproductsin the surfactant
Figure2. Scheme for separation ofmetal clusters from ionic byproducts using inversemicelle phase separation.
The first type of column has a porous gel (usually cross-linked microporous
polystyene) packing with user selectable pore sizes from 50 ~to several hundred
angstroms. For the clusters ofinterestto us either 50 ~orlOO~ porous gels were very
effective in separating clusters whose molecular weight differences were only 5-10%
(this corresponds to a variation of the cluster radius of only 2% for spherical clusters, a
variation which would be totally impossible to measure by any other technique save mass
spectrometry) ! For example, a 50 ~ porous column can easily separate decane from
dodecane and many of our clusters elute at times which differ only slightly from these
small molecules.
12

Calibration of these columns with molecules of known size was undertaken so
that effective cluster sizes could be obtained from the retention time and compared to
other measurements of cluster size such as TEM or light scattering. The results are
shown in figure 3 for porous organic gel columns with the pore sizes indicated. All data
were obtained with tetrahydrofuran (THF) as the mobile phase. Thus, we require our
clusters to be stable in this coordinating organic solvent. Fortunately, this is true of all
the layered semiconductor clusters tested, but it is not true of all the metal clusters (e.g.
Au) and further development is required for purification of some of these. A significant
feature to note is that either the 50 or 100 ~ columns can distinguish hydrocarbon
molecules which differ by only 2.5 ~ in size. Thus, even with only a single 30 cm long
column very good resolution of cluster size should be possible. By cascading 4 of these
columns resolution of cluster size to -2Y0 should be possible. This is a wonderful (and
very fast compared to TEM) new size characterization capability. We expected most of
our clusters to have retention times between 5 and 10 minutes for these columns and this
is indeed the case. The half widths of the eluting bands of our cluster solutions are often
as narrow as monodisperse molecules such as hexadecane (c 16) testifying to the excellent
quality of the synthesized clusters.
The cluster-size distribution may be inferred by comparison of peak elution
widths for perfectly monodisperse objects (e.g. for toluene the inherent instrument width
is At = .25 min (full-width at half height), for a polymer standard with a weight average
to number average molecular weight ratio (Mw/Mn ) of 1.05 it is .36 min. In the
chromatogram shown in figure 4 the main cluster peak is indistinguishable in shape and
half-width from the monodisperse polystyrene standards used to calibrate the column.
13

1(?
1(?
101
1 o“
!“’’’’’’ r’’’’’’’’’’ i’{’’’’’’’’”r~
~\
column pore size
‘%0 * so ,4,,M* ■ 5(10 /$
k A Mixc’d-<~
total ~
10-1permeation
I [ , I ( , I 14567891011
time(min)
Figure 3. Calibration of size exclusion columns for use in cluster purifica~ionexperiments. The mixed-C column has a variety of pores ranging in size from 100 A to2000 A.
We actually are privy to much more information than simply the retention times
which give us the average size of the cluster because the detector we use to monitor the
peaks of figure 4 is a photodiode array which captures the spectrum from 190 to 600 nm
for the entire peak in real time. This spectrum is free of all other chemical contributions
and thus is truly representative of only these clusters. The purified cluster spectrum of
MoS2 is plotted along with that of the parent solution in figure 5. All the energies of the
excitonic features are retained with many more details in the far UV revealed for the first
time for the chromatographed sample. Similarly the fluorescence emission and refractive
index changes accompanied by the passage of this group of monodisperse clusters is also
obtained.
By chromatographing the same clusters on both types of columns we can learn
much concerning both size distribution and surface structure of a population of clusters.
Such information is not available by any other technique. It appears that many cluster
properties are most easily studied by chemical techniques that are usually applied to
gargantuan polymers such as DNA and proteins, as opposed to the methods of solid state
physics. Polymers, too, can only be investigated with the aid of separation techniques
14
*
●
.

such as gel electrophoresis and chromatography. For clusters, neither purely chemical
nor physical solid-state techniques by themselves provide complete characterization.
1000
800
:600
0
! , , , , I T 1 1 , , , , , , I z , ! I r
Imain cluster band
(monodisperse),+ 1
l\)~r . . . . — . ._ . 7
0 5 10 15
time(min)
Figure 4. Chromatogram of the photodiode array (PDA) output at 350 nm vs time. Theuv impurities may be detected with either the refractive index (RI) detector or the PDAoutput at 250 nm monitored by separate in-line detectors. Also, pesky fluorescentimpurities found in nearly all samples elute at separate times from the clusters, allowingthe inherent photoluminescence from the clusters to be determined.
A second type of chromatography column consists of packed spheres of porous
silica with 100 ~-300 ~ (user selectable) pore size and with user selected organic
“bonded” phases. These phases can range from very hydrophobic such as cl 8 groups to
C4 groups and even very hydrophilic groups such as diols and just bare silica. While a
size exclusion mechanism similar to the first type of column described above is present,
retention mechanisms in these columns, even for simple molecules of the same size, such
as toluene and o-xylene, are very different and such molecules can be easily separated in
time. The separation mechanism for such columns is best thought of as differential
volubility in the solid phase of the column compared to the mobile phase. Only if there is
no volubility (i.e. chemical interaction) at all in the bonded phase will these columns
function with a strict size exclusion mechanism.
In figure 6 we show the effect of size on the absorbance onset for MoS2 clusters
synthesized by our technique and purified on a size-exclusion column. The retention
time of each group is also shown, this quantity being proportional to the size of the
15

cluster in the absence of specific interactions The shift of the bandgap from -520 nm to
-300 nm is a excellent example of the quantum confinement effect mentioned in the
introduction.
The advantage of having detector information at a wide range of wavelengths at
all times is particularly evident when identification of the cluster peak is desired. Of all
the reaction byproducts only the clusters have absorbance which exceeds 300 nm so
observation of the elution profile in both the UV (250 nm) and near the first exciton of
the cluster (350 nm) as shown in figure 7 below reveals the presence of many impurities
which separate nicely from the clusters. This separation explains our ability to observe
the inherent optical features of the MoS2 clusters as shown in figure 5.
200 250 300 350 400 450 500
wave(nm)
●
✎
Figure 5. The MoS2 cluster band of the previous figure is monitored on-line by aphotodiode array which captures all the spectral features in real time during thechromatography. Note the additional details not resolved in the parent sample beforepurification.
.
16

10°
101
10-2
10-3
, r , I I I\ I I 1 , I t I , I ! !
, 1,=6.35 min. main t.)anci. . . . . . ..- t=6.(} miI1.slJbbtiIl(l
-- t=~.~ min,sl]~~;~nd
t=9.76 min,subband
, 1 I L,... 1 t , I
200 300 400 500 600 700
wave(nm)
Figure 6. Size exclusion chromatography is used to separate small subpopulations ofclusters with various band-edge absorbance from the main population of clusters. Theshifts of the first excitonic peak from the bulk value are rather dramatic. The longestretained clusters at 9.76 min are very close in size to a toluene molecule (6-10 ~) andthus are truly molecular in nature, while the main band has a retention time comparable toa large surfactant molecule (i.e. 3 rim.). The average pore size of the column used is 100~ and the earner solvent is tetrahydrofuran (thf).
17

400
300
o
-1oo
I -- -abs(250 nm)‘1I
. . . . .. . ;ll,h{:}~() nm )
1“ ,,“il chemical byproduct
j; + impurities,
~:JJ
;i,
clusters +;/l,~~<,
‘ill 1;;~’ : :, ,,// r ,,.,;~~~ /
,/ r\-.,;,# \ ......... ‘ :“ f -..-..-......:. .. ,—.- —..- ...........$- ---? -r..::.....-->>.......h-... ...> .-
1 I
0 5 10 15
time(min)
Figure 7. Extraction of the absorbance at 350 nm (clusters) from that at 250 nm (clustersand UV-impurities) shows where the clusters elute.
.
18
III. Optical Properties of Semiconductor Clusters: StrongQuantum Confinement Effects
Many of the most interesting physical properties of clusters area consequence of the
spatial confinement of their electrons, and much recent research is aimed at understanding
the evolution of clusters properties with cluster size. Especially interesting are the
manifestations of electron and hole confinement in semiconductor clusters as the cluster
size decreases below the excitonic Bohr radius, and the electronic band structure gives
way to discrete molecule-like electronic states. These effects have been studied
experimentally and theoretically mostly in groups II-VI semiconductors (CdS, CdSe,
CUC1, etc.) and to a much lesser extent in groups IV and III-V semiconductors (Si and
GaAs) and other matenals.[1 ,6]
We have synthesized and studied several semiconductor clusters (some for the first
time) including MoS2, WS2, PbS and Ti02. In this section we shall focus on MoS2 as
a model system. Our choice of MoS2 was motivated by both applied and scientific
interest. On the scientific side, bulk MoS2 crystallizes in a hexagonal layered structure
(P63/mmc-D46h) composed of sheets of Mo atoms sandwiched between sheets of S
atoms in a S-MO-S arrangement. The S-MO-S sandwiches are held together by weak van
der Wads forces and are stacked along the c-axis with two sandwiches per unit cell
(c=l 2.3 ~). Given this interesting layered structure and a novel synthesis method in
which clusters are grown inside inverse micellar cages, [2,3] a number of questions were
of interest: will clusters of MoS2 in the <10 nm size range form? Can the size of such
clusters be controlled? Will these clusters exhibit novel properties and strong electron
confinement effects?
MoS2 has numerous applications as a catalyst. For example, we are interested in the
potential of MoS2 as a hydrogenation catalyst for the conversion of coal to liquid fuels
and as an electrode material for photoelectrochemical solar cells. In the latter application
MoS2 is expected to be highly stable against photo corrosion, and in both applications,
clusters have significant advantages over bulk material.
The significant and as yet not understood feature of MoS2 and WS2 is the way
the two-dimensional structure of these materials influences the electronic properties.
Because of this anisotropy a relevant and important question is which dimension controls
the quantum confinement effects in these materials? The transverse cross-section as
measured by both size-exclusion chromatography, light scattering and TEM or the
19

thickness of the nanocluster? In fact, the careful reader will note from the previous figure
6 that the second MoS2 cluster band at 6.6 minute actually has a lower energy exciton
than the one at 6.35 nm. A strict interpretation of the shorter elution time as
representative of larger overall cluster volume, (the characteristic which controls the
elution time and makes larger objects elute earlier than smaller ones), would suggest that
the thickness of the clusters at 6.35 minutes might be less than those at 6.6 minutes, but
have a larger cross-section and a larger overall volume. The question is particularly
relevant since recent STM measurements by our collaborator David Kelley at Colorado
State have indicated some clusters are only one sandwich layer thick but are significantly
larger in the orthogonal directions.
A. Svnthesis and Characterization of MoS~ Clusters
The clusters for the optical studies were grown inside inverse micellar cages in
non-aqueous solvents. MoS2 clusters are formed by first dissolving a molybdenum (IV)
halide salt inside the surfactant cages (both nonionic and cationic surfactants may be
used) and then combining this solution with another inverse micelle solution containing a
sulfiding agent (e.g., metal sulfide or H2S). All preparations were done in a Vacuum
Atmospheres dry box with catalytic oxygen and water removal to prevent degradation of
the Mo (IV) salt precursor. Both oxygen and water levels were monitored and kept below
1 ppm during the reaction. The Mo:S ratio was chosen to be 1:2 or less. [3] Beautifully
clear suspensions varying in color from nearly colorless for the smallest clusters (< 2 nm
in diameter) to deep blue for the larger clusters (- 15 nm) are obtained. The cluster size is
varied by using different sized micellar cages to encapsulate the Mo salt. These cluster
suspensions are remarkable for they are homogeneous, stable and transparent dispersions
of MoS2 clusters in a non-polar fluid. When the reaction stoichiometry exceeds 2:1 in
S:MO then electron diffraction and x-ray diffraction show the expected bulk hexagonal
structure as shown in the selected area diffraction (SAD) pattern of figure 8. High
resolution TEM (HRTEM) lattice fringe images of 3.2 nm MoS2 reveal excellent
crystalline order and lack of point and line defects as shown in figure 9. However,
studies of structure on clusters with sizes less than 3 nm are very difficult as there are
simply not enough atoms in bulk lattice positions to give a significant diffraction signal,
nor many reflections. Thus, the structure of the smallest, molecular-like clusters remains
unresolved.
●
20

Figure 8. SAD of 4.5 nm MoS2 clusters grown in an inverse micelle solution shows thebroad diffuse rings and lattice symmetry expected for a hexagonal structure.
Figure 9. High resolution image of 3.2 nm MoS2 clusters shows the excellent crystalorder and lack of point and line defects.
21

B. O~tical Properties and Phvsics of MoS~ Clusters
Figure 10 shows the optical absorption spectra of 4.5 nm and 2.5 nm diameter
MoS2 clusters dispersed in acetonitrile at concentrations of -10-3 molar and compares
the results with those of bulk single crystals (inset). These spectra, which were measured
at 290 K, exhibit well-defined features which we now wish to discuss.
First we review briefly the spectrum of bulk MoS2. This spectrum, which has
been studied extensively [7,8] and compared with results of electronic band structure
calculations, [9] consists of a series of absorption thresholds. The first threshold
corresponds to weak absorption in the near IR at -1040 nm (- 1.2 eV) (not shown)
associated with an indirect gap between r and the middle of the Bnllouin zone between r
and K. The second threshold occurs at -700 nm and is associated with a direct transition
at the K point. The two sharp peaks (A and B) on the high energy side of this threshold
are excitonic transitions (K4-K5 and K 1-K5, respective y) whose energy separation
(-O. 18 eV) is due to the spin-orbit splitting of the top of the valence band at the K
point. [9] A third threshold at -500 nm is due to a direct transition (specifics unknown)
from deep in the valence band to the conduction band. Excitonic features (C and D) are
also associated with these transitions. A fourth threshold at - 350 nm is also due to
transitions from deep in the valence band. Features on the high energy side of this
threshold (labeled X our own notation, and E in Fig. 10) are seen in thin samples. The
relative intensities of peaks A and B, C and D, and X and E are known to vary with
sample thickness as well as quality. [7,8]
The spectrum of the 4.5 nm clusters in Fig. 10 is rich in spectral features, the
most prominent of which we have labeled 1 through 5. Multiple maxima in the
absorption spectra of clusters can be due to either specific electronic transitions in
monodisperse clusters or to the presence of structured size distribution (e.g., magic
numbers) of clusters in a given sample. In the present case, however, comparison of
spectra on several samples shows no evidence for structured size distributions, and thus
the features in the spectrum are intrinsic properties of monodisperse clusters and attest to
the high quality of our clusters. The clusters are highly crystalline with little or no
lattice defects as shown in the higher resolution TEM of figure 9.
4
22

3.2
2.8
s~ 24w
20
/
,
●
✎
✎
3
2
1
(a)
4.5 nm Cluster
b *) 400 600 808”0’
VVaveIength(rim)1
MoS2 Clusters
.i
d =2.6 n;’t.
.. \
9“” 9’”””’-’>”’
●
-
00 4;0300 ‘- 500 60
.
0Wavelength (rim).
Figure 10. Optical absorption spectra of 4.5 and 2.5 nm MoS2 clusters (absorbance inarbitrary units). Inset (a) compares the spectrum of the 4.5 nm clusters to that of bulkthin (dotted) and thick (dashed) crystals (Refs. 7 and 8). Inset (b) shows the dependenceof the absorption threshold at the K point on cluster size.
23

Comparison of the spectrum of the clusters to that of the bulk crystal reveals two
main features: (1) a large blue shift for the clusters, and (2) preservation of the excitonic
features in the spectrum of the clusters. In fact, a detailed comparison of this spectrum to
that of the bulk crystal allows an essentially one-to-one association of the features in both
spectra (inset Fig. 10). First, it seems certain that feature 1 (k = 470 nm) in the cluster
spectrum is associated with excitonic peak A (k= 665 nm) of the bulk, corresponding to
a blue shift of 0.78 eV due to the quantum size confinement effect of the 4.5 nm clusters.
If we then, as a rough approximation, assume that all of the other peaks of the bulk
crystalline spectrum are blue shifted by the same amount, then their energies in eV(nm)
would be: B=2.86 (434), C=3.45 (360); D=3.90 (318), X=4.50 (276), and E=5.30
(234). For comparison, features 2, 3, 4, and 5 in the spectrum of the 4.5 nm clusters
have energies of 2.92 (425), 3.24 (382), 3.92 (317) and 4.5 l(275),respectively. It is
seen that these latter energies are close to the expected shifted positions of peaks B, C, D
and X (the biggest difference being for peak C), thereby providing an argument for the
one-to-one association of these features. Our assumption that all the peaks in the single
crystal spectrum blue shift equally in energy upon going to the clusters cannot, of course,
be strictly correct as different parts of the band structure (or Brillouin Zone) should be
affected differently by quantum size confinement due to differences in effective masses.
In reality, however, the above analysis shows that this assumption is not far wrong for
MoS2 which implies, in the context of simple models, that the effective mass must not
vary strongly among the various points of the Brillouin Zone involved in the observed
optical transitions. Despite any uncertainties in the above association of spectral features,
the important point we wish to make is that the absorption spectrum of the 4.5 nm
clusters is essentially bulk like.
The above conclusion that features 1 to 5 in the spectrum of the 4.5 nm clusters
derive from features in the bulk single-crystal spectrum is consistent with the fact that
these clusters are somewhat larger than the size of the exciton (radius rB=2.O nm) in bulk
Mos2. For these clusters there are apparently sufficiently high densities of states in the
conduction and valence bands to make it possible to produce bulk band-like features in
the absorption spectrum and thereby preserve the quasiparticle character of the excitons.
Thus, the spectrum of the 4.5 nm clusters reflects in a beautiful manner size quantization
of excitonic features in the weak-to-moderate confinement regime (cluster radius R >
rB).The above results also strongly indicate that 4.5 nm MoS2 clusters retain the bulk
hexagonal crystal structure of this material.
Turning next to the spectrum of the 2.5 nm clusters in Fig. 10, we note that this
spectrum is qualitatively different from that of the 4.5 nm clusters and of the bulk crystal.
24

Specifically, on going to the 2.5 nm, clusters, the excitonic features in the spectrum give
way to a ladder of three well-defined peaks over the spectral range covered. This is the
expected behavior in crossing over from the weak (excitonic) confinement regime to the
strong (non-interacting carrier) confinement regime where the cluster size (in this case R=1.25 nm) is considerably smaller than the excitonic Bohr radius (rB = 2 rim). For these
very small clusters the low densities of states prevent observation of excitonic features,
and the allowed energy levels change from continuous bands to a ladder of essentially
discrete levels as in molecular systems as shown in figure 11. Figure 12 shows that the
spectrum of 3.0 nm MoS2 clusters is very similar to that of the 2.5 nm clusters reflecting
this ladder of discrete levels. This result indicates that the crossover from solid-like to
molecule-like behavior occurs at a cluster size between 4.5 and 3.0 nm. Comparison of
the spectra in Figs. 10 and 11 shows only relatively small blue shifts of the absorption
peaks in going from 3.0 to 2.5 nm clusters. This trend was manifested by a third sample
with 2.0 nm clusters. Thus, it appears that the absorbance blue shift levels off in this (3 -
2 nm) size range.
That this leveling-off in the shift occurs in the size range where the clusters
become molecule-like is not surprising and strengthens the assertion that the optical
properties of these clusters are indeed molecule-like. The ladder of peaks in the
absorption spectra of the clusters in this size range then corresponds to transitions to
various excited molecular states with some vibrational broadening as illustrated in figure
12. We note here that a qualitatively similar leveling-off in the blue shift has been
reported for small PbS clusters in what is also believed to be the molecular range.
A variety of theoretical models have been used to describe size quantization of the
energy spectrum of the carriers in semiconductor clusters. These models, which express
the size dependence of the energy of the excited states in terms of the bulk energy gap,
the kinetic energy, Coulomb interaction and correlation energy of the electron-hole (e-h)
pairs, have been recently reviewed by Yoffe.[6] They include the initial effective mass
(EM) treatment of Efros and Efros[lO] and later improvements by Brus,[l 1]
Kayanuma[ 12] and others, semi-empirical tight binding treatments and recent empirical
pseudo potential methods. Despite their shortcomings, the EM models contain some of
the essential physics and provide a qualitative framework for examining experimental
data and their trends. In terms of these models, and in the size regime where quantum
confinement effects are prominent, the shift of the absorption edge, or bandgap, E(R) of
a cluster of radius R relative to that of the bulk is to a reasonable approximation
proportional to l/2vR2 where ~ is the reduced mass of the exciton.[ 13,14] A plot of
E(R) vs. l/R2 should then yield a straight-line with slope a l/(2y). Such a plot for the
25

sharp absorption threshold at the K point of the zone (Eg- 1.74 eV in the bulk) for our
clusters is shown in the inset of Fig. 10 and is linear for clusters larger than 3 nm in
diameter. The linear portion yields v = 0.16 mo,where m. is the free-electron mass.
Interestingly, this value compares favorably with the bulk value of the reduced mass of
0.18 m. for the A exciton deduced from optical measurements along the optic c-axis of
the crystal. [8] While we cannot rule out the possibility that this agreement between the
two values of ~ may be fortuitous, it suggests that simple EM models capture some of
the essential physics for MoS2 clusters.[ 13]
conduction, /—
discrete
\ band P bands
—s
band gapdecreasingsize +
Ivalance ‘\ —s
band p discrete
—dbands
Figure 11. Continuous bands become discrete while valance and conduction band edgeschange energy as the cluster size decreases. The structured features in the spectra of the2.5 and 3.0 nm clusters in Figures 10 and 12 are due to the discrete nature of the opticaltransitions in small clusters.
26

5
4
3
2
1
0
[ I I I 4 X10⁴
3 xl 04
c
2 xl 04 “;.-$
1 xl 04
0200 300 400 500 600 700
Wavelength (rim)
Figure 12. Photoemission from 3.0 nm MoS2 clusters is broad and relatively weak andoccurs primarily from trapped surface states. Little difference in the absorbance orphotoemission is observed compared to the 2.5 nm clusters of figure 10.
Figure 12 also shows the room temperature emission spectrum for the 3.0 nm
diameter clusters excited at 476 nm. In this early study we did not observe any
luminescence due to direct e-h recombination near the absorption threshold for any of the
clusters. Rather, the spectrum consists of a blue-shifted (relative to bulk emission),
broad emission peak centered at 537 nm which is characteristic of surface and/or defect
recombination. For these 3.0 nm clusters many of the atoms lie at or near the surface, the
surface states associated with adsorbed species dangling bonds and other defects can be
expected to play a major role in determining the fate of the carriers produced by light
absorption.
A significant issue in studying the photoemission and photoexcitation behavior of
nanoclusters is the role of solvent impurities in the observed spectra. The spectrum in
figure 12 was obtained on as-synthesized MoS2 clusters with all the chemical byproducts
of the synthesis still present. To investigate these clusters further, we purified the
clusters by chromatography and then trapped them on-line in our fluorescent detector.
We then scanned both the photoemission as a function of excitation wavelength and the
photoexcitation while monitoring the peak of the photoemission.
The results of such experiments are shown in figures 13 and 14 and reveal
several features which had not been observed previously in these clusters. First, we
confirmed that the photoemission observed in figure 12 was inherent to the clusters and
27

not an artif~ct of chemical impurities. The spectrum shown in figure 13 shows
photoemission at 520 nm as observed in the parent solution. In the photoexcitation
spectrum shown in this figure we observe discrete features in the UV which could not be
observed in the parent solution, both due to strong UV absorbance effects in this solution
and the fact that the excitation lamp of our SPEX spectrometer cuts off at 250 nm.
We then performed photoemission experiments in which we excited at the
discrete wavelengths observed in figure 13 (specifically 225 and 245 rim). The 225 nm
excitation results, shown in figure 14, reveal photoemission from deeper states in the *
bandgap and show a distinct shoulder to longer wavelengths. These observations
indicate that a wide range of energies of either hole or electron traps exists at the surface
of nanoclusters and, since the clusters are chromagraphicall y pure, rule out the possibility
of such different traps originating in sample polydispersity.
The implication of these observations for applications such as photocatalysis is
that sites exist on identically sized, purified MoS2 clusters whose valence and/or
oxidation potentials can effect a wide variety of chemical reactions. This is true even
though these clusters have only a single, well-defined bandgap for exciton creation. It is
interesting to speculate that the disc-like layered nature of nanocluster MoS2, which
inherently provides for both edge and top/bottom-surface sites, is responsible for this
possibility. Further studies on non-layered materials such as CdS or PbS would settle
this questions more thoroughly. Indeed, preliminary studies of both of these materials as
part of another LDRD project fail to show the photoemission complexity observed in
these layered materials.
28

6 I 5excitation ---—----- e miss i{Jn
4.55 -:
,, ), 4
G ,“,, :\o 4 -:’
,’/\ 3.5 $.-
W ,,, .“ : m.,, )1
\ 3 g“: 3 :;:;,,; .,, ; : 1 [,
2.5 $,, j,: ‘t,; ~‘Wf \
2i 2\
.,” ‘\% 1.5-4._..
1 I I I I -----------------, 1200 300 400 500 600 700 800
wave(nm)
Figure 13. The photoemission and photoexcitation of 3.0 nm MoS2 clusters which havebeen chromatographically purified and trapped on-line in our fluorescence detector. Theemission was obtained using 425 nm excitation, while the excitation was scanned at theemission peak of 520 nm. -
30
25
20
15
10
5
02
40
35
30
25
20
15
10
5
000 250 300 350 400 450 500 550 600
wave(nm)
Figure 14. The photoemission of chromatographically purified 3.0 nm MoS2 clusterswhen excited at 225 nm is very different than observed in figure 13.
29

Finally, given the layered nature of the MoS2 structure, it is interesting to
speculate about the shape of MoS2 clusters in the size range of the present study. In its
hexagonal phase, the unit cell of MoS2 contains 2 formula units and has dimensions
a=3. 15 ~ and c=12.30 ~ yielding a unit cell volume = 317 ~3. Assuming spherical
clusters and full packing, a 4.5 nm diameter cluster would contain 150 unit cells, or 300
formula units, and a 2.5 nm diameter cluster would contain 26 unit cells, or 52 formula
units. However, the shape of the unit cell precludes full packing, and so the number of
molecules in these clusters can be expected to be considerably less. As noted above, the
4.5 nm clusters appear to retain the bulk structure, and in a spherical box these clusters
will be -4 unit cells thick. We do not know the structure of the 2.5 nm clusters, but this
size is equivalent to 2 unit cells thick. However, it is not likely that these small clusters
will have any strong semblance to the bulk structure since a stack of two unit cells does
not define a structure, additionally, as already noted, the optical spectrum of these
clusters reveals their molecular character. In all cases we envision the clusters to be disk
shaped.
In conclusion, highlights of our work on MoS2 quantum confinement include the
observation of 1 )remarkable structure in the absorption spectra reflecting the underlying
physics as well as the high quality and size mormdispersity of the clusters; 2) large blue
shifts in the spectral features with decreasing cluster size affording great tailorability of
the bandgap; and 3) a beautiful demonstration of the crossover from band-like (solid) to
molecule-like spectra as the size of the clusters becomes smaller than that of the exciton in
the bulk.
C. Other Lavered Semiconductor Clusters
Although we have not performed as extensive investigation of the other layered
semiconductor materials such as MoSe2, MoTe2, WS2, and WSe2, the optical features
and size dependent bandgap shifts noted for the MoS2 also appear to hold for these
systems. In addition, the synthetic and processing techniques employed for MoS2 also
pertain to these systems. All layered systems investigated show the structured spectra
found for MoS2. For example, WSe2 clusters show the same types of optical features as
MoS2 as shown in figure 15. Furthermore, a high degree of crystallinity is found as
shown in the high resolution lattice fringe image of figure 16.
30

10’
10°
10-’
10-2
~]
-------- t =6.3 m i II
F, (,, ....
. /.\
385 nxn 470 nm
~“ \\\ ./.f’.
4+1/
-.. .%..:.,-------
.
q, . . . . . . . . .
i
10-31’’’’ 1’’’’1’’’’’’’’’’’’’’’” “’’’’’’’”J,.200 250 300 350 400 450 500 550 600
wave(nm)
Figure 15. WSe2clusters processed by size exclusion chromatography. The larger(shorter retention time of 3.8 rein) yellow colored clusters with an excitonic peak at 470areshown inthehigh resolution TEMof the next figure. Themore strongly retained,smaller clusters (t=6.5 rein) with a first exciton at 385 are nearly clear in color due thestrong quantum confinement.
31
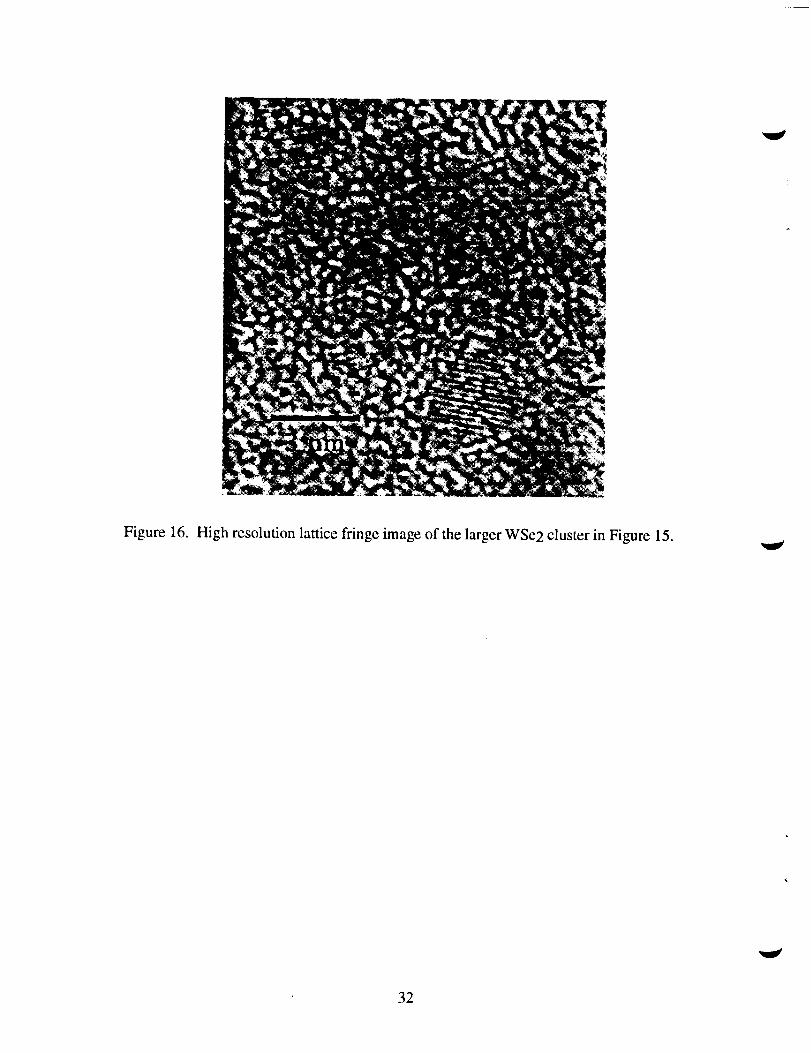
Figure 16. High resolution lattice fringe image of the larger WSe2 cluster in Figure 15.
.
.
.
32

IV. Magnetic Properties of Metallic Clusters
The properties of rim-sized magnetic particles have been studied both experimentally
and theoretically for more than sixty years.[ 15-18] Interest in these materials has
remained high because of their potential use in numerous practical applications in
magnetic recording, magnetic fluids, permanent magnets and catalysis. In addition, there
are fundamental research questions concerning the development of long-range magnetic
order and associated hysteretic properties such as coercivity and remanence as the cluster
size increases from a few atoms with all atoms at the surface to a large cluster with
predominantly interior atoms. Cluster synthesis and experimental handling play crucial
roles in understanding the magnetic properties, particularly in separating the intrinsic
properties from the effects of a surface layer[ 19-22] (such as a thin oxide shell) or
particle-particle interactions due to agglomeration [22]. Iron was chosen as our model
system because it is inexpensive and has broad potential applications as well as having
been a subject of earlier study. We have also synthesized Ni and Co nanoclusters and
initiated preliminary studies on them; however, we shall concentrate on Fe clusters in
this report.
Progress in the study and utilization of magnetic clusters has been severely
hampered by the lack of synthetic approaches for producing pure monodisperse clusters.
Here, we report initial studies on the magnetic properties of et-Fe clusters prepared by a
novel synthesis technique which yields monodisperse particles and, we believe, mitigates
both surface layer and agglomeration effects. Following are synthesis, microscopy and
experimental details, presentation of the magnetic properties and concluding remarks
placing our results in context.
A. Svnthesis and Size Control of a-Fe Clusters
Three conditions can be used to control the final cluster size: the micelle size,
interrnicellar interactions (e.g., phase boundaries which determine micelle diffusion rates)
and reaction chemistry. To provide a constant magnetic background independent of
cluster size, we have employed a single type of surfactant and solvent and varied the
reduction chemistry to control the final iron cluster size for the experiments described
here. We varied the strength of the nonaqueous reducing agents used to reduce the
Fe(III) to Fe(0) so that the most rapid reduction kinetics produced the smallest final iron
33

clusters. Size-selected cx-Fe metallic clusters with diameters between 1.4 and 15 nm were
produced. <
Spectroscopy was used to demonstrate 100% reduction of the Fe(III) to the final
Fe(0) cluster form. All reactions took place in anaerobic conditions in a Vacuum
Atmospheres dry box with continuous oxygen and moisture removal and appropriate
sensors. Typical oxygen levels were 0.1 to 1 ppm and moisture levels were 0.5 to 3 ppm
in the dry box. All solvents and surfactants used were high pressure liquid
chromatography (hplc) grade and were completely dust free. The latter is critical to
prevent inhomogeneous nucleation. Magnetization samples were weighed to determine
total iron concentration and transferred to capped NMR tubes in the dry box to minimize
oxygen exposure. The capped tubes were then removed from the dry box and transferred
to the commercial SQUID magnetometer (Quantum Design MPMS) for magnetic
characterization.
The inverse micelle system used in these experiments was DTAC
(dodecyltrimethy lammonium chloride) in hexadecane with hexanol used as a
cosurfactant. Previous small-angle neutron scattering has shown that this system
provides stable growth in the cluster size range of 1 to -18 nm which was well suited to
the present investigation. After growth occurs, the resulting clusters are fully dispersed
and stable in a variety of oils and their magnetic properties may be investigated as a
function of cluster size. The stability against agglomeration is due to the presence of the
surfactant on the cluster surface.
The cluster formation reaction can be followed by the changes in the solution
absorbance spectra upon addition of the reduction agent. Figure 17 shows the initially
transparent, yellow colored micellar solution (labeled pre, for precursor) which has three
charge transfer bands due to Iigand complex formation of the surfactant micelle with the
Fe(III) salt. It is quite interesting to note that these spectral features are quite different in
energy from those of the same salt when dissolved in water or a polar organic solvent
such as thf which implies a possible change in the reduction kinetics in these media
which might affect final cluster size or morphology. This is illustrated in figure 18.
Upon addition of the super hydride reducing agent, (essentially an organic source of H-
ion), reduction of Fe(III) to Fe(0) occurs with the liberation of H2 gas. Obviously, at
least a 3:1 molar ratio of this reducing agent to FeC13 precursor is needed for 100%
reduction to iron clusters. For example, one can see from figure 17 that a 1:1
stoichiometry (squares) fails to remove all the Fe(III) from solution, while the other
reactions all result in complete reduction with the appearance of a clear to yellow solution
with broad absorbance. The latter is actually due to weak light scattering, as Fe(0) has
34
no inherent absorbance in the visible. The extent of light scattering, in fact, is a rough
measure of the final particle size.
Figure 19 is a bright field transmission electron micrograph (diffraction contrast)
taken on a JEOL1200EX at 120 kV showing the isolated, monodisperse 12.5 ~.5 nm Fe
particles formed in one synthesis (the scale is indicated by the 20 nm bar).
Selected area electron diffraction confirmed that these particles have the bcc et-Fe
phase. Other monodisperse et-Fe clusters produced by this surfactant/solvent process
ranged from 1.4&0. 1 to 15.0~0.5 nm, all below the maximum size of 16.4 nm [24] for
single magnetic domain Fe.
n
16000
14000
12000
10000
8000
6000
4000
2000
0
L J
~~~~--- supQY H(.004K1). FC?C’13(,005X’1)llt’.l)4ilj. Ft’{1.3{.f}(lo(!klj
-~ Super H(.04M), FeC13(.0002M) :
200 250 300 350 400 450 500 550
wave(nm)
Figure 17. Effect of ratio of reducing agent, (superhydride) to precursor salt, FeC13, onthe final solution optical absorbance. Incomplete reduction results in some Fe(III) asshown in the second case (square symbols).
35

25000 - , I I , ! 1 I , I , I , , , I I , r
t20000 -~~
. ‘-”-””’’”’’”-””’”””t h fnw \ . Drrf4~/c16 micelle‘n : ‘1, — - -v’ater
; 15000i,
-
.
L ~
‘: 10000 :1, :’~.,,/-\,.yf- ~~~w
a ,,
1 1 I i ,,,l,(-,L.4..(,, (,-
5000 - .’ ‘ ,.,,,’ ‘“-”’‘.>,,” ‘.,
---%----
o
Figure 18. Effect, ------
200 250 300 350 400 450 500
Wavelength
of ligand coordination on the energy levels of a charge transfer. . ..complex or FeL13 m continuous and micellar media.
*
●
Figure 19.investigate
TEM sh~>d.
xties were
36

B. Maimetic Properties of et-Fe Clusters
Figure 20 compares theresponse toanapplied magnetic field at5K for the
dissolvedFeC13 salt (Fe(III) ions inafrozen solution) before adding thereducing agent
(open triangles) to that of 12.5 nm Fe clusters after reduction (solid triangles). The
dashed line is a Brillouin function fit to the Fe+3 ion data using a g-factor of 2 and an
angular momentum of 2.5. The agreement confirms the presence of isolated Fe+3;
further, the low-field slope (susceptibility) decreases by a factor of 2 between 5 and 10
K, suggesting negligible magnetic interactions betw=n the ions. In contrast, the Fe
clusters show a distinct saturation in their response for fields above 1 tesla, consistent
with ferromagnetic or superparamagnetic behavior characteristic of strong magnetic
interactions within the clusters. Note the qualitative difference between the isolated ions
and the clusters: the isolated Fe+3 ions exhibit a linear response to applied field at low
fields and a nonlinear response at high fields while the 3.7 nm Fe clusters show a
nonlinear response (and a larger moment per gram) at low fields but saturate to a constant
moment in moderate fields.
400 -I I I s I I
4
Temp =t
0
5“0’/Y
L
;/
V Fe- in eurfmt-antJ
A 125mmFecluetere
7’&A AA AAA AA
1 I I 1 I 1
012345Magnetic Field (T)
Figure 20. Magnetic moment vs a plied magnetic field at 5 oK for 12.5 nm Fe clustersfcoplotted with the response of Fe+ ions in the precursor solution.
Fig. 21 shows isothermal hysteresis data (moment M versus applied magnetic
field H) measured at 5 K following zero-field cooling. The open circles denote the initial
response to an increasing field, the solid triangles for a decreasing field, and the open
37

triangles for an increasing field. The data are shown between -0.25 and +0.25 tesla, but
the actual hysteresis measurement used field strengths to ~2 tesla. These 12.5 nm et-Fe
clusters are ferromagnetic at 5 K with the data approaching saturation and exhibiting
reversibility at high field strengths. Them is a substantial ~manent moment Mrem at zero
field and a moderate coercive field HCoer (where the moment crosses through zero
following saturation). The saturation moment for these particles at 5 K, determined by
plotting M versus I/H and extrapolating to infinite field, is 2.2 x 10⁻³ emu or -25 emu./g
for the 88 ~g of Fe in this sample; the saturation moment for bulk cx-Fe is 220 emu/g at
low temperatures [24]. The total diamagnetic (negative) signal from the surfactant,
solvent, glass NMR tube and reducing agent salts (measured in a separate experiment) is
linear in applied field and -6.8x10⁴ emu in 1 tesla at 5 K; all data have been corrected for
this diamagnetism. Although this correction is small at the fields strengths in Fig. 21, it
is large at 5 tesla for the dilute Fe samples studied here. Since the Fe sample plus
surfactant/solvent/reducing agent is measured independently from the diamagnetic
correction, there is considerable uncertainty in the determination of a saturation value by
plotting the corrected moment versus VI-ldue to the dominance of the correction term.
Figure 21. Isothermal hysteresis data (moment M versus applied magnetic field H)
measured at 5 K following zero-field cooling for the 12.5 nm et-Fe clusters. The opencircles denote the initial response to an increasing field, the solid triangles for adecreasing field, and the open triangles for an increasing field.
The magnetic moment of each Fe particle in a frozen solution will exhibit random
rotations driven by thermal fluctuations. [25] Opposing these fluctuations is the magnetic
anisotropy energy Eaniso = KV where K is the anisotropy energy per unit volume and V
38

is the volume of the particle. An assembly of such particles will relax to equilibrium
through thermal fluctuations on a time scaler given by
t = Z. exp[KV/kTl (1)
where To is a characteristic time on the order of 10-9 seconds, k is the Boltzmann
constant and T the absolute temperature.[26]
One of the distinguishing features of small, single domain magnetic particles is
the appearance of a blocking temperature TB defined as the temperature where the
relaxation time ~ in Eq. (1)becomes comparable to the experimental time of 100 seconds.
For temperatures above ~, the magnetization versus applied magnetic field is reversible
due to thermal fluctuations, i.e., the sample exhibits no remanence or coercivity in a
hysteresis measurement.[26] et-Fe has cubic anisotropy with an anisotropy energy KFe
of 4.6 x 10⁵ ergs/cm3; the easy direction for magnetization is one of the [100] axes. For
spherical Fe particles with cubic anisotropy, the K in Eq. (1) must be replaced by
W4.[26] Using Eq. (1) for the 12.5 nm Fe particles and Z. = 10-9 seconds, we predict
~ -34 K for a thermal relaxation time of 100 seconds (the calculated relaxation time is
3 x 10⁻⁹ sec at 20 K and 18 nsec at room temperature).
An experimental blocking temperature can be determined from isothermal
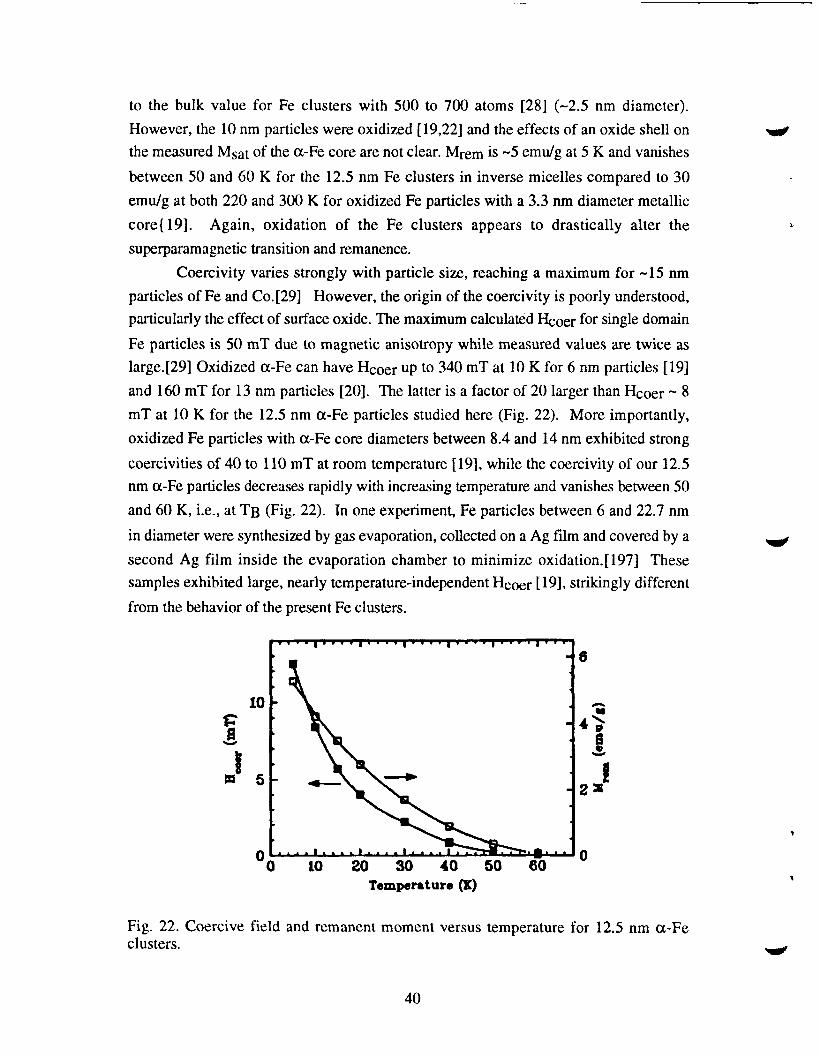
hysteresis measurements using the vanishing of remanence and coercivity. Fig. 22
shows the remanent moment and coercivity versus temperature for the 12.5 nm particles;
both vanish between 50 and 60 K. This experimental TB is only 50% higher than the
calculated value and the latter is extremely sensitive to particle size and morphology. For
example, 14 nm particles have a predicted TB of 47 K which would agree with our
experimental result. In addition, various improvements to Eq. (1) have been
suggested.[27] We have also studied a sample with 3.7 nm et-Fe particles and found an
experimental ~ of 15 K. The volume of these particles is only 2.6% of that for the 12.5
nm clusters, and Eq. (1) predicts a blocking temperature of 0.9 K. The cause of this large
disagreement between simple theory and experiment for these 3.7 nm clusters is not
understood. It may be that the assumptions of spherical particles and bulk magnetic
anisotropy are not valid for very small cluster si~s.
The magnetic results for the saturation magnetization, Msat, remanent moment,
Mrem, coercivity, Hcoer, and superparamagnetic blocking temperature, TB, of our
12.5~0.5 nm et-Fe clusters differ considerably from literature values, Msat is -25 emu/g
at 5 K from extrapolation of magnetization versus l/H or roughly 109?oof the 220 emulg
for bulk et-Fe. Literature values range from 20% of bulk Fe for -10 nm particles [19-22]
39
to the bulk value for Fe clusters with 500 to 700 atoms [28] (-2.5 nm diameter).
However, the 10 nm particles were oxidized [19,22] and the effects of an oxide shell on
the measured Msat of the cx-Fe core are not clear. Mrem is -5 emu/g at 5 K and vanishes
between 50 and 60 K for the 12.5 nm Fe clusters in inverse micelles compared to 30
emu/g at both 220 and 300 K for oxidized Fe particles with a 3.3 nm diameter metallic
core{ 19]. Again, oxidation of the Fe clusters appears to drastically alter the
superparamagnetic transition and remanence.
Coercivity varies strongly with particle size, reaching a maximum for -15 nm
particles of Fe and Co. [29] However, the origin of the coercivity is poorly understood,
particularly the effect of surface oxide. The maximum calculated fioer for single domain
Fe particles is 50 mT due to magnetic anisotropy while measured values are twice as
large.[29] Oxidized et-Fe can have Hcoer up to 340 mT at 10 K for 6 nm particles [19]
and 160 mT for 13 nm particles [20]. The latter is a factor of 20 larger than Hcoer -8
mT at 10 K for the 12.5 nm a-Fe particles studied here (Fig. 22). More importantly,
oxidized Fe particles with cx-Fe core diameters between 8.4 and 14 nm exhibited strong
coercivities of 40 to 110 mT at room temperature [19], while the coercivity of our 12.5
nm cx-Fe particles decreases rapidly with increasing temperature and vanishes between 50
and 60 K, i.e., at TB (Fig. 22). In one experiment, Fe particles between 6 and 22.7 nm
in diameter were synthesized by gas evaporation, collected on a Ag film and covered by a
second Ag film inside the evaporation chamber to minimize oxidation. [ 197] These
samples exhibited large, nearly temperature-independent Hcoer [19], strikingly different
from the behavior of the present Fe clusters.
1’=-’.-””’’’’””’’-’’”””-4 6
.
- 2X
o ~“”s’””’’’’”’”’’”””o 10 20 30 40 50 60
0
Temperature (X)
Fig. 22. Coercive field and remanent moment versus temperature for 12,5 nm a-Feclusters.
L
40

In summary, superparamagnetic blocking temperatures were 50-60 K for 12.5
nm clusters and 15 K for 3.7 nm clusters in inverse micelles. The former value agrees
reasonably well with the calculated TB based on cluster size and the magnetic anisotropy
of bulk Fe while the latter value is considerably above the calculated TB. Reported
values ranged from 230 K for 5.3 nm Fe cores to 120 K for 2.5 nm cores of oxidized
clusters. [19] Granular films with 3 to 9 nm et-Fe particles in a BN host matrix had a
field-dependent blocking temperature between 35 and 40 K.[21] However, particle
interactions were evident in the strong dependence of coercivity on Fe concentration [21]
and these interactions may affect the measured ~.
The magnetic properties of our monodisperse, isolated and oxide-free et-Fe
nanoclusters are very different from those reported in the literature and prepared by other
techniques. The earlier work is plagued by oxide layers, poor control over cluster size
and generally poor reproducibility. Although much additional work is needed, we
believe that our results may represent the only results on pure a-Fe clusters. Our
experiments on clusters in the 1 to 18 nm range provide an opportunity to test various
predictions for coercivity, remanence and saturation magnetization as a function of
particle size and temperature. The same synthesis has been used for preparing size-
selected Co and Ni clusters. The magnetic behavior of these particles should identify the
separate roles of thermal energy, magnetic anisotropy and surface versus “bulk” atoms as
the cluster size approaches a few unit cells, thus improving our understanding of
magnetic phenomena in this size range.
C. Control of Nanocrystal Structure
The equilibrium crystal structure of a material may not always be achieved when
nanocrystal growth occurs in an inverse micelle system. We note that such growth
occurs at room temperatures where atoms might become trapped at non-equilibrium sites
during the growth process. Though there have been reports of amorphous nanosize
materials including iron formed by various synthetic approaches, our inverse micellar
process invariably leads to the formation of highly crystalline nanophase materials. In
this work we have discovered a method for forming both the equilibrium cz-Fe phase
which has a bcc structure as well as the high temperature y-Fe phase which has a fcc
structure. Since the micelle synthesis process takes place at room temperature the
observation of fcc structure in the first iron samples we synthesized was very surprising.
41
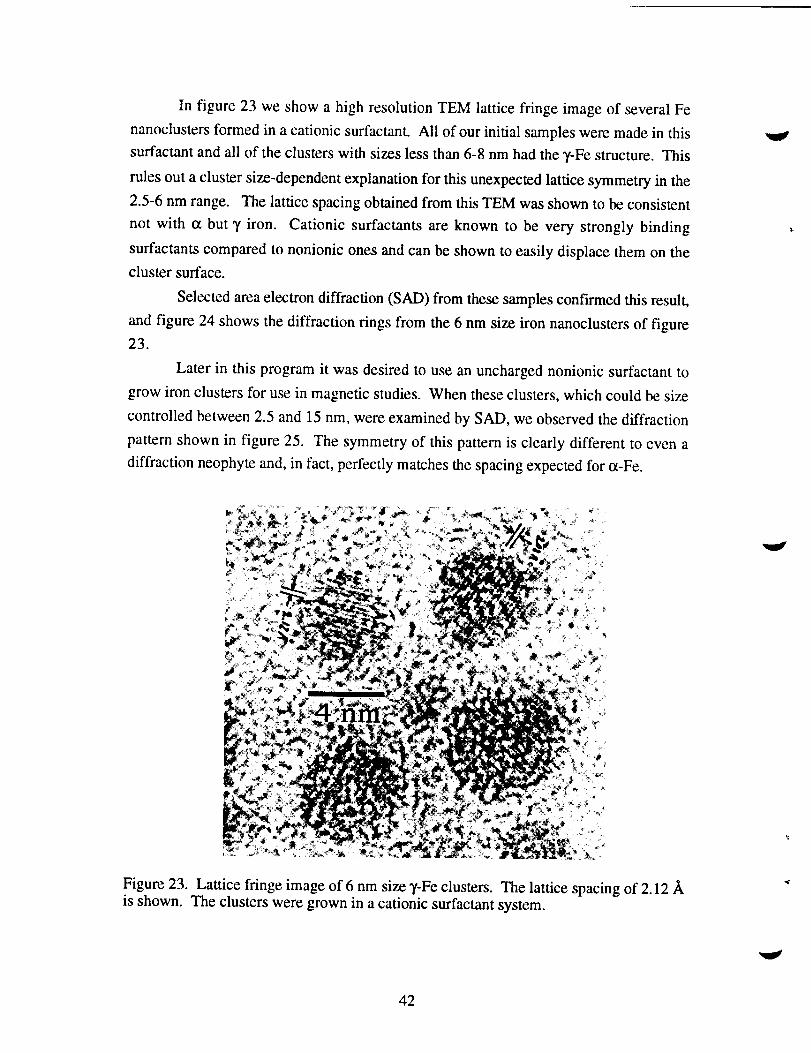
In figure 23 we show a high resolution TEM lattice fringe image of several Fe
mumclusters formed in a cationic surfactant. All of our initial samples were made in this
surfactant and all of the clusters with sizes less than 6-8 nm had the y-Fe structure. This
rules out a cluster size-dependent explanation for this unexpected lattice symmetry in the
2.5-6 nm range. The lattice spacing obtained from this TEM was shown to be consistent
not with (x but y iron. Cationic surfactants are known to be very strongly binding
surfactants compared to nonionic ones and can be shown to easily displace them on the
cluster surface.
Selected area electron diffraction (SAD) from these samples confirmed this result,
and figure 24 shows the diffraction rings from the 6 nm size iron nanoclusters of figure
23.
Later in this program it was desired to use an uncharged nonionic surfactant to
grow iron clusters for use in magnetic studies. When these clusters, which could be size
controlled between 2.5 and 15 nm, were examined by SAD, we observed the diffraction
pattern shown in figure 25. The symmetry of this pattern is clearly different to even a
diffraction neophyte and, in fact, perfectly matches the spacing expected for et-Fe.
Figure 23. Lattice fringe image of 6 nm size y-Fe clusters. The lattice spacing of 2.12 ~is shown. The clusters were grown in a cationic surfactant system.
42

Fgd$:...— ..——-
Figure 24. Selected Area electron diffraction from a field of 6 nm size iron clustersgrown using a cationic surfactant shows fcc symmetry and lattice spacing consistent with
the high temperature y-Fe phase.
A reasonable inference from these studies is that for nanosize iron the energy
difference between the possible cubic structures in the nanoclusters is quite small and
that, during the growth process small differences in the preferential binding site of the
surfactant used alter the final crystalline phase of the iron. An additional factor is that the
type of solvent used in the synthesis itself may influence the final structure by interacting
with the growing surface of the cluster. Evidence for this comes from growth studies in
coordinating solvents such as toluene or tetrahydrofuran in which the non-equilibrium y
phase is often observed. Thus, a complete understanding of the best methods of phase
control requires further research.
It is also possible that the phase diagram for nanosize iron is different from that of
the bulk such that the phase boundary between y and et-Fe occurs at a significantly
depressed temperature relative to the bulk. It has been fairly well established that liquid-
solid phase boundaries (melting temperatures) in nanosize materials are significantly
depressed compared to the bulk, so it would not be strange to observe changes in
structural phase transition temperatures as well. It fact, our observations with iron
43

--4
Figure 25. Selected area electron diffraction from a field of 4.3 nm iron clusters grown
in a non-ionic inverse micelle system. The symmetry matches of the bcc pattern of a-Fe.
nanostructure are a strong motivation to examine other well-known phase transitions
such as et to ~ Sn which occurs at - 13.2°C in the bulk. Important issues are: does thetransition still occur in nanosize materials and what is its size dependence? We haveinitiated some preliminary studies of tin nanoclusters to address these issues.
‘1
.
44

V. Dielectric Properties of Nanoclusters
A. The Dielectric Constants of Metallic Clusters
The dielectric constants of a substance are among its most fundamental properties.
Both applied and fundamental scientific considerations motivate the strong interest in the
dielectric constants of nanoclusters. On the applied side, knowledge of these constants is
important in such applications as catalysis, photocatalysis, microcapacitors,
microelectronics and nonlinear optics. From the fundamental point of view, the possible
influences of cluster size and of the discretization of the energy level structure at small
cluster sizes on the dielectric properties have been subjects of much theoretical and some
experimental interest. The early interest was stimulated by a much-referenced paper by
Gor’kov and Eliashberg[31] which took into consideration the influence of quantum
effects on the properties of metallic nanoclusters. One of the main results of this work
was the prediction of a quantum size-related dramatic enhancement (> 102 x) of the
electric polarizability of these clusters at low frequencies compared to large clusters or
bulk. Definitive experimental verification of this result proved difficult because of the
major difficulty of producing desired samples, namely ones which contain sufficiently
high concentration of monodisperse clusters of known size. The relatively few early
experimental attempts failed to confirm the prediction, and subsequent theoretical work
refuted it due to improper treatment of depolarization effects in Gor’kov and Eliashberg’s
work.[32]
Although it is now generally acknowledged that the “dramatic enhancement” effect of
Gor’kov and Eliashberg may not exist, there is still much theoretical debate as to whether
the electric polarizability is enhanced or depressed relative to its classical (large size)
value for small nanoclusters. [32] Additionally, there have been relatively recent reports
of large positive dielectric constants for metal clusters in the sub-micron size range.[33]
This is a rather unusual result since the dielectric constant of metals is negative as a
consequence of the dominating inductive free carrier contribution to the polarization.
In principle our synthesis approach, based on the use of inverse micellar cages as
reaction vessels, is ideal for producing the size-selected nanocluster samples needed to
shed some light on the possible influence of quantum confinement on the polarizabilities
of metal and semiconductor nano-clusters. We are also quite interested in the
confirmation of Nimtz and Marquardt’s finding of very large positive dielectric constants
45

for metal nanoclusters.[33] If true, this is a very significant finding that has strong
technological implications for two areas which motivate our own work on nanoclusters,
namely microdevices and catalysis.
We have demonstrated greatly enhanced catalytic activity for both metal and
semiconductor nanoclusters,[34] but the origin of this effect is not well established. The
implication of a large positive dielectric constant of a cluster for catalysis relates to the
possible inherent shielding of the repulsive electric forces between reactants brought
about by such a cluster. [33] This effect can be seen as follows. The Coulomb repulsive
force F between charges q] and qz a distant r apart is to a good approximation
(2)
where GOis the permitivity of free space and El is the real part of the dielectric constant.
A large positive El of a catalyst can strongly increase the effective el of the medium
about it and thereby reduce the long-range repulsive forces of the reactants. This
shielding effect in principle would allow reactants to come closer together and react in the
vicinity of the cluster catalyst. An assessment of this effect is clearly important, for it
could provide a significant key to the origin of catalytic activity of clusters and, more
generally, metals.
In the present work we have synthesized several metallic and semiconductor
nanoclusters in solution, built a cell suitable for measuring the dielectric constants of
solutions and begun to study the dielectric properties. Before presenting some of our
results, it is necessary to provide a brief theoretical background needed for understanding
these results.
B. Theoretical Considerations
The generic problem of interest is that of polarizable metallic clusters (for now
assumed spherical) of dielectric constant ● embedded in a dielectric medium of dielectric
constant •~. At issue is the relationship of the effective dielectric constant of the medium
plus clusters, ee~~,to =~ and c. The presence of the clusters gives an extra contribution
to the effective dielectric constant of the medium. Charge accumulation at the cluster-
medium interface produces a depolarizing field which causes the field inside the cluster,
EIW, to be lower than the externally applied field, E,. The relationship between these
two fields can be expressed as
46

E ,OC= EO– 4zDP, (3)
where D is the depolarizing factor and P is the polarization, which is the dipole moment
per unit volume, m, induced on the cluster. For the present case it is easily shown that
[34]
[)zd3 G–emp=— 3=0 EO.6 c+2e~
(4)
The plasmon resonance of the metallic cluster is given by the frequency O.)Rfor which
p + W, i.e., for ~(0~)+2c~=0.
The induced polarization P is related to EO through the polarizability, a, by
P=aEO, (5)
and to EIWthrough the electric susceptibility, X, by
P = ~EIOC. (6)
Combining Eqs. 3,5 and 6 yields
a=~V/(l+4zD~) (7)
which can be determined from low-frequency capacitance measurements of the staticdielectric constant C(0)through[32]
[1l+~f(a/V)
‘(O)‘Em
l–~f(a/V) ‘(8)
where f is the volume fraction of metal. Considering the cluster to be a small metal
sphere, its classical polarizability, i.e., its cx in the absence of quantum effects, is a =
3V, a well-known result.[32] For small filling fraction (f<<l) Eq. 8 then reduces to
=(0) /Gm=l+3f (9)
for the ratio of the dielectric constant of the metal cluster-in-a-medium relative to that of
the medium. Thus, in the classical limit and for small concentration of clusters the
enhancement of& is very modest and simply proportional to f.
47

The outstanding issue relative to the role of quantum size effects in determining the
dielectric response is whether or not these effects enhance et over that of its classical
limit. Representing such enhancement by the parameter A, et in the quantum limit
becomes et= 3AV, and Eq. (9) becomes
‘=(O) /cm=l+3Af. (lo)
In the context of Gor’kov and Eliashberg’s results,[39] A is very large (>102). Under
favorable conditions I@. 9 and 10 can be tested directly by dielectric measurements.
The relationship between =,m and •~ and = can be easily derived in the classical
limit.[34] For an isotropic spherical particle the Lorenz local field factor is 47r/3 which
leads to
%oc = *(=eff+2%)EO.
This form of EIOCleads to the well known Maxwell Gamett equation.[34]
Equation (12a) is often written in the form
[
l+2f(e-em)/(e+2Gm)Eeff==m 1l- f(E-em)/(e+2 Em) .
(11)
(12a)
(12b)
Thus, by measuring c~~~and em and knowing f we can calculate the dielectric constant of
the clusters. Equation (12) has been very successful in explaining the dielectric and
optical properties of submicroscopic dispersions of metals. [35] It is applicable in the
dilute limit (f<<l) and for cluster diameters smaller than the wavelength of the radiation
inside the medium.
Finally, we note that the dielectric constant is a complex quantity, i.e.,
where ●1 and ~z are the real and imaginary parts, respectively. For metallic and
elemental semiconductor (e.g. Si, Ge) clusters the only source of polarization is
electronic and ●= ii2, where ii is the complex refractive index which can be written as
48

ii= n – iK, (14)
where n is the real part of the refractive index and K is the extinction coefficient which
measures the attenuation of the wave in the medium. From Eqs. 13 and 14 it is readily
seen that =1= nz – K2 and =Z= 2n ~. The case of partially ionic semiconducting clusters
is more complex. Here there are two sources of polarization, electronic and lattice, the
latter having to do with the polarization induced by the opposite displacements of positive
and negative ions in response to an applied electric field.
C. Results and Discussion: Pd and Au Clusters
We have performed measurements of the complex dielectric response on Pd and Au
clusters dispersed in various media and initiated some preliminary studies on CdS and
MoS2 clusters. Essentially all of these measurements were carried out at room
temperature (- 295K) and covered the frequency range 102- 106 Hz. The most
extensive measurements were on Pd clusters, and we summarize these results first.
Five Pd cluster samples (#s 76, 78-81) were grown in the hydrocarbon decane (c1O)
using the nonionic surfactant Brij 30, and three other samples (#s 75, 82 and 83) were
grown in octane (c8) with the anionic surfactant AOT. These syntheses produced Pd
clusters in the size range 1.6 to - 10 nm, with the TEM sizes shown in the Table below
Table I. TEM size of Pd Clusters
sample # 75 76 78 79 80 81 82 83
diameter 10 2.6 2.8 2.8 1.6 4.2 2.3 2.3
Results on the first five samples were identical as were the results on the second set
of three samples. The results on the two sets were also essentially identical above
104 Hz, but differed somewhat at lower frequencies, the first set of five yielding larger
values of c1.
Before presenting some of the results we note that although our synthesis method
produces excellent monodisperse clusters, interpretation of the dielectric data is at present
complicated by a number of factors. First, our clusters are embedded in a complex
medium which consists of the solvent (decane or octane) plus surfactant. Secondly, the
clusters are encapsulated in a surfactant cage. Thirdly, the potential exists for some
residual ionic species which are byproducts of the synthesis to remain in the solution and
49

influence the dielectric response. In the future these complications will be overcome by
the use of the chromatographic separation teduique developed in this program to remove
residual species and by the removal of the surfactant capping layer. In the meantime,
however, the dielectric constants reported below should be viewed as effective values for
the capped clusters.
20 , , ,., , ,,., I m
18 -*-A— Brij 30 I Clo
!
-o— Brij 30 / Clo + Pd Clusters
16 T=294K
-~ 14
.=n
12
10
8
6
4
t
21 I I , 1 J,02 ,03
104,05 106
-.
Frequency (Hz)
Figure 26. Real part of the dielectric constant vs frequency for Brij 30/c 10 precursormicellar system (lower curve) and same micellar system containing Pd #78 clusters (2.8nm diameter) where the volume fraction of cluster is f-10-4.
Figure 26 shows typical behavior of the real part of the dielectric constant as a
function of the frequency of the applied field. The lower curve shows the response of
the decane plus surfactant whereas the top curve represents the behavior of the solution
plus clusters. Several features in the data can be noted. Both responses exhibit large
decreases of c1
values at -106
frequencies are
with increasing frequency and appear to be approaching asymptotic
Hz. This large frequency dispersion and the large values of ~1 at40w..
suggestive of large ionic conductivities in both cases, a feature that is
50
.
.

confirmed by the large and strongly frequency-dependent dielectric losses (or tan 5; tan 5
is related to by = cl tan 8) for the same samples shown in Fig. 27. As can be seen, tan
6 for samples with and without clusters decreases rapidly with increasing frequency and
approach low values characteristic of normal dielectrics at - 106 Hz. The decreases in
both cl and tan ili with increasing frequency reflect the increasing inability of ionic
species to follow the electric field. At sufficiently high frequencies these species are
frozen out and do not contribute to the polarization.
For the present purposes the most meaningful data are those at 106 Hz, i.e. close to
the asymptotic limit. Figure 26 clearly shows enhancement of =1 due to the presence of
the Pd clusters (plus possibly some residual ionic species), and we take the difference
between the two curves at 106 Hz (A ●1= O.64) to represent the upper limit of the
contribution of the clusters.
At 106 Hz the data in Fig. 26 yield cl ( s~l,,fl, i.e., c1 of the solution plus clusters)
= 3.48 and Gl,m= 2.84. Given that the volume fraction (f) of clusters in the sample of
Fig. 26 is -10-4, Eq. (10) with cl / ~1~= 1.23 suggests that the enhancement factor A-
770.
The fact that this value is close to that predicted by Gor’kov and Eliashberg must be
viewed as fortuitous, since, as already cautioned, the above values of ●’ and e; may be
influenced by the capping layer and by the presence of ionic species. The final resolution
of this issue must await the purification of the samples.
Using Eq. 12, the above values of Cl,,fl, cl,~ and f (= 10-4) yields =1 = -5.7 as the
dielectric constant of the “capped Pd clusters.” Note that cl is negative.

16, , # ,,,, , 11, a,, , I , , ,111 , ,
..
14 -
12 -
10 -
;8 --
6 -
4 -
2 -
n
A●
\\—A— Brij W I Clo
I
\ \ i—.— Brij 30 J Clo
\\
+ Pd Clusters
T=294K 1
I , ,#,, I , a , ,s , ,
103 ,04
Frequency (Hz)
,05 .- ,06
Figure 27. Loss tangent, tan & vs frequency for Brij 30/c 10 precursor micellar system(lower curve) and same micelles containing Pd #78 clusters (2.8 nm diameter) wheref- 10-4.
Turning next to nm diameter gold (Au) clusters, two sets of samples were
investigated. The first set consisted of 4.0 nm Au clusters grown in micellar cages in
octane at a volume fraction of 1 x 10⁻⁴. The results were very similar to those for Pd
clusters in decane (Figs. 26 and 27), and the c1 values at the high frequency end yielded
% = -4.2 for the “clusters.” Again we note the negative value of c1.
The second set of Au samples were grown in solution (styrene and surfactant)
and subsequently embedded in polystyrene. These 8.3 nm clusters were made into a
solid plastic by adding cross-linking agent (divinylbenzene) and initiator, AIBN, and
cross-linked in situ at 60 oC. The resultant material was a solid which was light purple
in color. A second sample which did not contain clusters was prepared in the same way
resulting in a milky colored solid. Thin disks were cut from both samples, polished-and
electrode with Ag paste. Figures 28 and 29 show ~, and [an 5, respectivel~ as
6

functions of frtquency. The responses are qualitatively similar to those of Au and Pd in
solution, but the dielectric losses are considerably smaller. In particular, without the
clusters, the polystyrene behaved as a good dielectric; however, the sample with the
clusters appears to contain some trapped polarizable ionic species. Its El appears to be
approaching an asymptotic value above - 105 Hz. At this frequency e;,ti = 3.73 and
•l,~ =3.56 yielding ~1,,~ / =1,~ = 1.05, which for the low cluster concentration used (f -
10-4) suggests an enhancement factor A-170 which is again large. These values of IEl
yield via Eq. 12 =1 = -7.2 for the effective real part of the dielectric constant of the Au
clusters in the polystyrene matrix. This value of =1 is comparable to those of both the Pd
and Au clusters in solution.
6.0
I
5.5
-w
5.0
4.5
4.0
3.5
, , , 1,1, , , , , I , ,,, , , , , ,Snl , , , ,
~ Ps—o— PS + Au Clusters
\T=294K
\●
✼
“\
‘o\
A %.e..
102 , ~3 104 ,05 ., 106
Frequency (Hz)
Figure 28. Real part of the dielectric constant vs frequency for 8.3 nm diameter goldclusters encapsulated in cross-linked polystyrene is compared to the polystyrene matrixitself (lower curve).
---
53

The negative sign of the effective Cl for the Pd and Au clusters deduced from our
data is the expected result for metals. Thus, we do not see any evidence for positive c1’s
as re$orted by Nimtz and Marquardt[33]. However, it should be noted that the several
metallic clusters investigated by these authors were considerably larger (50 -104 nm)
than our own (< 10 nm) and their concentration (f= O.1) was also much larger than ours
(f- 10-4). Thus, the issue of positive El for@ metallic clusters, though puzzling, .remains open.
0.7
0.6
0.5
s
‘ 3 0.3
0.2
0.1
O.c
m , , 1 ,, v , , , , ,,, , , , , , ,,, , 6 , v , 1<
“\ —e— F% + AU Clusters
b\e T=294K
\
A A A A- m
A A a
# , , , , ,,1 , * * , * * ,* I s , , I , ,* , s , 1
102 , ~3 ,04 ,05 ,06-.
Frequency (Hz)
Figure 29. Loss tangent tan 6 vs frequency for 8.3 nm diameter gold clustersencapsulated in cross-linked polystyrene is compared to the polystyrene matrix itself
.
(lower curve).
Ashrit et al[36] recently studied the optical reflection and transmission properties of
10 and 22 nm silver (Ag) clusters dispersed in gelatin films. Mie theory analysis of their
data yielded the real and imaginary parts of =1 for the clusters. They fmd negative values
of =, which increase in magnitude with increasing wavelength. At 800 nm their values
are el = -15 and -20 for the 22 and 10 nm clusters, respectively, suggesting that =1 is
54

size dependent. However, in view of the fact that there is conflicting evidence in the
literature about this point,[37] Ashnt et al’s results need confirmation. Despite these
uncertainties, it appears that our values of the effective =1’s for the Pd and Au clusters
are of the correct sign and order of magnitude.
D. Semiconductor Clusters
Finally, we have made some preliminary measurements on MoS2 and CdS clusters
in solution. These solutions were even more lossy than the Pd cluster solutions,
undoubtedly due to the presence of large concentrations of residual ionic species
produced in the more complicated synthesis of these compound clusters. More detailed
studies are awaiting completion of our chromatographic separation facility. In the case of
the MoS2 clusters, we attempted to carry out the dielectric measurements at low
temperatures in order to freeze out the ionic contributions. However, this attempt was
complicated by the phase separation of the solvent-surfactant system. By the way, we
find that dielectric measurements are a very sensitive probe for studying the phase
equilibria of such systems.
55

VI. Optical Properties of Metallic Clusters
A. Elemental Clusters
The formation of metal colloids by the controlled reduction, nucleation and growth
of metal salts in aqueous solution has been investigated for nearly a century. In the case of
gold colloids the earliest work dates to Michael Faraday .[38] Much of the interest in gold
colloids (or nanoclusters) stems from their remarkable stabilities, monodispersity, and
interesting optical properties.
The advantages of forming metal particles which are readily dispersed in organic
media is recognized by workers in many fields and their application and properties were
discussed in recent review articles. [39,40] For example, in small, particulate, magnetic
recording media a thin, well dispersed film containing polymers, metal or metal oxide
particles, and lubricants must be deposited on a supporting substrate without particle
aggregation ensuing. Another example is in the area of conductive inks where well
dispersed gold, silver, or copper particles need to be sprayed onto a polymeric substrate.
Such an application requires the use of a low vapor pressure organic solvent which readily
wets the surface. In such cases the advantages of colloid preparation in non-aqueous media
are obvious. In the present work we were motivated by a desire to tune the optical
absorbance properties of small clusters to better match the solar spectrum. In this
application the metal particle acts like an antenna to absorb energy which may subsequently
be transferred to a semiconductor nanoparticle creating a hole-electron pair. In this regard
the metal would function much as dye sensitizers do, but without the chemical degradation
and toxicity issues inherent to the use of dyes.
A second scientific motivation for optical studies of metal nanoclusters stems from
quantum size theories for metal colloids which predict that the plasmon resonance should
broaden considerably as the particle size is decreased. Also, many current ideas[41] suggest
that a blue shift in Lmax should occur with decreasing size, though the effect should be
small. Our observations suggest that, in the size range of 2-5 nm, the effect is surprisingly
large as shown in figure 30.
There are conflicting experimental results on the broadening of the plasmon width
with decreasing cluster size. For example, experiments on silver SOISby Heard and co-
workers[42] showed that a four-fold increase in particle size resulted in an increase of 17
nm in ~ax but no increase in half-width. Our experiments indicate a significant increase
in the half-width in the size range of 8-2 nm and a shift of more than 30 nm in the position
Of Lmax.
56

Even ignoring these quantum size effects, the optics of dispersed metal clusters or
colloids is quite complicated. An accurate description of the optical properties in the
simplest case of independent spherical colloids was first developed by Gustav Mie and
current ideas were summarized in a recent monograph.[43] Mie’s description of the
scattering from small metal spheres is so precise as to allow the determination of the
complex refractive index of the metal to be calculated as a function of wavelength. Later
work[44] showed that such issues as variation of particle size, variation of particle shape,
aggregation of the primary particles, and effect of adsorbates (e.g. surfactants) on the
surface could affect the observed spectra. Turkevich and coworkers were able to show that
as the spherical gold colloid particle size dispersed in aqueous solution increases from 7.5 to
33 nm, the absorption maximum remains at 522 nm for the smallest clusters (7-10 rim), then
begins to red shift and broadens with corresponding color changes from purple to violet to
blue.[45] At the same time, the extinction coefficient/gram of Au increases with particle size
up to a maximum at -80 nm, and then decreases steadily.
525
520
515
510
505
500
495
490
485
I I I
*
gold colloids inDDAB(lO%)/toluene
I * II I I I I J
o 5 10 15 20 25
Diameter (rim)
Figure 30. Position of the maximum in the surface plasmon resonance (kmax) vs goldcluster diameter shows signitlcant quantum confinement effects which shift the resonance tothe blue.
57

In our nanoclusters we see more significant shifts in ~mw, with very little variation
of the extinction, e, with size, D, in our inverse micellar systems. For example we find
kmax_490 nm for D=3.4 nm, kmax=499 nm for D=6.8 nm, and kmax=510 for D=8.3
nm, while the extinction remains roughly constant until D>8 nm. Perhaps these more
significant changes in ~u are due to the fact that we are investigating smaller colloids than
previous work.t
Mie theory, on the other hand, predicts no significant change in extinction in this
size range. For example, the extinction should be roughly constant with a value of 7400
cm- 1-mol- 1, based upon modern values of the optical constants of gold. [46] This value is
more than twice the value we observe, suggesting an important role for the surfactant on the
cluster surface. If the surfactant donates electron density into the surface, the effective
refractive index of the surface will be altered from that of the pure metal, affecting its optical
properties.
The theoretical value of the peak extinction is strongly dependent on the measured
optical constants used in the calculation. When alternative values are used,[47] the peak
extinction is predicted to be -11,000 cm- l-mol- 1, while other values[48] give &max -6500
cm- 1-mob 1 demonstrating the necessity for extreme accuracy in the measurements of the
optical constants near resonance if a comparison using Mie theory to experimental extinction
measurements is desired. Experimentally, we find the average value of the peak extinction
appears to be -3000 cm-1 -mol- 1 if the system is quite monodisperse and spherical.
The position of the peak absorbance in the classical Mie theory is determined by both
the optical constants of the metal and the refractive index, n, of the medium. For example,
the classical theory predicts resonances at 500 nm, 520 nm, and 530 nm for particles with
sizes less than 20 nm in air (n=l .0) , water (n= 1.334), and toluene (n= 1.5) respectively.
Experimentally, we find the resonance at 520 nm for D=l 1.3 nm spheres in water, and 512
nm for D=7.3 nm spheres in toluene. The shift is obviously in the wrong direction.
However, the latter spheres are stabilized with a surfactant on their surface, which may alter
the effective refractive index to be used in the calculation. However, it is perplexing that a
wide range of colloids prepared in inverse micelles with various types of nonionic, anionic,
and cationic surfactants consistently show a blue, rather than a red shift in resonance
compared to their similarly sized counterparts prepared in water. This suggests that there
may be other important effects occuming in this small size regime.[23]
58

B. Com~osite Clusters
In order to better control the optical properties, it would be desirable to have
synthetic methods for altering the surface properties of metal clusters. We have already
speculated that the presence of the surfactant may achieve this end to a limited degree. We
have now developed a strategy for the synthesis of composite nanoclusters which is rather
simple given the basic micellar synthetic method. First, a monodisperse population of
clusters (e.g. Au) is grown with a desired size as outlined in reference 23. This cluster
population serves as seed particles for the homogeneous nucleation and growth of the other
material (e.g. Ag) on its surface.
The optical features of homogeneous nanosize populations of Au or Ag clusters are
so well known[43] that absorbance measurements alone can determine whether a coated
cluster results from this synthetic approach. The other synthetic possibility is the formation
of two separate populations of Au and Ag nanoclusters. To rule out this possibility,
separate synthesis of Au and Ag nanoclusters solutions were performed followed by simple
mixing of these solutions to form a control sample whose optical properties are shown in
figure 31.
When sequential reductions are performed to form coated cluster composites the
spectra shown in figure 32 result. Interesting features include a significant size dependence
for the same atomic composition. Neither spectrum resembles that of the homogeneous
solution shown in the figure 31. As expected from theory,[49] direct contact of the two
metals alters the optical properties significantly since it changes the refractive index
boundary conditions at the cluster surface for the electromagnetic wave which is scattered
and absorbed at this surface. For the same reason changes in cluster shape will also alter the
optical properties significantly.
The type of material on the outer surface of the nanocluster has a signitlcant effect on
the optical properties as shown in figure 33. The aborption spectra shown in this figure are
for 10 nm composite clusters which have the same overall atomic composition. It is worth
mentioning that it is unlikely that a uniform coating of either metal on the surface of the
nanocluster core is achieved by our process. A highly curved surface of a particle with only
a 2-10 nm diameter makes it seem more reasonable to deposit an island-like structure of one
material on the other. However, we have not yet been able to resolve this issue by high
resolution TEM.
59

6000 , r r I I I , I1
5000 :1—+---- ora ngc COIIoi ds
n \ silver plasmonM 1*S 4000 404 nm* 1\z
P’\ // \,: 3000 :\f~\l
\
*’ \
!
/I b~ 2000 .
\\gold plasmon
1/’
z .,d’\
520 nm ‘.1000 ~....<).-<?%
\ .
0 I I I , ‘ *++%.,. ~! ! , I ! 1 ) , , $ t ,
200 300 400 500 600 700wave(nm)
Figure 31. Two homogeneous populations of separately synthesized goldnanoclusters are mixed together. The total spectrum is iust the sum of the
and silverindividual
absorbance, and the two ~lasmons remain in-their norrnfil positions as shown, and thesolution has an orange color (gold cluster solutions are red while silver ones appear yellow).
In summary, we can tailor the absorbance properties of metal nanoclusters by
coating one element on the other. By using varying amounts of one material (e.g. Ag) on
another core material (e.g. Au) we can tune the optical absorbance and extinction values
over a significant range as shown in figure 34.
This part of our work has an important additional benefit. The ability to selectively
coat a cluster with a different material has several technological uses in catalysis and
photocatalysis. In catalysis one can imagine coating clusters made from an inexpensive
non-catalytically active material (e.g. Fe) with an expensive catalytically active material such
as Pt. In photocatalysis the ability to selectively coat semiconductor clusters with metals
would be highly significant for controlling optical absorption and earner recombination
properties as well as for the development of novel micro electrochemical cells.
60

*LIo
Figure 32. The absorption spectra of 1:1 Au/Ag (core/shell) composite clusters show asignificant dependence on cluster size. Neither spectrum resembles that of figure 31 rulingout separate collections of gold and silver nanoclusters.
61

‘mo
200 300 400 500 600 700
wave(nm)
“
Figure 33. The absorption spectra of 10 nm composite 1:1 Au/Ag and Ag/Au clusters. Themetal on the outer surface of the cluster affects the optical properties even for identicalatomic composition and size.
62

‘Ro
6000
5000
4000
3000
2000
1000
0
t’ i’ I I I I _t
200 300 400 500 600 700
wave(nm)
Figure 34. Effect of composition on the optical absorbance of 10 nm Au:Ag compositeclusters with a gold core and a silver coating. As expected, the optical features begin toresemble those of the main component as the other component concentration decreases. Themolar ratio of Au:Ag is indicated in the figure.
63

VII. Future Research Directions
In this work we have produced many unique nanocluster materials and have made
considerable progress toward understanding their optical, magnetic and dielectric properties. .
We have greatly improved the micellar synthesis process and in the latter phases of the
program established a capability for the pufilcation of nanoclusters using high performance-,
liquid chromatography. This processing technique includes on-line optical diagnostic
measurements such as absorbance, conductivity and photoluminesence. This development
represents a signficiant advance in the field of nanoclusters and has enabled measurements
of nanocluster properties which have previously escaped detection.
Due to this research, many interesting new properties of these materials have been
revealed for the first time, and we anticipate and urge active research within Sandia and
elsewhere on practical catalytic reactions using these new materials. Indeed this is an
important aspect of our recently-funded BES initiative on the synthesis and processing of
nanoclusters for energy applications which was an outgrowth of this LDRD program. and
of the BES Center for Synthesis and Processing project on nanoscale materials. We also
expect these materials will prove very useful because of their inertness, lack of toxicity, and
low cost (particularly Fe and FeS2) and will serve as an entirely new class of
photooxidation catalysts for the destruction of organic wastes using sunlight (solar
detoxification). We also urge further work on processing these new materials into forms
suitable for the intended applications.
Acknowledgments
The authors would like recognize the valuable assistance of Sharon Craft in the
synthesis of the materials used in this LDRD project and of Leonard Hensen in performing
the measurements of dielectric properties.
64

References
[1] “Research Opportunities on Clusters and Cluster-Assembled Materials - A Department
of Energy, Council on Materials Science Panel Report, J. Mater. Res., 4(3), 704-736,
(1989).
[2] J.P. Wilcoxon, A. Martino, A..P. Sylwester, R. Williamson, and R. Baughman,
“Novel Catlysts Based on Microemulsions”, SAND report, Sandia National Laboratories,
Albuquerque, N. M., Oct. 1992.
[3] Wilcoxon, J. P., DOE patent #5,147,841, DOE control #S 70621, entitled “Method
for the Preparation of Metal Colloids in Inverse Micelles and Product preferred by the
method”, issued Sep. 15, 1992.
[4] A. Martino, J.P. Wilcoxon, and J. Kawola , “Synthesis and Characterization of Fe and
FeS2 (Pyrite) Coal Liquefaction Catalysts in Inverse Micelles”, Energy and Fuels, xx, xx,
(1994).”
[5] Wilcoxon J.P., Martino T., E. Klavetter, and Sylwester A. P., “Synthesis and
Catalytic Properties of Metal and Semiconductor Nanoclusters”, in Nanophase Materials,
proceedings of the NATO ASI, Corfu, Greece, June 1993.
[6] See A. D. Yoffe, Adv. in Phys. 42, 173 (1993) for a recent review and references
therein.
[7] R. F. Frindt and A. D. Yoffe, Proc. Roy. Sot. A., 273,69 (1963).
[8] B. L. Evans and P. A. Young, Proc. Roy. Sot. A., 284,402 (1965).
[9] R. Coehoorn, C. Haas, J. Dijkstra, C.J.F. Flipse, R.A. deGroot and A
Rev. B., 35, 6195 (1987), 35, 6203 (1987).
[10] Al. L. Efros and A.L. Efros, Sov. Phys. Semicond. 16,772 (1982).
[11] L.E. Brus, IEEE J. Quant. Electron QE-22, 1909 (1986).
[12] Y. Kayanuma, Phys. Rev. B. 38,9797 (1988), 44,13085 (1991).
Weld, Phys.
[13] J.P. Wilcoxon and G.A. Samara, “Strong Quantum-Size Effects in a Layered
Semiconductor: MoS2 Nanoclusters”, Phys Rev. B a, 7299, (1995).
[14] J.P. Wilcoxon and G.A. Samara, “Strong Quantum Confinement Effects in
Semiconductors: FeS2 Nanoclusters”, Appl Phys L.ett, in prep.
[15] 1.S. Jacobs and C.P. Bean in Magnetism, edited by G. T. Rado and H. Suhl
(Academic Press, New York, 1963), Vol. III, pp. 271-350, and references therein.
[16] W.F. Brown, Jr., Micromagnetics (Wiley Interscience, New York, 1963.
[17] E.P. Wohlfarth in Magnetism, edited by G. T. Rado and H. Suhl (Academic Press,
New York, 1963), Vol. III, pp. 351-393.
65

[18] E. Kneller in Magnetism and Metallurgy, edited by A. Berkowitz and E. Kneller
(Academic Press, New York, 1969), Vol. 1, pp. 365-471 and references therein.
[19] S. Gangopadhyay, G.C. Hadjipanayis, S.1. Shah, C.M. Sorensen, K.J. Kablunde,
V. Papaefthymiou, A. Kostikas, J. Appl. Phys. 70,5888 (1991). .
[20] S. Gangopadhyay, G.C. Hadjipanayis, B. Dale, C.M. Sorensen, K.J. Kablunde, V.
Papaefthymiou, A. Kostikas, Phys. Rev. B 45,9778 (1992)..
[21] A. Tsoukatos, H. Wan, G.C. Hadjipanayis, V. Papaefthymiou, A. Kostikas, A.
Simopoulos, J. Appl. Phys. 73,6967 (1993).
[22] A. Tasaki, S. Tomiyama, S. Iida, N. Wada, R. Uyeda, Jpn. J. Appl. Phys. 4,707
(1965).
[23] J.P. Wilcoxon, R.L. Williamson, R.J. Baughman, J. Chem. Phys. 98,9933 (1993).
[24] B. M. Berkovsky, V. F. Medvedev, M.S. Krakov, Magnetic Fluids: Engineering
Applications (Oxford Univ. Press, Oxford, 1993), p. 12.
[25] L. Neel, Compt. Rend. 228,664 (1949).
[26] C.P. Bean and J.D. Livingston, J. Appl. Phys. 30 (supplement), 120S (1959).
[27] For example, W.F. Brown, Jr., J. Appl. Phys. 30 (supplement), 130S (1959).
[28] I.M. Billas, J.A. Becker, A. Chatelain, W.A. de Heer, Phys. Rev. Lett. 71, 4067
(1993).
[29] F.E. Luborsky, J. Appl. Phys. 32 (supplement), 171S (1961) and references therein.
[30] E. L. Venturini, J. P. Wilcoxon and P. P. Newcomer, “Magnetic Properties of
Nanosize Iron Clusters”, proceedings of the spring MRS, San Francisco, CA, Apr 1994,.
[31] L.P. Gor’kov and G. M Eliashberg, Sov. Phys. - JETP 21,940 (1965).
[32] W. P. Halperin, Rev. Mod. Phys. 58,533 (1986).
[33] G. Nimtz and P. Marquardt, Phil. Msg. Letters 61,231 (1990) and references
therein. See also Phys. Rev. B _, (199?).
[34] Wilcoxon J., Sylwester A., Nigrey P., Martino A., Quintana C., and Baughman R.,
“Formation and Characterization of Highly-Dispersed Iron Catalysts”, in the Eighth Annual
International Pittsburgh Coal Conference Proceedings, 703-708, (1991).
[35] J. A. A. J. Perenboom, P. Wyder and F. Meier, Phys. Reports 78, 173 (1981).
[36] P. V. Ashrit, G. Bader, S. Badilescu, F. E. Girouard, L. Nguyen and V. Truong, J.
Appl. Phys. 74,602 (1993).
[37] S. P. Appell, J. Giraldo and S. Lundquist, Phase Transitions 24-26,577 (1990).
[38] M. Faraday, Transactions of the Faraday Society, 145,(1857).
[39] S. Tadao, Advances in Colloid and Interface Science, 28, 16, (1987).
[40] A. Henglein, Chem. Rev., 89, 1861, (1989).
[41] U. Kreibig, and L. Genzel, Surf. Sci., 156,678, (1985).
i
,
66

[42] S.M. Heard, F. Grieser, and C.G. Barraclough, J. CoIl. Inter. Sci., 93, 545,
(1983).
[43] D. R. Huffman in Optical Properies Associated with SmAll Particles, ed. R.K. Chang
and P.N. Barber, World Scientific, 1990.
[44] J. Hillier, J. Turkevich, and P.C. Stevenson, Trans. Faraday Sot. Discussion 11,55,
(1951).
[45] J. Turkevich, G. Garton, and P.C. Stevenson, J. Colloid Sci., Suppli. #1, 26,
(1954).
[46] Optical Constants of Solid, Ed D. Palik, Academic Press, (1985).
[47] D. Schonauer, H. Lauer, and U. Kreibig, Z. Phys. D, 20,301, (1991).
[48] CRC Handbook of Chemistry and Physics, 66th Ed.
[49] M. Kerker, “The Optics of Colloidal Silver: Something Old and Something New”,
J. Coil. and Inter. Sci., 105,(2), 297, (1985).
67

Appendix
List of publications and Presentations
blications.
J.P. Wilcoxon, G. Samara, and P. Newcomer, Optical Features of Nanosize Ironand Molybdenum Sulfide Clusters, Proceedings of Symposium F, meeting of theMRS Society, Boston, MA., (1995).
J.P. Wilcoxon and G.A. Samara, Strong Quantum-Size Effects in a LayeredSemiconductor: MoS2 Nanoclusters, Physical Rev B a, 7299 (1995).
Venturini E. L., Wilcoxon J. P., and Newcomer P. P., Magnetic Properties ofNanosize Iron Clusters, Symposium V, Proceedings of the Spring Meeting of theMaterials Research Sot., San Francisco, CA. (1994).
A. Martino, J.P. Wilcoxon, and J. Kawola , “Synthesis and Characterization of Feand FeS2 (Pyrite) Coal Liquefaction Catalysts in Inverse Micelles”, Energyand Fuels, & 1289 (1994).
Wilcoxon J.P., Martino T., E. Klavetter, and Sylwester A. P., Synthesis and CatalyticProperties of Metal and Semiconductor Nanoclusters, in Nanophase Materials,ed. G. Hadjipanaysis and D. Siegel, Kluwer Acad. Pub., 770-780, 1994.
?resentations~
*
.P. Wilcoxon, G. Samara, and P. Newcomer, Optical Features of Nanosize Ironand Molybdenum Sulfide Clusters, Symposium F, 1994 meeting of the MRSSociety, Boston, MA.
J.P. Wilcoxon, G. Samara, and P. Newcommer, Optical and Catalytic Propertiesof Nanosize Metal Sulfide Clusters. 1994 meeting of the American PhysicalSociety, March 221994, Pittsburgh, PA
Venturini E. L., Wilcoxon J. P., and Newcomer P. P., Magnetic Properties ofNanosize Iron Clusters, Symposium V, Spring Meeting of the Materials ResearchSot., San Francisco, CA. (1994).
E.L Venturini, J.P. Wilcoxon, P.P. Newcomer, and G.A. Samara, Static MagneticProperties of Nanosize Iron Clusters, 1994 meeting of the American PhysicalSociety, March 221994, Pittsburgh, PA
Wilcoxon J.P., Martino T., E. Klavetter, and Sylwester A.P., Synthesis and Catalytic rProperties of Metal and Semiconductor Nanoclusters. in Nanophase Materials,NATO ASI meeting, Corfu, Greece, June 1993. (invited) ,
J.P. Wilcoxon, G. Samara, and P. Newcomer, Strong Quantum-Size Effects in aLayered Semiconductor: MoS2 Nanoclusters, 1993 meeting of the AmericanPhysical Society, March 22, 1993, Seattle, WA.
68

J. Wilcoxon, G. Samara, A. Martino, and R. Baughman, Synthesis and Size-Dependent Optical, Dielectric, and Catalytic Properties of Metal Clusters,1993 meeting of the American Physical Society, March 22, 1993, Seattle, WA.
A. Martino, J. Wilcoxon, A.P. Sylwester, and J.S. Kawola, Synthesis andCharacterization of Fe and FeS2 (pyrite) Catalysts Particles in InverseMicelles, Proceedings of the 205th National American Chemical Sot. meeting, Miami,(1993).
List of Invention Disclosures:
None
List of patents:
None
List of copyrights:
None
Employee recruitment
D. E. Bliss hired as Post Doc
Student Involvement:
None
Follow On Work:
New BES initiative on Nanoclusters for Energy Applications funded.
69

Distribution:
1 MS-14361 MS-14271 MS-142110 MS-14215 MS-14211 MS-14211 MS-14211 MS-11341 MS-11341 MS-90185 MS-08991 MS-06192 MS-O1OO44
C. E. Meyers, 1007P. L. Mattem, 1100P. P. Newcomer, 1152G. A. Sarnara, 1152J. P. Wilcoxon, 1152E. B. Stechel, 1153E. L. Venturini, 1153B. K. Damkroger, 1833R. L. Williamson, 1833Central Tech Files, 8523-2Technical Library, 13414Print Media, 12615Document Processing, 7613-2DOIYOSTI
70
Top Related