


Languages
Pages
Legal


1
Electric Breakdown
Voltage
Chris Rowan | Anthony Thompson | Philip de la Vergne | Aaron Wascom | Brandon Sciortino
http://www.scienceclarified.com/Di-El/Electric-Arc.html

2
Mission Goal The goal of this
payload is to understand the relationship of temperature and humidity on electric breakdown voltage.
http://commons.wikimedia.org/wiki/File:Paschen_Curves.PNG

3
Science Objectives
Recreate as closely as possible Paschen’s curve using a corona discharge
Deviations from Paschen’s curve will be used to understand the relation of temperature and humidity on the minimum breakdown voltage
4
Technical Objective
At the conclusion of our flight, our payload will have stored data during flight on:o Pressureo Temperatureo Humidityo Timeo Voltage across the spark gapo Currents across the spark gap indicating an electrical
breakdown

5
Science Background: Terms
Corona Discharge: An electrical discharge due to ionization of the fluid around a conductor
Spark Gap: A space between two high-potential terminals (as of an induction coil or spark plug) through which pass discharges of electricity
Electric Potential: The maximum amount of energy which can be exerted by each unit of charge in the conductor that is experiencing a force due to an electric field
6
Science Background: Corona Current
Electric breakdown will be determined by magnitudes of current across the spark gap
Current carried by corona discharge is an integral of the current density over the surface of the conductor
Current carried by corona discharge is measured in microamperes

7
Science Background: Discharge Mechanism
Coronal discharges are a result of chain reactions in which neutral atoms are ionized by high energy particles in the atmosphere.
When neutral atoms are ionized they release free electrons which then feel coulomb forces due to the electric field.
The positively and negatively charged particles are accelerated in opposite directions and given a kinetic energy

8
Science Background: Avalanche Effect
The chain reactions are commonly called electron avalanches because as the kinetic energy in free electrons in the field increase they gain the ability to ionize other neutral atoms they collide with.

9
Science Background: Avalanche Effect Cont.
10
Science Background: Paschen’s Curve
This data graph can be used as a way to predict the voltage values, while neglecting temperature, humidity, and air ionization, which are needed to successfully discharge across a spark gap
10k
20k
Volt
age
30k
50k
100kPressure

11
Power Requirements DC/DC converter shall provide a voltage capable
of creating an electrical breakdown across the spark gap throughout the flight
Spark gap will be set to a distance allowing for an electrical breakdown to occur throughout the flight within the power and structural constraints
12
Data Requirements Accurately timestamp the ambient pressure, temperature, and
humidity around the payload.
Accurately timestamp the times in which a current indicating electrical breakdown occurs
Data will be collected at a time interval that will observe all incremental changes in breakdown voltage
Data collected shall be stored by an archive system capable of being extracted, processed, and analyzed at the conclusion of the flight
Ammeter shall be accurate to the microampere
13
Structure Requirements
The payload will remain fully functional during the thermal, vacuum, and shock preflight tests
The payload will have one face with two 17 cm holes cut for the LaACES interface
The payload shall not weigh more than 500g

14
Payload Design Parts are readily available at a reasonable price
Mass and size of the parts are within the constraints of the payload interface set LaACES managemento DC to HV DC convertero Ammeter Design
15
Payload Design: Principle of Operation
The analog signals from the sensors will be conditioned before entering the Analog-Digital converter and stored to the EEPROM via the Basic Stamp
The BalloonSat shall control the voltage amplification of the DC/DC converter via the Digital-Analog converter
The BalloonSat shall store true binary values for current to the EEPROM indicating an electrical breakdown

16
Payload Design: System Design

17
Payload Design: Mechanical External Design
The payload will have dimensions of 17 cm x 10 cm x 10 cm
At least ¾ inch wall thickness
The 17 cm holes will be on the 17 cm face and through the payload walls
The top face will have a lid for access
18
Payload Design: Mechanical Internal Design
Each part will be attached to two walls for stability during flight and landing
Cables will be as direct as possible to prevent cables acting as antennae
The spark device will be in an individual compartment with holes for ventilation

19
Payload Design: Mass Management
Part Weight Uncertainty
Payload Interfacing 65g +/-15
BalloonSat 70g +/-5
Power Source 100g +/-50
Payload Casing 60g +/-20
DC to HV DCConverter
30g +/- 20
Ammeter 40g +/- 15
Total 365g +/- 125g

20
Payload Design: Power Budget
Current Power mA(4*h)
DC to HV DC Converter
250 mA MAX 1000mAh
BalloonSat 60 mA 240mAh
Payload Interface 36 mA 144mAh
Total 346 mA 1384 mAh

21
Project Management All documents will follow version control as stated
in team contract
Project Manager coordinates functional groups
Team meetings at least 3 times a week
Deadlines for incremental tasks set
Risk Management

22
Project Management: Organization
Responsibility Team Member
Project Leader Anthony Thompson
Documentation Chris Rowan
Mechanical Engineer Anthony Thompson
Electrical Engineer Philip de la Vergne
Software Developer Aaron Wascom
Calibration Brandon Sciortino
Electronics Philip de la Vergne
Integration Chris Rowan
Data Processing Anthony Thompson
Analysis Chris Rowan
Testing Brandon Sciortino

23
Project Management: Master Schedule

Spectral Analysis By:
Chris RowanAnthony ThompsonPhilip de la Vergne
Aaron WascomBrandon Sciortino
24
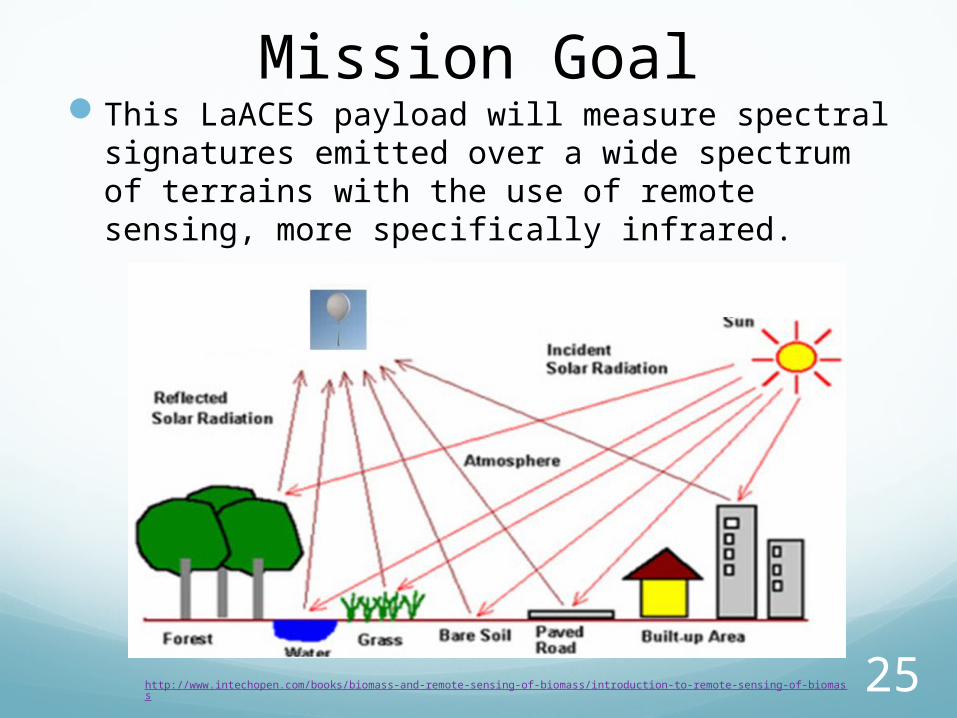
Mission GoalThis LaACES payload will measure spectral
signatures emitted over a wide spectrum of terrains with the use of remote sensing, more specifically infrared.
http://www.intechopen.com/books/biomass-and-remote-sensing-of-biomass/introduction-to-remote-sensing-of-biomass 25
Science ObjectivesIdentify different topography features flown over
during flight to establish ground truth
Collect and record images at high altitude
Compare and contrast infrared images of the topography with other remote sensing sources and Team Chosen
Determine the latitude, longitude, and altitude of each image location
26

Technical ObjectivesMeasure the reflectance properties of various
terrains
Successfully launch an optical sensor payload
Determine location of the payload in relationship to the launch point and the ground with GPS
Extract, process, and analyze data stored on the payload
27
Science BackgroundRemote Sensing
Acquisition of information about an object or phenomenon without making physical contact
Use of aerial sensor technologies to detect and classify objects on Earth by means of propagated signals
Photographic cameras, mechanical scanners, and imaging radar systems
28

Science BackgroundActive vs. Passive
Active
Beam artificially produced energy to a target and record the reflected component
Passive
Detect only energy emanating naturally from an object
http://www.intechopen.com/books/biomass-and-remote-sensing-of-biomass/introduction-to-remote-sensing-of-biomass29

Science BackgroundInfrared
Light with longer wavelengths than visible light
Extending from the red edge of the visible spectrum
http://gers.uprm.edu/geol6225/pdfs/06_thermal_rs.pdf
30

Science BackgroundSpectral Signature
The ratio of reflected energy to incident energy as a function of wavelength
Various materials of the earth’s surface have different spectral reflectance characteristics
The spectral reflectance is dependent on wavelength; moreover, it has different values at different wavelengths for a given terrain feature
31
Science BackgroundCharacteristics of Terrain
Reflected energy from an object can be measured, and a spectral signature can be formed
By comparing the response pattern of different features, distinctions between them can be made
32

Science BackgroundCharacteristics of Terrain
Water
Longer wavelength in visible and near infrared radiation is absorbed more by water than shorter visible wavelengths
Typically looks blue or blue-green due to stronger reflectance at these shorter wavelengths, and darker if viewed at red or near infrared wavelengths.
33
Science BackgroundCharacteristics of Terrain
Vegetation
Chlorophyll strongly absorbs radiation in the red and blue wavelengths but reflects green wavelengths
The internal structure of healthy leaves act as excellent diffuse reflectors of near-infrared wavelengths
34

Science BackgroundCharacteristics of Terrain
Soil
They tend to have high reflectance in all bands
Dependent on factors such as the color, constituents, and moisture content
35
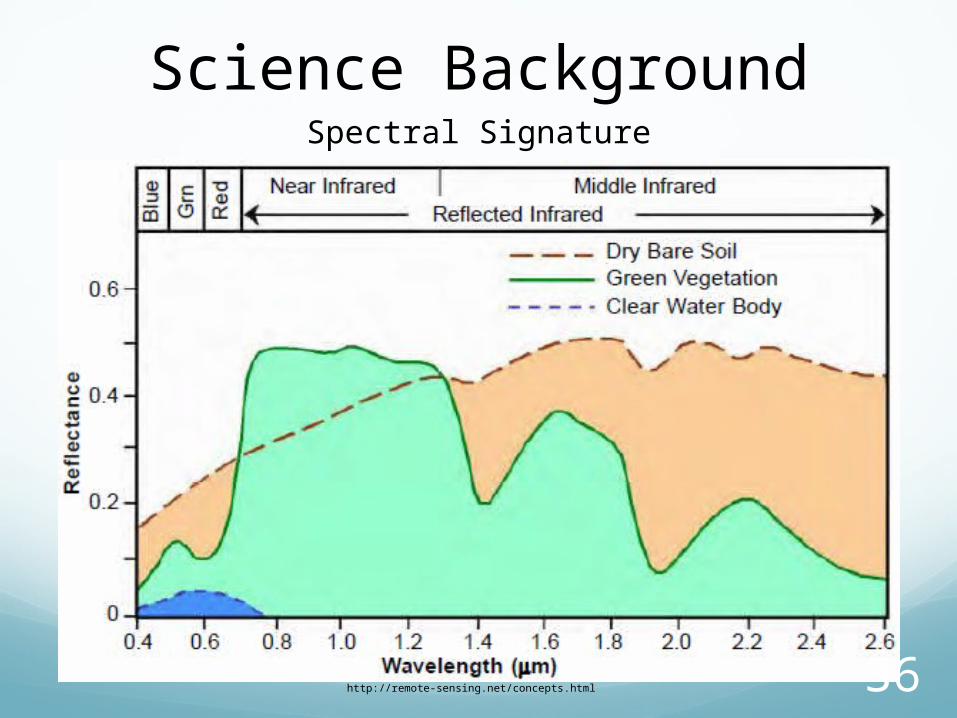
Science BackgroundSpectral Signature
http://remote-sensing.net/concepts.html 36

Science BackgroundSpatial Resolution
The spatial resolution, also known as ground resolution, is the ground area imaged for the instantaneous field of view (IFOV) of the sensing device
Spatial resolution may also be described as the ground surface area that forms one pixel in the camera image
37
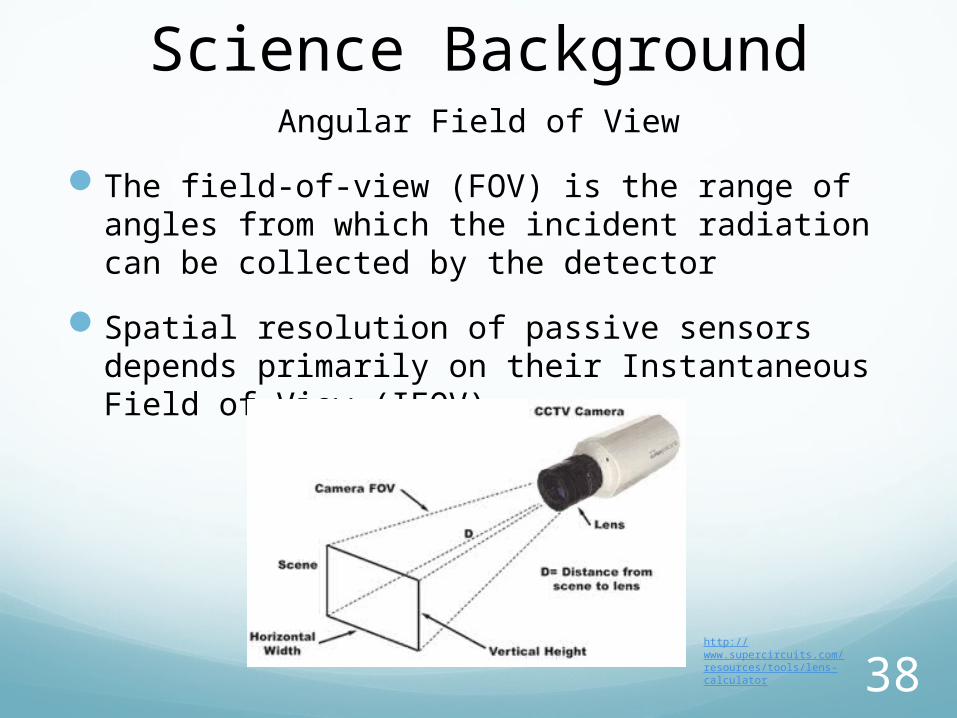
Science BackgroundAngular Field of View
The field-of-view (FOV) is the range of angles from which the incident radiation can be collected by the detector
Spatial resolution of passive sensors depends primarily on their Instantaneous Field of View (IFOV)
http://www.supercircuits.com/resources/tools/lens-calculator
38

Science Background
The smallest detail that you can get an accurate temperature measurement upon at a set distance
The signal recorded by a detector element is proportional to the total radiation collected within its IFOV.
Instantaneous Field of View
http://www.crisp.nus.edu.sg/~research/tutorial/image.htm#ifov 39

Science Background
A. the angular cone of visibility of the sensor
B. the area on the Earth's surface which is "seen" from a given altitude
C. The size of the area viewed is determined by multiplying the IFOV by the distance from the ground to the
sensor
Instantaneous Field of View
40
Science BackgroundPixels
A digital image comprises of a two dimensional array of individual picture elements
Each pixel represents an area on the Earth's surface.
1. Intensity Value
2. Location Address
41
Science BackgroundPixels
Intensity Value
The measured physical quantity such as the solar radiance in a given wavelength band reflected from the ground
This value is normally the average value for the whole ground area covered by the pixel
42

Science BackgroundPixels
Location Address
Denoted by its row and column coordinates in the two-dimensional image.
In order to be useful, the exact geographical location of each pixel on the ground must be derivable from its row and column
43

Science BackgroundPixels
http://www.intechopen.com/books/biomass-and-remote-sensing-of-biomass/introduction-to-remote-sensing-of-biomass
44

Science BackgroundFilters
Filters are used to zone in on portion of the EM Spectrum
There are two types of filters1. Lens filters
2. Image processing filters
45

Science BackgroundFilters
Lens Filter
Applied directly to the remote sensor to only capture selected portions of the spectrum
Band-Pass filter selecting a specified wavelength
46

Science BackgroundFilter
Processing Filters
Applied during post processing to zone in on specific intensities
Band-Pass filter selection of a specified intensity
47

Science BackgroundFilter
Processing FiltersLow-Pass – removes high data pointsHigh-Pass – removes low data pointsBand-Pass – keeps all data within a specified bandBand-Reject – removes all data within a specified
band
48

Additional Uses
Determining the health of specific vegetation
Identifying specific types of vegetation through the analysation of their specified emittance
Law Enforcement can locate illegal plant growth such as the Cannabis plants
49
RequirementsThe camera must cover near infrared
The camera shall be at a 0° angle with respect to the payload
The camera must be the lowest payload on the launch, to avoid camera obstructions
The camera shall provide a pixel and spatial resolution falling within the suitable scope for long-range photography
Camera must be capable of zooming at various rates during different points of the flight to compensate for altitude changes
50
RequirementsThe remote sensing must be equipped with a
proper filter lens that records near infrared
Pictures will be taken at the highest rate possible before resolution becomes no good
Adequate amount of storage on board to store photos
The timestamp on the BalloonSat must match the timestamp on the GPS locater
A timestamp will be recorded on each photograph
51

RequirementsThe payload shall remain fully functional during
the thermal, vacuum, and shock preflight tests
The payload will have two holes 17 cm apart for the LaACES interfacing
The payload will have a mass of less than 500 grams
52

RequirementsDeadlines
A Pre-PDR shall be completed by January 15, 2013
A PDR document shall be completed by February 5, 2013
A Pre-CDR shall be completed by March 5, 2013
A CDR document shall be completed March 26, 2013
An FRR document shall be completed by April 30, 2013
53
Payload DesignPrinciple of Operation
An infrared camera will capture images of the ground during the duration of flight
Filters will be applied during flight and post flight in order to analyze and determine each topographic feature captured
The BalloonSat will control the camera’s zoom and capture rate
54

Payload DesignSystem Design
55
Payload DesignMechanical Design
Infrared camera positioned 0 degrees with respected to the payloadPoints directly at the ground
The camera must be at the bottom of the payloadClear view of the ground
56
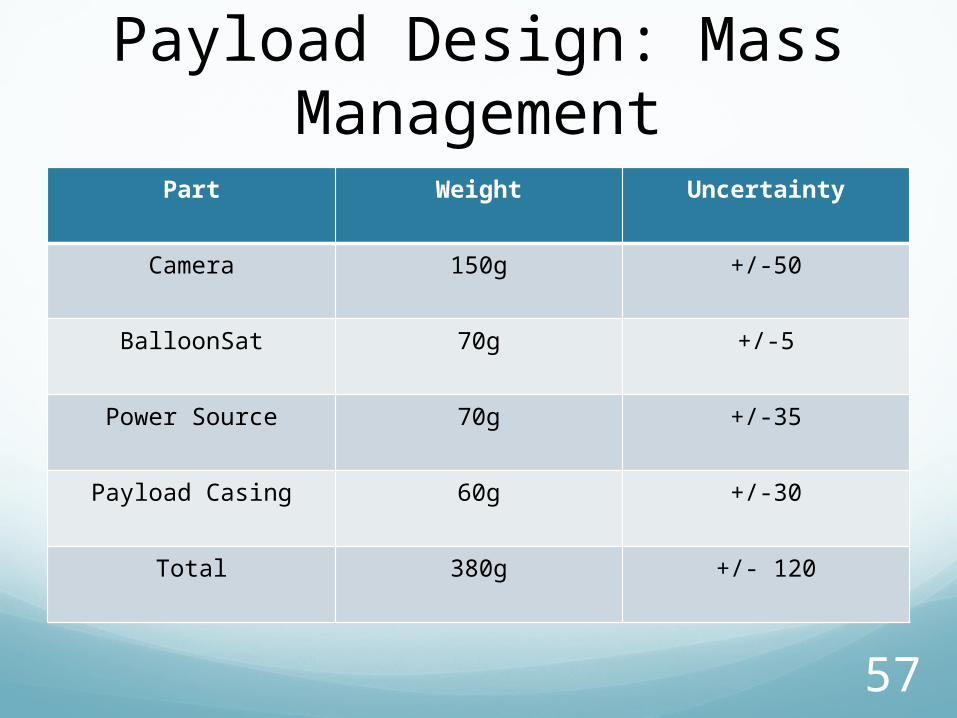
Payload Design: Mass Management
Part Weight Uncertainty
Camera 150g +/-50
BalloonSat 70g +/-5
Power Source 70g +/-35
Payload Casing 60g +/-30
Total 380g +/- 120
57

Payload Design: Power Budget
Sensors Current PowermA*(4h)
BalloonSat 60 mA 240 mAh
Camera 440 mA 1760 mAh
Total 500 mA 2000 mAh
58

Project Management All documents will follow version control as stated
in team contract
Project Manager coordinates functional groups
Team meetings at least 3 times a week
Deadlines for incremental tasks set
Risk Management
59

Master Schedule
60
Top Related