


Languages
Pages
Legal


APPROVAL SHEET
/ ~ I
Title of Dissertation: t/ THE DETERREN"CE EFFECT OF POLICE PRESENCE: AN EMPIRICAL TEST
Name of' Candidate: Stephen Eugene Brown Doctor of Philosophy, 1979
Dissertation and Abstract Approved:
Date Approved:
Dr. Bruce'H. Johnson Assistant Professor Institute of Criminal Justice and 9rimino1ogy
-------------------
, , ."
If you have issues viewing or accessing this file contact us at NCJRS.gov.

CURRICULUM VITAE
Name: stephen Eugene Brown.
Perman,ent Address: 1905 Rustic Road, Jopnson City, Tennessee, 37601.
Degree and date to be conferred: Ph.D., 1979.
Date of birth: June 17, 1951.
Place of birth: Knoxville, Tennessee.
Secondary education: Farragut High School, Concord, Tennessee, 1969.
Collegiate institutions attended Dates . Degree Date of Degree
Cumberland College
University of New Orleans
Eastern Kentucky University
Eastern Kentucky University
University of Maryland
1969-1970
1970-1972
1972-1974
1975-1976
1976-1979
B.A.
M.S.
Ph.D.
1974
1976
1979
Major: Criminal Justice and Criminology.
Professional positions held: Instructor, University of Maryland, College Park, Maryland. 1978-1979.
Assistant Professor, East Tennessee State University, Johnson City, Tennessee. 1979-
.. -

ABSTRACT
Title. of Dissertation: The Deterrent Effect of Police Presence: An Empirical Test
Stephen Eugene Brown, Doctor of Philosophy, 1979
Dissertation directed by: Dr. Bruce H. Johnson, Assistant Professor, Institute of Crim~nal Justice and Criminology
A theoretical model of the deterrent effect of
police presence is proposed and tested in this
dissertation. It is important to have a historical·
perspective on deterrence theory as it relates to the
police. It is an issue which has been seriously plagued
by ideological bias. Until recent years there was an
unquestioned assumption in police circles that police
presence does have a deterrent effect on crime. American
criminologi~ts on the other hand, assumed until very
recent years that deterrence in general does not work.
The unfortunate effect of these assumptions was a
repression of scientific inquiry. Thus deterrence theory
in general is relatively unsophisticated and the empirical
evidence reflecting on it sparse, while the specific
issue of the deterrent effect of police presence is even . . ~ less refined.
The model presented in this research assimilates
theoretical and empirical contributions from three major
.e perspectives: criminological deterrence research, police
evaluation research, and that of econometricians. The
criminological research has consistently found negative
relationships between crime and various indicators of
certainty of punishment, which is consistent with a
deterrence hypothesis. On numerous occasions, variations
in police presence have been introduced by police
organizations. Evaluations of these changes suggest that
police presence has a differential deterrent impact
dependent upon several other factors. The major
contributions of econometricia.ns have been'methodological.
Among the most important of these is their recognition of
simultaneous relationships in deterrence models and the
development of appropriate statistical techniques for
dealing with this.
In the present research, city data were used to
test a model which consists of five endogenous and 11
exogenous variables. It was necessary to employ a
two-tier population sample since data for all variables
were not available for the larger sample. Since the model
is nonrecursive, the data were analyzed using two-stage
least-squares regression.
A crime-specific analysis was employed and
predictions of their fit to the model were made based·,o.n
the assumption that crimes which are more rational and
those which are more visible would be most deterrable.

The offenses which fitted the model most consistently
were rape and auto theft. Aside from the fit of specific
crimes to the full model, several important findings
emerged in the estimation of individual equations. One
of the most interesting was that per capita police are a
strong positive function of rates of murder, rape,
robbery, and auto theft. It was argued that these crimes
generate political demand for more police. Another
finding with major implications was the.lack of any
substantial relationship between levels of police
presence and rates of clearance.
Recommendations for future research cC1.11 for
stucry of the dynamics of clearance rates, the relation
ship between police presence and clearance rates, and of
perceptions of police presence. The complexities of
deterrence are beginning to be recognized.
. .-

" ~
THE DETERRENT EFFECT OF POLICE PRESENCE:
AN EMPIRICAL TEST
by Stephen Eugene Brown
Dissertation submit'ted to the Faculty of the Graduate School of the University of Maryland in partial fulfillment
of the requirements for the degree of Doctor of Philosophy
1979 " .'

-------~-----~
ACKNOWLEDGMENT
I would like to express my gratitude for the
guidance provided by Dr. Bruce Johnson in directing this
dissertation. The contri.butions of the other faculty of
the Institute of Criminal Justice and Criminology who
served on the committee are also greatly appreciated.
These individuals are Dr. Peter Lejins, Dr. W. William
Minor, and Dr. Barton Ingraham. Each of these persons
contributed not only to the dissertation, but to the
overall quality of my graduate studies. Acknowledgment
is also due Dean Rudolph Lamone of the College of Business
and Management for serving as the representative of the
Graduate Dean.
Appreciation is extended to Howard Teton of the
Federal Bureau of Investigation in Quantico, Virginia for
his assistance in acquiring data. The Law Enforcement
Assistance Administration provided partial support for
my doctoral studies through a fellowship award. The
Computer Science Center at the University of Maryland
provided computer SUPP9rt.
Finally, I would like to thank those who provided
personal support during this endeavor. My wife, Brenda,
assisted in numerous tasks as well as providing moral" ,"
ii

iii
support. My mother, Ms. Peggy Brown, provided inspiration
through her. continuous expression of confidence and
encouJ;"agement.
. .-

CONTENTS
Page
ACKNOWLEDGMENT • • Ii • '" . . . ii
LIST OF TABLES . . . . . . vii
LIST OF FIGURES . . ~ . . . . . . ix
Chapter
I.
II.
HISTORICAL BACKGROUND OF THE POLICE AND DETERRENCE THEORY •.••• 1
Deterrence Theory and the Police • •• 2 Th$ Peelian Reform . • . • • .. 3 The First War on Crime ••. . • • • •• 4 The Second War on Crime • .. .. • .. .... 7 Questioning the Deterrence Premise .... 9 Conclusion .. • • .. ,. .. .• 10
Deterrence Theory and the Early Criminologists ........ .
Summary • .. • .. • • • • • • • • • • • • • G
DETERRENCE RESEARCH ~ •
Criminological Research • • • • .. .. • • • .. 'Aggregate Data Analysis •••• Survey Research • • • • • .. • • • .. .. .. .. Experimental Research • • • • • Conclusion • • .. .. .. .. • . . . .
'Police Evaluation Research .. .. .. • .. .. .. .. Early Experiments • • • • • • .. Operation 25 .......... • • • • • .. Beat Patrol Experiment •••• • • .. 20th Precinct Experiment ....... .. Subway Experiment • • • • • • • • • • Generalizing from the Early Foot
Patrol Experiments .... ..... .. .. ' .. _ Washington, D. C. Experiment ........ . Kansas City Preventive Patrol
Experiment • • • • • • . .. . iv
11
14
15
17 17 19 20 21
21 22 22 24 25 26
26 27
30

Chapter
III.
IV.
Theoretical Deficiencies • • • • • • • • Failure to Achieve Experimental
Conditions • • • • • • • • • • • • • • Failure to Control and/or Monitor
Extraneous Variables • • • • • • • • • Generalizing the Findings • • • • • • • Post-Kansas City Experiments • • • • • • Conclusion • • •• • • • • • • • • •
Econometric Research • • • • • • • • • The Focus on Police Resources • • • • • The Issue of Simultaneity • • • • .• • • Conclusion • • • • • • • • • • • • •
Summary
A THEORETICAL MODEL OF THE DETERRENT EFFECT OF ~OLICE PRESENCE
v
Page
31
32
34 34 35 39
40 41 43 46
47
50
Elaboration of the Model • • . 50 Police • • • • • • • • • • • • • • • •. 55 Police Presence • • • • • • • • •• 56 Citizen Perception of Police
Presence • • • • • • • • • • • •• 57 Certainty of App~ehension • • • • • • • 57 Crime • • • • • • ~ • • •• 60 Exogenous Variables • • • • • • • • •• 64
Summary • • • • - . -. . . . . 66
RESEARCH METHODS • . .. - . 67
St.atistical Assumptions • . • • • •• 68 Conventional Regression Assumptions 68 Linearity • • • • • • • M • • • • • •• 68 Interval Scales • • • • • • • • • • •• 69 Representative Sample • • • • • • • •• 69 Normality and Homoscedasticity • 70 Minimal Measurement Error • • • • • •• 71 Modeling Assumptions • • • • • • • • •• 72
Measurement Issues • • • • • • • • • • Uniform Crime Reports • • • • • • • • • Crime Rates • • • • ~ • • • • • • • Clearance Rates ••••••• • • • • • Police Employee Data • • . • • • • • • • National Crime Surveys • • • • • • • Other Sources ~............
. "
74 74 75 77 78 79 82

Chapter
Procedures for Analysis • • • • •
Summary • • • • • .. · - . . V. ANALYSIS OF SAMPLE A • • • • ~ • • • • • • •
Police . . . . . ~ . . . . . . . -Police Presence • .. . . · .. Certainty of Apprehension • • . . . Crime •
Summary . . . . . . VI. ANALYSIS OF SAMPLE B
Police . . . . . . . . ~ . . . . . . . . . Police Presence •
Perception of Police Presence
Certainty of Apprehension
Crime • • • . . . CI • • •
· . . · . . · . .
Summary . . . . 11 • • .• • •
VII. SUMMARY AND CONCLUSIONS • • • • • • •
sUmmary of Findings • . . . Sample Comparisons . . .. . . . . Research Directions • · . .
REFERENCES . . . . . . . . . . . . . . .
· .. . . · ., . . · ..
· . . . · . . . · . . .
· . . .
. . . -
vi
Page
83
84
85
86
89
90
9s 100
102
103
104
107
108
114
121
124
125
130
146
148

TABLES
Table'
1. PERCENT INCREASES IN POLICE PRESENCE BY EXPERIMENTAL PERIOD (Bum1ick, 1973)
2. INDICATORS FOR VARIABLES IN THE MODEL
3. STRUCTURAL EQUATIONS FOR THE MODEL • • •
4. NATIONAL CRIME SURVEY ITEM EMPLOYED AS A MEASURE OF CITIZEN PERCEPTION OF POLICE
Page
28
52
55
PRESENCE (GAROFALO, 1977) • • • • 58
5. DEFINITIONS FOR INDEX CRIMES. • • • 76
6. THE NATIONAL CRIME SURVEY SAMPLES
7. SIr-lPLE CORRELATIONS FOR ALL VARIABLES EMPLOYED IN 'rHE ANALYSIS OF SAMPLE A
8. ESTIMATED VALUES FOR THE POLICE EQUATIONS
9. ESTIMATED VALUES FOR THE PATROL EQUATION
10. ESTIMATED VALUES FOR THE CLEARANCE EQUATIONS • 0 • • • • • • • . . .
11. ESTIMATED VALUES FOR THE CRIME EQUATIONS
12. CORRELATIONS OF KEY VARIABLES IN THE ROBBERY EQUATION ~ • • • • • • • •
. .
13. COMPARISON OF ORDINARY AND TWO-STAGE-LEAST-
80
86
87
89
92
94
96
SQUARES FOR THE ROBBERY EQUATION • • • • • 97
14. SIMPLE CORRELATIONS FOR ALL VARIABLES EMPLOYED IN THE ANALYSIS OF SAMPLE B
15. ESTIMATED VALUES FOR THE- POLICE EQUA'rIONS
16. ESTIMATED VALUES FOR THE PATROL EQUATION
17. ESTIMATED VALUES FOR THE PERCEPTION OF POLICE PRESENCE EQUATIONS • • no.
vii
103
105
107 . . ,-109
rfab1e
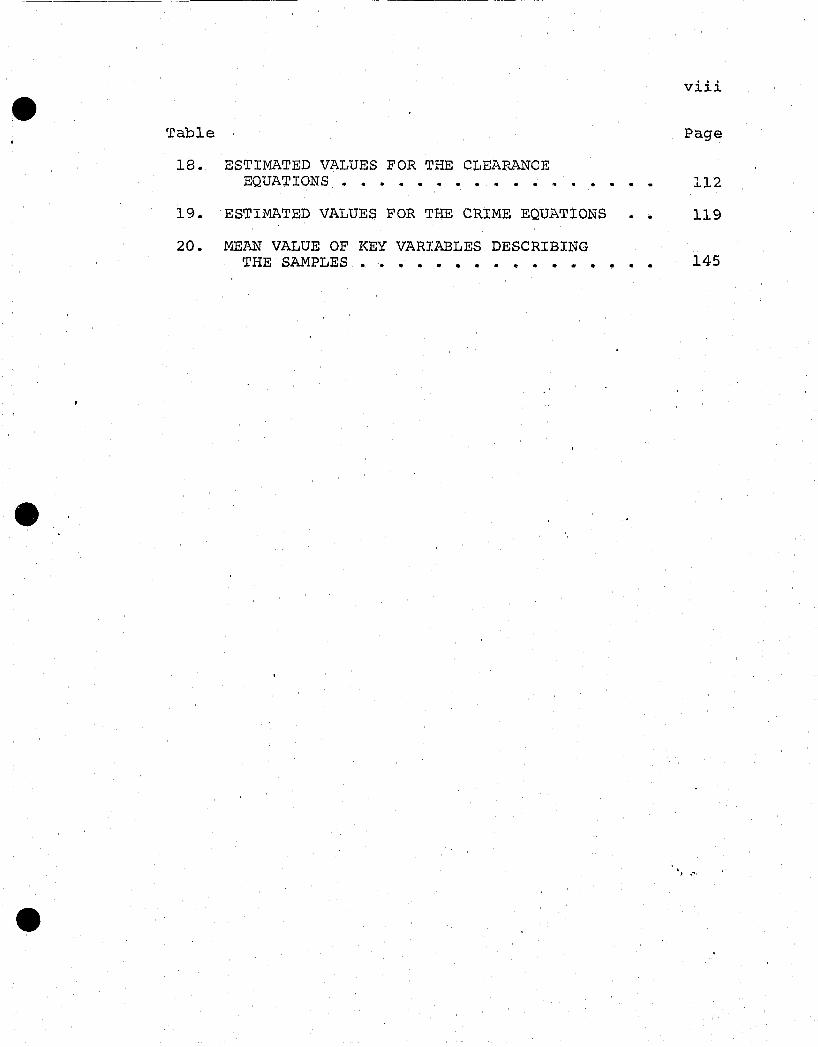
18. ESTIMATED VALUES FOR THE CLEARANCE EQUATIONS • • • • • • • • • • • ~
19. ESTIMATED VALUES FOR THE CRIME EQUATIONS
20. MEAN VALUE OF KEY VARJ:ABLES DESCRIBING THE SAMPLES • • • • • • • • • • • .. • •
. .
viii
Page
112
119
145
.. -
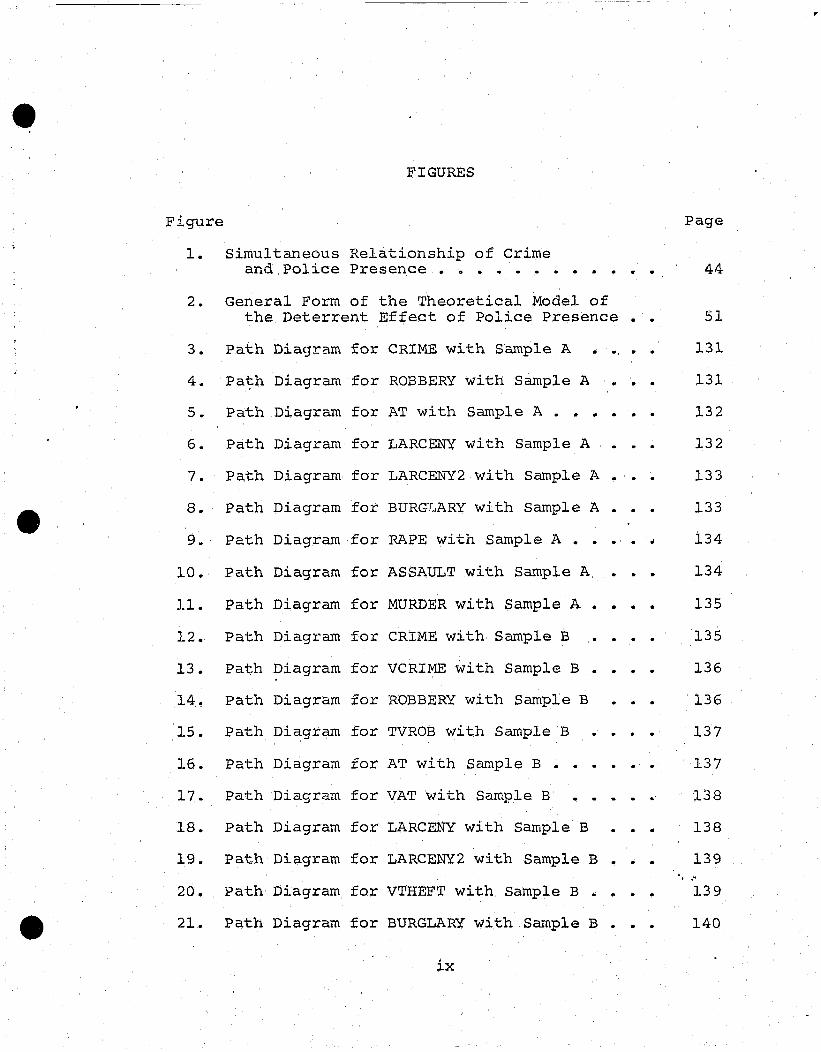
e FIGURES
Figure Page
1. Simultaneous Relationship of crime and Police Presence . 0 . " . · · • · · 44
2. General Form of the Theoretical Model of the Deterrent Effect of Police Presence · · 51
3. Path Diagram for CRIME with Sample A • ., · · 131
4. Path Diagram for ROBBERY with Sample A · · · 131
5. Path Diagram for AT with Sample A . · • · 132
6. Path Diagram for LARCENY with Sample A · · · 132
7. Path Diagram for LARCENY 2 with Sample A · 133
8. Path Diagram for BURGT .. ARY with Sample A · 133
9. Path Diagram for RAPE with Sample A · · .: 134
10. Path Diagram for ASSAULT with Sample A · · · 134
11. Path Diagram for MURDER with Sample A · • · • 135
12. Path Diagram for CRIME with Sample B · · · · 135
13. Path Diagram for VCRIME with Sample B · · · · 136
14. Path Diagram for ROBBERY with Sample B · · · 136
15. Path Diagram for TVROB with Sample B · · · · 137
16. Path Diagram for AT with Sample B . · · · 137
17. Path Diagram for VAT with Sample B · · · '138
18. Path Diagram for LARCENY with Sample B · · · 138
19. Pat.h Diagram for LARCENY2 with Sample B · 139 , ."
20. Path Diagram for VTHEFT with Sample B · ~ · · 139
21. Path Diagram for BURGLARY with Sample B · 140
ix

, .. ~

CHAPTER I
HISTORICAL BACKGROUND OF THE POLICE AND DETERRENCE THEORY
A central issue in the organization of any criminal
justice system is the concept of deterrence. Any system
for dealing with crime must rest on either the ~remise that
crime can or that it cannot be affected through the
application of punitive sanctions. If it is concluded that
crime can be controlled by these means then it becomes
necessary to identify the parameters of that presumed
deterrent effect. Neither the importance nor the
complexity of this issue can be overstated. However, a
historical review reveals a remarkable failure to address
it objectively. Instead, the issue is one that has been
plagued by ideological bias. Johannes Andenaes (1966:953)
was one of the first to draw attention to this, pointing
out that "statements about general prevention are often
dogmatic and emotional. They are proclamations of faith
which are used as arguments either in favor or in
opposition to the prevailing system."
This bias becomes particularly evident when we focus
on deterrence in the context of the police. Historical
literature reveals that there was an obvious assumption'· in
police circles that daterrence does work from the time of
1

the Peelian Reform until very recent years. An equally
obvious assumption that deterrence does not work is evident
in the writings of criminologists for most of this century.
This chapter briefly reviews the history of deterrence
theory in both police and criminological circles,
suggesting why we have relatively little evidence
reflecting on the issue of the deterrent effect of police
presence.
Deterrence Theory and the Police
The history of the police shows that they ha,ve been
viewed primarily as crime fighters with the assumption that
they can bring about a reduction in crime primarily through
the deterrent effect of their presence. Several of the
times that crime has been perceived as being at crisis
proportions, attention has been turned to the police in
hopes that adjusting their operations would remedy the 1 .
problem. This section reviews three periods during which
such reforms were undertaken: the Peelian Reform, the
first war on crime, and the second war on crime.
lIt should be clear that major reform movements other than those focusing on the police have been activated in response to real or perceived crime problems. However, the focus here is on the consistent underlying assumption of police reforms.
2
•
---------- ------ --- -- -
The Peelian Reform
If the origin of our contemporary system of
policing were traced to a single event, it clearly would be
the Metropolitan Police Act of 1829 in England. The act is
commonly referred to as the "Peelian Reform" since it was
the fruit of several years of labor by Sir Robert Peel
while he was serving in the position of Home Secretary.
The Peelian Reform fos.tered several major changes in the
English police system which were later adopt,ed in the
united States and have persisted as basic principles in
our system.
The principle on which it is important to focus is
that of the police as a preventive force. 2 The English
citizenry and Americans have historically had a tradition
of suspicion of centralized power (Damaska, 1975;
Richardson, 1974). This made it difficult for Peel to
acquire the political support necessary to implement the
police reforms he envisioned. Such support was secured by . emphasizing that the primary function of his new police
would be the prevention of crime by patrolling the streets
in uniform (Critchley, 1972; Lyman, 1964). Peel's
2Crime prevention was not the only factor contributing to the Pee1ian Reform l but was the major . ~ officially recognized theme. Other major themes include relieving citizens of responsibility for policing, the control of the "dangerous classes" (Silver, 1967; Richardson, 1974)1 and mitigation of the harshness of punishments (Lyman, 1964).
3

philosophy is reflected in the original instructions issued
by his first two Commissioners:
It should be understood, at the outset, that the principal object to be attained is the prevention of crime.
The absence of crime will be considered the best proof of the complete efficiency of the Police (Lyman, 1964:153).
The First War on Crime
Tf'lis conception of the police a.s a preventive or
deterrent force persisted for nearly a century and a half
after the Peelian Reform without being seriously
questioned. Crime again emerged as a leading public
cOl'lcern in the 1920' sand 1930' s and the police were thrust
into the forefront of this debate. Two national
commissions studied the problem as well as state and local
groups, resulting in the evolvement of a "war against
crime" mentality (Douthit, 1975}.3 The implicit
assumption of most of those involved in these inquiries was
that the criminal justice system could do something about
crime and that the police in particular could reduce crime
by becoming more efficient in their deterrent and
3The two national commissions were the National Crime commission (1925) and the National Commission on Law Observance and Enforcement, also referred to as the Wickersham Commission (1929). The Illinois Associatioh~ for Criminal Justice (1929) and the Missouri Association for Criminal Justice (1926) are two state groups which produced reports. The Cleveland Foundation (1922) and the Citizen's Police Committee in Chicago (1931) produced well-known local reports.
4

apprehension roles. This theme is reflected in August
Vollmer's (1936) classic book on the police which
delineated the improvements he thought necessary to provide
efficient police service. Regarding patrol, he said that
it "is society's best defense against the criminal. The
mere sight of uniformed officials diligently patr~lling
beats is often sufficient to deter the community's weaker
members from committing legal infractions" (1936:217).
The report of The citizens Police Committee in Chicago
(1931) reflected similar views which are representative of
those taken by the many commissions which studied the crime
problem in that era. They concluded that reforms which
lido not strike at the root of the police problem lJ will be
inadequate and that major changes are necessary to remedy
police inefficiency and corruption (1931:273). AS for the
place of patrol in achieving crime reduction, they argued
the following:
uniformed patrol is fundamental to successful police work. • • • Robberies, burglaries, and felonious assaults are almost never knowingly committed in the full view and presence of a policeman, nor even in the immediate neighborhood of the spot where he happens for the moment to be. • .• In other words, the uniformed patrolman exercises a repressive infl~ence ••• (1931:87).
The conventional wisdom that the police can reduce
crime i~ honest and efficiently deployed, primarily through
the provision of conspicuous patrol, was rarely questioned.
5

Bruce smith (1940) was the only leading figure of the time
to point out that this was an untested assumption: 4
Police are agreed that the presence of uniformed patrols operates to discourage the commission of certain types of criminal acts, but even this elementary proposition, upon which all modern police work is founded, lacks as yet any form of scientific demonstration. So until we have a whole series of controlled experiments which show with some degree of conclusiveness the effect of uniformed patrols upon the crime rate, and the point where additional increments of patrol strength result in diminishing returns, police service ••• will continue to hinge upon expert opinion • • • (1940:153, emphasis added).
It was some 30 years before Smith's cautions were
appreciated. In the meantime leading autho,rites in
American police administration continued to espouse the
idea of a deterrent effect of police presence and began to
elaborate such a theory in a more comprehensive fashion.
The leading spokesman became o. W. Wilson, who based his
6
theory on the classic equation that the motivation or
desire to commit a criminal act comb.ned with the perceived
opportunity .to do so, will in fact produce a criminal act.
He saw the basic police function as the prevention of crime
by circumventing the opportunity side of the equation.
This was to be achieved by the patrol force, which he
viewed as the backbone of all police agencies. He described
the impact of police patrol on opportunity for crime in the
following way:
4 Even Smith had not raised these questions nine years earlier when he was serving as Director of the citizen's Police committee in Chicago.

The elimination of the actual opportunity, or the belief in opportunity, for successful misconduct is the basic purpose of patrol. A thief's de'sire to steal is not diminished by the presence of a patrolman, but the opportunity for successful theft is.
The apparent likelihood of arrest influences the degree to which the potential offender is convinced that the opportunity for successful misconduct is absent. Patrol provides this favorable influence more completely than any other branch of police service. An impression of omnipresence is created by frequent and conspicuous patrol at every hour and in all sections of the community. Suitable patrol succeeds in effecting immediate apprehensions; and since nothing succeeds
. like success, a reputation for quick and certain apprehension is spread by press, radio, and word of mouth. The potential offender is thus persuaded without the necessity of personal experience that the patrol is invulnerable (Wilson and McLaren, 1972:320) •
The Second War on Crime
In the 1960's crime emerged as a leading public
concern· for the first time since the 1930's. A review of
the Gallup Opinion Index reveals that crime had not even
appeared as a significant public issue since that time.
In 1965 it necame a major issue and continued as the
leading domestic issue through 1968. This is not to deny
the concern of many politicians and citizens prior to this
time nor to overlook major programs that were implemented
to deal with crime and delinquency. Rather, the point is
to draw attention to a major shift in public opinion and
the impact that this had. As a result of this widesp:c,e.ad
public concern most politicians incorporated a "law and
order" theme in their campaigns. The· issue was dominated
7

8
by the more conservative candidates subscribing to a
position that government can do little about crime except
to deter it (Finckenauer, 1978). Thus, again there was an
implicit assumption that our criminal justice system could
reduce crime if only its efficiency were maximized.
Important legislation was passed and numerous
commissions were established on the federal level to
address the crime problem. 5 Two important themes dominated
the reports of these commissions and the positions taken by
leading authorities in the field of criminal justice. One
of these themes was the need for a systemic approach to
criminal justice. A systems approach has been defined as
a rational framework for solving problems (Ni1ls'son, 1972)
and is therefore oriented towards efficiency. The second
major theme was the identification of the police as the
weakest link in the criminal justice system. As a result
of these two dominant views, massive efforts were under-
taken to improve police efficiency on the assumption that
more efficient policing leads to less crime. Thus, 80
percent of the funds allocated to the Law Enforcement
5The two most important pieces of legislation were the Law Enforcement Assistance Act of 1965 and the Omnibus Crime Control and Safe streets Act of 1968. Among the more noteworthy national commissions were the President's Commission on Law Enforcement and Administration of . ,Justice, the National Advisory Commission on Criminal Justice Standards and Goals, the National Commission on the Causes and Prevention of Violence, the Commission on Campus Unrest, and the National Advisory Commission on Civil Disorders.

• Assistance Administration 'by The Omnibus Crime Control and
Safe Streets Act of 1968 were earmarked for the police.
To a large extent, the conventional wisdom
concerning police and deterrence was uncritically accepted
by leading authorities during the early part of this most
recent reform movement. The President's Commission on Law
Enforcement and Administration of Justice reflected the
views of O. W. Wilson:
The heart of the police effort against crime is p'atrol--moving on foot or by vehicle around an assigned area, stopping to check buildings, to survey possible incidents, to question suspicious persons, or simply to converse with residents who may provide intelligence as to occurrences in the neighborhood.
The object of patrol is to disperse policemen in a way that will eliminate or reduce the opportunity for misconduct and to increase the likelihood that a criminal will be apprehended while he is committing a crime or immediately thereafter. The strong likelihood of apprehension will presumably have a strong deterrent effect on potential criminals (Task Force Report: The Police, 1967:1).
Questioning the Deterrence Premise
Nevertheless, this was the beginning of a new era
in which the deterrent effects of police presence (as well
as many other criminal justice issues) came to be viewed as
a research issue which could be stated in the form of
testable hypotheses. Thus the president's Commission also
stated:
It is probably true that an aggressive program of preventive patrol does reduce the amount of crime on the street, although there has been no
. .'
9

• careful effort to measure the effectiveness of this technigue (Task Force Report: The Police, 1967:43, emphasis added).
Although the idea of a deterrent effect of police presence
seems intuitively reasonable, some began to express
skepticism. To a large extent, the questioning of the
deterrence assumption originated as part of a more general
questioning of the impact of police on crime. Early
research on the role of the police indicated that they
spend.les~ than 20 percent of their time on tasks directly
related to crime (e.g., Cumming et al., 1965; Webster,
1973). This raised questions about how much impact the
police actually have on crime. For example, Peter Manning
(1971) argued that the public's expectation for the police
to prevent crime and apprehend offenders is an "impossible
mandate. "
Conclusion
In this section it has been shown that for many
years the pO'lice operated on an assumption that deterrence
10
does work. In recent years, however, the opposite position
has been taken by some, claiming that they have no
discernible impact on crime. This skepticism along with
the general increase in criminal justice research has
stimulated research on the deterrent effect of police
presence. Contemporary p~eventive patrol theorists have
begun to present their ideas as testable theories rather
than as a priori assumptions (see for example. Larson, 1972).

Chapter II will review the research that has been under-
taken to evaluate preventive patrol.
Deterrence Theory and criminologists
The concept of deterrence had been relied upon for
hundreds of years when it was first formally expressed as
a key component of the classical school of criminal law in
the latter part of the eighteenth and early nineteenth
centuries by writers such as Beccaria (1764) and Bentham
(1823). The classical school was actually a reform move-
ment reacting to the inconsistencies and a~bitrariness of
criminal procedures in Europe at that time. These
reformers attempted to delineate rational and consistent
penalties which could be included in a hedonistic
calculation of benefits and losses to be derived from a
criminal act. It was assumed that men had free will in
making this choice and that if the pain of punishment
exceeded th~ pleasure of the crime, while the certain'ty of
punishment was high, the crime would be deterred. Thus
the theory was based on some important assumptions
(rationality and free will) and had the dual goals of
insuring fairness and preventing crime through deterrence.
However, it was not tested in any scientific fashion.
The classical school of criminal law remained in
vogue with those who were concerned with crime until the
latter part of the nineteenth century and clearly had a
major impact on police reformerp puch as Peel. At this
11
, I .

time though, the positive 'school of criminology was
ushered in under the influence of Lombroso and his
students. The focus then was on the removal of the causes
of crime. The positivists made no attempt to fuse their
cause removing ideas for crime control with the punitive
crime control (deterrence) of the classicists. Instead,
they strove to totally displace it, coming to view
punitive crime control as an obstacle and enemy to be
overcome ,(Lejins, 1974). Criminological literature is
12
replete with examples of this view. Enrico Ferri, a leader
of the positivist school, reflected this view in a state-
ment in 1901:
And we have but to look about us in the realities of contemporaneous life in order to see that the criminal code is far fr.om being a remedy against crime, that it remedies nothing, because either premeditation or passion in the person of the criminal deprive the criminal law of all prohibitory power (1901:231) •
Such statements are not limited to the early positivists.
An unqualiffed statement to the same effect was made in
one of the leading criminology texts in the middle of the
century:
The claim for deterrence is belied by both history and logic. History shows that severe punishments have never reduced criminality to any marked degree (Barnes and Teeters, 1951:338).
Nor have such biased assessments of deterrence subsided . . . ~ entirely. A discussion of deterrence in a major
'l'
contemporary criminology text reads as though it were a
continuation of Barnes and Teeters' theme:

We can draw some striking parallels between the punitive sentiments of eighteenth-century England and those insistent demands heard in the United states today for more repressive responses to offenders as a way of turning back the tide of lawlessness •••• The sense of all these recommendations is that, if the responses to criminality are harsh enough, individuals will be deterred from such behavior. European experience suggests that the application of brutal punishments to large numbers of law-breakers did little to curtail this behavior. Thus, the chances are not great that these measures will prevent those who have long-standing grievances against society from expressing them in militant and sometimes criminal ways (Gibbons, 1977: 34) •
The long-standing opposition of deterrence and
cause-removing theories ha.s retarded our kn,owledge of
crime control. For most of this century criminologists
limited their research to attempting to identify the
causes of crime and ways of removing those causes, to the
complete neglect of deterrence research (Andenaes, 1966;
Lejins, 1974; Martinson, 1974; Tittle and Logan, 1973;
Waldo and Chiricos, 1970; Wilson, 1975). American
criminologi~ts for most of this century were simply
operating on an assumption that deterrence does not work
without any empirical evidence one way or the other. 6
However, in the last decade research on deterrence by
criminologists and others has proliferated, largely as a
result of the skepticism that has emerged concerning the
6The only empirical evidence available addres~ed the issue of capital punishment (e.g., Savitz, 1958; Schuessler, 1952). Howe,ver, this research was relatively unsophisticated and the findings could not appropriately be,generalized to the issue of the deterrent effect of police l:>resence.
13

14
treatment model (Lejins, 1975; Martinson, 1974). Chapter II
will review the research on general deterrence which has
accumulated.
Summary
This chapter has provided a historical overview of
the police and criminology as they relate to deterrence
theory. The dominant theme emerging from this literature
was the predisposition of the police to assume that
conspicuous patrol does deter crime, while criminologists
assumed that the threat of punishment does not deter crimes
The result was the complete neglect of deterrence as an
issue for policy evaluation or scientific inquiry.
Although the last decade has witnessed a flurry of
deterrence research, this is a very late start. Thus
deterrence theory in general is relatively crude and the
empirical evidence reflecting on it sparse, while the
specific issue of the deterrent effect of police presence
is even less refined.

-----------
CHAPTER II
DETERRENCE RESEARCH
The focus of the present research falls within the
topic of general deterrence which has been defined as "the
inhibiting effect of sanctions on the criminal activity of
people other than the sanctioned offender" (Blumstein
et al., 1'978:3). Interest is also limited to the certainty
of the application of sanctions. It is certainty of
punishment (whether real or perceived) that relates police
presence to deterrence. The police are not involved in the
official punishment of offenders but have been thought to
increase the certainty of that punishment through their
apprehension activities. It has also been argued that an
arrest by the police is perceived by the arrestee as
punishment, even if not followed by official processing
(Tittle and 'Rowe, 1974). Celerity may be related to both
the certainty of punishment and any deterrent effects that
it might have. However, it was not feasible to include
celerity in the present research since it could not be
measured. severity of punishment may also be related to
deterrence, but is not directly relevant to the present
study because, while police presence may be related to, the
certainty of punishment it does not appear to be directly
related to its severity. Thus the litera.ture review will
15
16
not be concerned with the issue of special (individual)
deterrence or \«.ri th the severity or celerity of sanction
application.
This chapter reviews three distinct bodies of
literature with implications for the analysis of the
deterrent effect of polic~, presence. They will be referred
to as criminological research, police evaluation research,
and econometric research. Researchers in the first two
areas have almost entirely ignored one another, resulting
in inadequate theory in police evaluation research and
inferior data in the case of criminological research;
There is some overlap and mutual recognition between
criminologists and economists involved in deterrence
research, but they generally have strong differences.
Criminologists tend to view the work of economists as
atheoretical or with a simplistic theoretical basis
(Gibbs, 1973), while economists view the research of
criminologis,ts as relatively primitive in terms of
statistical methods (Tullock, 1974).
Each of these three distinct bodies of literature
provide insight for building a theoretical model of the
deterrent effect of police presence. The objective of the
present research is to postulate such a model based on a
synthesis of this literature and to test the adequacy of " ,,'"
that model. The review of deterrence research presented
in this chapter provides the framework for the model to be
proposed.

- ----- --------- -----------~-----------
criminological Research
The research efforts of criminologists concerning
the deterrent effect of certainty of punishment have
employed three types of methodologies: aggregate data
analysis, survey research, and experimental research.
Aggregate Data Analysis
17
The earliest studie.s employed aggregate data to
construct' indexes of crime and of certainty of punishment.
A number of studies of this nature have accumulated and
have consistently revealed a negative relationship between
crime rates and the various indicators 0f certainty of
punishment (e.g., clearance and imprisonment rates). These
findings have generally been interpreted as support for
deterrence theory and are at least consistent with it.
However, the finding is also consistent with sOme
alternative interpretations. Most importantly, the
possibility 'of an incapacitative effect accounting for
part or all of the inverse relationship and the possibility
of reversed causal order must be considered. Some recent
publications have explored these alternative interpre
tations in detail (e.g., Blumstein et al., 1978; Geerken
and Gove, 1977; Nagin, 1978; Pontell, 1978).
Among the studies relying on aggregate data, those
which have utilized clearance rates as the indicator of
certainty of punishment are most relevant to the issue of
18
the deterrent effect of police presence (e.g., Brown, 1978;
Geerken and Gove, 1977t Logan, 1975; Tittle and Rowe,
1974).1 These studies reflect on the deterrent effect of
police activities insofar as manipulation of police
variables (e.g., number of patrol units) can be shown to
affect clearance rates. Tittle and Rowe (1974) found a
negative correlation between clearance rates and total
index crime rates in all Florida counties (-.65) and in all
Florida cities of populations 2500 or greater (-.19).
Brown's (1978) analysis of California counties revealed a
correlation of -.39 between clearance rates' and index
crime rates. Logan (1975) took an important theoretical
step by undertaking a crime-specific analysis. Using
states as the unit of analysis he found significant
negative correlations between clearance rates and rates of
rape (-.37), robbery (-.48), burglary (-.32), larceny
(-.45), and auto theft (-.64). The relationship for
assault was nonsignificant but negative in sign (-.09)
while the relationship for homicide was nonsignificant and
positive (.25), therefore being consistent with the
deterrence hypothesis. Geerken and Gove (1977) found
lThe official clearance rate is the percentage of crimes known to and recorded by the police which have been solved to their satisfaction. See Skolnick (1975) for.a discussion of the validity of this statistic. Some of these studies improve upon the validity of this measure by calculating the percentage of officially recorded crimes which result in arrests rather than using the official clearance rate~

19
similar correlations using standard Metropolitan Statistical
Areas as the unit of analysis.
Another finding from Tittle and Rowe's (1974)
research may have important implications for the deterrent
effect of police presence. Their analysis suggested that a
critical tipping level must be reached before any deterrent
effect of certainty of punishment becomes evident. They
identified a. clearance rate of 30 percent as that critical
level. However, clearance rates above this level are
extremely rare in metropolitan jurisdictions. Thus, their
findings suggest that the negative relationship between
crime and clearance rates is primarily in smaller towns.
Bailey (1976) subjected the tipping hypothesis to a crime-
specific analysis and found both the deterrent and tipping
effects to vary by crime type.
Survey Research
Criminological deterrence research which has ,
analyzed aggregate data has measured only the objective
certainty of punishment. However, survey research has been
undertaken as a means of measuring perceived rather than
objective certainty of punishment. The earliest studies
were conducted by Jensen (1969) and by Waldo and Chiricos
(1972), but have been followed by numerous others.
Anderson (1978) reviewed 21 studies which collected
perceptual data of this nature to address in part the
question of the deterrent effect of certainty of

punishment. Her review revealed highly consistent support
for the deterrence hypothesis that perceived certainty of
punishment is negatively related to rates of offenses.
However, the studies are inconsistent with regard to the
strength of ,those relationships and even the same studies
have found widely varyi.ng associations by offense type.
For example, Jensen's (1969) study found a weak negative
relationship between perceived probability of punishment
and self-'reported delinquency (g?ffiIT\a= -.22) while the
survey data that Waldo and Chiricos (1972) collected
revealed a very strong negative association (gamma= -.84)
between self-reported marijuana use and perceived
20
probability of arrest. However, they found only.a moderate
association (gamma= .31) for the offense of petty theft.
Experimental Researc~
Finally, experimental designs have been infre-
quently use~ by criminologists to draw inferences
concerning the relationship between certainty of punishment
and crime. A classroom experiment reported by Tittle and
Rowe (1973) exemplifies this approach. Their study
contrasted the relative effects of moral appeal and threat
of punishment on classroom cheating among college students.
By allowing the students to grade their own quizzes after . , .' surreptitious grading by the instructors, an index of
cheatJLng was established. It was then found that
implementing a strategy of moral appeal as an experimental

"
21
condition resulted in increased cheating t while later use
of a threat of punishment strategy was associated with a
decline in cheating. While such experiments have several
implication.s for deterrence theory, a questionable
'inferential leal? is required to apply them to different
populations and to legal norms.
Conclusion
Considering the evidence emerging from the three
types of criminological deterrence research reviewed in
this section, the general conclusion of many criminologists
has been that punishment does appear to deter crime under
some circumstances and that the task of future research is
the specification of those circumstances (Anderson, 1978;
Geerken and Gove, 1975; Minor, 1978; Tittle and Logan,
1973; zimring and Hawkins, 1973). Before more decisive
conclusions can be drawn it will be necessary to contend
with several, problems that have plagued deterrence research.
In developing the theoretical model of the deterrent effect
of police presence which is the fOCllS of this research, it
will be necessary to return to this point in order to avoid
some of the deficiencies of criminological research.
Police Evaluation Research
. ," Major policy changes in manpower allocation have
been implemented within police agencies on several
occasions and evaluated by experimental or quasi-experimental
designs. Although relatively few studies of this nature
have been conducted and they have been hindered by serious
methodological deficiencies, some clear implications for
postulating a theoretical model of the deterrent effect of
police presence emerge.
Early Experiments
Five experiments are discussed under the lapel of
early exp.eriments. They are labeled as such because they
preceded the Kansas City Preventive Patrol Experiment
(KCPPE), a study which has had a major imp~ct and served
as a turning point for the issue of the deterrent effect
of police presence.
Operation 25. An experiment referred to as
Operation 25 was undertaken for a four month period in
22
1954 in the 25th Precinct of New York City (New York city
Police Department, 1955). The 25th Precinct comprises an
area just under one square mile located at the northeastern
tip of Manhattan Island. The area has traditionally been
characterized by overcrowding, poverty, a predominantly
minority population, and high crime rates. The feeling of
the police department was that the area was grossly under
manned; it was divided into 55 foot posts (beats) with an
average length of about ten straight blocks. However,',.,
manpower levels were insufficient to allow coverage of all
posts at any given time. When the experiment was

'.
23
implemented the number of posts was increased to 89,
reducing their average length to approximately five blocks.
At the. same time manpower was more than doubled within the
area, allowing all posts to be covered for all shifts. The
experiment was:
• • .based upon the premise that if a patrol post is limited in length and under the constant observation of the assigned patrolman, the patrolman should properly have knowledge of everything that occurs on his post. He thus could be h~ld responsible for failing to prevent certain types of crime or failing to arrest perpetrators (New York City Police Department, 1955:209).
The New York city Police Department concluded that
Operation 25 was an "unqualified success" and that the
"results were dramatic." These results included a 55.6
percent decrease in reported felonies compared to a 4.7
percent. decrease for the city as a whole during that
period. There Was also an increase in the felony clearance
rate from 20.2 percent to 65.6 percent. At the same time
several cri~e types which are of such a nature that they
become known only if the police intervene (e.g., possession
of narcotics) showed dramatic increases. Thus the experi-
ment seemed to provide evidence that increases in police
presence leads to increases in both deterrence and in
apprehension rates. However, there were clearly some
deficiencies in the evaluation of this experiment, including
the failure to measure crime independent of the official
rate reported by the police and the failure to test for
displacement effects by measuring crime in contiguous

--- ~----------
areas. Moreover, police officials were clearly not
occupying a role of disinterested scientific observers.
One of their stated goals in conducting the experiment was
lito demonstrate to the public what adequate police service
and protection could mean in terms of reduced crime and
swifter and more effective apprehension of criminals"
(New York City Police Department, 1955:207).
24
Beat patrol experiment. An experiment conducted in
England referred to as the "Beat Patrol Experiment"
produced somewhat different results (Wilso~, 1975). The
number of officers assigned to foot patrol beats was varied
from zero to four over successive four-week periods in four
English cities. The number of reported crimes was signifi-
cantly ~ower when one officer was assigned to each beat
than it was when zero officers were assigned. HoWever, no
additional decrease occurred when a second officer was
added and there was only slight evidence that adding a
third or fourth officer would achieve further decreases.
Thus the experiment supports a conclusion that police
presence has an absolute deterrent effect, but questions
the marginal deterrent effect that might be achieved
through increases in police presence. Again though, there
are issues of validity that must be raised. Most important ' ....
are the questions raised by Wilson; were the experimental
areas large enough and were the experimental treatments

long enough to affect the perceived certainty of
apprehension in those areas?
, 20th precinct experiment. Another study involved
aDalysis of crime statistics collected over a five-year
period (1963-1967) in the 20th Precinct of NeW Yorl~ City
f0llowing a 40 pe;;~cent increase in the level of police
presence (press, 1971). The increase was primarily in
foot patr~ls since the area is a densely populated section
on Manhattan's West Side, described by Press as populated
by lithe very rich and the very poor" and by "many ethnic
minorities. II The analysis revealed a significant net
reduction in crimes visible from the street after adjust-
ments were made for displacement to contiguous areas and
25
for non, police-related changes in crime within control
areas. For example, outdoor robberies declined 33 percent;
outdoor grand larcency dropped 49 percent; auto theft also
was reduced by 49 percent. Although this study was far . more sophisticated than earlier efforts to evaluate the
deterrent ef~ect of police presence, it still had major
deficiencies. It suffered from being quasi-experimental in
the sense that the manpower increase was not designed or
implemented with evaluation as a primary objective. Thus
the analysts were not able to monitor the experiment and . .
some relevant factors were undoubtedly changed during its
course. For example, reporting procedures were altered
with an unknown effect. Likewise, some major variables

26
were not measurE~d adequately. Crime, for example, was only
measured as the officially reported rate.
Subway experiment. Another quasi-experimental
evaluation of an increase in police presence was conducted
by Chaiken et ale (1974). In 1965 a decision was made in
New York City to increase police presence on the subways
and in the subway stations by a factor of approximately
2.6. The results of this manpower increase were analyzed
for the period 1965-1973. It revealed that there was a
short-term reduction in the overall crime rate for the
subway system, but that within a year it had surpassed the
pre-expe~imenta1 rate. However, as Wilson (1975) explains
it, focusing on the overall crime rate hides a remarkable
success story. Virtually all of the increased police
coverage was between the time of 8 P.M. and 4 A.M. and
analyzing the crime rate for just this period shows that
the reduction was a permanent one.- Thus the subway study I
suggests that increased police presence does have a
deterrent effect, but that any such effect extending beyond
the actual time period for which the increase is implemented
will be ephemeral.
Generalizing from the early foot patrol experiments.
The evidence emerging from these early experiments clearly
seems to support the existence of some deterrent effect of
police presence, although a number of caveats are in order.

Most importantly they all involved similar circumstances:
saturation of densely populated high-crime areas with foot
27
patrols. The explicit rationale behind Operation 25 was to
reduce the area of beats enough to keep them under
observation in their entirety and to increase manpower
sufficiently to cover them at all times. The circumstances
in the subway study were even more extreme, involving
enclosed and semi-enclosed areas with police presenc~
increased to a level that resulted in police visibility at
virtually all exits. Such environments are clearly
atypical and thus these findings cannot be 'generalized to
police operations in general.
Washington D.C. experiment. An experiment
involving the more typical situation of car-patrolled
beats was undertaken in Washing'ton, D.C. in 1970 (Budnick,
1973). Levels of patrol were increased for three one-month
periods in three high-crime areas by augmenting the usual . patrol force with officers from the Special Operations
Division (SOD). Officers from the SOD did not receive
calls for service and therefore spent their time primarily
on preventive patrol. Police presence was measured as the
percent increase in unit and man-tours per day aha as the
percent increas:e in unit and man-tours per day assigned
strictly to preventive patrol activities. However, the
increase was limited to the day and evening shifts; none
of the SOD officers were on duty during the 12 midnight to

8 A.M. tour. Table 1 shows the measured increases in
police presence for the three experimental periods.
TABLE 1
PERCENT INCREASES IN POLICE PRESENCE BY EXPERIMENTAL PERIOD (Budnick, 1973)
Police Presence August September
Unit-Tours 72 130
Man-Tours 92 137
Preventive Patrol Unit-Tours 139 350
Preventive Patrol Man-Tours 232 400
November
63
71
145
210
Budnick's evaluation of the Washington experiment
provides modest support for a conclusion that some deter-.
rent effect was achieved. However, he found considerable
variation between the three months. The explanation for
this variation in deterrent effects may be simply the fact
that there was also variation in the level of manpower
increases. The greatest deterrent effect appeared in the
September experiment which involved a substantially larger
increase in manpower. However, the changes implemented-in
August and November involved approximately the same levels
of manpower increases, but only the November experiment
28

29
revealed significant deterrent effects. Observing this,
the inference was drawn "that other factors, aside from the
experimental condition, have influenced the response of
crime within each area" (Budnick, 1973:146). Specifically,
it was suggested that any deterrent effect of the increased
police patrol may have been circumvented in the August test
zone by environmental features that enable offenders to
more easily evade contact with the police. That area was
described as being less open and containing many more
narrow streets, alleys, and other features that restrict
visibility.
Within the two locations experiencing deterrent
effects, variations were also found by crime type. Both
the September and November experiments were accompanied by
lower rates of robbery, burglary, and auto theft. However,
in the September experiment a significant increase in the
reporting of aggravated assault was experienced. In
offering an 'explanation for this, it was pointed out that
assault frequently involves previously acquainted victims
and assailants leading to a lower report rate than the
other offenses. Thus, the factor of police officer avai1-,
ability for reporting crimes might lead to a proportion
ately greate.r increase in reporting of this offense. As a
resu1'c, any deterrent effect that police presence might.,
have on the crime of assault could have been masked by an
increase in the rate of reporting crime.

-~- - _. -------------------
The Kansas City Preventive Patrol E~periment
The Kansas City Preventive Patrol Experiment
(Kelling et al., 1974) is the most comprehensive effort
undertaken to date attempting to evaluate the deterrent
30
effect of police presence. It was a l2-month e~periment in
which levels of automobile patrol in an urban-suburban
environment were varied in three areas, each consisting of
five bea~s. The three areas were matched on population
characteristics thought to be relevant to crime. Each of
the three was then assigned a different treatment (level of
patrol) which were referred to as reactive, proactive, and
control. In the reactive beats no preventive patrol was
supposed to be undertaken; patrol cars were only to respond
to calls for service. Patrol was to be increased between
two to three times the normal level in proactive beats,
while the control beats were to maintain the usual level
of patrol.
A wide range of variables were measured to determine
the impact of the variations in patrol. Most important for
the issue of the deterrent effect of police presence is
that crime was measured not only by official reported rates,
but also through victimization surveys. 'l'he findings of
the e~periment were no significant differences among the
three experimental areas in crime or any of the other
measured variables. Thus the KCPPE has raised serious
doubts about the efficacy of the police in deterring crime

31
through their presence. However, the validity of the
experiment and some of the conclusions that have been
drawn from it have been tenaciously rebutted. Criticisms
of the experiment can be subsumed under three categories:
theoretical deficiencies, failure to achieve experimental
conditions, and failure to control and/or monitor
extraneous variables.
Theoretical deficiencies. One area of concern with ,
the KCPPE is the adequacy of its theoretical conceptuali-
zations. The most important issue here is the failure to
give sufficient attention to the distinction between
objective police presence and perceived police presence.
Although an effort was made to measure perception of police
presence, the hypotheses and analyses showed little
sensitivity to the pivotal position of perception in the
larger theoretical framework. Essential to deterrence
theory is the proposition that 'the perception of potential
offenders must be affected in order for deterrence to
operate (Andenaes, 1966; Gibbs, 1975; Henshel, 1978; Minor,
1978; Tittle and Logan, 1973; Zimring and Hawkins, 1973).
Thus unless changes in patrol levels result in a measurable
change in the perception of the population, no measurable
change in crime rates should be expected. In fact, no
significant difference was found in perception of polic~
presence among the three experimental areas in the KCPPE.
However, the importance of this key issue was not recognized
or discussed in the analysis or conclusions of the study

32
Failure to achieve experimental conditions. Critics
have argued that the treatment or experimental conditions
were not achieved in the experiment. It has been suggested
that, for a number of reasons, there was not a substantial
reduction of police presence in the reactive beats. Davis
and Knowles (1975) pointed to the significantly larger mean
number of officers who responded to incidents in the
reactive beats (1.58) as opposed to control (1.29) and
proactive beats (1.15). While Kelling and Pate (1975)
responded that this difference does not connote a violation
of experimental guidelines, it clearly does indicate a
significant increase in police visibility due to the
additional miles driven by cars responding to calls for
service in the reactive beats. By taking into consideration
the increased number of units responding to calls, the
additional mileage accumulated in returning to the
perimeter of the beat, and adjustments for peak activity
periods (summer evening tours when visibility should be
higher) Larson (1975; 1976) has derived estimates which
suggest that police visibility was not reduced nearly as
much as intended in the reactive beats. In addition, he
pointed to the 400 to 500 percent increase in the use of
lights and/or sirens which almost certainly had some
influence on citizen perception of police presence. Ad~ing
further to these suspicions is the fact that there was
actually an increase in patrol-initiated contacts in the
reactive beats during the experimental period.

33
There are three major faults that reflect on the
success of the experiment in creating the treatment effect
in the proactive beats. One of the major points raised by
those who have reviewed the KCPPE is that any deterrent
effect of preventive patrol might be contingent upon what
it is that the police are doing (Davis and Knowles, 1975;
Fineberg et al., 1976; Goldstein, 1977; Wilson, 1975). An
implicit assumption of the experimenters was that routine
preventive patrol would increase concomitantly with the
increase in noncommitted time in the proactive beats.
However, this was an untested assumption since no baseline
data on the use of noncommitted time were collected. Thus
the extent to which the additional noncommitted time in the
proactive beats was translated into routine preventive
patrol rather than nonpolice-related activities is unknown.
A second problem was the equal manning of beats over a
24-hour period which resulted in the largest amount of
noncommitted time being available for patrol when most
peopl.e are asleep and therefore least likely to perceive
increases in patrol levels (Larson, 1976; Fineberg et al.,
1976). The final point is that, according to Larson's
(1975; 1976) estimates, the number of patrol passings
experienced in the proactive beats were less than is
typical of many large American cities. Thus, there is,.,
some question as to whether the level of saturation in the
proactive beats was great enough to generalize the
findings.

34
Failure to control and/or monitor extraneous
variables. A number of relevant variables were not
controlled and in some cases not even monitored in the
KCPPE. Some of them were related to the central issue of
police visibility. For example, Davis and Knowles (1975)
raised the issue of visibility being affected by a
supplementary park police in two of the beats and similarly,
the fact that specialized units were deployed as usual
throughout the experiment. Neither factor was controlled
for and only the latter was monitored. Likewise, no
quantita.tive es~imates of police presence i'n the reactive
beats resulting from the violation of experimental guide-
lines are available. Other issues concerning inadequate
controls include debate over the adequacy of demographic
data for the 15 experimental beats and the characteristics
of personnel manning those beats (Davis and Knowles, 1975).
Generalizing the findings. Great caution is in
order in attempting to draw generalizations from the KCPPE.
The level of analysis in the experiment should be kept in
mind. It involved variations; in the level of police
presence in 15 beats that aw~raged approximately 2.5 square
miles, while the level of police presence for the experi-
mental area as a whole was increased. In view of this, ' ... 'OJ,
Larson (1975; 1976) argues that the study provides support
for spatial redistribution of patrol forces rather than
manipulation of clverall paotrol levels. In addition, any
35
generalization must include several qualifications taking
the circumstances of the experiment into account. Thus an
appropriate conclusion might suggest that those levels of
variation in random patrol, which were actually achieved in
the experiment, probably have no significantly different
impact on levels of crime in an 'environment such as that of
the South Patrol District of Kansas City.
There has been some tendency to overstep the bounds
of scientific principles in generalizing from the KCPPE.
It has often been cited as the definitive work when its
appropriate role should be that of a foundation and
catalyst for further research (Zimring, 1978). Replications
of the experiment are needed to contend with the'usual
problems of risking a type II error and of correcting
deficiencies in design and experimental procedures such as
those discussed above. However, it may be more important
to develop a general theory of the deterrent effect of ,
police presence that can assimulate the findings of the
KCPPE with a wide range of other studies (Blumstein et al.,
1978). Such is the objective of the present research.
Post-Kansas City Experiments
Despite the need for additional experimentation to
replicate and build upon the KCPPE, few studies have b,een , .'
undertaken since it was reported. However, three short-
term experiments carried out by the Nashville Metropolitan
Police Department have been evaluated by Schnelle and his'

colleagues with somewhat mixed findings. The first
experiment (Schnelle et al., 1975) involved a five-week
saturation of three residential areas with specialized
burglary patrols. The program involved deployment of
plainclothes officers in unmarked cars during the day
shift (8 A.M. to 4 P.M.), thus differing from the KCPPE in
several ways. One result of the program was an increase
in burglary arrests. There was also a reduction in home
burglaries in all three areas as compared to rates just
before and just after the intervention, but the analysts
argued that this was a regression artifact.' Specifically,
their conclusion was that lithe police intervened near a
time period when burglaries were near a peak in all
treated zones, and thus a statistical shift downward can
bepredicted" (1975:360).
36
The second experiment reported by Schnelle et al.
(1975) concerned the implementation of foot patrols in two
government nousing projects. Time-series analysis revealed
a significant increase in the reporting of crimes such as
theft, assault, public drunkenness, and disorderly conduct.
However, the reporting of serious crimes (e.g., murder,
rape, and burglarly) was not affected nor was there a
significant change in arrest frequencies for any categories
of crime. The experiment then, had the clear implication
that. citizens are likely to report relatively minor
offenses directly to a police officer 'already present in
37
the area even if they would not telephone the report to the
police agency. This could be due simply to a convenience
factor, but may also be related to a citizen belief that
if the police are not in close proximity, they will not
arrive in time to intervene and will not be concerned with
the apprehension of minor offenders. We know very little
about crime reporting, but this experiment indicates that
it may be related to police presence under some'circum-
stances •.
The most recent experiment (Schnelle et al., 1977)
incorporated several innovative features. 'Four high-crime
patrol zones were each assigned four tactical squad cars in
addition to their regular patrol car. The treatments were
limited to one shift and remained intact for 10 days in
each zone. The additional units were instructed to spend·
their time patrolling at slow speeds and not to respond to
routine radio calls. Quantitative measures of patrol
movement in 'the experimental zones were obtained from
tachnographs installed in the patrol cars.2 An average
increase of 398 percent in. total moving time was recorded
and a 3040 percent increase in moving time under 20 mph.
In addition, supervisors made random checks to determine if
patrol units were leaving their assigned zones.
.; ....
2The tachnograph is an instrument which can be attached to the transmission of a vehicle in order to record time data on engine operation, vehicle speed, distance travelled, and use of emergency equipment.

The analysis revealed no significant change in
arrest rates in the experimental zones. It did show a
significant decline in the rate of index crimes in the two
zones receiving increased patrol at night, but not in the
two zones which were saturated during day shifts. An
explanation proposed for the differential deterrent effect
of police patrol during day and night hours focused on the
offense of burglary. It was pointed out that most house-
hold burglaries occur during the day, while most business
burglaries take place at night. It was suggested that
crime could have been reduced at night due to a greater
deterrability of business burglaries attributable to the
greater density of businesses, fewer physical obstructions
38
in the environment, and the reduced number of people abroad
at night. The data were consistent with this interpretation
since there was a decline in business burglaries but no
change in the rate of home burglaries.
The 'final conclusions offered by the authors may be .-i,
a reflection of the ideological burden that has so often
interfered with research efforts on the topic of preventive
patrol. It seems that they shifted to a different level
in drawing generalizations from the study. In previous
research which revealed evidence basically consistent with
the KCPPE (i.e., inconsistent with a deterrence hypoth~~is),
very general conclusions were drawn such as "that various
commonly used patrol strategies have little if any effect
on crime" (Schnelle et al., 1975:360). However, in this

study the results were basically consistent with a
deterrence hypothesis (suggesting differential deterrent
39
effects) but were brushed aside by arguing that prohibitive
costs would prevent the experiment from having any
"practical importance." Thus a conclusion was drawn which
completely contradicted their empirical findings: II In
summary, the present results indicate that police depart
ments should try alternatives to saturation patrolling in
attempts to reduce crime levels" (Schnelle et al., 1977:39).
Sounder conclusions could have been arrived at by
attempting a theoretical integration of the findings with
those of previous research. This is not to deny the
importance'of the issue of cost-effectiveness. The authors
should have noted the unlikelihood of public support for
sustained expenditures of that level throughout the city.
Rather, the objection is the shift from a general
theoretical to a specific policy level.
Conclusion
The evidence found in reviewing evaluations of
variations in levels of police presence supports a
conclusion similar to that derived from the review of
criminological deterrence research. It suggests that the i
police do have an impact on crime rates under certain ';;:"
t ~ ••
circumstances, a conclusion also drawn by others who have
surveyed the results of experimental and quasi-experimen~al
studies (Blumstein et .al., 1978; Chaiken, 1978; O'Connor .

and Gilman, 1978; Zimring, 1978). This conclusion was
stated most succinctly by Chaiken:
Research has answered several questions about the deterrent effects of police activity, yet more remains to be done. It now seems very likely that arrest probability has a deterrent effect for at least some types of crimes. We need a much firmer indication of the particular crimes for which the effect operates. Moreover, the magnitude of the effect has not yet been adequately explored (1978:130) •
Moreover, there are several implications for the develop
ment of a theoretical modei of the deterrent effect of
police presence and the specification of the empirical
contingencies for such a theory. The theoretical model
proposed in this research and the interpretation of the
data incorporate the findings of this evaluation -research.
Econometric Research
The statistical techniques subsumed under the
category of econometric research were originated by
econometrici'ans and have been pn~dominantly used by them.
However, the research discussed within this section is
similar to the criminological deterrence research which
has utilized aggregate data. In reality the techniques
used in the analysis of aggregate data fallon a continuum
and some criminologists have recently used approaches
categorized as econometric in the present review (e.g~'."
Decker, 1978, Rowe and 'Tittle, 1974). The distinction is
made primarily to provide a means of focusing on some key
40

issues addressed in earlier research which have
implications for the present studyc These issues are
(1) the focus on police resources and (2) the issue of
simul tanei ty.
The Focus on Police Resources
Econometric deterrence research has frequently
analyzed the relationship between police resources and
deterrence. The probable reason for such a focus is its
inherent policy implications, which is consistent with the
approach of that discipline. CriminologistI'": on the other
hand, have limited themselves to a higher theoretical
plane by addressing the relationship between probability
(or perceived probability) of punishment and crime rates.
They have provided insight into the relationship between
clearance rates and rates of crime, but such findings can
only take on policy implications if the relationship
between other police variables and their rate of clearing
crimes is understood. Reviewing the findings of econo
metric research which examines the relationship between
police variables and clearanc~ rates, as well as that
between clearance and crime rates, provides some frame
work for postulating a complete theoretical model of the
deterrent effect of police presence. ., .. ""
Numerous variables which can be viewed as
indicators of police presence have been examined. They
have included per capita police expenditures, total
41

personnel, sworn personnel, full time equivalents, and in
one case which involved a small purposive sample (35) the
number of patrol units on the street was obtained.
Similarly, there has been wide variation in the units of
analysis employed in these studies. As a result of these
differences and the problems associated with reciprocal
relationships between variables, the findings have
conflicted.
42
Using the SMSA as 'the unit of analysis, Pogue
(1975) conducted a crime specific analysis and consistently
found a negative relationship between clearance rates and
the reported rates of each of the index offenses. However,
he found no relationship between police presence~ which he
measured as per capita expenditures and as full time
equi val'ent personnel, and clearance rates. Wil son and
Boland (1978) also found a negative relation between
clearance and robbery rates. In addition they found a
positive relationship between police presence, measured
as the total number of patrol units on the street, and
robbery clearance rates. However, their study was based
on an N of only 35 large cities. Chapman's (1976) study
analyzed 147 California cities between 20,000 and 100,000
population and found a negative relationship between
clearance rates and property crimes as well as a posi~iye
relationship between police presence (measured as per
capita'sworn personnel) and clearance 'rates. In addition,

anc)ther equation separated the positive influence of crime
on the level of police presence from the deterrent effect
of pol~ce presence on crime.
The Issue of Simultaneity
The second key issue in the econometric deterrence
research is that of simultaneity. Econometric research
almost invariably employs causal analysis and frequently
recognizep two-way causation, while criminologists
analyzing cross-sectional data have usually avoided that
approach, relying instead on simple and pa~tial
cirrelations. This methodological difference has
important theoretical implications since the causal
modeling approach is useful for developing theory while
simple prediction equations are not (Blalock, 1969). At
the same time however, the technique requires sUfficient
understanding of the substantive issues to support causal
43
assumptions ~n building the theoretical model to be tested;
if those assumptions are faulty the findings may be
erroneous. The assumptions necessary to solve simultaneous
equations have been particularly problematic for deterrence
research.
Most recent econometric deterrence research has
recognized the simultaneous relationship between crime and I .;, ..
police presence. That is, each variable is thought to have
a causal influence on the other. While police presence
shoul,d have a deterrent impact on crime and therefore be

•
•
negaLtively related, the level of crime is expected to have
a positive influence on police presence since rising crime
rates generate political demand for increased police
presence. Figure 1 illustrates the two equations
underlying the assumed relationship between crime (C) and
police presence (P). A regression of C on P or of P on C
'~ill not separate the two effects because there is simply
not enough information available to obtain unique
solutions". Thus it becomes necessary to write two
independent equations which incorporate additional
variables~ Specifically, in order for thes"e equations to
be identifiable it is necessary to omit one or more
exogenous and/or predetermined variables from one of the
equations. These identification restrictions cannot be
justified (empirically; they are causal assumptions which,
if faulty may result in erroneous estimates.
Figure 1
Simultaneous Relationship of Crime and Police Presence
Crime Rate
Police Presence
P= a + .be
C= a + bP "" ... '"
44
Several analysts have attempted to separat,$ the
presumed deterrent effect of police presence from the
effect of crime on police presence (e.g., McPheters and
Stronge, 1974; Swimmer, 1974a, 1974b; Wilson and Boland,
1978). However, the findin,gs of some of these st'udies
are in question because of the manner in 'Which they solved
their equations. For eXaJ,uple, the rationale for imposing
the identification restriction relied upon in Swimmer's
(1974a, 1974b) research is not clear. He omitted city
area from his crime equation, but retained it in the
equation for police expenditures. On the other hand, the
identification restrictions used by McPheters and Stronge
(1974) have been generally praised (Blumstein et ,al.,
1978). They omitted six demographic factors that were
included in their crime equation (central city decay,
central city affluence, minority presence, education,
housing quali'ty, and youth presence) from thei:c equation
for police expenditures. Wilson and Boland (1978) used
similar identification restrictions.
Other studies have failed to detect a simultaneous
re,lationship between crime and the police and have
aJttributed this to various fac'tors (e. g., Greenwood and
V~adycki, 1973; Morris and Tweeten, 1971). One argument
has been that an increase in the number of police offic¢rs
leads to an increase in the number of crimes reported to
or detected by the police. Thus, increases in police
presence could be positively related to official crime
45

-- --------- ----- -------
46
rates. Decker's (1978) findings provide support for
such an argument since he found property crime to have a
stronger negative relationship with police per capita
sworn personnel and expenditures where victimization survey
crime rates are used rather than official measures. Morris
and Tweeten (1971) offered a second explanation, suggesting
that there has historically been such a strong positive
correlation betwe'en police and crime that the simultaneous
influence'cannot be readily separated. Third, and probably
most important, the identification restrictions employed in
many studies which have failed to differentiate between the
two causal rel:ationships have been inadequate. For example,
Greenwood and Wadycki (1973) omitted median income from the
crime equation to achieve identification but it is very
doubtful that median income can be assumed to affect police
presence and not to affect crime.
Conclusion
Re'iTiew of the econometric deterrence literature
has drawn attention to some central theoretical and
methodological issues which must be addressed in the
present J:esearch. In constructing a theory of the
deterrent effect of police presence it is essential that
the linkage between police presence and the certainty of , , ."
apprehension (objective or perceived) be establi'shed. This
relationship has been explored almost exclusively by
econometricians.

47
It seems unlikely that the relationship between
the police and crime or the relationship between
appreh~nsion and crime are nonsimultaneous. These
simultaneous relationships introduce complex methodological
problems. Also, the analyses of economists have frequently
conflicted due to some indefensible assumptions concerning
underlying relationships in their models. Nevertheless,
their basic analytic techniques were extremely useful for
conceptualizing the theoretical model and testing it ",ith
cross-sectional data.
Summary
This chapter has presented a review of three
distinct bodies of deterrence literature, whi~h provide
the foundation for the theoretical model of the deterrent
effect of police presence proposed in Chapter III.
Previous criminological research and police evaluation
research have addressed different components of t.he model
and utilized different methods. However, the two are
similar in that they both support a conclusion that
deterrence does operate under some circumstances and that
there is a need for further research to specify those
circumstances. The third category of previous research
reviewed was econometric research, which provides t,he'" ;
methodological orientation for the present study.

48
The pleesent research builds on this previous work
by synthesizing theoretical and empirical advances in a
model of the deterrent effect of police presence. The
major depart.ure from earlier research is the incorporation
of theoretical relationships neglected previously (e.g.,
between police presence and clearance rates) and the use of
some indicators of greater validity (e.g.,-per capita
patrol units for police presence).
Several commendable features were adopted from a
group of key references in the tradition of ecological
deterrence research (Geerken and Gove, 1977; Tittle and
Rowe, 1974; Wilson and Boland, 1978). At the same time,
an effort was made to avoid their deficiencies. ·All of
these major studies were weak in terms of the generali
zation they could support due to the nature of their
samples. The sample used by Tittle and Rowe was confined
to one state, while that employed by Wilson and Boland was
a small purposive sample of 35, and Geerken and Govels
used Standard Metropolitan Statistical Areas as the unit of
analysis. Secondly, the important issue of the differ
ential effect of deterrence by crime type was not included
in Tittle and Rowels study or reported in Wilson and
Bo1and l s. Tittle and Rowels analysis had the additional
shortcoming of relying on police calculations for clearance
rat.es rather than doing their own. The most important
deficiency that this study attempts to address however, is
,

the limited theoretical focus of the earlier research.
Both Tittle and Rowe and Geerken and Gove focused only on
the re,lationship between crime and certainty of
apprehension as measured by official crime and clearance
rates. The model proposed by Wilson and Boland was a
major theoretical improvement but still failed to consider
the relationship between police presence and the objective
certainty of apprehension or to empirically address the
perceived certainty of app'rehension.
49

CHAPTER III
A THEORETICAL MODEL OF THE DETERRENT EFFECT OF POLICE PRESENCE
Although much research has focused on the issue of
deterrence in the last decade, relatively few studies have
attempted to integrate the resulting theoretica~ and
empirical advances in order to generate and test a general
theory (Gibbs, 1975; Silberman, 1976). ThE1 objective of
the present effort is to postulate a theory of dete~rence
related specifically to police presence and to test that
theory utilizing cross-sectional data. This chapter
proposes a theoretical model of the deterrent effect of
police presence based largely on a synthesis of the three
bodies of literature reviewed in Chapter II.
The model is presented in its general form in
Figure 2. It is comprised of five endogenous and 11
exogenous variables which are elaborated in this chapter. l
Cities are the unit of analysis and the model is tested
using a two-tier population sample. The larger sample
(N = 382) is referred to as Sample A and includes
indicators for all variables except citizen perception of
lEndogenous variables can be defined as those whose interrelationships the model seeks to explain. Exogenous variables are taken as given in the model without focusing on their origin and are necessary to solve the structural equ?-tions.
50
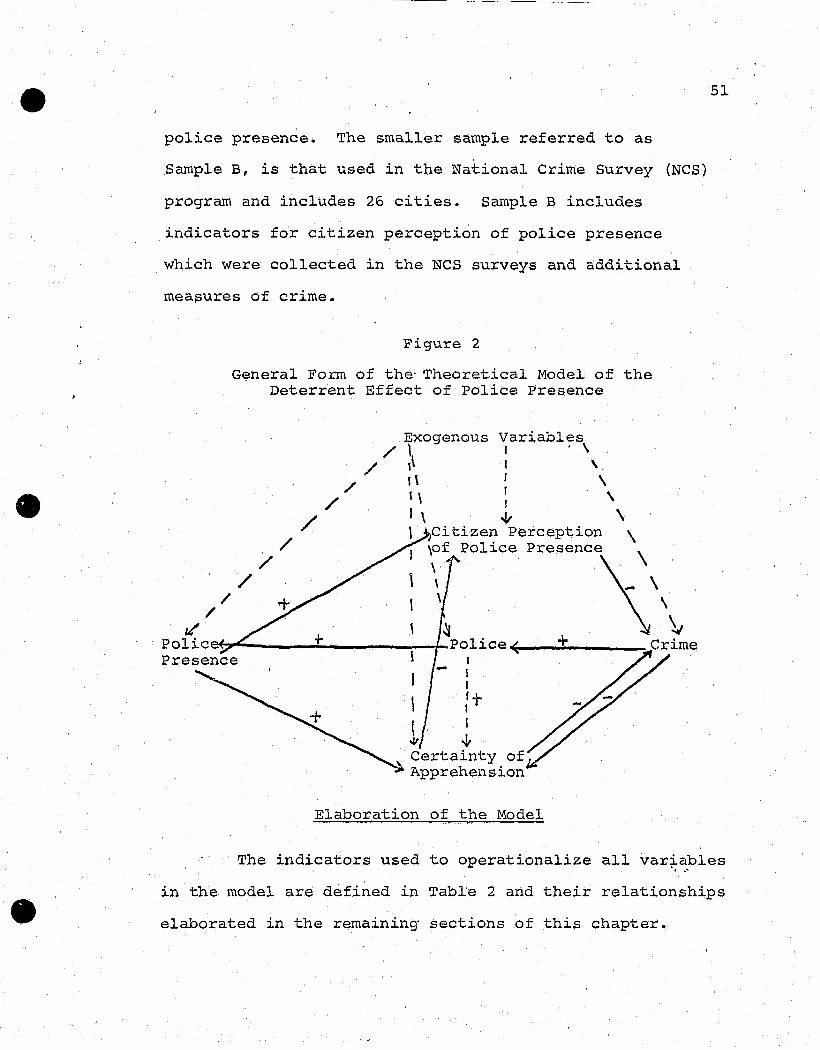
police presence. The smaller sample referred to as
Sample B, is that used in the National Crime Survey (NCS)
program and includes 26 cities. Sample B includes
indicators for citizen perception of police presence
which were collected in the NCS surveys and additional
mea$ures of crime.
Figure 2
G~neral Form of the' Theoretical Model of the Deterrent Effect of Police Presence
Exogenou.s variables / 'I I . \ / t' ( \
./ 1\ : \ / q I \
/ 1\ ..v \ Citizen Perception \
/ \ , / / / 1 \f Police presence\\ \
/ i/ ~ ~
Polic +- Police -( + Crime Presence 'I
I ~ \ : + I I
'" -l-Certainty of Apprehension
Elaboration of the Model
51
The indicators used to operationalize all var~ables .. ' in the model are defined in Table 2 and their relationships
elaborated in the remaining- sections .of this chapter.

'rABLE 2
INDICATORS FOR VARIABLES IN THE MODEL
A. Exogenous Variables
POPUDENSITYPERMPERNWPERLOEDPERUNEMCITYREVSALARYREGIONCRPPU-
TWOCOP-
total number of residents number of residents per square mile perceht male percent nonwhite percent with less than five years education percent unemployed per capita city government finances entry salary for patrolmen dummy coded by four sections annual number of index or survey crimes per patrol unit percent of two-officer patro,l units
B. Endogenous Variables
POLICEPATROLPERCEP-
CRIME-
per capita sworn police officers per capita patrol units percent of population sample stating that more police are neededa annual reported r~e of index crimes per 100,000 population
MURDER- annual reported rate of murders and non-negligent manslaughters per 100,000 populationb
RAPE- annual reported rate of forcible rapes per 100,000 populationc
ROBBERY- annual reported rate of robberies per 100,000 populationc
ASSAULT- annual reported rate of aggravated assaults per 100,000 populationc
BURGLARY-annual reported rate of burglaries per 100,000 populationc
LARCENY- annual reported rate of larcenies $50 and over per 100,000 population
LARCENY2-annual reported rate. of larcenies under
AT-
VCRIME-
VRAPE-
$50 per 100,000 population annual reported rate of auto thefts per 100,000 populationc
, "
annual victimization rate for six selected offenses per 1000 resident population age 12 and overa annual victimization rate of rape per 1000 resident population age 12 and overa
52

TABLE 2 (Continued)
B. Endogenous Variables (Continued)
TVROB- combined annual victimization rate of robbery per 1000 resident population age 12 and over and of commercial establishmentsa
VASSAULT-annual victimization rate of assault per 1000 resident population age 12 and overa
TVBURG-' combined annual victimization rate of . burglary per 1000 resident population age
12 and over and of commercial establishments a
VTHEFT- annual victimization rate of theft per 1000 resident population age 12 and overa
53
VAT- annual victimization rate of auto theft per 1000 2opulation age 12 and overa
CLEAR- percent of reported index' crimes cleared by policed
CLMURDER-percenJ".:. of reported murders cleared by policed
CLRAPE- percent of reported rapes cleared by police CLROB- percent of reported robberies cleared by
police CLASLT- percent of reported assaults cleared by
police CLBURG- percent of reported burglaries cleared by
police CLLARC- percent of reported larcenies $50 and over
cleared by police CLLAR2- percent of reported larcenies under $50
cleared by police CLTOTLAR-percent of all reported larcenies cleared
by policea CLAT- percent of auto thefts cleared by police
a. variable measured for Sample B only b. variable measured for Sample A only c. variable utilized in Sample B for purpose of
comparing analysis with victimization rate to analysis with reported rate
d. adjustments made for inclusion in the analysis o,f Sample B included deletion of the murder clearance rate and substitution of the combined clearance rate for larcenies $50 an.d over and those under $50 "I.'

'.
54
It is important to note that the diagram presented
in Figure 2 is only intended to serve as a schematic aid.
The relationships in the model are far too complex to
present in detail in a path diagram. In particular, the
effects of specific exogenous variables upon the various
endogenous variables are deleted from the diagram. At this
point it should be emphasized that all exogenous variables.
do not affect all endogenous variables. In fact, it is the
causal as~umption that they do not which makes the system
id,.entifiable. The specific relationships of exogenous to
endogenous variables post.ulated in thp. model are presented
in the structural equations. Equations one, two, and four
are identical in the analysis of Sample A and Sample B.
Equation three is relevant only to the analysis of Sample B
since the perception variable is not measured in Sample A.
For the analysis of Sample A, equation five contains a
larger number of exogenous variables than it does for Sample
B due to the limited N of the latter. Finally, it should
be recalled that the analysis is crime-specific. Thus the
model is tested for nine specific types of crime in the
analysis of Sample A while for Sample B it is tested a
total of 16 times. Specific measures of crime and their
corresponding clearance rates are therefore substituted for
the terms CRIME and CLEAR each time the model is tested_
Table 3 presents the structural equations and the remainder I

----------~---
55
of the chapter elaborates the rationale for the variables
included in the model. '
TF.BLE 3
STRUCTURAL EQUATIONS FOR THE MODEL
1. POLICE= f(CRIME, CITYREV, SALARY f NORTHEAST) 2. PATROL= f(POLICE, TWOCOP, DENSITY) 3. PERCEP= f(PATROL, CLEAR, PERNW, SOUTH, DENSI'l'Y) 4. CLEAR= f(CRIME, PATROL, POLICE, CRPPU,
NORTHCENTRAL) 5. A. CRlME= f (CLEAR, PERNW, POPU,· PERLOED, PERUNEM,
SOUTH) B. CRlME= f(CLEAR, PERCEP, PERNW, PERM, POPU)
Police
The police variable is measured as per capita sworn
police officers and occupies a pivotal position in the
model since it is the instrument for feedback. As
indicated in Chapter II, there are strong theoretical
grounds for ,supposing a positive relationship between levels
of crime and numbers of police officers. As the President's
Commission on Law Enf~rcement and Administration of Justice
pointed out, "public concern about crime is typically
translatE:d into demands for more law enforcement" (Task
Force Report: The Police:2). Thus the model predicts a .
positive relationship between crime rates and per capita " ...
sworn officers. The quantity of police in turn are thought . I
to influence the level of police pres~nce which, according

------- -----
to deterrence theory, should then be negativelY related to
crimer
Police' Presence
The indicator for police presence is the number of
patrol units per capita. This is clearly a more satis-
factory indicator of police resources and activities than
those utilized in previous resea.:rch. The core of the
deterrenc.e hypothesis in the model is that there are two
causal paths by which police presence may lead to the
deterrence of crime. Two of the most notable publications
on the topic have recogni'zed the importance of this
56
theoretical distinction. In reviewing the literature, the I recent National Research Council panel on deterrence noted
that,
Increases in police resources may increase actual apprehension risk by increasing police officers' ability to detect:and apprehend offenders •••• AlternativelYf increased levels of police resources may increase the visibility of the police in the community (through increased numbers of officers and patrol cars) without having any measurable eff~ct on the actual apprehensiol1 risk. This increased visibility could deter potential offenders who mistakenly assume that the apprehension risks are indeed increased (Blumstein et al~, 1978:44).
Similarly in reporting !.:.heir recent. research on the police
and deterrence, Wilson and Boland stated:
At: offender may alter the rate at which he commits crime not because the actual chance of being caug~~ has increased but because he perceives that i.t has, perhaps because he sees more officers than usual or more activity among them (1978:369).

e
--------~ -_ .. _-
Despite the importance of this, no previous research on
deterrence and the police has attempted to differentiate
between these two paths which theoretically could provide
the connection between police presence and crime rates.
Specifically, 110 attempt has been made to measure
perceptions of police presence and to then relate those
perceptions to a theory of the deterrent effect of police
presence.
Citizen Perception of Police Presence
A measure of citizen perception of police presence
was obtained from the NCS survey_ The specific item
employed as the measure of citizen perception of.police
presence is presented in Table 4. A response that hiring
more police is the most important factor in improving
57
police performance was taken as a measure of low perception
of police presence. These data were available for 26
cities in wnich NCS surveys have been conducted. Thus only
Sample B (which is a subsample of the total population
studied) includes citizen perception of police presence as
a variable.
Certainty of Apprehension
The police clearance rate serves as the indicator . ,. for certainty of apprehension, representing the objective
rather than the perceived probability of apprehension. As
shown in the preceeding chapter, most previous research,
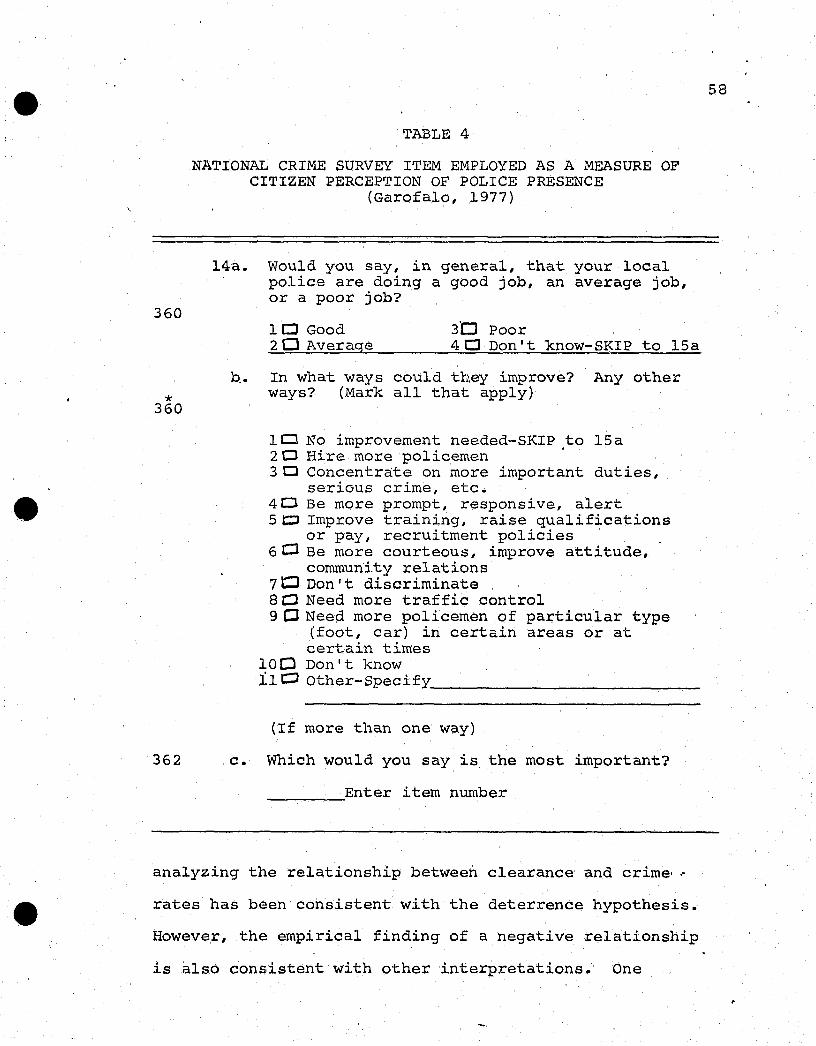
360
* 360
TABLE 4
NATIONAL CRIME SURVEY ITEM EMPLOYED AS A MEASURE OF CITIZEN PERCEPTION OF POLICE PRESENCE
(Garofalo, 1977)
l4a. Would you say, in general, that your local police are doing a good job, an average job, or a poor job?
1 CJ Good 3'0 Poor 2 a Average 4 CJ Don I t know-SI<IP to l5a
b.. In what ways could they improve? Any other ways? (Mark all that apply)
lCJ No improvement needed-SKIP to l5a 20 Hire more policemen . 3 Cl Concentra:te on more important duties,
serious crime, etc. 4CJ Be more prompt, responsive, alert 5 t:J Improve training, raise qualifications
or pay, recruitment policies 6 CJ Be more courteous, improve attitude,
cornmun'ity relations 7 t:J Don I t discriminate 8 CJ Need more traffic control 9 CJ Need more policemen of particular type
(foot, car) in certain areas or at certain times
10 Cl Don I t know ilCJ Other-Specify ____________________________ _
(If more than one way)
362 c. Which would you say is the most important?
________ ~Enter item number
analyzing the relationship between clearance and crime· ,"
rates has been consistent with the deterrence hypothesis.
However, the empirical finding of a negative relationship
is also consistent with other interpretations. One
58

interpretation, sometimes referred to as the system over-
load hypothesis, claims a causal order opposite from that
postulated by the deterrence interpretation. The
rationale is that lower crime rates allow the police to
operate more efficiently and thus achieve higher clearance
rates and conversely, that high cl:ime rates overload the
system causing lower clearance rates. In fact, deterrence ,
and overload could occur simultaneously and therefore the
model postulates a simultaneous relationship between the
2 two.
If a deterrent effect of the certainty of
apprehension is observed, it must be established that
there is also a positive relationship between police
presence and certainty of apprehension in order to support
a theory of the deterrent effect of police presence. Thus
the model proposes that certainty of apprehension (the
clearance rate) isa positive function of police presence.
59
If it is not, then the implication is that the manipulation
of police presence is unrelated to any deterrent effects of
the objective certainty of apprehension that might exist.
2There are additional interpretations that cannot be resolved by the use of simultaneous equations. The negative relationship could be due to the incapacitation of those who are apprehended. It could also be due to some biases in official statistics. Underreporting of crime"by both citizens and police have the effect of reducing the crime rate and increasing the clearance rate. Moreover, since the police desire high clearance rates they are sometimes inflated by employing flexible criteria for declaring crimes "solved."
.'
-----.,.""'.-~---------------------
60
There are two additional paths related to certai.nty
of apprehension that are included in the model for purposes
of logical consistency, but which have little theoretical
or empirical support. First, clearance rates could be
affected by police other than those on patrol. Based on
this rationale a path representing a positive influence of
total police on apprehension is included. However, little
confidence in this proposed relationship can be justified
due to the findings of previous research which has tested
the deterrence hypothesis by focusing on the relationship
between total numbers of police and crime rates. Second,
the model predicts a negative relationship between
certainty of apprehension and the perception measure.
That is, it could logically be expected that as clearance
rates increase the perceived need for police will decrease.
Intuitively, however, it seems doubtful that citizens
would have such an accurate perception of the objective
certainty of apprehension.
crime
Crime is measured as the reported rate of index
crimes in the analysis of Sample A. The analysis of
Sample 3 employs both the official rate and the NCS survey
rate. utilizing both measures provides a check on the , .. '
validity of the official measures and some insight
concerning the effect that underreporting of crime has on
the estimates of the relationships in the model.

61
Theory and previous research suggest that police
presence may differentially affect various types of crime~
Therefore, the analysis is crime-specific. That is, crime
is operationalized as rates of specific types of offenses
and the model tested for each. The concept of deterrence
rests to some degree on an assumption of rationality, but
it has been argued that this assumption is more applicable
to some types of criminal behavior than to others.
Chambliss (1967) has referred to the more rationally
motivated offenses as instrumental and the less rational
acts as expressive. The instrumental offense serves only
as a means to some other end and is therefore more likely
to be based on rational calculation. The expres~ive
offense is pursued as an end in itself, serving to gratify
some emotional drive.
A hierarchy of offenses in terms of levels of
rationality was proposed by Geerken and Gove (1977) and
was found to fit the deterrence hypothesis quite well with
their data. The deterrence research reviewed in Chapter II
is also consistent with their interpretation. Therefore,
the same predictions are made for the present research.
Optimal fit should be obtained for the more rational
property offenses of robbery, burglary, auto theft, and
larceny. The crime of rape should fall at an interme~iate . ," level, fitting the deterrence model also, but with a
weaker relationship since the offense does not serve as a
means to another end in the same sense as the

62
profit-oriented crimes. While it may tend to be more
emotionally motivated .than property offenses, studies of
rape suggest that it is not entirely irrational. For
example, Amir (1975) found that 71 percent of rapes were
planned and 43 percent involved multiple offenders.
Finally, the crimes of murder and assault occur most often
in highly emotional states and therefore are not expected
to fit the model. Wolfgang's (1958) analysis of homicide
revealed.primary relationships between the victim and
offender in 65 percent of the cases, the presence of
alcohol in 64 percent of them, and motivations classified
by the police as either general altercations or domestic
quarrels in 49 percent of these crimes. Thus the picture
that emerges for the typical murder (or assault) is an
emotionally charged rather than a rational one.
A certain amount of error is inherent in any
attempt to classify various offense categories relative
to their level of rationality. The seven classes of
offenses analyzed do not represent homogeneous categories
of behavior. While the typical murder takes place under
highly emotional circumstances with little thought given
to the consequences, there are clearly exceptional Cases
that do involve very rational calculation before
commission of the crime. Likewise, auto theft is at .times
a highly rational profit-oriented offense with much thought
given to avoiding apprehension, but a, major exception is
the juvenile auto theft committed for the purpose of

II joyriding. II To the extent tha,t the various offense
categories examined are not homogeneous, the predictions
based on assumptions concerning relative levels of
rationality will not be adequately tested.
Another issue related to the question of the '
model's adequacy relative to different types of crime are
th~ levels of visibility characteristic of each. In
orde~ for a crime to be deterrable by the potential of
police intervention, it must occur in a location subject
to view by the police in the course of routine patrol.
This is ordinarily not the case with murder or assault
since they frequently occur in a private residence. At
the other extreme, auto theft virtually always involves
some risk of an encounter with the police. However, just
as with' the issue of rationality, the various offense
categories are clearly not homogeneous in regard to
visibility. A robbery, burglary, theft, or rape may take
place in locations highly visible to the police or in ones
completely out of police visibility under normal circum
stances. Again, to the extent that the various offense
categories examined are not homogeneous in regard to
rationality and visibility, the reasons for any crime
specifiq differences found in the analysis will not be
clear. ' ... '"
63

Exogenous Variables
It is the exogenous variables which make the
equations identifiable. Although predetermined (lagged
endogenous) variables could also have been utilized to
solve the equations, the assumption of uncorrelated error
would have been questionable. There is a strong proba
bility that measures derived from a single variable at
times one and two would be correlated. If this 'serial
correlation were present, the assumption, of uncorrelated
error would be violated. Although techniques exist for
addressing this, they would have introduced additional
complexities in the analysis and still would not hav(~
provided identification restrictions superior to.carefully
selected exogenous variables.
The rationale for the inclusion of exogenous
variables is apparent in most cases. In order 'to minimize
the number of variables in the equations, treatment of the
dummy regional variable'was limited to one region per
equation. The decisions of '\>lhich variables to include in
each equation were based on review of previous research.
64
To summarize equation one (POLICE), it is suspected
that greater city revenue facilitates the hiring of more
police officers. Higher salaries on the other hand should
have a negative affect on the total strength of a poli9~
agency since fewer officers could be employed at a given
level of funding. It is also probable that police-citizen

"
ratic)s vary regionally. Specifically, it is postulated
that northeastern cities have a higher ratio than those
of other regions.
Equation two (PATROL) contains the number of
pat:rol units consisting of two officers based on the
obvious assumption that this reduces the total number of
patrol units that can be deployed. Population density
serves as a second exogenous variable and is included
because i't could be a factor in deciding. how many patrol
units are needed in a given locale e
The third equation (PERCEP) contains the exogenous
variables percent nonwhite, south, and density. Since the
measure of perception is probably not a clean measure of
police visibility but may be confounded with preconceived
attitudes concerning the need for police, these exogenous
variables are entered in the equation to account for that.
It is expected that nonwhites have a high perception of
police presence (or are less likely to believe that more
are needed), while southerners have a low perception of
police presence (or are more likely to believe that more
are needed). Finally, it is thought that density could
have an impact upon perception of police presenc~.
Two exogenous variables are included in equation
four (CLEAR). Crimes per patrol unit is entered on th~ ..
rationale that as patrol units have a larger number of
crimes to respond to, they will be successful in clearing
65
a smaller proportion of them. The other exogenous vari~bie
is the northcentral region which is based on the
observation that clearance rates generally run higher in
that region.
Five variables are included in equation five
66
(CRIME) which,have consistently been found to be correlated
with crime in ecological studies. These include the
percentages of the population nonwhite, male, unemployed,
and with low education. It is generally expected that as
the prop6rtion of the population with these character
istics increases, crime will increase. Rates of crime are
also expected to be a positive function of population.
Finally, the variable south was included in the equation
with the expectation that crimes of violence, but not
property crimes, would be greater in that region.
Summary
This chapter has presented the theoretical model
of the deterrent effect of police presence and elaborated
upon the interrelationship§ o;E the variabl.·es. It was
pointed out that a two-tier popUlation sample was employed
to facilitate the inclusion of indicators for citizen
perception of police presence and additional measures of
crime. Both of these measures were derived from the NCS
surveys. The expectation of crime-specific differences"
due to variations in levels of rationality and visibility
was also noted. These are very important theoretical
issues but involve unknown levels of measurement error.

CHAPTER IV
RESEARCH METHODS
The model presented in the last chapter provides
a mathematical formulation of a theory of the deterrent
effect of police presence. The arrow diagram (Figure 2)
and the structural equations (Table 3) express the theory
in an explicit fashion that facilitates .quantitative
testing. The basic orientation of such a causal modeling
approach provides the link between theory and research.
It forces the researcher to make explicit the theoretical
rationale for a set of regression calculations (~uncan,
1966). Thus it is fundamentally directed toward
explanation rather than prediction and is useful for
theory building as well as for theory testing.
This chap'ter discusses some of the major methodo-
logical issues in testing causal models and relates them
to the present research. The crucial assumptions in the
analysis of causal models are examined and measurement
issues relating to the present model's variables are
discussed.. Both of these topics reflect on the validity
of the estimates of the parameters of the model. In
addition, the more mechanical procedures of the analy~is . .' are delineated.
67

Statistical Assumptions
There are a number of assumptions upon ''lhich the
validity of the analysis of causal models rests. These
assumptions may be divided into two classes. First, since
the statistical technique utilized is regression, all of
the assumptions for conventional regression analysis must
be contended with. Second, there are some assumptions
specific to the model.
Convpntional Regression Assumptions
Regression is a quite robust technique, meaning
that the assump'cions it rests upon can frequently be
68
relaxed without serious consequences. However, the effects
of violating more than one assumption are unknown
(Kerlinger and Pedhazur, 1973). Thus, sensit.ivity to the
underlying assumptions is crucial and ameliorative steps
prudential whenever violations are evident.
Lineari TI. It is assumed that the relationshi}.);;-;
between variables to be reg.:::oessed are linear.. That id, o.
change in the dependerrt variable occurs as 6 linear 1:unc-cion
of changes in the predic°i:or varia.bj os ,- By plotting the
relationships in the mod,:;l it can be deterhiined if this
assumption holds. ~ehen an.y significant departoures f.cQ)!'~:_
lineari ty can be adjusted throug'h mathema"cical trant-.:-
formations (e.g., logarithm) (J,t thc;'~ependent ~Jar:table (s)
t'
, "

so that they will meet the assumption. This is a common
procedure in regression analysis and is problematic only
when the transformations implemented are not theoretically
meaningful. Under these circumstances it provides a
mechanical means of circumventing the assumption that the
data are linear and additive, but serves to confound the
theoretical understanding of the relationship since the
transformed variable cannot be related back to the
original theory.
69
Interval scales. A second assumption is that the
underlying scale of the variables is interval or ratio.
This issue has been discussed at length in the literature,
providing considerable support for relaxing the assumption
and treating ordinal data as interval or using dummy
vari~bles (Boyle, 1970; Labovitz, 1970; Lyons, 1971). The
measurement scales for variables are not an important issue
for the present resear.ch since all appear to meet the
interval requirement with the exception of the dummy-coded
region •.
Representative sample. When statistics are
calculated from a sample rather than from the total
population in order to draw inferences or generalizations
concerning that population, it must. be assumed. that th~ ..
sample is representative. Otherwise, biased estimates of
the parameters may result. Th~ present study actually
involves two populations. The population analyzed as

I 70 • Sample A can be defined as united States cities of moderate
and large populations.' Specifically, it consists of all
cities 50,000 and over in population. The data base
includes all cities meeting this definition with the
exception of those for which data were unavailable in'
either the Uniform Crime Reports (1971) or the County and
City Data Book (1972). Thus with a nearly complete
population (382 of 420) being analyzed, the issue of
representativeness becomes a moot question. Drawing
generalizations from the analysis however, requires
recognition that the population does not include small
towns and cities (below 50,000 population), cities outside
of the United states, or a population with the same
definition for a different time. Sample B consists of 26
large cIties for which data have been collected in the NCS
surveys. The NCS program and its sample are further
discussed in the next section.
Normality and homoscedasticit,Y. Tests of
significance rest on the assumption that the dependent
variable in any given equation is normally distributed
around all values of the independent variables. If the
distribution is a multivariate normal one, then this
assumption of homoscedasticity (equal variances} will also
be met (Blalock, 1972). The distribution of the dependent
variables, particularly in the analysis of Sample B, should
be scru'tinized for nu.'Uerous sources of departure from

71
normality. If significant departures from normality exist
they may be rectified by mathematical transformations.
However, violation of this assumption alone is not
generally viewed as a major source of bias. Moreover,
any departure'fromhormality only affects significance
tests and not the regression coefficients themselves.
Finally, since the data base of Sample A might be viewed
as the total population, significance tests are not
necessary in that portion of the analysis anyway.
Minimal measurement error. A final assumption
upon which the validity of regression analysis rests is
that the error in measuring the variables is not
excessive. To the extent that the measurements are
plagued by random error, the regression coefficients may
be attenuated. Systematic measurement error, however, can
bias the regression coefficients either upward or downward
(Asher i 197q). In the present research estimates of .
reliability are not obtainable, leaving measurement error
unknown. Heise (1969) points out that this is a frequent
predicament for the social scientist when limited to
testing theories with c~oss-sectional data. Thus, the
validity of analyses often rest on a qualitative assessment
of the reliability of the measurement of the variables. No
solution is available for systematic measurement error;
it must be assumed that any measurement error is random.
However, it has been demonstrated that coefficient

.~------ -~---- -
estimates generated through 2SLS are unlikely to be biased
as a result of random measurement error due to the
additi~n of instrumental variables (Heise, 1975; Johnston,
1972) •
Modeling Assumptions
A causal model or system of structural equations
is based on certain assumptions beyond those necessary for
regressio,n. The assumptio,ns for recursive models are far
more restrictive than those for nonrecursive models. By
definition, the recursive model assumes that the causal
order specified is correct and that there is no feedback
or reciprocal causation. It is also assumed that the
disturbance or error term for a dependent variable is
72
uncorrelated with the disturbance of any of the independent
variables in an equation. l
The model proposed in Chapter III is a
nonrecursive model which does not meet the above ,
assumptions~ The specification of the model includes
feedback resulting from the relationship between crime and
the police as well as a symmetrical relationship between
crime and certainty of punishment. This in turn causes
violation of the assumption of uncorrelated error since
, "
lThe error term has two components: the measurement error in operationalizing variables and the stochastic error which consists of the ma~y UITn\easured variables impinging upon those variables (Johnston, 1972; Wonnacott Bnd Wonnacott, 1970).

----'~-----------------------
·,:e . I ,
I endogenous variables with reciprocal relatio~ships will
necessarily have correlated error terms. It is the
violation of this assumption which makes an ordinary
least squares (OLS) regression unacceptable. Thus 2SLS
73
is utilized as an alternative means of generating estimates.
As the term implies, 2SLS involves two separate
applications of OLS regression. The first applicat.ion
serves the function of decontaminating the endogenous
variable(s) on the right-hand side of each equation of
the error it has in common with the dependent variable.
In other words, nonrecursive sources are transformed into
recursive ones so that the assumptions for an OLS estimate
will be met. This is accomplished in the first stage by
reg~essing each endogenous variable on the right-hand side
of each'equation on all of the exogenous variables in the
system and then replacing the actual observations on those
endogenous variables with the predicted values. Since
these new values are a linear combination of exogenous
variab16s, which are assumed to be independent of the error
terms of the endogenous variables, OLS regression can then
be applied in the second stage.
The identificat~on problem was discussed in
Chapter II. In order to achieve identification it was
necessary to omit one or more exogenous variables from .. '

74
each of the equations. 2 This led to a situation of exact
identification in some'equations and overidentification
in others~ The excess information in the case of over-
identification presents no problem since it is all
utilized simultaneously with 2SLS (Asher, 1976). However,
the important assumption that the model was properly
specified remains.
Measurement Issues
This section discusses issues concerning the
measurement of those variables comprising the model and
others measured for use in computing them. The three
major sources of data drawn upon were the Uniform Crime
Reports, the National Crime Surveys and census data
published in the county and City Data Book (1972).
uniform Crime Report~
The Uniform Crime Reporting Program was implemented
by the Federal Bureau of Investigation in 1930. Since that
time it has been in continuous operation and received
periodic methodological updating. It is a means of
acquiring data from local police agencies on a purely
voluntary basis. Not all agencies participate, although
. 2The necessary condition for identification is'that
"the number of exogenous variables excluded from the equation must at least equal the number of endogenous variables included on the right-hand side of the equation" (Wonnacott and Wonnacott, 1970:180).

the overwhelming majority do (agencies serving 93 percent
of the national population in 1971), and the FBI does not
vouch for the accuracy of the data although they do check
for consistency. The data collected in this program, and
especially that publishen in the annual Uniform crime
Reports, are frequently used by criminologists. There are
serious problems in such use that the re~earcher should be \
aware of, but despite these many criminologists have
concluded that they are the best statistics on crime and
the police available on the national level (Lejins, 1966;
Savitz, 1979).
Crime rates. The number of "crimes known to the
police" are published in the Uniform Crime Reports and
used as the measures of crime in this study. This is the
most accurate measure in the Uniform Crime Reporting
Program of the true amount of crime. However, it is
clearly an underestimate of the actual amount since
citizens do not report all crime and police do not record
all that is reported to them (Black, 1970; Lejins, 1966;
Nettler, 1974j Skogan, 1977). All crime data for Sample A
75
are from the 1971 Uniform Crime Reports. Sample B utilizes
data from the 1971, 1972, and '1973 reports as they
correspond to the time of data collected in the NCS program.
The number of crimes were converted to rates per
100;000 population and analyzed separately for each of the
seven index crimes. These offense categories are defined

by the FBI to insure uniformity in reporting. They were
originally selected on the basis of their frequency and
seriousness .and are intended to serve as a general
76
measure or index of crime rates. Both the number of crimes
known to the police and the number cleared are maintained
for index crimes and facilitated the present study. The
seven index crimes and their definitions as given in the
1971 Uniform Cri~e Reports are summarized in Table 5.
TABLE 5
DEFINITIONS FOR INDEX CRIMES
Criminal homicide--Cbmprised of two categories: (1) Murder and nonneg1igent manslaughter. Attempts and justifiable homicides are excluded. (2) Manslaughter by negligence. Only the former category is used to operationa1ize murder in the present research.
Forcible rape------Rapes and attempted rapes by force. Statutory offenses are ~xc1uded.
Robbery------------Taking anything of value from a . person by force or threat or
attempting to do so. Aggravated assault-An assault with intent to kill or
inflict severe bodily injury, including attempts.
Burg1ary-----------Un1awfu1 entry or attempted entry of a structure with intent to commit a theft or felony.
Larceny------------Comprised· of two categories of theft: (1) items valued $50 and over. (2) item.s valued under $50. Auto theft is exc1uded~ These categories are analyzed separately in the present research. .
Auto theft---------Stea1ing or driving away a motor vehicle.

I • 'j f )
I' I I
,
-------------- - ---- - -
Clearance rates. Police agencies participating in
the Uniform Crime Reporting Program provide the number of
crimes cleared for each of the offense categories reported
in Return A, although th,ese statistics are not published.
The Return A master tapes were obtained from the FBI for
the years 1971, 1972, and 1973. 3 Clearance rates per
100,000 population coinciding with each of the crime rates
were then calculated.
The clearance rate is the proportion of crimes
known to the police which have been solved ,to their
satisfaction. A crime may be cleared as the result of an
arrest or by exceptional means in which the police are
satisfied that the offender has been identified but are
unable to make an arrest for some reason (e.g., death,
incarce'rated elsewhere, refusal of other parties to
prosecute). The arrest of one person may result in many
clearances or the arrest of several persons may clear
just one crime. Since clearance rates are used to some
extent as a performance criteria for the police
(especially detectives), they are sometimes viewed with
skepticism. Skolnick (1975) found evidence that clearance
rates are sometimes inflated by detectives who encourage
defendants to "clean" themselves by offering benefits such
, "
3Conversion of the Return A master tapes from EBCDIC to character sets readable by the UNIVAC system was accomplished with a COBAL program. '1111e program also converted portions of the data'from packed decimal to ordinary form.
77

as charge reductions and immunity from further investi-
gation on prior offenses. This leads to the suspicion
that some offenders (particularly burglars) may become
"too cooperative" and confess to offenses they did not
actually commit. Whether justified or no't, these multiple
clearances are problematic for deterrence research since
the clearance rate is used as a proxy for certainty of
punishment. Nevertheless it appears to provide'a better
estimate of the objective certainty of punishment than
any other measure available (Tittle and Rowe, 1974).
Police employee data. Various statistics on
police employees are also collected in the Uniform Crime
Reporting Program. Numbers of sworn personnel are
publish~d in the Uniform Crime Reports for al~ three years
and are employed as the police indicator after conversion
to rate per 100,000 inhabitants. In addition, the FBI
collected data on types of patrol for the years 1971 . through 1973 and these were obtained from the master tapes
on police employees for these years. 4 Toe data were
collected by shifts for each of the following categories:
one man vehicle, two man vehicle, one man foot, two man
foot, and other patrols. TWo important variables were
calculated from these statistics: (1) total nt~ber of , . ."
4A COBAL program similar to that written for the Return A master tapes was used'for character conversion and to handle the packed data.

patrols per 100,000 population and (2) percent of patrol
units (both foot and vehicle) which consisted of two
officers.
National Crime Surveys
The Law Enforcement Assistance Administration and
the Bureau of the Census have collected data through the
NCS series of surveys since 1972. 5 One of their primary
values is the detection of crime that is not officially
reported or recorded. However, it has been argued that
they are subject to some sources of error that can
actually lead to overreporting (Levine, 1976, 1978). The
series consists of two sets of surveys: a continuing
panel design which utilizes a national sample and periodic
surveys of independent cities (Garofalo, 1977). It is the
latter component which provided a portion of the data for
this research. Three survey groups were used: 1972
surveys in the eight cities comprising the LEAA High
Impact Crime Reduction program, 1973 surveys in the
nations five largest cities, and 1974 surveys in 13
selected cities. They are presented in Table 6.
The city surveys estimate rates of crimes against
persons, households, and commercial establishmer.ts for the
12 month period preceding the interview dates. Therefore, ' .. '"'
the three groups of surveys provid~ng data are roughly
79
5The data from the NCS series'and discussions of methodological issues are available in a series of National Criminal Justice Information and Statistics Service Reports.

TABLE 6
THE NATIONAL CRIME SURVEY SAMPLES
Sample
High Impact Cities (1972)
Five Largest Cities (1973)
Selected cities (1974)
Atlanta Baltimore Cleveland Dallas
Chicago Detroit Los Angeles
Denver Newark Portland st. Louis
New York Philadelphia
New Orleans Oakland San Diego
60
Boston Buffalo Cincinnati Houston Miami Milwaukee Minneapolis
'san Francisco Washington, D.C.
comparable to the calender years of 1971, 1972, and 1973
and were used as a second measure of crime in Sample B.
Methodological issues in the city surveys are discussed in
some detail 'by Garofalo (1977). The sampling frame for
household and personal crimes consisted of a list of
housing units from the 1970 census supplemented by a list
of new construction building permits. The sample size for
each city was approximataly 10,000. For each household one
adult was interviewed about crimes against the household
(burglary, household larceny, and vehicle theft) while, each
household member 12 years of age or older was individually
questioned about their personal victimization (rape,
"

robbery, assault, and personal larceny). The scu;,ple for
the commercial surveys was obtained by randomly selecting
city areas and then visiting them to identify all eligible
establishments. Interviews were then conducted with one
representative for each business to estimate rates of '
robbery and burglary.
In addition to questioning household respondents •
about victimization, a subsample were asked questions
which were intended to measure attitudes and perceptions
about crime and criminal justice issues. Suggestions for
improving police performance. were elicited from those
interviewees who first indicated that improvement was
needed. The suggestion that more police were needed was
used in the present research as an indicator of low
perception of police presence. However, perception is a
very difficult concept to measure directly and utilizing
secondary data as a perceptual measure increases the risk
of confound~ng it with other variables. An opinion that
81
more police are needed could be due in part to preconceived
attitudes independent of perception of police presence. In
addition, the perceptions measured in the NCS surveys are
those of the population in general and may overrepresent
persons .who are residentially stable, middle class, and
older. However, it is the perceptions of the transient-,.
lower class,. and young which may be more important since
they are more likely to be involved in the traditional types
of c~ime examined in this study. In'short, they are the

:e I .. >
4 popuiation whose perceptions are most important to the
theory since it is largely those belonging to their group
who might be deterred by police presence.
other Sources
Seven variables from the County and City Data Book
for the 1970 census were utilized. 6 These were land area,
population, percent of the population female, number of
white res.idents, percent of the population with less than
five years of formal education, percent of the population
unemployed, and per capita city government finances. Some
of these variables served as indicators for variables in
the model while others were used to calculate the values
of indicators (see Table 2). In addition, definitions of
four geographic regions (south, northeast, northcentral,
and west) employed by the Bur'eau of the Census were used
for dummy coding of the region variable.
A final source of data was the publication of the
82
International City Management Association for the year 1971
(Sample A) and for the years 1971 through 1973 (Sample B).
These publications provided the entry salary for patrolmen
as of January 1 of each year. Since these data had a
relatively large number of missing observations (69 of 382
in Sample A), estimates were obtained by two means. Entry ", ."
6 Other data for Sample A were from 1971, while the other data for Sample B were for 1971·through 1973. However, changes during these periods were thought to be . slight and their effects negligible.
.'

salaries of firemen were used in cases for which they were
available (6 in Sample A) since they were identical in the
majority of cities and coincided highly in the remainder.
Second, adjusted salaries from the two adjoining years
were used when available (37 cases i~ Sample A). The·
adjustment for inflation was made by a~ding or subtracting
5.5 percent. This estimate was deriv-e:d by calculating the
average salary inc-rease from 1971 to 1972.
Procedures for Analysis
The analysis was performed with the UNIVAC 1140
utilizing SPSS: The Statistical Package For The Social
sciences (Nie et al., 1975). The RECODE facility was used
to assign the value -9 to all missing observations.
Pair-wise deletion of missing data was then used in all
calculations.
The procedures employed for the 2SLS regressions
were as follows. Each endogenous variable was regressed
on all exogenous variables using forward (stepwise)
inclusion and the default values for the inclusion
criteria. Options were selected to output the resulting
83
standardized predicted Y' values on a raw-output-data file.
The predicted values in those files were then added to the
SPSS files for Sample A and Sample B in order to use 4hem . " in the second round of the 2SLS regressions. These ne,,,
variables were then substituted for the original endogenous
variables in each case where they appeared on the ..

- --- -----------------
right-hand side of the equation. Finally, OLS regression
was used 'with the new variables to obtain estimates of the
regression coefficients in the model. Hierarchical
inclusion was used in testing the model with s±andardized
regression coefficients output.
Summary
84
This chapter discussed the assumptions upon which
the analysis rests. The u'sual assumptions for regression
analysis are linearity, interval scales, representative
samples, normality, and limited measurement error. The
effects of violating these assumptions were discussed as
well as techniques for correcting them if evidence of
violations were found. The assumptions for causal models
have been discussed in earlier chapters and were summarized
here. The major methodological issue in the model is its
simultaneous relationships.
The 'data sources for the study were identified and
some of their shortcomings discussed. The underreporting
that is characteristic of the Uniform Crime Reports is well
known and therefore the victimization crime measures are a
valuable addition to the analysis of Sample Bo The
clearance rate was discussed as the indicator for objective
certainty of punishment as well as attempting to introp~ce
a perceptual measure of police presence in the analysis of
Sample B. The last section summarized the mechanics of the
analysis.

'\
CHAPTER V
ANALYSIS OF SAMPLE A
The findings of the analysis are presented for
each structural equation in the model individually.
Focusing on each equation provides insight concerning the
fit of specific crime 'types to the various segments of the
model. Note that a specific type of crime need not fit
all equations in order to sUbstantiate the deterrent
effect of police presence. It is only necessary that a
specific clearance rate be a positive function of per
capita patrol and that the co'rresponding crime rq.te be a
negative function of that clearance rate. It is not a
logical- necessity that every category of crime which shows
evidence of deterrability also generate demand for police.
Thus, the equations for per capita police and patrol can
be viewed as analytically distinct from the equations for
crime and clearance rates in terms of specific types of
crime.
Table 7 presents a correlation matrix of all
variables in Sample A. All correlations in the matrix are
based on the original values of variables. Therefore the
endogenous variables are not the same values as were " . " employed as independent variables in the 2SLS regressions.
The predicted values which wer~.generated in the first
85
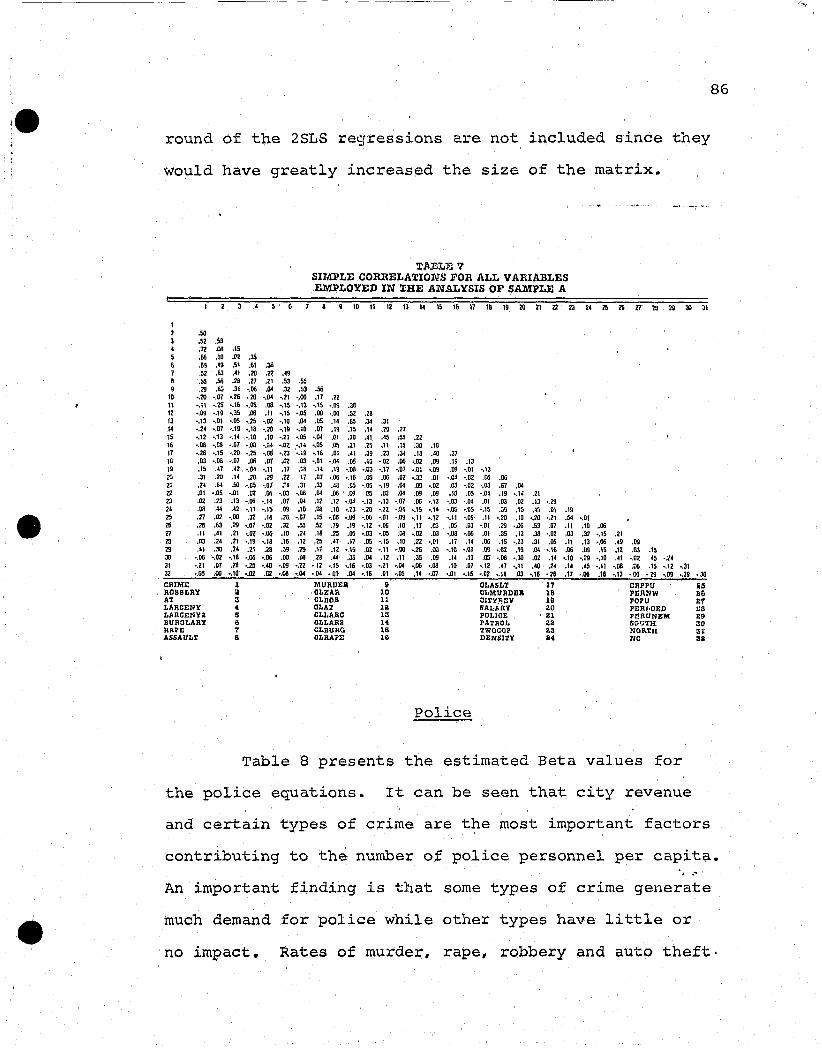
86
round of the 2SLS reSfressions are not included since they
would have greatly increased the size of the matrix.
T.AlliLB 7 SIMPLE CORRELATIOIiTS FOR ALL VARIABLES EMPLOYED IN THE ANALYSIS OF SAMPLE A
Q 10 11 12 13 14 15 16 11 18 19 2Q 21 22 23 24 15 26 17 211 29 :JJ 31
1 2 .SO 3 .SZ .59 4 .72 .08 .15 5 .66 .10 .~2 .35 6 .89 .'9 .5\ .61 .35 7 .SZ .63 .'J .20 ;12 .49 8 .59 .56 .28 .27 .21 .53 .55 9 ,29 .S:; .31 ,.116 .04 .32 ,53 ,56
10 ,.20 ',07 ,,26 ,20 ,.04 ',21 ,.00 ,17 .22 11 -.11 -,ZS -,16 _.05 .06 -,IS -.13 ,.15 -.09 .38 12 -.09 ,,19 -,35 .116 ,11 ',IS "OS .00 ',116 .52 .18 13 ',13 ,,01 -,OS -,15 ,,02 '.10 .04 ,U5 .14 ,65 ,34 .31 14 -.24 -,07 ·,19 '.18 ,,20 -.19 -.10 ,07 ,19 .75 .14 .2':1 .17 15 ,.12 ,.13 ... 14 ,.10 .10 ,,21 "OS ',04 ,01 .70 .41 .45 .55 .21 16 ,.08 ,.CB, ,,07 ,.08 ,.04 ,.02 -,14 ,,OS ,OS ,31 .15 .11 .15 .30 .10 17 '.26 '.15 -,20 -.15 ,,06 ',23 '.19 '.18 .01 .41 ,39 .23 ,34 .18 .M] .37 16 ,OJ ,,08 .,07 .116 ,07 .02 .OJ -.01 ,.04 .06 .10 ,,02 .116 ,.02 .09 19 .13 19 .15 .n ,'2 ,,04 '.11 .17 .18 .1' .19 '.03 '.OJ '.17 ,,07 ,,01 -,09 .09 ,.01 '.13 10 .:11 .20 .14 .10 ,29 .22 ,17 .07 ,,06 ',I. .OS .06 .02 -.3Z .01 ,.04 ',02 ,06 .06 21 .2' , .. ,so "OS ,.07 .~4 .31 .33 .43 .OS ,,06 ,.19 .04 .09 ',02 .00 ,.02 ,,08 ,67 ,04 12 .01 ,.OS ,.01 .02 .06 ,.OJ ,.08 .04 ,06 .09 (!5 .1Il .04 .09 ,09 .10 ,OS ',04 .19 • .1'; ,21 ZI .02 ,23 .13 ,,06 ',14 .07 ,04 .12 .12 ,.04 ',13 '.13 ,,07 .06 '.13 '.OJ ·.04 .01 .1Il .02 .13 '.29 24 .03 ,44 .42 '.11 '.15 ,09 ,10 .00 .10 '.23 ·.20 '.21 "M ,,19 ,.1' ,,05 '.1lS '.15 .39 .15 .45 ,01 .19 25 ,71 .02 ,,00 .32 .16 .28 ,.07 ,IS ,.08 '.09 '.0& ·.01 ',09 ,.11 ,.12 '.11 ,.09 .11 ·,ro .10 ·,10 ,.21 .54 ,.01 26 .26 ,63 .29 ,.07 ,,02 ,32 .55 .52 .79 ,19 '.12 '.06 .10 .17 ,OJ .OS .OJ ',01 .29 ,.06 .53 .07 ,II .10 ,116 27 ,11 .41 .21 ,.02 ,,06 .10 .24 ,18 .15 .05 ,.OJ '.05 .08 ,.02 .OJ ,.08 ,.06 .01 .35 ,13 ,35 '.02 .OJ ,32 ,.15 .21 28 .03 .24 .21 '.19 '.18 .16 ,12 .25 .j) .17 .05 ,.15 .10 .22 ,.01 .17 .14 .116 .15 ,,23 .31 ,05 .11 .13 ,.116 •• 9 .09 29 ,4, .30 .24 ,21 .28 .39 .29 .11 .12 -,15 .02 -.11 -.00 -.26 .00 -.10 -.OT ,09 +.'31 .19 ,04 -,16 .116 .09 .15 ,n .OJ .15 :JJ ,.116 -,02 ,.18 '.06 ,.116 .00 .08 ,18 .~ .J5 .04 .12 .11 ,35 .09 .1' ,10 .OS ,.08 ,,30 .01 ,14 '.10 '.29 ,,10 .41 ,,01 '5 ,.Z4 31 ',21 .07 .28 '.25 -.40 ,.09 '.22 ',12 ',15 ·,16 '.OJ ',11 .,04 ,,06 ,,08 ,10 ,07 '.12 .• 7 •• 11 .4(1 .2' ,14 ,45 ·,11 ,.08 ,<16 .15 ·.12 •. 31 32 "OS .00 -.10 '.02 .G2 "OIl -.04 ,.04 ,(iO) .04 '.16 .01 .,05 .14 ·.C7 '.01 '.15 ·.02 •. 18 .03 '.18 ·,VJ .17 ,.06 .16 ·.13 ,.00 ·29 ·,09 ·,39 ·.30 CIIIME 1 MIIRDIlR 9 OLASLT 17 CR~PII aB ROBBilRY a Ot.llAR 10 OLMURDIlJl 18 PEJINW 20 AT 3 OLnOIl 11 OlrY,;~V 19 PO~U 21 LARCElIY 4 CLAT 12 SALliny 20 PEIII·OIlIl 1:0 t.ARCENY2 B CLLAIIC 13 POLIOE 21 PlllIUNIlM 29 BURGLARY 6 CLLAR2 14 PATROL 22 SOU'l'H 30 RAPE 7 CLBURG 16 Twoeop 23 NORTH 31 ASSAULT 8 CLRAl'Il 16 IlENUry i4 NC 311
Police
Table 8 presents the estimated Beta values for
the police equations. It can be seen that city revenue
and certain types of crime are the most important factors
contributing to the number of police pe.rsonnel per capita. . ." An important finding is that some types of crime generate
much demand for police while other types have little or
no impact. Rates of murder, rape, robbery and auto theft·

all produce greater increases in per capita police than
does city revenue. These findings are at odds with
Swimme;r's (1974a; 1974b) conclusion that demand for
police expenditure is a function of property crime and
not of violent crime. His analysis may have been
misleading due to the combining of several types of crime
to yield only two categories (violent and property) •
Examination of the police equations below shows number
of police to be a greater 'function of violent than of
property crimes with the notable exception of auto theft.
The number of police per capita is'seen to be
slightly negatively related to police salaries after
controlling for the regional variable of northeast (where
87
greater numbers of police are employed at higher salaries).
The somewhat larger number of police in the northeast is
reflected in the relatively consistent low to moderate
Beta values for that variable.
TABLE 8
ESTIMATED VALUES FOR THE POLICE EQUATIONS
DEPENDENT VARIABLES INDEPENDENT VARIABLES
POLICE CRIME CITYREV SALARY NORTHEAST
Beta .19 .52 -.07 .'20 F 14.09c 106.75c 2.86 a 14.73c
POLICE ROBBERY CITYREV . ~ALARY NORTHEAST
Beta .53 .28 -.11 .22 F l78.07? 38.86c 9.79c 31.19c ·

. e
TABLE 8 (Continued)
DEPENDENT VARIABLE
POLICE
Beta F
POLICE
Beta F
POLICE
Beta F
POLICE
Beta F
POLICE
Beta ,
F
POLICE
Beta F
POLICE
Beta F
a. b. c .
INDEPENDENT VARIABLES
AT CITYREV SALARY
.51 .36 -.11 117.68c 60.38 c 9.61c
LARCENY CITYREV SALARY
.22 .50 -.03 26.91 c 108.87 c .62
L.ARCENY2 CITYREV SALARY
-.18 .62 .07 5.79 c l71.14c 1.81
BURGLARY CITYREV SALARY
.28 .49 -.08 41.44 c 112.77c 3.99b
RAP}!: CITYREV SALARY
.48 .42 -.09 158.70c 102.91c 6.18c
ASSAULT CITYREV SALARY
.41 .46 -.02 '127.0Sc 124.44c .41
MURDER CITYREV SALARY
.47 .40 .05 167.43c 94.9lc 1.80
Significant at the .05 level Significant at the .01 level Significant at the .001 level
88
.. NORTHEAST
-.03 .50
NORTHEAST
.16 11.83 c
NORTHEAST
-.02 .07
NORTHEAST
.19
.19
NORTHEAST
.33 61.77 C
NORTHEAST
.26 37.72 c
NORTHEAST
.29 49.97 c
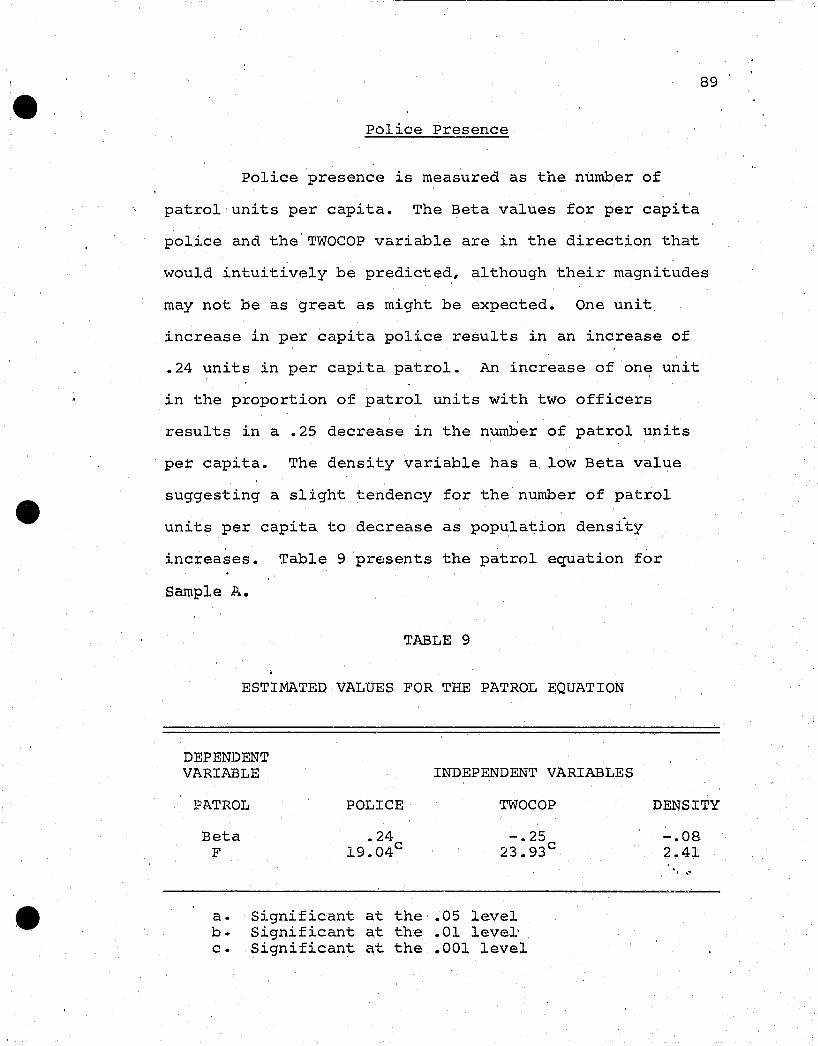
:e 89
Police Presence
Police presence is measured as the number of
patrol units per capita. The Beta values for per capita
police and the TWOCOP variable are in the direction that
would intuitively be predicted, although their magnitudes
may not be as great as might be expected. One unit
increase in per capita police results in an increase of
.24 units in per capita patrol. An increase of one unit
in the proportion of patrol units with two officers
results in a .25 decrease in the number of patrol units
per capita. The density variable has a low Beta value
suggesting a slight tendency for the number of patrol
units per capita to decrease as population density
increases. Table 9 pr~sents the patrQl equation for
Sample F ••
TABLE 9
ESTIMATED VALUES FOR THE PATROL EQUATION
DEPENDENT VARIABLE INDEPENDENT VARIABLES
PATROL POLICE TWOCOP DENSITY
Beta F
.24 19.04c -.25
23.93 c
a. Significant at the .05 level b. Significant at the .01 level' c. Significant at the .001 level
-.08 2.41
" .......
.'

90
Certainty of Apprehension
An important linkage in the model is that between
police presence and clearance rates. If a high objective
certainty of apprehension deters certain types of crir,linaJ.
behavior, then a theory of deterrent effects of police
presence assumes that police presence is positively
related to clearance rates. In proposing the deterrence
model it was argued that police presence is theoretically
crucial and that per capita patrol would provide .a better
measure of that variable than previously used measures
such as police expenditures and numbers of police. Thus,
it was expected that patrol would be posi tiv·ely related
to the clearance rates of at least the mQre ra'tional and
visible offenses and that the police variable would
generally have a weaker relation. This is a crucial path
since any deterrent effect observed in the crime equations
can only be attributed to police presence if the clearance
rate is a positive function of police presence.
The findings in the equation for the clearance of
combined index crimes were consistent with expectations.
The Beta values for the patrol and police variables WE~re
modest positives with the patrol variable being slightly
stronger. The measures for burglary, auto theft, rape,
and both types of larceny follow the predicted pattern but
their Beta values are very weak to negligible. The measure
of crimes per patrol unit is n'egatively related to total.

,e 91
index crimes and burglary. This provides some support for
the relevance of patrol to clearance rates, indicating
'that as patrol units have less crimes to respond to a
larger portion of them are cleared.
Examination of the Beta values for the various
types of crime in the clearance equations reveals modest
support for the overload hypothesis for the combined
index crimes and in the case of larcen.y under $50,
robbery, 'rape, and auto theft. The int~rpretation of
their negative Beta values is that as the frequency of an
offense increases, the clearance rate for that offense
decreases due to the increased police workload. It is
surprising that the overload hypothesis is suppo~ted for
offenses as serious as rape and robbery while not
appearing for larceny of $50 and over. Theoretically, it
would seem more probable that police would make the
manpower reallocations necessary to maintain clearance
~ates for those crimes perceived as most serious by
themselves and the public. The clearance equations are
presented in Table 10.
Other variables in the clearance equation are the
number of crimes per patrol unit and the regional variable
northcentrale It was expected that clearance rates would
be a negative function of crimes per patrol unit. Negative . " relations did result in seven of the nine equations, but it
is a substantial Beta value on~y in the case of burglary.

92
Considerable regional variation was found for the
clearance rates.
TABLE 10
ESTIMATED VALUES FOR THE CLEARANCE EQUATIONS
DEPENDENT VARIABLE INDEPENDENT VARIABLES
CLEAR CRIME PATROL POLICE CRPPU NC
Beta -.22 .12 .09 .02 .08 F 15.46 c 4.66c 2.57a .13 2.24a
CLROB ROBBERY PATROL POLICE CRPPU NC
Beta -.20 -.01 .06 -.02 -.10 F 2.69a .03 .18 .14 2.59a
CLAT AT PATROL POLICE CRPPU NC
Beta -.09 .09 -.15 -~OO .05 F 061 1.60 1.57 .. 01 .51
CLLARC LARCENY PATROL POLICE CRPPU NC
Beta -.02 .03 .00 -.05 .01 F .09 .17 .00 .49 .01
CLLAR2 LA RCENY 2 P]~TROL POLICE CRPPU NC
Beta -.26 .07 -.02 -.04 .22 F 21.49 c 1.19 .18 ,.40 13.35c
CLBURG BURGLARY PIl;.TROL POLICE CRPPU NC
Beta .11 .02 -.15 -.18 -.00 F 2.11 .12 4.16c 5.91c .00
CLRAPE RAPE PATROL POLICE CRPPU NC
Beta -.16 .12 .13 -.03 " ·-.08 F 5.08c 2.4Sa 3.45b .35 1.39
-

---~---
93
TABLE 10 (Continued)
DEPENDENT VARIABLE INDEPENDENT VARIABLES
CLASLT ASSAULT PATROL POLICE CRPPU NC
Beta -.05 -.02 .01 -.03 -.14 F .56 .09 .02 .26 4.72c
CLMURDER MURDER PATROL POLICE CRPPU NC
Beta .08 -.07 -.15b
.07 -.09 F 1.24 1.09 3.81 1.33 2.19
a. Significant at the .05 level b. Significant at the .01 level c. Significant at the .001 level
crime
. Table 11 reports the estimated Beta values of the
crime equation for each type of offense. The combined
index crime rate is most strongly related to the percent
of the popu+ation unemployed and the percent nonwhite.
It is also negatively related to the clearance rate, thus
?roviding support for the deterrence proposition. Contrary
to what might be expected, the rate of index crimes is
negatively related to the percent of the population with
lm>/ education.
..

.'
94
TABLE 11
ESTIMATED VALUES FOR THE CRIME EQUATIONS

-~.----------------------------------------------------------
• DEPENDENT VARIABLE
TABLE 11 (Continued)
INDEPENDENT VARIABLES
95
MURDER CLMtJRDER PERNW POPU PERLOED PERUNEM SOUTH
Beta -.02 .69 .10 .03 F .15 288.S8c 8.S2c .38
a. Significant at the .05 level b. Significant at the ~Ol level c. Significant at the .001 level
.02
.31 .15
9.7Sc
Turning to the robbery equation, percent nonwhite
appears as the most important variable. The rate of
reported robberies is also a positive function of
population and percent unemployed and a negative. function
of the regional variable south. The most important
finding' in the robbery equation is the negligible Beta
value of the robbery clearance rate. On the basis of the
Geerken-Gove t.hesis, a much stronger negative Beta value
was expected. However, examination of the intercorre-
lations of some key variables in the equation raises some
suspicions that warrant further exploration. The simple
correlation between the predicted robbery clearance rate
generated in the first round of the 2SLS regression
(CLROBY) and the reported rate of robbery is quite strong
(-.48). Percent nonwhite (PERNW) has a strong positiv.~.
correlation (.65) with robbery as its Beta value in the
equation suggests. However, CLROBY has a much higher

correlation with PERNW than with the actual clearance
rate of which it is supposed to be a linear function.
There is no apparent reason of theoretical import~nce
for the high correlation between CLROBY and PERNW but
the result may be a deflation of the relationship
between CLROBY and ROBBERY in the structural equation.
That is, the strong negative relationship between CLROBY
and PERNW might have the effect of attenuating the
relationship between CLROBY and ROBBERY~ Sinc0 the
predicted values of endogenous variabl!9s generated in
the first round of the 2SLS regressions were not included
in Table 7, the variable CLROBY is presented below in a
correlation matrix with ti;e other variables releyant to
the present issue (Table 12) •
CLROB
CLROBY
ROBBERY
PERNW
TABLE 12
CORRELATIONS OF KEY VARIABLES IN THE ROBBERY EQUATION
CLROB
1.0
.25
-.27
-.15
CLROBY
1.0
-.48
-.65
ROBBERY
1.0
.65
PERNW
1.0
96
The robbery equation was further explored by
reestimating the Beta values w-ith an bLS regression. This

1
I -.1 ! \
97
required that the value of CLROB be sUbstituted in the
equation for that of CLROBY which is spuriously correlated
with the percent nonwhite. Table 13 compares the results
as calculated through the two different techniques. There
are no appreciable changes in any Beta values other than
that of the clearance variables for which a considerably
stronger negative value results in the OLS regression.
The equation was also 'estimated by OLS for all other crime
types and resulted in no appreciable ch~nge in any of the
Beta values. Thus the OLS regressions support the
suspicion that PERNW suppresses the true relatio21ship
between robbery and its clearance rate when 2SLS is used
as the estimating technique.
2SLS
OLS
TABLE 13
COMPARISON OF ORDINARY AND TWO STAGE LEAST SQUARES FOR THE ROBBERY EQUATION
CLROB (Y) PERNW POPU PERLOED PERUNEM
Beta -.02 .66 .26 ~.02 .16 :13' .10 l43.77 c 60.37 c .22 19.34c
Beta -.16 .64 .. 26 -.00 .17 F 2.<L2l c 261.59c 64.SS c .01 23.84c
a •. Significant at the .05 level b. Significant at the .01 level c. Significant at the .001 level
SOUTH
-.23 24.3lc
-.22 30.20c

-- ---------------
98
Both types of larceny are a negative function of
their clearance rates as was predicted on the premise
offered by Geerken and Gove. In the clearance equations
these two clearance rates were a positive, but negligible
function of patrol. Thus while it might be concluded that
certainty of apprehension has a deterrent impact on the
offense of larceny, police presence is of negligible
importance in apprehension and therefore in the deterrence
of that crime. Focusing on other variables in the larceny
equations shows both types to covary negatively with the
percent of the population having low education and
positively with south and percent unemployed.
The auto theft equation is consistent wi.th the
deterrence hypothesis as predicted. Since the auto theft
clearance rate is also a positive function of patrol there
is at least a minimal fit at both of these crucial points
in the model. Further examination of the Beta estimates
in the equation reveal that auto theft is a positive
function of percent nonwhite, percent unemployed t percent
with low education r and population. The negative Beta
value for south indicates that less auto thefts occur in
that region even after controlling for the other variables
in the equation.
Burglary is also negatively related to its 'I .04
clearance rate although the value of Beta is weak and the
relationship between the burgl.ary clearance rate and per

.~---- --- ---~----
capita patrol was negligible. Thus while there is SOffie
evidence of a deterrent effect, a conclusion that police
patrol has a deterrent effect on burglary is not
warranted. It is also clear that percent unemployed and
percen't nonwhite are far more important factors in the
burglary equation than the clearance rate.
Rape fits the deterrence hypothesis, but again
showing a weak negative Beta value. Its clearance rate
was also found to be a positive function of patrol, thus
providing a marginal but consistent fit at the two key
deterrence junctures in the model. It is apparent that
percent nonwhite is the most important determinant of
rape, followed by percent unemployed. Population also
shows a modest positive relation while the percent with
low education has a moderate negative value.
Based on the Geerken-Gove theme it was predicted
that assault and murder would be unrelated (or positively
related) to'their clearance rates. This prediction is
substantiated in the murder equation by the negligible
negative Beta (-.02). However, the Beta value for
assault is a low negative. In both cases clearance rates
are negatively related to patrol. Thus while there is
some evidence of deterrence in the case of assault, it
cannot be at·t.ributed to patrol. For both assault and" "
murder the percent of the population that is nonwhite is
clearly the most important var~able. -The second ranking
99

~ i I
100
variable of importance in both equations is the regional
variable south.
Summary
The analysis of Sample A was presented in this
chapter. Per capita police was generally found to be a
function of rates of crime. This was particularly true
for the offenses of murder, rape, robbery, and auto theft,
all of which caused more variation in per capita police
than did the amount of city revenue collected. This is
an important finding since many previous studies have not
considered the simultaneous nature of the relationship
between crime and the police. It supports the argument
presented in postulating the model that high crime rates
generate citizen demand for more police. It is also
important to note that it is violent crimes which have the
gl':'eatest impact on this demand wi't.h the major exception of
auto theft. '
Per capita police patrol was found to be a
positiv~ function of per capita police and a negative
function of the proportion of patrol units with two
officers. This finding was expected but the results of
the clearance equations generally did not coincide with
the predictions the model supports. Although the clearance • ,<
rates of burglary, ~uto theft, rape, and both measures of
larceny were positively relate~ to per capita patrol, the

, ,1
I low Beta values indicate that patrol is not a very
important determinant of clearance rates.
Modest support was found for the overload
hypothesis in the cases of larceny under $50, robbery,
rape, and auto theft. Some support was found for the
deterrence hypothesis with both types of larceny, auto
theft, burgla~" rape, and assault. It was also found
that robbery is a negative function of the robbery
clearance rate, although this was suppressed in the
initial analysis due to a spurious correlation between
the percent of the population nonwhite and 'the clearance
variable in that equation. While these findings may
support some version of a deterrence theory, only in the
101
cases of rape, auto theft, and larceny under $50 did the
data f1t both of the crucial deterrence paths in the model.
It was pointed out however, that certainty of apprehension
must be a positive function of patrol if the deterrent
effects identified are a product of police presence. In
conclusion then, the analysis of Sample A substantiates
a deterrent effect of police presence only for the
offenses of rape, auto theft, and larceny under $50.

CHAPTER VI
ANALYSIS OF SAMPLE B
The results of the analysis of Sample Bare
presented in the format followed in the preceding
chapter. The equations should be interpreted in the
same manner since they are similar, but estimated with
different data. This analysis uses a subsample of the
total population of the study. It serves the function of
testing the model with a population that is distinct from
the total population in several ways; the cities in this
sample are all large, have above average crime r~tes,
greater revenue, greater police resources per capita, and
are characterized by more of the social conditions that
ecological research has traditionally found to be
associated with crime. Secondly, the analysis of Sample B
serves as a-check on the validity of the official measures
of crime (the Uniform Crime Reports) since it includes the
victimization survey measures. Finally, this sample
facilitates the expansion of the model to include a measure
of the perception of police presence.
A correlation matrix of all the variables in
Sample B is presented in Table 14. As in the analysi q , "
of Sample A, the original values of the variables were
utilized in calculating the matrix.
102

~ABLE 14 SIMPLE CORRELATIONS FOR ALL VARIABLES EMPLOYED IN XHE ANALYSIS OF SAMPLE B
1 1 -.64 3 .49 -.24 4 .'5 .44 .18 5 -.25 .39 -.08 -.31)
6 .25 -.34 .20 .91 -.19 1 .24 -.18 .09 .19 .08 -.02 8 -.25 .56 -.02 -.34 .13 -.21 -.lli 9 .20 .09 .61 .28 .22 .34 .~ .12
10 -.'9 .85 -.10 -.42 .63 -.29 -.24 .61 .13 11 ·.21 .10 -.01-.30 -.13 -.38 .63 -.41 .DB -.M 12 .12 .21 .02 .01 .60 .10 -.21 .n .DB .46·" 13 -.05 .09 -.12 -.09 .50 -.19 .75 .11 .2' .16 .33 .15 14 -.21 .29 .39 -.10 .02 .01 -.15 .30 .46 .35 .06 ·.01 -.24 15 ·.115 .43 .18 '.10 .48 .06 ·.31 .63 .• 1 .65 -.51 .61 -.03 .63 16 •. 61 .38 •. 14 ·.08 .28 .11 .01 .14 .39 .34 .29 -.17 .15 .51 .21 11 .56 ·.01 .65 .21 -.02 .04 .16 .12 .38 .06 ·.26 .31 .15 -.08 .23 -.51 18 •. 45 .43 ·.31 -.12 .23 •. 0' '.3' _33 -.20 •• 1-.32 .34 .11 -.13 .20 .05 -.10 19 .55 -.31 .11 .04 .06 -.19 .44 _.00 -.10 -.23 -.01 .12 .32 -.29 -.04 -.58 .SO ·.17 2D -.36 .55 -.2\ ·.33 ,1\ -.29 '.02 .29 -.06 .62 .24 -.02 .08 .33 .30 .31 .OS .15 -.15 21 -.64 .25 -,22 -.04 .18 .25 .02 .1 •• 36 .25 .18 -.13 .14 .44 .19 .88 -.55 .13 -.59 .14 22 .42 -.30 -.08 .40 -.06 .23 .31 .00 .20 -.20 -.18 .18 .34 -.09 .DB '.09 .36 -.18 .33 '.11-.06 23 -.35 .61 -.02 -.33 ,31 -.25 -.17 ,'1 ·,05 .74 ,01 ,31 .13 .05 ,29 .02 .19 .59·.OS .56 ,,04 -.17 14 -,32 .13 .1' ,02 ·.13 .11 .20 _.06 .43 .0\ .26 -.26 .19 .62 ,2' .64 -.2' -.09 -.41 .15 .64 .0\ -.2' 25 .30 ·.\4 ,49 .18 '.16 _.01 .87 -.\8 .52 -.20 .39 -.06 .59 -.02 ,,04 ,01 .23 -.38 .45 ·.07 .05 .41 -.28 -.32 26 -.U ,51 -.41 -,39 •• 9 •. 31 -.33 ,56 -.10 ,58 -.15 .39 .09 -.13 .11 .20 -.24 .33 -,21 .14 .2' -.It .24 ·.25 -.31 27 • ,14 .12 ,59 .14 .11 .20 •• 8 .15 .98 .16 ,10 .11 .33 .41 ,40 .30 .43 '.18 .01 '.05 ,18 .21-,OJ .34 ,62·.15 28 .62 -.34 .20 .15 -,01 .10 -,26 .07.,18 -.10 -.43 ,28 ',24 -.28 .Q2 -,63 .31 '.24 .20 -.19 ,,63 .3G .00 -.54 -.311 .01·,14 29 ,06 ,09 .15 '.23 .41 -.12 ·.39 .48 -.12 ." -.31 .52 -.to -.16 .18 -.20 .18 .22 .04 .OJ '19 ·.04 .58 -.54 ·,39 .30 -.\3 .58 30 -.13',12 .01 .04 ·.12 ,,04 .21 -,23 .13 ·.21 .21.,27 .00 .17 ·.06 .07 -.OS .01 .09 .OJ .00 •• 10 ·.21 .11 .34 ·.43 _IS ·.51-.40 31 .52 ·.33 .13 ·,01 -,04 ·.09 -,DB •. 05 -.14 -.33 -.09 -.0. '.22 -.2fi -.11 •. 38 .17 -.55 ,20 ·,2' •• 42 .30 ·.n -.b2 -.11 ,01·.13 .75 .29 •• 28 32 ,02 •. OJ _.15 ·.16-.09 -.\4 .20 •• 20 '.22-.18 .40 -,24 .14 -.46 -.40 .14 -.33 -.21 -.12 -II .09 -.04 ·,07 .10 .04 ·.09 -,15 .02 .09 -,IS .13 33 ,32 -,56 .01 .48 -.11 .44 .00 •• 62 -.03 -.65 .05 •• 45 -.16 .\3 -.32 -,07 -.00 -.'3 -.07-.1' -.00 .30 -.42 .3\ .06 ·.57-.09 .18 -,4\ _.O! .11 '.06 34 .63 -.41 .18 .13 -.21 .15 -.21 -,02 -,26 -,39 -,36 .20 -.3U -.4\ -.\0 _.54 .11 -,33 .22 -.44 -.51 ,tI!I-.15 -.42 -.11 -.14 -.n JoG .33 _,19 .67 .34 .17 35 .58 ·.It .5\ .01 ·,01 -.14 .09 _10 .13 ·.OS -.19 .11 .\3 -.011 .15 -.63 .114 -,08 .32.,03 ·.58 .:16 29 ·.31 .0:0 - 09 ,30 .62 ,40 -.1~ .38 -,0:. -.10 .20 36 -.14 -.09 -.06 ·.01 ·.10 -.03 .33 -.28 .16 -.13 .48 -.36 .n .3~ -04 .28 -,34 -.19 -,07 .Il'J .38 ·,04 _.00 .~I .3~ -.34 .14 •. :tIl -,31 .19 -.23 ,21 ,62 ·.19 -.:tII 31 .26 -.\9 .07 .25 -.29 .14 -.41 -.13 -.13 -.25 -.33 .05 •. 63 .,15 -,1\-.31 ·.72 -08 •. 00 '.49 -,26-(111-17 "2 •. 111-II!>..tJ 34 1/ 013 .3\ • .\1I 13,~ -IN ·11 311 -.OS.11 .3\-.30 .OJ-.4~ ,nl .18.06 .14 \4 •• tll ,11.20 .14 •. 17 .49 .14.40 .20·.J!i UI .:111-,14-(\01.10 I~I 111 14 ;t.~ 1l4·4~'211·JI .4\·:/·3U 39 ,00 ,-,15 -.03 ,23 ,00 .JI o,Ot ,OIl .12 .10 •. 13 ,24 .14 .on 11 ,00 .00 .on -.21 Oil .?t.. III ~ 0'1 ,:H ·tli OJ 11 ,II,· !'iI, ;'11' iii Uti ~I III t~l ~.t1 l~ .,;\\1
103
40 -.19 .326.18·21~.08,,'1 04·,11-,06 .18 .lG~,2:' .0fi·7'l·?O .40-.70 IG·.17 ,:11. ,11·10 u!t 1I·O!J III .. t)lj·:''( 1:1 JU·11 l~~'~I.1U '4 IKI·'U~tJ.4·'11 41 ,!I-.1i'J .05-.12 •. 06.09-39 .11-29-.13·3~ ,71-19'11 .I11l-.2Y-D3-22 ,04 •. OO-35·.12-JG.24.11 111-1') ?li...'.1 11~.:l\i .1'-"'.Ji.:.Il'.I' " •. I~.OI NI
ROnBERY 1 CLF.:An 0 CIITOTI.An 10 HAPr: UU PATHOll ilS» cna'.'u no eLROB a VClUM}~ 9 \lT1Uil"T 16 CI.\\A\'il 1&3 pF.neJ",\' tUl NOUTll t\'l TVROB 3 CLVCIIlMIl 10 MUIIDHII 17 vnAPtl 84 OITYlltlV 31 Bourn 50 AT 4 LARCENl! 11 C1.MUIIDilR 18 nUII<II.ARY aD SAI.AIIY 32 NO DO CLAT 8 CLLAIIC 12 ASSAULT 19 CLIIUIIO aD TWOOOP DII I'IlIlM .n VAT 6 LAROENYI 1~ CLA.SLT aD TVDUIIQ 87 DIlNSlrr 34 ,O'U U ORIMI! ," OLIIA!lI 14 VAIIL:': 11 POLI(l1il Ie 1I11J1NW II
Police
Table 15 gives the results of the police equation
for the various crime types. City revenue is the most
important variable affecting per capita police, showing
a positive relation. 'rhe number of police also increases
in response to increased rates of murder, robbery as
measured officially or by survey, and auto theft as
measured either way. The official and survey data ar~· ~
inconsistent with regard to the impact of assault, rape,
and burg,lary on per capita police. Note however, that in
the cases of robbery and auto theft the official measures

e.
"
104
The findings of this analysis, like 'those of
Sample A, contradict Swimmer's (1974ai 1974b) conclusion
that demand for police is a result of rates of property
crime and not of violen~ crime. The crimes which generate
the greatest demand for more police appear to be murder,
rape, robbery, and auto theft. All measu.res of larceny
are negatively related to per capita police. As for other
variables in the equation, salary has a slight: negative
effect on the ratio of sworn police personnel to citizens
while that ratio is somewhat larger in the nc:,rtheast even
after controlling for salary and city revenu.e.
Police Presence
The most important variable affecting police " I ,"
presence is the proportion of patrol units, consisting of
two officers.. For every unit increase in the proportion
of patrol units with two police officers, there is a

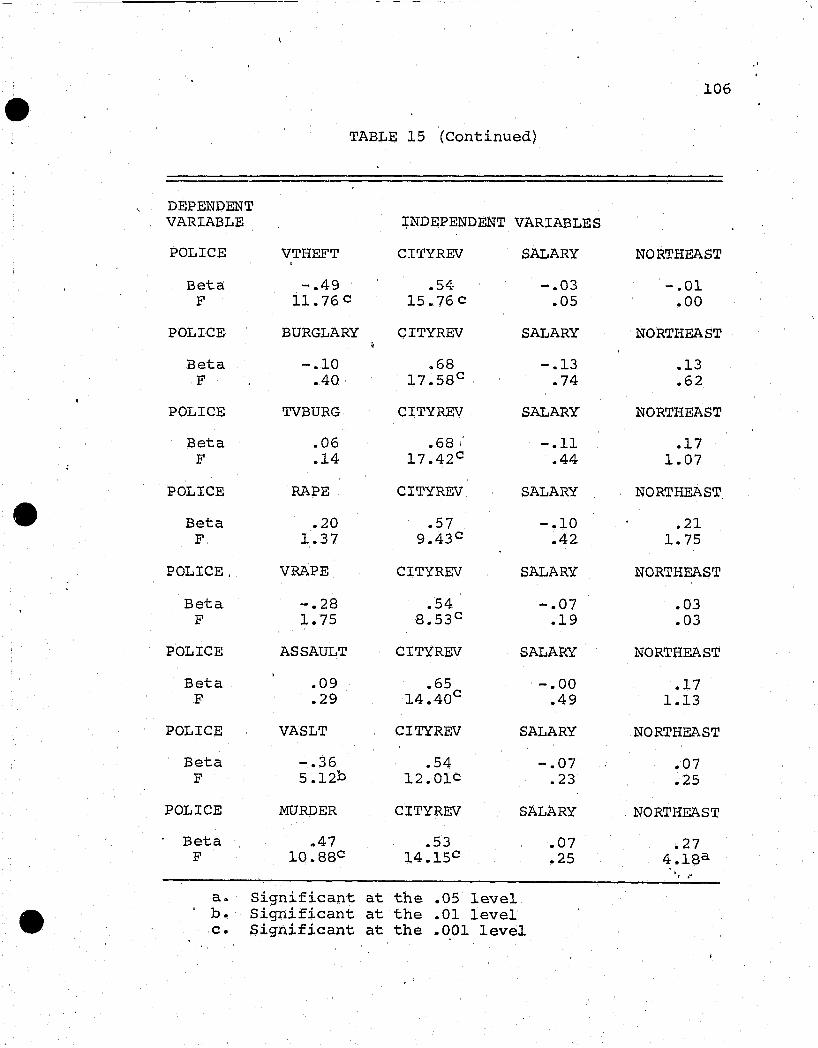
"
106
TABLE 15 (Continued)
<', DEPENDENT VARIABLE INDEPENDENT VARIABLES
POLICE VTHEFT CI'IIYREV SALARY NORTHEAST ,
Beta -.49 .54 -.03 -.01 F 11.76 c 15.76 c .05 .00
POLICE BURGLARY CITYREV SALARY NORTHEAST
Beta -.10 .. 68 -.13 .13 F .40 :p .58c .74 .62
POLICE TVBURG CITYREV SALARY NORTHEAST
Beta .06 .68 .- -.11 .17 F e14 17.42 c .44 1.07
POLICE RAPE CITYREV SALARY NORTHEAST
e Beta .20 .57 -.10 .21 F 1.37 9.43 c .42 1.75
POLICE. VRAPE CITYREV SALARY NORTHEAST
Beta -.28 .54 -.07 .03 F 1.75 8.53 c .19 .03
POLICE ASSAULT CITYREV SALARY NORTHEAST
Beta .09 .65 -.00 .17 F .29 14.40c .49 1.13
POLICE VASLT CITYREV SALARY NORTHEAST
Beta -.36 .54 -.07 .07 F 5.12b 12.01c .23 .25
POLICE MURDER CITYREV SALARY NORTHEAST
Beta .. 47 .53 .07 .27 F 10.88c 14.15c .25 4.18a .
I ,"
a. Significant at the .05 level b. Significant at the .01 level c. Significant at the .001 level

e
.51 unit decrease in per capi~a patrol units. As the
model hypothesizes, patrol is positively related to
police per capita with a Beta value of .42. Popu.lation
density has a slight positive relation to patrol. These
relationships. are shown in Table 16.
TABLE 16
ESTIMATED VALUES FOR THE PATROL EQUATION
DEPENDENT VARIABLE INDEPENDENT VARIABLES
PATROL POLICE TWOCOP DENSITY
Bet.a .42 -.51 .10 F 2.71 8.60c .17
a. Significant at the .05 level b. Significant at the .01 level c. Significant at the .001 level
Perception of Police Presenc(~
Table 17 shows that the regional vaLriable south
107
has the greatest impact on perception of police pr~sence.
Southerners more frequently responded that more police
are needed than did non-southerners. The percent of
nonwhite residents consistently appears as the variable
in the equation with the next largest Beta value. The . "
negative sign indicates that as the percent of nonwhite
residents increases, the proportion who perceive a n2ed
for more police declines. The direction of the Beta for .

• \
"
108
the patrol variable in the equation is negative as the
model postulates, but with low values. The weakness of
these Beta values relative to the exogenous variables of
percent nonwhite and south raises some question about the
validity of the perception variable. It should be viewed
with caution since it may reflect the attitudes of
various sub-populations toward the police more than their
perceptions of police presence. Thus, southern' residents
might respond high on perception of police presence even
in cities where per capita police patrol is very high.
Likewise, nonwhite citizens might score low on the
perception variable even if residing where per capita
police patrol is low. In sum, the indicator appears to
be a relatively weak measure of perception of police
presence due to confounding with other variables.
The various categories of clearance rates have no
consistent effect on perception. This variable was
included in' the model since it is logically defensible,
but it is not surprising that it does riot fit empirically.
It suggests that citizens in general do not have accurate
perceptions of the objective certainty of punishment.
Population density is also shown to be unimportant to the
perception of police presence.
" .. '" Certainty of Apprehension
The most consistent finding in the clearance
equations is that clearance rates are positively related
"


"
"
110
TABLE 17 (Continued)
DEPENDENT VARIABLE' INDEPENDENT VARIABLES
PERCEP PA:r'ROL CLRAPE PEF.l'·j'W SOUTH DENSITY
Beta -.24 .06 -.32 .53 .08 F .40 .03 1.62 4.39b .05
PERCEP PATROL CLASLT PERNW SOUTH DENSITY
Beta -.20 -.00 -.32 .54 .17 F .49 .00 1.57 4.49b .02
PERCEP PATROL CIJMURDER PERNW SOUTH DENSITY
Beta -.17 -.04 -.33 . .53 .01 F .26 .02 1.53 5.03b .00
a. Significant at the .05 level b. Significant at the .01 level c. Significant at the .001 level
to per capita sworn police personnel. The positive
relation between patrol and clearance rates is an important
finding since it provides a fundamental link in the model.
Without demonstrating such a linkage between police
presence (patrol) and certainty of apprehension (clearance
rates), any deterrent effect that might be signified by a
negative relationship between crime and clearance rates
could not be attributed to police presence. The fact that
there are substantial negative Beta values for the
variable of crimes per patrol unit lends further support
to the value of patrol operations -in ~chieving clearances. '.

111
Thus support for this crucial portion of the model is
quite strong, in contrast to the findings wi.th Sample A.
Although a finding of no relationship would not
be surprising, the consistent strong negative relationship
between per capita police and clearance rates is. The
model proposed a positive relationship since it is logical
to test the hypothesis that police assigned to functions
other than patrol have a deterrent effect, although there
is limited theoretical and empirical support for such a
proposition. Reasons for the strong negative relation can
only be speculated. However, the fact that opposite
findings result, depending on whether the police or the
patrol variable is used reinforces 'the caution extended
in ,the literature review that numbers of police is an
inadequate measure for operationalizing police presence.
Clearance rates are generally seen not to be a
function of crime rates~ That is, the data do not support
the overload hypothesis postulated in the model. Notable c'
exceptions are for larceny over $50 as measured by the
Uniform Crime Reports and larceny as measured by the
victimization surveys. Since larceny is probably
perceived as the least serious of the offenses being
analyzed, it would seem logically consistent that the
police would not reallocate resources to maintain a g~~~n
clearance rate as the quantity of larcenies increase.
.'

r • !
I I I I
e
112
Table 18 presents the estimated values for the clearance
equations.
TABLE 18
ESTIMATED VALUES FOR THE CLEARANCE EQUATIONS
DEPENDENT VARIABLE INDEPENDENT VARIABLES
CLEAR CRIME PATROL POLICE CRPPU NC
Beta -.11 .63 . -.41 -.23 .32 F .28 6.22b 3.04a .92 2.18
CLVCRlME VCRIME PATROL POLICE CRPPU NC
Beta .34 .52 -.79 -.37 .32 F 4.04a 5.28b 13.82c 3.24a 3.33a
CLROB ROBBERY PATROL POLICE CRPPU . NC
Beta -.15 .32 -.66 -.26 .24 F .21 2.09 2.63 1.16 1.20
CLROB TVROB PATROL POLICE CRPPU NC
Beta .08 .38 -.84 -.32 .28 F .11 2.14 9.60° 1.89 1.92
CLAT AT PATROL POLICE CRPPU NC
Beta -.16 .66 -.64 -.13 .38 F .53 6.05b 5.53b .36 3.87a
CLAT VAT PATROL POLICE CRPPU NC
Beta -.16 .65 -.67 -.14 .41 F .55 5.82b 7.16c .45 4.2gb
CLLARC LARCENY PATROL POLICE CRPPU NC
Beta -.73 .65 -.41 .19 ". ]..4 F 13.34c 11.44c 4.85 b .79 .69

---------
113
TABLE 18 (Continued)
DEPENDENT VARIABLE INDEPENDENT VARIABLES
CLLAR2 LARCENY2 PATROL POLICE CRPPU NC
Beta -.17 .01 -.27 .27 .10 F .46 .00 .74 .96 .16
CLTOTLAR VTHEFT ,PATROL POLICE CRPPU NC
Beta -.55 .26 -.67 -.07 .27 F 3.00 a .79 4.12 a .08 1.43
CLBURG BURGLARY PATROL POLICE CRPPU NC
Beta -.01 .35 -.57b
, -.52 .45 F .00 1.85 5.44 3.67 a 4.19 a
CLBURG TVBURG PATROL POLICE CRPPU NC
Beta .18 .28 -.55b
- .58 .43 F .90 1.17 5.30 6.49b 4.55 b
CLRAPE' RAPE PATROL POLICE CRPPU NC
Beta -.01 .72b
-.47 .09 .11 F .00 5.30 1.78 .14 .21
CLRAPE VRAPE PATROL POLICE CRPPU NC
Beta .51 .97b
-.36 -.10 .05 F .74 6.21 1.52 .10 .04
CLASLT ASSAULT PATROL POLICE CRPPU NC
Beta .15 -.12 -.42 -.19 .20 F .33 16 2.03 .51 .58
CLASLT VASLT PATROL POLICE CRPPU NC
Beta -.34 -.13 -.58 -.14 .24 F 1.09 .19 2.89a .29 .89 . ,"

-----------~ -- ---
"
'.,
DEPENDENT VARIABLES
CLMURDER MURDER
114
TABLE lS (Continued)
INDEPENDENT VARIABLES
PATROL POLICE CRPPU . NC
Beta F
.14
.44 .51
4.55b -.87
13.00c -.35 2.77a
.40 4.5Sb
a. Significant at the .05 level ba .Significant at the .01 level c. Significant at the .001 level
Crime
The results of the crime equations are displayed
in Table 19. When all index crimes are combined-there is
slight support for the deterrence paths representing both
the objective and perceived certainty of punishment (or
apprehension). However, when the victimization measures
of crime are used the relationship between crime and .
clearance rates reverses direction and the relationship
between perception of police presence and crime virtually
disappears. No conclusions beyond the need for a crime-
specific analysis can be drawn from this.
The robbery clearance rate is strongly and
negatively related to robbery as measured by the Uniform
Crime Reports. Using the robbery victimization data the
estimated Beta is in the same direction but is a
negligible value. The perception varJ.able is also in the

115
predicted direction for the victimization robbery
equation, but has a slight negative value for the equation
employing the Uniform Crime Report data. Given that the
linkage between patrol and robbery clearance rates was
supported by 'the clearance equations, it can be concluded
that the analysis of Sample B generally provides support
for the major deterrence paths in the model. However,
much stronger support is found where the official crime
measure is used and where the objective rather than the
perceived measure of certainty of punishment is used. As
for other variables in the robbery equations, the percent
nonwhite has a strong positive impact whether robbery is
measured officially or by survey. Estimates of ·the Beta
values for other variables in the equation are
inconsistent.
Auto theft, whether measured officially or by
survey, is negatively related to auto theft clearance ,
rates. The auto theft clearance rate in turn was seen to
be a positive function of per capita patrol units. The
Beta values for the perception variable are opposite of
the model's prediction. However, this is due to the
validity problem of the perception variable. Since
perception has a high positive correlation with the
regional variable south (.32) which is negatively re~ated
to auto theft as measured in the Uniform Crime Reports
(-.35) and as measur.ed in the,victimization surveys {-.44},
.'

116
a spurious negative relationship between perception a.nd
auto theft results.
The results of the auto theft equations are highly
consistent between the official and unofficial measures.
The exogenous variables of percent nonwhite, percent male,
and population are all negatively related to auto theft in
both cases. Thus the crime of auto theft does not appear
to be a product of the variables traditionally identified
in ecological research.
All of the measures of larceny employed are a
negative function of their clearance rates. However, only
the Beta for the officially measured larceny of $50 or
greater is substantial. The perception measure is in the
direction predicted by the model in two of the three
equations, but with little magnitude. In the equation for
all larcenies as measured by the victimization surveys it
has a negligible value. Again, it should be recalled that
all of the larceny clearance rates were a positive function
of patrol with the greatest impact being on larcenies of
$50 or greater. Thus with the officially measured larceny
of $50 or greater~ the paths representing the objective
certainty of punishment fit very well. However, the Beta
values are too weak to support that conclusion for the
perceptual measure of certainty of punishment or for ·the .. " other measures of larceny. The findings with the
perception variable may be due, to its-weakness. The

findings with the other larceny indicators however,
suggests that only the theft of more valuable items may
be deterrable.
117
The other vat"iables in the equation show all types
of larceny to be a negative function of population and
positively related to the percent male. The official and
unofficial measures disagree as to the effect of the
percent of the population nonwhite on larceny. Both
official 'measures indicate that it is a.low positive
relationship while the unofficial measure reveals a
strong negative relation.
The clearance rate for burglary has only a modest
negative relation to the reported rate of burglary while
its relation as measured in the victimization surveys is
positive. The perception variable does have positive but
weak Beta values, consistent with the predictions of the
model. However, considering the weakness and inconsistency
of the Beta 'values little support for the deterrence
hypot'he~is is evident. Other variables in the equation
show that burglary is a positive function of the percent
nom.;hite and a negative function of population.
'rhe rate of rape is a negative function of the
clearance rate for rape whether measured officially or by
survey. It is also a positive function of the percept,i$m
of police presence in both equations as the model predicts.
Therefore, since the clearance, rate for rape was a positive

118
function of patrol, the model fits the crime of rape very
consistently. The only inconsistency observed in the
analysis of rape is that the official rate has a strong
positive relation to the percent nonwhite, while it is
actually a slight negative relation when the victimi-.
zation measure is used.
Entirely different results are obtained with the
assault equation depending on which measures are used.
The Beta 'values are strongly in the direction predicted
by the model when the official measure is used but in the
opposite direction when the survey measure is used. All
of the exogenous variables result in Beta values in
opposite directions as well. These opposing finqings
could be due to an actual underlying di£ference in the
fit of ·the two variables to the model since they are
somewhat different variables. The official measure
includes only aggravated assaults, while the unofficial
measure is for all assaults. On the other hand, the
differences could reflect a validity problem with the
official data.
The most important variable in the murder equation
is clearly the percent nonwhite. As predicted on the basis
of the Geerken and Gove (1977) thesis, the clearance rate
for murder is not negatively related to the rate of " .. ""
murder. To the contrary, the perception variable is
positively related to the murder rate. However, this is
/ I
l
/.

".
119
misleading due to the confounding variable south. The
relationship is a result of the strong positive
correlation between perception and south (.32) and
between murder and south (.49).
TABLE 19
ESTIMATED VALUES FOR THE CRIME EQUATIONS
DEPENDEN'l;' VARIABLE INDEPENDENT VARIABLES
CRIME CLEAR PERCEP PERNW PERM
Beta -.28 .24 .20 ~05 F 2.19 1.50 1.04 .07
VCRIME CLVCRIME PERCEP PERNW PERM
Beta .27 .02 .23 -.06 F 1.62 .01 1.12 .09
ROBBERY CLROB PERCEJ? PERNW PERM
Beta -.54 -.08 .47 .10 F 12.72c .32 11.23c .46
TV ROB CLROB PERCEP PERNW PERM . Beta -.06 .22 .57 -.06
F .08 1.25 8.49c .08
AT CLAT PERCEP PERNW PERM
Beta -.38 -.32 -.12 -.27 F 3.88a 2.59 .32 1.95
VAT CLAT PERCEP PERNW PERM
Beta -.32 -.37 -.29 -.26 F 2.76 a 3.26 a 1.98 1.71
POPU
-.31 2.73 a
POPU
-.23 1.25
POPU
.17 1.57
POPU
.09
.22
POPU
-.15 .59
POPU
-.13 .'45·

j 120 • TABLE 19 (Continued)
DEPENDENT VARIABLE INDEPENDENT VARIABLES
LARCENY CLLARC PERCEP PERNW PERM POPU
Beta -.56 .08 .04 .12 -.25 F 9.33 c .24 .04 .52 2.21
LARCENY2 CLLAR2 PERCEP PERNW PERM POPU
Beta -.13 .25 .21 .09 -.30 F .22 .88 .94 .16 2.01
VTHEFT CLTOTLAR PERCEP PERNW PERM POPU
Beta -.02 -.03 -.49 .33 -.33b F .01 .02 7.49 c 3.98 a 4.20
BURGLARY CLBURG PERCEP PERNW PERM POPU
Beta -.20 .14 .11 .02 -.20 F .69 .34 .23 .01 .95
TVBURG. CLBURG PERCEP PERNW PERM POPU
Beta .29 .20 .40 -.05 -.26 F 1.69 .76 3.36 a .07 1.81
RAPE CLRAPE PERCEP PEfu~ PERM POPU
Beta -.72 .12 .70 .00 -.37 F 11.48 c .42 11.49 c .00 4.16 b
VRAPE CLRAPE PERCEP PERNW PERM POPU
Beta -.28 .23 -.12 .14 -.36 F 1.16 1.09 .24 .46 2.66
ASSAULT CLASLT PERCEP PERNW PERM POPU
Beta -.43 .62 .58 .14 .04 F 2.78 a 7.04 c 8.33 c .38 .05 . "
VASLT CLASLT PERCEP PERNW PERM POPU
Beta, .39 -.45b
-.77 -.13 -.36 F 3.98 a 6.24 24.97 c .53 6.83 c

f • I
..
TABLE 19 (Continued)
DEPENDENT VARIABLE INDEPENDENT VARIABLES
MURDER
Beta F
Cl,,MURDER
.11
.97
PERCEP
.23 4.25b
PERNW
.92 65.06c
a. Significant at the .05 level b •. Significant at the .01 level c. Significant at the .001 level
Summary
PERM
-.07 .35
POPU
.07
.36
121
This chapter presented the findings resulting from
the analysis of Sample B. It showed per capita police to
be a positive function of murder, rape, robbery, and auto
theft. This is an important finding which is highly
consistent with those of the analysis of Sample A.
Per capita police patrol was found to be a
negative function of the proportion of patrol units with
two officers and a positive function of per capita police.
This coincides with the findings of Sample A as well, but
the Beta values were somewhat larger for Sample B.
Estimation of the perception equation suggested
that it may be confounded with the variables south and
percent nonwhite. This was substantiated later in the.-
analysis where a spurious relation was generated in the
auto theft· equation due to its negative correlation with
south and for the murder equation due to its positive
correlation with south.
An important finding is that clearance rates are
a strong positive function of per capita patrol, but a
negative function of per capita police when introduced
after the patrol variable. This supports the assertion
that numbers of police is an inadequate measure for
testing a model of the deterrent effect of police
presence~ It also provides support for.the crucial
hypothesis that police patrol (or visibility) leads to
higher clearance rates, which in turn are used as an
indicator of certainty of punishment in deterrence
research.
122
Support was found for the overload hypothesis only
for larceny as measured in the victimization surveys and
for larceny $50 and over as measured in the Uniform Crime
Reports. Evidence of a deterrent effect was found for the
offenses of-robbery, auto theft, larceny of $50 and over,
and rape. However, the findings with official and survey
data were consistent only in the cases of auto theft and
rape with stronger deterrent effects being found where
the official measures were used. Since the clearance rates
for all of these offenses were found to be a positive
function of per capita patrol, it can be concluded thqt,.
the analysis of Sample B provides at least partial support
for the deterrence portions of, the model in the cases of

robbery and larceny $50 and over. The support for the
model's deterrence paths was strong and consistent for
123
the offenses of auto theft and rape in all portions of the
analysis.
, CHAPTER VII
SU~ARY AND CONCLUSIONS
This 'research has derived a theoretical model of
the deterrent'effect of police presence from previous
sociological, econometric, and evaluation research.
Major features of the model are the simultaneous
relationship of crime and 'the police, the distinction
between objective and perceived certainty of punishment,
and the relationship between police presence and ·the
certainty of punis~~ent (perceived or objective).
The model ~las tested using cross-sectional data
with cities as the unit of analysis. It was necessary to
use two samples to test the entire model since the
victimization survey data, which included the perception
measure, were available only for a subsample. Since
there were some discrepancies in the findings with the
two samples, further comparisons of them are made in this
chapter.
Since the model is nonrecursive the data were
analyzed using two-stage-least-squares regression. The
only evident violation of the statistical assump'-.ions
necessary for this technique was the apparent systemat.'ic
error in the measurement of perception of police presence.
This generated spurious relationships' in at least two
124

cases and probably attenuated most other regression
coefficients for the perception variable.
Summary of Findings
125
Both samples showed that per capita police are a
positive function of city revenue. However, the important
theoretical finding of the police equation was that both
analyses showed the rates of murder, rape, robbery, and
auto theft to be very important variables. Rape had this
impact in both samples as measured officially, but not as
measured by survey in Sample B. However, rather than
suggesting that rape does not generate a demand for more
police, it may reflect a low public awareness of-the
actual rates of rape. Nettler (1974) has pointed out
that rape is grossly underreported in victimization
surveys relative to other crimes and this is supported
in the present sample by the extremely low correlation
between rape as measured officially and by survey (.01)
and the high correlations of the official and unofficial
measures of robbery (.69) and auto theft (.91). Citizens
might be cognizant of variations in the official rate of
rape but not aware of the much greater frequency of rape
as reflected in victimization surveys. Therefore,
variations in official rates of rape may be related to· ,.
demand for police while variations in the survey rate are
not, simply because the public. is not"aware of them.

--~--~~ --------------~
126
As was pointed out earlier, the police and patrol
equations can be viewed as theoretically distinct from
the deterrence equations (iee., crime, clearance, and
perception). Thus, the findings concerning the demand
for police may be important independent of their role in
the present model. The analyses of both samples support
a conclusion that it is crimes of violence which have
the greatest impact on demand for police. Auto' theft
is the only property crime that appears.to generate
demand for increased police protection. This could be
due to higher rates of reporting auto theft a.nd to greater
publicity accorded increases in that crime relative to
other property crimes.
Per capita patrol was found to be a negative
function of the proportion of patrol units with two
officers and a positive function of per capita police.
The analyses of both samples showed the two officer units
to be slightly mOl."e important. This indicates that the
deployment of one-officer rather than two-officer patrol
units could have an appreciable impact on those clearance
and crime rates for which police presence (pat'rol) was
found to have an influence.
Findings concerning the deterrent effect of
perceived certainty of police presence were inconc1us~~~
due to the apparent measurement error for the pe:r:ception
variable. The indicator ref1epted the perceptual biases

'"
of southerners and nonwhites more than the actual
perceptions of police presence. This systematic error
probably attenuated the regression coefficients in most ,
cases, but clearly generated spurious results in the
cases of auto, theft and murder which were highly corre-
lated with the regional variable south. Mut~h additional
research will clearly be needed to clarify the relation
ship between the perceived and objective certainties of
punishment. The perceptual portion of the present model
127
is useful conceptually and provides some informative data,
but was not sufficiently tested.
One of the major points on which the analyses 'of
Samples A and B differed was the effect of police patrol
on the various clearance rates. While Sample A revealed
weak positive relations for five categories of offense,
the analysis of Sample B showed very strong positive
relations for almost all offense categories. It was
pointed out'that this path represents a crucial
relationship in the model because police presence must
affect the certainty of punishment to support the theory
of a deterrent effect of police presence. It is
important to contrast these two samples to suggest
possible reasons for the discrepancies; this is done in
the next section. , , ,"
The clearance equations also differed for the two
analyses in the findings for tpe path, representing the

128
overload hypothesis. While both supported that hypothesis
for some measures of larceny, Sample A also revealed an
overload effect for robbery, rape, and auto theft. Again,
this emphasizes the need for comparison of the two
samples.
A final point regarding the clearance equations
is the overall weakness of other variables in the
equations. It is clear that there are unidentified
variables' which individual'ly or cumulatively have a major
impact on clearance rates. This points to a need for
research on the dynamics of clearance rates. If
researchers are to continue to use them as an indicator
of the obj ect:i.'ve certainty of punishment in studying
deterrence, it is clear that these other variables must
be iden'tified and included.
Several variables traditionally used in ecological
research were employed in the crime equations. The
percent unemployed and percent nonwhite were far more
important than the certainty of punishment in most cases.
Consistent with previous ecological analyses, crime was
positively related to the percent unemployed in all
cases and to the percent nonwhite in most. However, some
have argued that certainty of punishment can be
manipulated by government policies more readily than '. ,"
other social and economic factors (Wilson, 1975).
Viewed from this perspective, ~he relationship between

129
crime and certainty of punishment may take on more
importance than suggested by the empirical findings alone.
Due to the direct policy relevance of the deterrence
proposition, relatively weak relationships may be
sufficient for significant effects on crime.
The strongest conclusions for the deterrence
segment of the model can be d::;awn for the offenses of
auto theft and rape.. For these crimes a substantial
negative relationship was 'observed between the offenses
and their clearance rates in both samples and in Sample B,
whether measured officially or by survey. 'Moreover,
since a positive relationship between police presence
and these clearance rates was observed in all c~ses, it
can be concluded that the observed deterrent effects are
at least partially a result of police presence.
Some evidence of a deterrent effect was also
observed for the offenses of robbery, larceny, burglary,
and assault'. However, the findings with these crimes ar~
less conclusive. In Sample A the relationships between
patrol and the clearance rates were too weak to attribute
the deterrent effects to police presence~ In Sample B
the official and survey measures were inconsistent, with
the former showing stronger deterrent effects. In
addition, Sample B indicated that assault clearance '."
rates are not a function of police presence~ Thus, the
tit of assault to the model i~ the poorest of all
"-.,

130
offenses except murder. As expected, no deterrent effect
was observed for murder.
The fit of the model for all types of crime in
Sample A are summarized in path diagrams in Figures 3
through 11. Those paths which have Beta values less
than .10 are deleted from the diagrams, but the
remaining paths are not reestimated. These figures then,
serve the purpose of visually summarizing the most
important relationships in the model by.crime type.
Figures 12 through 27 summarize the findings with
Sample B by casting each crime type in a path diagram.
The same criteria for deletion are employed as were in
Sample A. The perception va~iable is omitted due to the
measurement error that was encountered in attempting to
measure it.
Sample Comparisons
Sample B was included in this research to obtain
a measure of the perception of police presence and
supplement the official measure of crime with the survey
measure. This sample of 26 cities is frequently used by
researchers for similar reasons. Caution is usually
extended due to the small N, which is particularly
problematic for regression analysis. However, anothe~ ~
serious problem that is typically not addressed is the
sample itself.

131
Figure 3
Path Diagram for CRIME with Sample A
TWOCOP CITYREV NORTHEAST
1-. 25
PATROL <:
.,\2 /20 .24 POLICE." .19 CRIME
CLEAR /' .41
PERUNE.-M PERNW PERLOED
Figure 4
Pa"th Diagram for ROBBERY with Sample A
TWOCOP CITYREV NORTHEAST
\28 \ .53
1-. 25
.24 PATROL \-(-------POLICE <. ~ ROBBERY
-.20 ~/26 J.l~·23 ~ PERNW POPU PERUNEM SOUTH
CLROB -.16
T -.10
NORTHCENTRAL
'I ....

132
Figure 5
Path Diagram for AT with Sample A
, TWOCOP CITYREV SALARY PERUNEM
1-. 25 ~) -.11
.24 '" PATROL ~ POLICE -c
CLAT PERNW
Figure 6
Path Diagram for LARCENY with Sample A
TWOCOP CITYREV NORTHEAST
1-25
.24
1.50
.22 PATROL ~ POLICE <
PERLOED PERUNEM SOUTH CLLARC
'i .....

133
Figure 7
Path Diagram "for LARCENY2 with Sample A
'.
TWOCOP CITYREV
1-62
.24 -.18 PATROL ~<------ POLICE <E(------- LARCENY2
1-025
10l~8 PERLOED PERUNEM SOUTH
CLLAR2
j-22 NORTHCENTRAL
Figure 8
Path Diagram for BURGLARY with Sample A
TWOCOP CITYREV
t025
.24
}49 .28
PATROL < POLICE ~ BURGLARY
y15 1-
32
1-38
CLBURG PERNW PERUNEM
ro18 . . "
CRPPU

134
Figure 9
Path Diagram for RAPE with Sample A
\ TWOCOP CITYREV NORTHEAST
1- 025 .24 /'
PATROL~ .POLICE ~ .48
~ .13
PERNW PERLOED
CLRAPE
Figure 10 .
. Path Diagram for ASSAULT with Sample A
TWOCOP CITYREV NORTHEAST
}025 .46
.24 .41 PATROL(; POLICE(
JTLT
.19
CLASLT PERNW PERUNEM SOUTH A\
/-014 \ ... '4
I{ORTHCENTRAL

- --- ---~~~~~-
135
Figure 11
Path Diagram for MURDER with Sample A
\ TWOCOP CITYREV NORTHEAST
1-.25
.24 1-:0
PATROL ~ POLICE (:
PERNW POPU SOUTH
Figure 12
Path Diagram for CRIME with Sample B .
TWOCOP DENSITY NORTHEAST CITYREV POLICE
(5/ 1"10 -.12 .42
PATROL ~ POLICE <
t· 41 -.11
CLEAR
/3~2 PERNW POPU
CRPPU NORTHCENTRAL " ,; ..
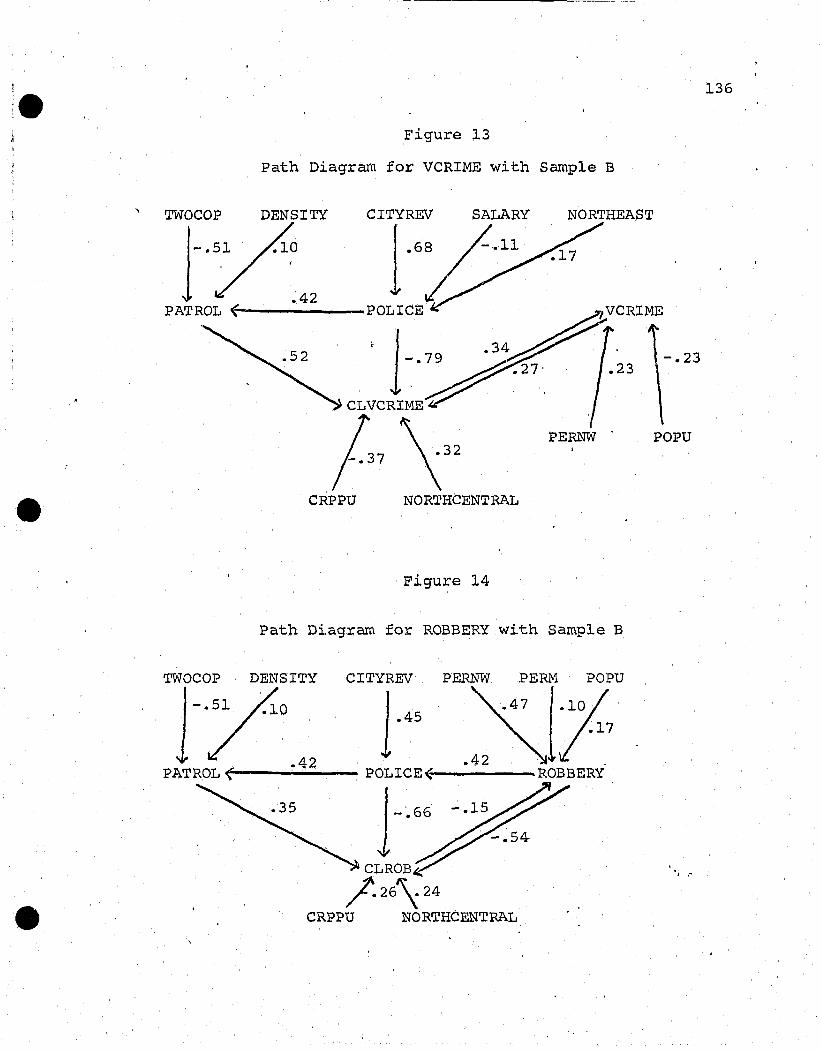
! 136 :e Figure 13
Path Diagram for VCRlME with Sample B
TWOCOP DENSITY NORTHEAST
1--0 .42
PATROL ~(-------POLICE /7VCRIME
· 1 .34 ' -.79 -.23 /_27'. .23
CLVCRlME
/37 \32 PERNW POPU
CRPPU NORTHCENTRAL
Figure 14
Path Diagram for ROBBERY with Sample B
TWOCOP DENSITY CITYREV PERNW PERM POPU
t-;/'o 1-45 _~i17 .42
PATROL ~<-------- POLICE<' ROBBERY
1-_66
CLROB
/26\24
. ,"
CRPPU NORTHCENTRAL

----------~---- --- --
\
, .
. ,
Figure 15
Path Diagram for TVROB with Sample B
TWOCOP' DENSITY
t/·1
.42
CITYREV
\.58
~
NORTHEAST PERNW
.35
1-57 PATROL ( - POLICE ~-------" TVROB
~ '1-. 84
. '~ ':> CLROB .
/3\.28 CRPPU NORTHCENTRAL
Figure 16
Path Diagram for AT with Sample B
TWOCOP DENSITY CITYREV PERNW PERM
1. 5/,0 ~ .42 .28
PATROL ~~------ POLICE~--------
1-.64
CLAT
113~38 CRPPU NO RTHC ENT PAL
137

138
Figure 17
Path Diagram for VAT with Sample B
TWOCOP DENSITY PE.RNW PERM POPU
-.51 L -.Jf / ---.42 ~lil3
.22 PATROL ~(------ POLICE ~------, VAT
~
'1-. 67 -~ ~ -.32
CLAT ~
f4\41 CRPPU NORTHCENTRAL
Figure 18 '
Path Diagram for LARCENY with Sample B
1WOCOP DENSITY CITYREV PERM POPU
1":1 .42 J70 -.43 \2/-.25 PATROL ~(---------------- POLICE~<--------LARCENY
1-.41
~ CLLARC ~
/19 \.14 CRPPU NORTHCENTRAL
I ,"

139
Figure 19
Path Diagram 'for LARCENY2 with Sample B
',.i.'WOCOP DENSITY CITYREV PERNW pOPU
t~· .42 PATROL (' POLICE
1-. 21/ /-.30 LARCENY2
, 1-.27
CRPPU NORTHCENTRAL
Figure 20
Path Diagram for VTHEFT with Sample B
TWOCOP DENSITY CITYREV . PERNW PERM POPU
1.54
-.49 '\}331-·33 POLICE ~(----- VTHEFT
l-·51 Za ,/ .10
.42 PATROL ~(---------------
1-.67
CLTOTLAR
T·27 \. . ...
NORTHCENTRAL

Figure 21
Path Diagram-for BURGLARY with Sample B
TWOCOP DENSITY CITYRE.V NORTHEAST
1-/,0 .42
PNl'ROL ~<------
-.57
CLBURG
/52 \.45 CRPPU NORTHCENTRAL
Figure 22
Path Diagram for TVBURG with Sample B
TWOCOP DENSITY CITYREV
t/'o .42
PATROL~(------------
CLBURG /-.58 '\ .43
CRPPU NORTHCENTRAL
140
PERNW
BURGLARY
. J-.20 POPU
TVBURG
'''i 0"

141
Figure 23
Path Diagram for RAPE with Sample B
TWOCOP" DENSITY CITYREV SALARY NORTHEAST PERl'M pOPU
1-051 ~o \57 1/0 \OJ_ 0 37 ~ 042 ~ 020
PATROL ~<------- POLICE (f-------,- RAPH
1-047
CLRA.PE
Tn NORTHCENTRAL
Figure 24
Path Diagram for VRAPE with Sample B
TWOCOP DENSITY CITYREV PERNW PERM POPU
to~ 1054 ,\1 i . 014 -036 .42 -.28
PATROL < POLICE < VRAPE
" 1-036
CLRAPE ~
[-010 . . ,"
CRPPU

142
Figure 25
Path Diagram for ASSAULT with Sample B
, TWOCOP DENSITY PERNW PERM
1-0 51 -10. ' /ol.U 042
PATROL t-(-------- POLICE ' \
581 . 014 ASSAULT
~012 ... 1-42 . ~CLASLT
CRPPU NORTHCENTRAL
Figure 26
Path Diagram for VASLT with Sample B
TWOCOP CITYREV PERNW' PERM POPU
"'77 \011036
J ____ -.;;.0.;;...36~ __ '_ ~ ,1 POLICE (.
042 VASLT
1- 058
CLASLT J.;:.
!1~024 ... "
CRPPU NORTHCENTRAL

,
Figure 27
Path Diagram for MURDER with Sample B
CITYREV NORTHEAST
PATROL ~<---------------
\3/7 .47
POLICE ~(--------------
1-87
CLMURDER
1·3~O CRPPU NORTHCENTRAL
143
PERNW
MURDER

144
TWo problems result from the analysis of this
purposive sample: the possibility of spurious relation
ships and difficulty in drawing generalizations. The
possibility of spurious relationships being found in
analyzing these data exists because the sample is
comprised of three distinct groups, each being identified
by specific chara,cteristics. When these characteristics
are included in ·the analysis, the resul'ts may he
misleading. The sample included eight cities from the
High Impact Crime Program which were characterized by
exceptionally high crime rates and the nations five
largest cities which generally had lower crime rates than
the cities specially selected for the High Impact Crime
Program. As a result# the crime equationl3 ~,n Sample B
revealed rnostly negative Beta values for the population
variable while they were mostly positive for the analysis
of Sampl,e A.
Three major differences were observed in the
findings of the analyses of Samples A and B. These
related to the effect of police patrol on clearance rates#
the effect of clearance rates on crime, and the effect of
crime on clearance rates. Unlike the findings with the
population variable, there is no clear explanation for
these discrepancies. While the differences may be an., ~
artifact resulting from the composition of Sample B, they
may also indicate true underlying differences. However,

"
e
due to the manner in which the cities were selected for
inclusion in this sample it is difficult to draw
gener~lizations or to make comparisons to Sample A.
Table 20 presents the mean valu'es of key vari ables
describing the samples in orde.r to compare and suggast
differences that might account for the variations in the
fit of the data.
Variable
POPU
TABLE 20
MEAN VALUES OF KEY VARIABLES DESCRIBING THE SAMPLES
Sample A
189,372
Sample B
1~167,396
145
PERLOED 4.9 6.3
PERUNEM 4.6 5.2
CITYREV )..83 323
DENSITY 5232 9487
PERNW 13 31
'I'WOCOP 19 37
POLICE 1.7 2.9
PATROL .36 .53
CRIME 6079 8366
MURDER 10 23
RAPE 24 54
ROBBERY 207 642
ASSAULT 209 392 .~, .. -
BURGLARY 1561 2183
LARCENY 1290 2084
LARCENY2 1968 1802
..

,
146
TABLE 20 (Continued)
Variable Sample A Sample B
AT 654 1185
CLMURDER 87 76
CLRAPE 56 54
CLROB 33 31
CLASLT 68 63
CLBURG 19 22
CLAT 19 17
CLLARC 12 11
CLLAR'2 19 26
Research Directions
, Several avenues for future deterrence research are
suggested by the results of this study. The need for a
crime-specific focus is clearly supported. The
predictions'developed in the research of Geerken and Gove
(1977) were largely supported for the relationship
between crime and certainty of punishment. 'However, when
the element of police presence was considered support for
that portion of the model was consistent only for the
crimes of auto theft and rape. This introduces an
additional complexity for the understanding of deterrence.
It suggests that even for those crime categories for
which a' negative relationship between' crime and certainty

e
of punishment (as reflected by clearance rates) is
consistently found, it is not necessarily a function of
~ police presence. Thus further study of the relationship
between police and clearance rates is needed. This is
particularly 'important becau~e of the inherent policy
implications. This research has indicated that it could
be fallacious to assume. that deterrence of some types of
crime could be expanded by increasing police presence.
147
A second major area requiring mtlch additional
research is citizen perceptions of police presence and
other indicators of certainty of punishment. While the
theoretical importance of this is clear, the measurement
problem is substantial. The need for more victimization
survey data is also apparent. The analysis of the
victimization sample indicated not only that it is
difficult to draw generalizations, but also that spurious
relationships can be generated in some cases.
Finally, the conclusions which this research
consistently supported should be subjected to
replications and reconceptualization. Deterrence is a
relatively new area of research which is continual.ly
growing more complex. This research has added to those
complexities by contradicting some previous theory and
research. It is clear that this interplay of theory 'and
research must continue for some time before patterns of
deterrence are understood.

\
----------------
REFERENCES
Amir,M. 1975. IIForcible Rape. 1I pp. 43-58 in L. G. Schultz, ed., Rape--Addresses, Essays, Lectures. Illinois: Charles C. Thomas.
Andenaes, J. 1966. liThe General Preventive Effects of Punishment. II University of Pennsylvania Law Review 114:949-83.
Anderson, L. S. 1978. "The Deterrent Effect of Criminal Sanctions: Reviewing the Evidence. 1I Paper presented at the annual meeting of the American Society of criminology, Dallas, Texas. .
Asher, H. B. 1976. Causal Modeling. Beverly Hills: Sage Publications.
Baily, W. C. 1976. IICertainty of Arrest and Crime Rate for Major Felonies: A Research Note. II Journal of Research in Crime and Delinquency 13:145-54.
Barnes, H. L., and N. Teeters. 1951. 2nd ed. New Horizons in Criminology. New Jersey: Prentice-Hall, Inc.
Beccaria, C. 1764. On Crimes and punishments. Translated by H. Paolucci, 1963. Indianapolis: Bobbs-Merrill.
Bentham, J. 1823. A Fragment on Government and An Introduction to the principles of Morals and Legislation. Wilfrid Harrison, ed. New York: Macmillan.
Black, D. 1970. "Production of Crime Rates. 1I American Sociological Review 35:733-48.
Blalock, H. M. 1969. Theory Construction. New .Jersey: prentice-Hall, Inc.
1972 •. Social Statistics. 2nd ed. New York: McGraw-Hill.
, ,<
Blumstein, A., J. Cohen, and D. Nagin, eds. 1978. ,Deterrence and Incapacitation: Estimating the Effects of Criminal Sanctions on Crime Rates. Washington,
. D. C.: National Academy of Sciences.
148

'.
149
BoyJ,e, R. P. 1970. "Path Analysis and Ordinal Data." American Journal of Sociology 75:461-80.
Brown, D. W. 1978.. "Arrest Rates and Crime Rates: When Does a Tipping Effect Occur?" Social Forces 57:671-81.
Budnick, F. S. 1973. "Crime-Correlated Areas: An Evaluation of the Impact of High Intensity Police Patrol Operations." Unpublished Ph.D. Dissertation, University of Maryland.
Bureau of the Census. 1972.. County and City Data Book. Washington, D. C.: U. S. Government printing Office.
Chaiken, J. M. 1978. "What is Known about Deterrent Effects of Police Activities." pp ... 109-35 in J. A. Cramer, ed., preventing Crime. Beverly Hills: Sage Publications.
_________ , M. W. Lawless, and K. A. Stevenson. 1974. The Impact of Police Activity on Crime: Robberies on the New York City Subway System. New York: New York City Rand Institute.
Chambliss, W. 1966. "Types of Deviance and the Effectiveness of Legal Sanctions." Wisconsin Law Review 67:703-19.
Chapman, J. 1976. "An Economic Model of Crime and Police: Some Empirical Results." Journal of Research in Crime and Delinguency 13:48-63.
Citizens Police Committee. 1931. Chicago Police Problems. Chicago: The University of Chicago Press.
critchley, T. A. 1972. and Wales. London:
A History of Police in England Constable.
Cumming, E., I. Cumming, and L. Edell. As Philosopher, Guide and Friend." 12:276-86.
1965 ... "Policeman Social Problems
Damaska, M. 1975. "Structures of Authority and Comparative Criminal Procedure." The Yale Law Journal 84:480-544.
, ," Davis, E. M., and L. Knowles. 1975. "An Evaluation of
,the Kansas City Preventive Patrol Exper:j.ment." The Police Chief (June) :22-7.

,
Decker, S. H. 1978. "Do the Police Make a Difference? An Analysis Using Victimization Data. II Paper presented at the annual meeting of the American Society of Criminology, Dallas, Texas.
150
Douthit, N. 1975. IIEnforcement and Nonenforcement Roles in Policing: A Historical Inquiry.1I Journal of Police Science and Administration 3:336-45.
Duncan, O. D. Examples. II
1966. IIPath Analysis: Sociological American Journal of Sociology 72:1-16.
Ferri, E. 1901. "The Positive School of Criminology." pp. 229-42 in S. E. Grupp, ed., The positive School of Criminology. Pittsburg: The University of Pittsburg Press.
Finckenauer, J. o. 1978. IICrime as a National Political Issue: 1964-76. 11 Crime and Delinquency 24:13-27.
Fineberg, S. C., A. J. Reiss~ and K. Larntz. 1976. IIRedesigning the Kansas City Preventive Patrol Experiment. II Evaluation 3:124-31.
Garofalo, J. 1977. Local Victim Surveys. New York: Criminal Justice Research Center.
Geerken. M., and W. R. Gove. 1977. IIDeterrence, Overload and Incapacitation: An Empirical Evaluation. 1I Social Force§, 56:424-27.
1975. "Deterrence: Some Theoretical Considerations." Law and Society (Spring):497-5l3.
Gibbs, J. P'. 1973. IIComments on the Papers in the Seminar. II pp. 112-16 in S. Rottenberg, ed., The Economics of Crime and Punishment. Washington, D. c.: American Enterprise Institute for Public Policy Research.
1975. Crime, Punishment and Deterrence. New York: Elsevier.
Gibbons, D. C. 1977. Careers. 3rd ed.
Society, Crime, and Criminal New Jersey: Prentice-Hall, Inc.
Goldstein, H. 1977. policing A Free Society. Cambr~4ge: Ballinger Publishing Co.
Greenwood, M. J., and W. J. Wadycki. 1973. IICrime Rates and Public Expenditures for Police Protection: Their Interaction." Review of Social Econom,X, 31:138-51.

'.
1,51
Heise, D. R. 1969. IIProblems in Path Analysis and Causal Inference." pp. 38-71 in E. F. Borgatta, ed., Sociological Methodology. San Francisco: Josey-Bass.
1975. Caus~l Analysis. New York: John Wiley and Sons, Inc.
Henshel, R. L. 1978. "Considerations on the Deterrence and System Capacity Models." criminology 16:35-45.
International City Management Association. 1972. The Municipal Year Book. Washington, D. c.: International City Management Association.
1973. The Municipal Year Book. Washington, D. C.: International City Management Association.
1974. The Municipal Year Book. Washington, D. C.: International City Management Association.
Jensen, G. F. 1969. "'Crime Doesn't Pay': Correlates of a Shared Misunderstanding." Social Problems 17:189-201.
Johnston, J. 1972~ Econometric Methogs. 2nd ed. New York: McGraw-Hill.
Kelling, G. L., and D. Pate. 1975. "The Davis-Knowles Critique of the Kansas City Preventive Patrol Experiment. II The Police Chief (June) :32-8.
Kelling, G. L., T. Pate, D. Dieckman, and C. 1974. The Kansas.City Preventive Patrol A Technical Report. Washington, D. C.: Foundation.
E. Brown. Experiment, Police
Kerlinger, F. N., and E. J. Pedhazur. Regression in Behavioral Research. Rinehart and Winston, Inc.
1973. Multiple New York: Holt,
Labovitz, S. 1970. "The Assignment of Numbers to Rank Order Categories." American Sociological Review 35:515-24.
Larson, R. C. 1972. Urban Police Patrol Analysis. Cambridge: Massachusettes Institute of Technology Press~
1975. "What Happened to Patrol Operations in Kansas City? A Review of the Kansas City Preventive Patrol. Experiment." Journal of Criminal Justice 3:267-97.

Larson, R. C. 1976. in Kansas City?1I
152
IIWhat Happened to Patrol Operations Evaluation 3:117-23.
Lejins, P. P. 1966. "Uniform Crime Reports." pp. 82-8 in S. Dinitz and W. C. Reckless, eds., Critical
" Issues in the study o,f Crime. Boston: Little, Br.own and Co.
1974. "The Systemic and the Composite Mod,els for Planning and Evaluation of the Criminal Justice System." l?P. 155-65 in R. Akers and E. Sagarin, eds., Crime Prevention and Social Control. New York: Praeger •
• . 1975. Criminal Justice in the united States: ~-~,---:-
1970-1975. College Park: The American Correctional Association.
Levine, J. P. 1976. zation Surveys.·1
"A Critique of Criminal victimiCriminology 14:307-30.
1978. "Reply to Singer." Criminology 16:103-07.
Logan, C. H~ 1975. "Arrest Rates and Deterrenc!=." Social Science Quarterly 56:376-89.
Lyman, J. L. 1964. "The Metropolitan Police Act of 1829." Journal of Criminal Law, Criminology, and Police Science 55:141-54.
Lyons, M. 1971. "Techniques for Using Ordinal Measures in Regression and Path Analysis." pp. 147-71 in H. Costner, ed., Sociological Methodology. San Francis€o: Jossey-Bass.
Manning, P. 1971. Police Wox'k~ The Social organization of Policing. Massachusetts: The l1assachusetts Institute of Te~hnology Press.
Martinson, R. 1974. "What Works? Questions and Answers about Prison Reform." The Public Interest 35:22-54.
McPheters, L., andW. Stronge. 1974. IILawEnforcement Expenditures and Urban Crime." National Tax Journal 27:633-43.
Minor, w. w. 1978. "Deterrence Research: Problems o't'" Theory and Method." pp. 21-45 in J .. A .. Cramer, ed., Preventing Crime. Beverly Hills: Sage 'Publications.

Morris, D., and L. Tweeten. 1971. liThe Cost of Controlling Crime: A study in Economies of City Life. II Annals of Regional Science 5:33-49.
Nagin, D. 1978.. "General Deterrence: A Review of the Empirical Evidence." pp. 95-139 in A. Blumstein, J. Cohen, and D. Nagin, eds., Deterrence and Incapacitation: Estimating the Effects of Criminal Sanctions on Crime Rates .. Washington, D. c.: National Academy of Sciences.
153
Nettler, G. 1974. Explaining Crime. New York: McGrawHill.
New York City Police Department. 1955. "Operation 25." pp. 206-14 in S. G. Chapman, ed., Police Patrol Readings (1964). Illinois: Charles C. Thomas.
Nie, N. H., C. H. Hull, J. G. Jenkins, K. Steinbrenner, and D. H. Bent. 1975. SPSS: Statistical ~ackage for the Social Sciences. N0w York: McGraw-Hill.
Nillsson, E .. K. 1972. "Systems Analysis Applied to Law Enforcement. II Allocation of Resources in the Chicago Police Department. Washington, D. C.: Law Enforcement Assistance Administration.
O'Connor, R. J., and B. Gilman. 1978. liThe Police Role in 'Deterring Crime." pp. 75-108 in J. A. Cramer, ed., Preventing Crime. Beverly Hills: Sage Publications.
Omnibus Crime Control and Safe Streets Act of 1968. June 1968. Public Law 90-351. 90th Congress. U. s. C.
Ponte:ll, H. 'N. Practice."
1978. "Deterrence: Theory versus Criminology 16:3-22.
President's Commission on Law Enforcement and Administration of Justice. 1967. Task Force Report: The Police. Washington, D. C.: U. S. Government printing Office.
Press, J. 1971. Some Effects of Increasing Police Manpower in the 20th Precinct in New York City. New York: New York Rand Institute.
Pogue, T. F. 1975. "Effect of Police Expenditures on, ," Crime Rates: Some Evidence." Public Finance Quarterly 3:14-44.
Richardson, J. F. 1974. Urban Police in the Unite£ States. New York: Kennikat Press.

154
Rowe, A. R., and C. R. Tittle. 1974. "Arrest and Crime: More on the Deterrence Problem." Paper presented at the annual meeting of the American Society of Criminology, Chicago, Illinois.
Savitz, L. D. 1958. "A Study of Capital Punishment." Journal of Criminal Law, Criminology, and Police Science 49:338-41.
1979. "Official Police Statistics and their Limitations." pp. 69-81 in L. Savitz and N. Johnston, eds., Crime in Society. New York: John Wiley and Sons, Inc.
Schnelle, J. F~, R. E. Kirchner, M. P. McNees, and J. M. Lawler. 1975. "Social Evaluation Research: The Evaluation of Two Police Patrolling strategies." Journal of Applied Behavior Analysis 8:353-65.
Schnelle, J. F., R. E. Kirchner, J. D. Casey, P. H. Uselton, and M. P. McNees. 1977. "Patrol Evaluation Research: A Multiple Baseline Analysis of Saturation Police Patrolling During Day and Night Hours." Journal of Applied Behavior Analysis 10:33-40.
Schuessler, K. F. 1952. "The Deterrent Influence of the Death Penalty." Annals of the American Academy of Political and Social Science 284:54-62.
Silberman, M. 1976. "Toward A Theory of Criminal Deterrence. II American Sociological Review 41:442-61.
Silver, A. 1967. "The Demand for Order in Civil Society: A Review of Some Themes in the History of Urban Crime, Police, 'and Riot." pp. 1-24 in D. J. Bordua, ed., The Police. New York: John Wiley and Sons, Inc.
Skogan, W. G. 1977. liThe 'Dark Figure' of Unreport.ed Crime." Crime and Delinquency 23:41-50.
Skolnick, J. H. 1975. Justice Without Trial. 2nq ed. New York: John Wiley and Sons, Inc.
Smith, B. 1940. Police Systems in the United States. New York: Harper and Brothers Publishers.
Swimmer, F. ; 1974a. "Measurement of the Effectiveness, " of Urban Law Enforcement--A Simultaneous Approach." Southern Economic Journal 40:618-30.
1974b. "The Relati9nship of Police and Crime." Criminology 12:293-314.

'.
Tittle, C .. R., and C. H .. Logan. 1973. "Sanctions and Deviance: Evidence and Remaining Questions." Law and Society Review 7:371-92.
Tittle, C. R., and A. R. Rowe. 1974. "Certaint.y of Arrest and Crime Rates: A Further Test of the Deterrence Hypothesis." Social Forces 52:455-62.
1973. "Moral Appeal, Sanction Threat, and Deviance: An Experimental Test." Social Problems 20:488-98.
155
Tullock, G. 1974. "Does Punishment Deter Crime?" Public Interest 36:103-11.
Uniform Crime Reports. 1971. Washington, D. C.: U. s. Government Printing Office.
1972. Washington, D. C.: U. S. Government Printing Office.
1973. Washington, D. C.: U. S. Government Printing Office.
Vollmer,A. 1936. The Police and Modern Society. Berkeley: The University of California Press.
Waldo, G. P., and T. ChiZ'icos. 1970. IlPunishment and Crime: An Examination of Some Empirical Evidence. l1
Social Problems 18:200-17.
1972. "Perceived Penal Sanctions and SelfReported Criminality: A Neglected Approach to Deterrence Research." Social Problems 19:522-40.
Webster, J. A. 1973. The Realities of Police Work. Iowa: Kendall/Hunt Publishing Co.
Wilson, J. Q. 1975. Thi.nk:i.}:.;,g About Crime. New York: Basic Books, Inc.
and B. Boland. 1978. "The Effect of the Police on Crime." Law and Society Review 12: 367-90 ..
Wilson, o. W., and R. C. McLaren. 1972. Administration. 3rd ed. New York: Inc.
Police McGraw-Hill,
, . " Woligang, M. E. 1958.
Reprinted in 1975. Patterns in criminal Homicide. New Jersey: Patterson Smith.

Wonnacott, R. J., and T. H. Wonnacott. 1970. Econometrics. New York: John Wiley and Sons, Inc.
156
Zimring, F. E. 1978. "Policy Experiments in General Deterrence: 1970-1975." pp. 140-173 in A. Blumstein, J. Cohen, and D. Nagin, eds., Deterrence and Incapacitation: Estimating the Effects of Criminal Sanctions on Crime Rates. Washington, D. c.: National Academy of Sciences.
Zimring, F. E., and G. J. Hawkins. 1973. Deterrence. Chicago: University of Chicago Press.
", . ,"

"
1
1
Top Related