


Languages
Pages
Legal

.
Expectations in a Time of Uncertainty
2011Southern California Lodging Forecast
Presented by:Bruce Baltin, Senior Vice President
Mark Van Stekelenburg, Vice PresidentBrandon Feighner, Associate
COLLIERS PKF CONSULTINGLos Angeles, CA
1. Macro Overview
2. 2011Southern California Lodging Forecast
3. Q & A
1. Macro Overview
2. 2011Southern California Lodging Forecast
3. Q & A
Expectations…..Uncertainty
2
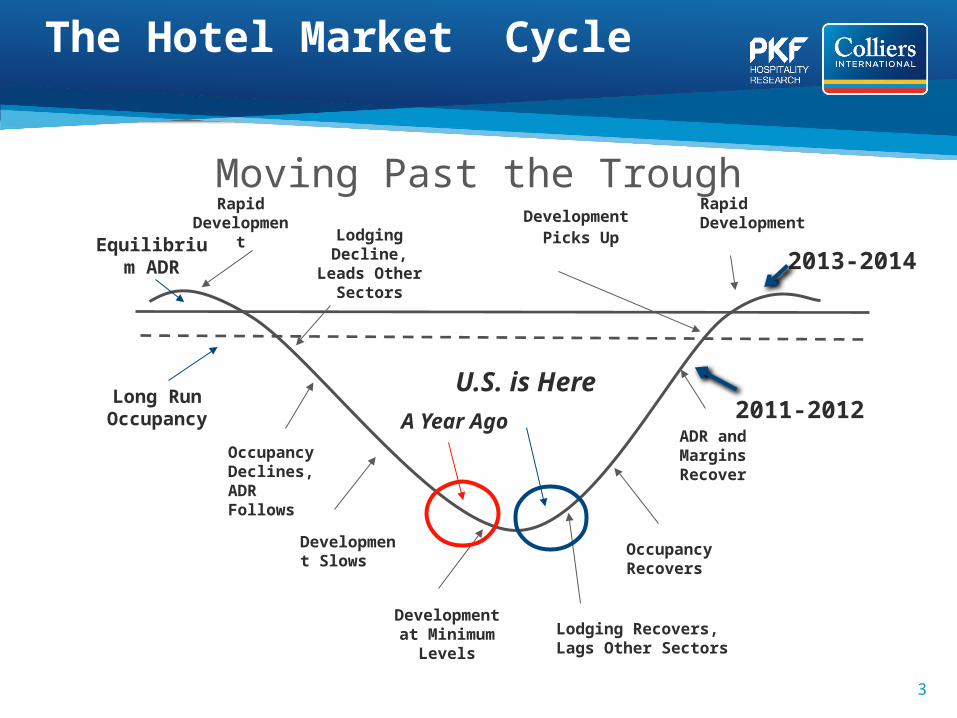
The Hotel Market Cycle
Rapid Development
Occupancy Declines, ADR Follows
Development at Minimum
Levels
Lodging Decline, Leads Other Sectors
Occupancy Recovers
ADR and Margins Recover
Development Picks Up
Development Slows
Lodging Recovers, Lags Other Sectors
Long RunOccupancy
Rapid Development
Equilibrium ADR
U.S. is Here2011-2012
Moving Past the Trough
2013-2014
A Year Ago
3
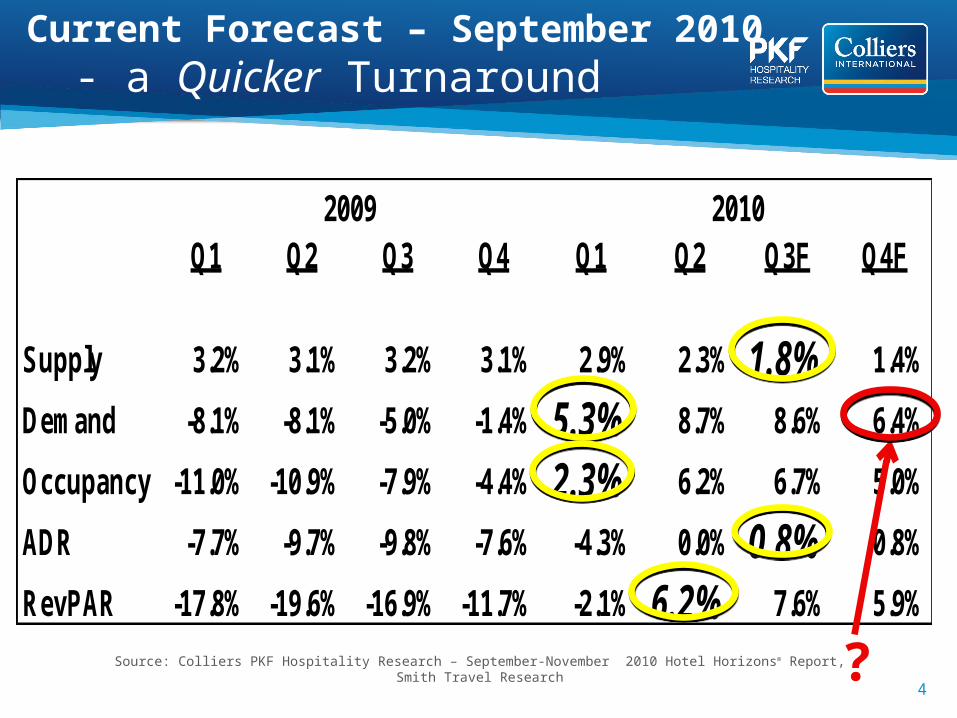
Q1 Q2 Q3 Q4 Q1 Q2 Q3F Q4F
Supply 3.2% 3.1% 3.2% 3.1% 2.9% 2.3% 1.8% 1.4%
Demand -8.1% -8.1% -5.0% -1.4% 5.3% 8.7% 8.6% 6.4%
Occupancy -11.0% -10.9% -7.9% -4.4% 2.3% 6.2% 6.7% 5.0%
ADR -7.7% -9.7% -9.8% -7.6% -4.3% 0.0% 0.8% 0.8%
RevPAR -17.8% -19.6% -16.9% -11.7% -2.1% 6.2% 7.6% 5.9%
2009 2010
Current Forecast – September 2010- a Quicker Turnaround
Source: Colliers PKF Hospitality Research – September-November 2010 Hotel Horizons® Report, Smith Travel Research ?4

Long Term Average 2006 2007 2008 2009 2010F 2011F 2012F
Supply 2.2% 0.2% 1.3% 2.5% 3.1% 2.0% 1.1% .08%
Demand 1.5% 0.5% 0.8% -2.1% -5.9% 7.3% 3.2% 4.9%
Occupancy 62.2% 63.1% 62.8% 60.0% 54.7% 57.5% 58.7% 61.0%
ADR 2.9% 7.6% 6.4% 2.8% -8.8% -0.6% 3.8% 6.3%
RevPAR 2.3% 7.9% 5.9% -1.9% -16.8% 4.6% 5.9% 10.6%
National HorizonSeptember 2010 Update
A Quicker Turnaround?
Record Decline
Record Increase
Source: Colliers PKF Hospitality Research – September-November 2010 Hotel Horizons® Report, Smith Travel Research
5

National Hotel Horizons(Preliminary 2011 Data)
Source: Colliers PKF Hospitality Research – Preliminary 2011 Hotel Horizons® Report, Smith Travel Research 6
National vs. Regional Lodging Comparison
2010 Year-End Estimates
Location Occ ADRRevPA
R%Increa
se
United States 57.5% $97.33$55.9
3 4.6%
Los Angeles County 68.9% $119.17
$82.12 7.2%
Orange County 67.7% $108.58$73.5
1 2.4%
San Diego County 66.9% $125.18
$83.76 2.7%
National Hotel Horizons(Preliminary 2011 Data)
Source: Colliers PKF Hospitality Research – Preliminary 2011 Hotel Horizons® Report, Smith Travel Research 7
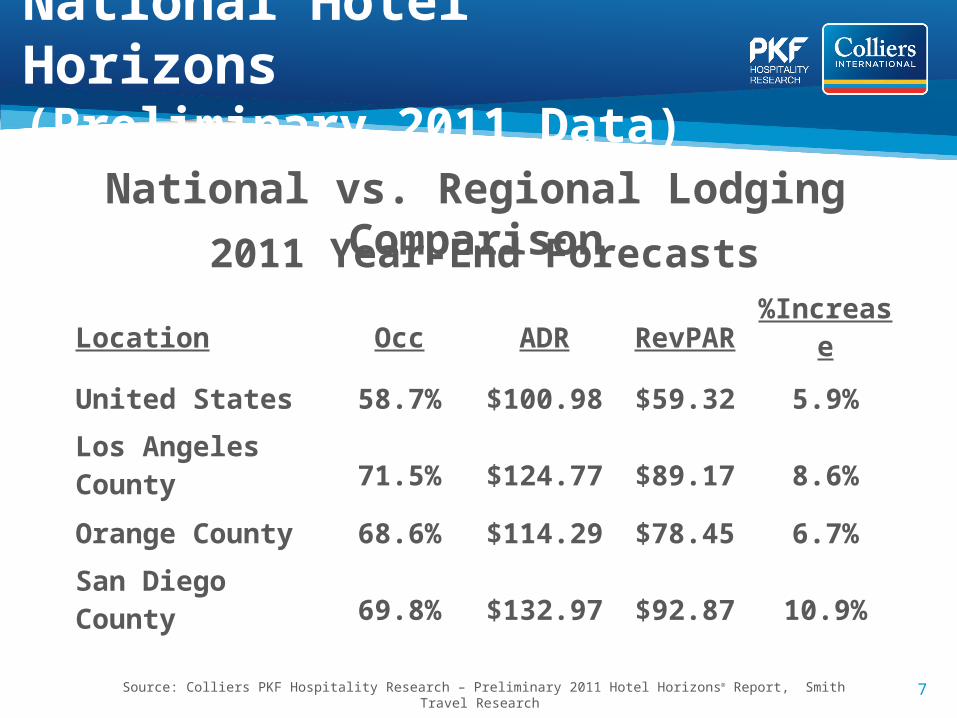
National vs. Regional Lodging Comparison
2011 Year-End Forecasts
Location Occ ADRRevPA
R%Increa
se
United States 58.7% $100.98$59.3
2 5.9%
Los Angeles County 71.5% $124.77
$89.17 8.6%
Orange County 68.6% $114.29$78.4
5 6.7%
San Diego County 69.8% $132.97
$92.87 10.9%

Recovery Timelines Mixed Across Markets: Distance to Long Run Average Occupancy
Level
20102011201220132014
8Source: Colliers PKF Hospitality Research – September-November 2010 Hotel Horizons® Report, Smith Travel Research

Recovery Timelines Mixed Across Markets: Year When ADR Levels Return to Previous Peak
20102011201220132014
9Source: Colliers PKF Hospitality Research – September-November 2010 Hotel Horizons® Report, Smith Travel Research
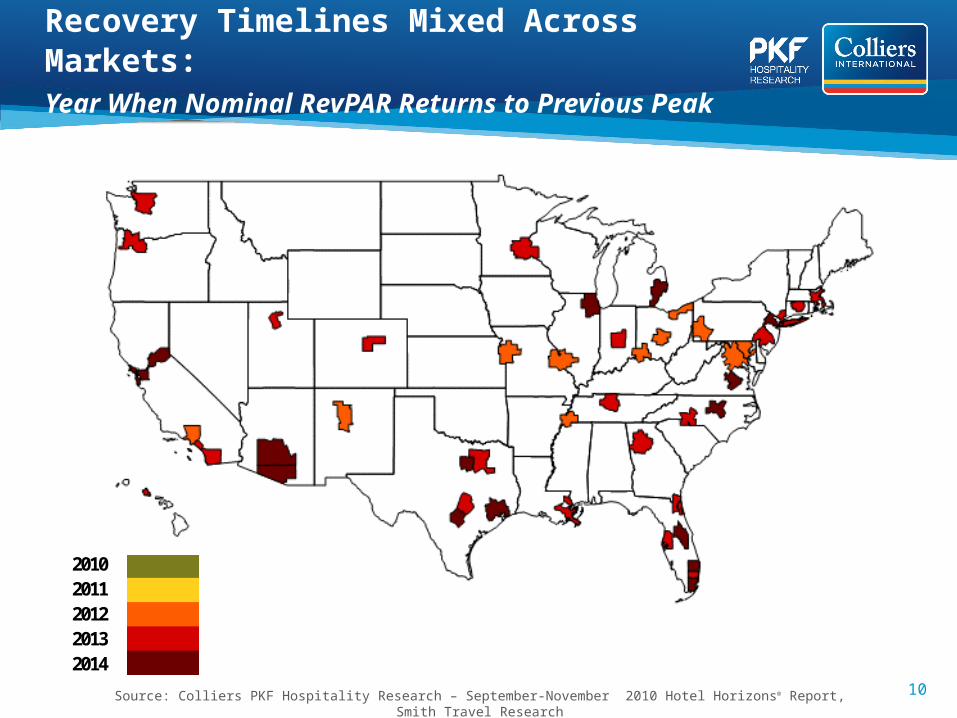
Recovery Timelines Mixed Across Markets: Year When Nominal RevPAR Returns to Previous
Peak
20102011201220132014
10Source: Colliers PKF Hospitality Research – September-November 2010 Hotel Horizons® Report, Smith Travel Research

Revenue & Expenses2009 Annual Trends®
The worst year on record
is now behind us!
11

Summary
Headwinds Against the Economy – Uncertainty:
* The November elections* Tax policy as of January 1, 2011* Persistent high levels of unemployment* Continued weakness in housing * Airline capacity constraints
Forecast bias = slight negative.
12
Los Angeles County
• JW Marriott/Ritz LA Live fully absorbed into downtown market, inducing additional demand – 24.8% RevPAR growth estimated for 2010
• Westside showing strong occupancy recovery, rate following.
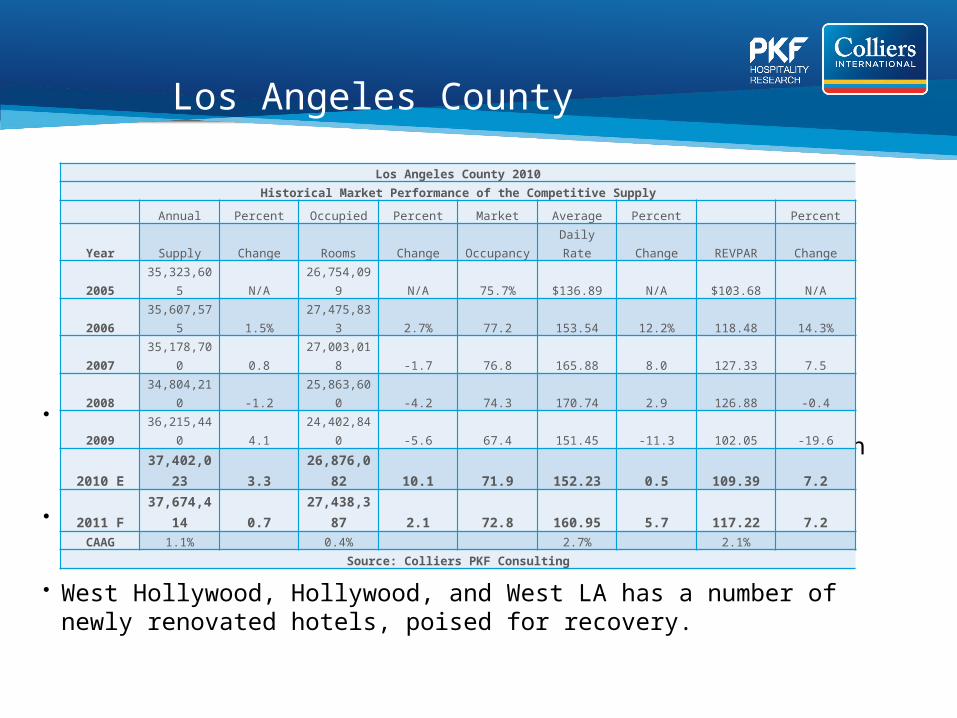
• West Hollywood, Hollywood, and West LA has a number of newly renovated hotels, poised for recovery.
Los Angeles County 2010
Historical Market Performance of the Competitive Supply
Annual Percent Occupied Percent Market Average Percent Percent
Year Supply Change Rooms Change Occupancy Daily Rate Change REVPAR Change
2005 35,323,605 N/A 26,754,099 N/A 75.7% $136.89 N/A $103.68 N/A
2006 35,607,575 1.5% 27,475,833 2.7% 77.2 153.54 12.2% 118.48 14.3%
2007 35,178,700 0.8 27,003,018 -1.7 76.8 165.88 8.0 127.33 7.5
2008 34,804,210 -1.2 25,863,600 -4.2 74.3 170.74 2.9 126.88 -0.4
2009 36,215,440 4.1 24,402,840 -5.6 67.4 151.45 -11.3 102.05 -19.6
2010 E 37,402,023 3.3 26,876,082 10.1 71.9 152.23 0.5 109.39 7.22011 F 37,674,414 0.7 27,438,387 2.1 72.8 160.95 5.7 117.22 7.2CAAG 1.1% 0.4% 2.7% 2.1%
Source: Colliers PKF Consulting

Los Angeles County
• Santa Monica submarket expected to achieve highest 2010 submarket
occupancy, followed by LAX and Arcadia/Monrovia.
• 281,000 definite and tentative room nights on the 2011 convention calendar,
300,000+ for 2012 and 2013 as LA Inc and Downtown drive new business.
• 2009 openings include AVIA Long Beach Hotel with 138 guestrooms and the
178-room Residence Inn, as well as the June 2009 opening of the 582-room
Terranea.
• 2010 openings include JW Marriott and Ritz LA Live, the W Hollywood, and the
re-opening of Best Western Jamaica Bay in Marina Del Rey in December.
• No openings expected for 2011.

Orange County
• Affordable, accessible leisure destinations out performed all other
market segments (Anaheim)
• SNA passenger counts down 3.8% year-to-date, but well positioned for
future years given current $0.5 billion expansion
• Convention Center activity remains robust
• Recent passage of 2% TID in Anaheim Resort Area
Orange CountyHistorical Market Performance of the Competitive Supply
Annual Percent Occupied Percent Market Average Percent PercentYear Supply Change Rooms Change Occupancy Daily Rate Change REVPAR Change2005 17,192,230 N/A 12,326,014 N/A 71.7% $104.69 N/A $75.06 N/A2006 18,214,595 5.9% 13,245,130 7.5% 72.7 118.16 12.9% 85.92 14.5%2007 18,976,715 4.2 13,825,532 4.4 72.9 128.17 8.5 93.38 8.72008 19,139,823 0.9 13,580,431 -1.8 71.0 128.16 0.0 90.94 -2.62009 19,463,908 1.7 12,520,143 -7.8 64.3 115.51 -9.9 74.30 -18.3
2010 E 19,701,945 1.2 13,501,934 7.8 68.5 113.35 -1.9 77.68 4.62011 F 19,729,358 0.1 13,848,941 2.6 70.2 118.82 4.8 83.41 7.4CAAG 2.3% 2.0% 2.1% 1.8%
Source: Colliers PKF Consulting

Orange County
16
• Coastal resorts achieving significant RevPAR recovery
• Costa Mesa and Airport submarkets posting highest 2010 occupancies
• Disneyland Resort continues to be a driving force for hotel demand
• Expansion/Renovation of the Grand Californian & Disneyland Hotel
• $1 Billion expansion of California Adventure
• SpringHill Suites Anaheim opening in mid-2011
(NE of Disneyland SEC Ball & Walnut)
• Only addition to supply, But the immediate Anaheim Area remains the most
studied area in the County for proposed hotels

San Diego County
- Only new addition for 2011 is Hampton Inn Mission Valley in December2011/
January2012 (87 keys)
- Marriott Escondido still on hold
- 94-room Towne Place Vista and the 112-room Residence Inn San Marcos, both
of which opened mid-2010 in I-15 Kearny Mesa market
- Compression markets such as Mission Valley and South Bay posting slower
recovery
San Diego CountyHistorical Market Performance of the Competitive Supply
Annual Percent Occupied Percent Market Average Percent PercentYear Supply Change Rooms Change Occupancy Daily Rate Change REVPAR Change2005 11,500,420 N/A 8,632,244 N/A 75.1% $149.82 N/A $112.46 N/A2006 11,676,761 1.5% 8,829,077 2.3% 75.6 161.70 7.9% 122.27 8.7%2007 11,858,850 1.6 8,894,775 0.7 75.0 171.95 6.3 128.97 5.52008 12,244,412 3.3 8,819,188 -0.8 72.0 174.98 1.8 126.03 -2.32009 12,974,655 6.0 8,601,369 -2.5 66.3 151.58 -13.4 100.49 -20.3
2010 E 13,183,435 1.6 9,175,595 6.7 69.6 147.64 -2.6 102.76 2.32011 F 13,221,030 0.3 9,504,970 3.6 71.9 156.00 5.7 112.14 9.1CAAG 2.4% 1.6% 0.7% 0.0%
Source: Colliers PKF Consulting
San Diego County
18
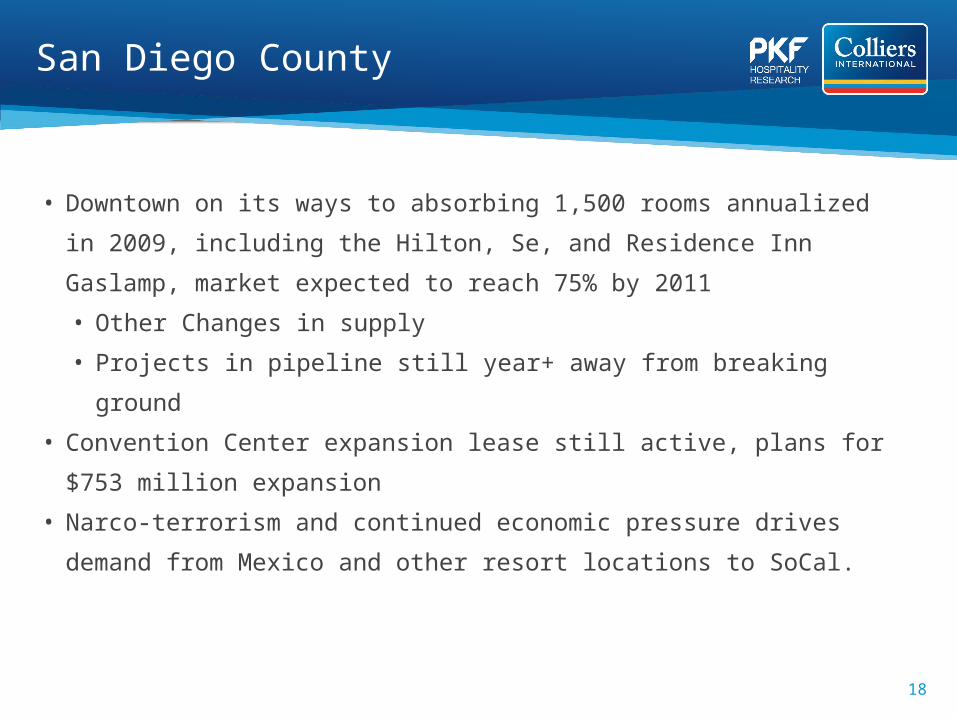
• Downtown on its ways to absorbing 1,500 rooms annualized in 2009, including
the Hilton, Se, and Residence Inn Gaslamp, market expected to reach 75% by
2011
• Other Changes in supply
• Projects in pipeline still year+ away from breaking ground
• Convention Center expansion lease still active, plans for $753 million
expansion
• Narco-terrorism and continued economic pressure drives demand from Mexico
and other resort locations to SoCal.

Inland Empire
• Greater impact as a result of reliance mainly on commercial demand• Rate wars and lack of product differentiation lead to depressed Average
Daily Rates• Significant supply added in 2005-2009 still being absorbed and will
lengthen recovery period• Airlift remains contentious; Ontario exploring plans to take over• But 2010 WILL exhibit positive growth for the 1st time since 2007• Short term, will be painful, but long-term fundamentals remain in tact as
it is the only market for real growth in SoCal
Inland EmpireHistorical Market Performance of the Competitive Supply
Annual Percent Occupied Percent Market Average Percent PercentYear Supply Change Rooms Change Occupancy Daily Rate Change REVPAR Change2005 2,002,390 N/A 1,485,862 N/A 74.2% $92.54 N/A $68.67 N/A2006 2,245,480 12.1% 1,623,821 9.3% 72.3 98.97 7.0% 71.57 4.2%2007 2,344,030 4.4 1,674,191 3.1 71.4 101.14 2.2 72.24 0.92008 2,483,825 6.0 1,629,444 -2.7 65.6 99.80 -1.3 65.47 -9.42009 2,725,455 9.7 1,557,313 -4.4 57.1 87.50 -12.3 49.99 -23.6
2010 E 2,814,515 3.3 1,721,681 10.6 61.2 82.11 -6.2 50.23 0.52011 F 2,892,990 2.8 1,807,765 5.0 62.5 83.42 1.6 52.13 3.8CAAG 6.3% 3.3% -1.7% -4.5%
Source: Colliers PKF Consulting
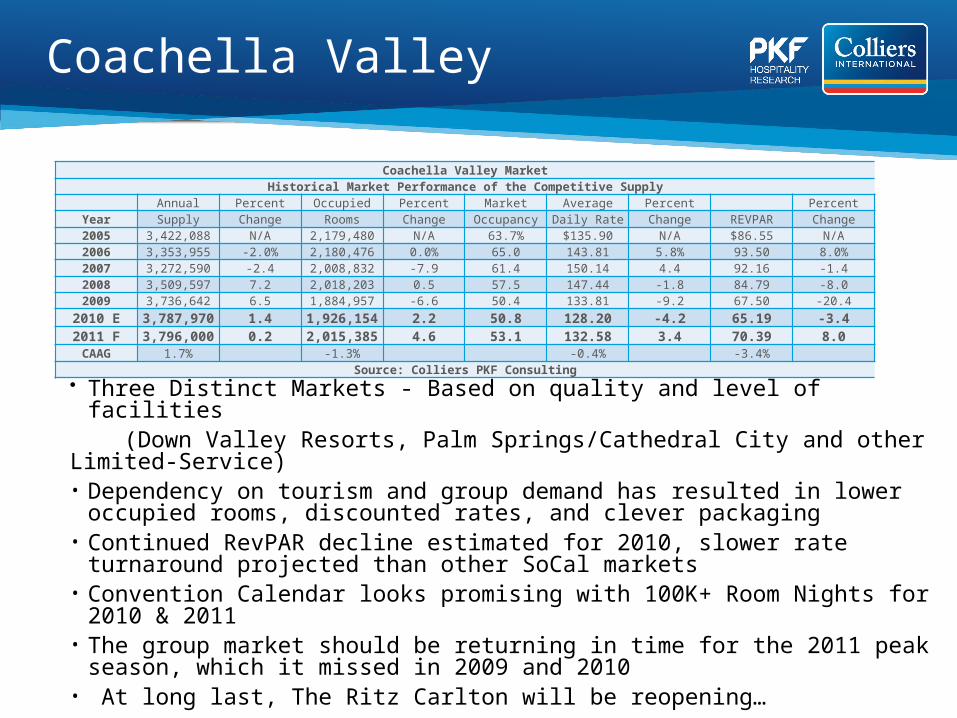
Coachella Valley
• Three Distinct Markets - Based on quality and level of facilities (Down Valley Resorts, Palm Springs/Cathedral City and other Limited-Service)• Dependency on tourism and group demand has resulted in lower occupied rooms,
discounted rates, and clever packaging• Continued RevPAR decline estimated for 2010, slower rate turnaround projected
than other SoCal markets• Convention Calendar looks promising with 100K+ Room Nights for 2010 & 2011• The group market should be returning in time for the 2011 peak season, which it
missed in 2009 and 2010• At long last, The Ritz Carlton will be reopening…
Coachella Valley MarketHistorical Market Performance of the Competitive Supply
Annual Percent Occupied Percent Market Average Percent PercentYear Supply Change Rooms Change Occupancy Daily Rate Change REVPAR Change2005 3,422,088 N/A 2,179,480 N/A 63.7% $135.90 N/A $86.55 N/A2006 3,353,955 -2.0% 2,180,476 0.0% 65.0 143.81 5.8% 93.50 8.0%2007 3,272,590 -2.4 2,008,832 -7.9 61.4 150.14 4.4 92.16 -1.42008 3,509,597 7.2 2,018,203 0.5 57.5 147.44 -1.8 84.79 -8.02009 3,736,642 6.5 1,884,957 -6.6 50.4 133.81 -9.2 67.50 -20.4
2010 E 3,787,970 1.4 1,926,154 2.2 50.8 128.20 -4.2 65.19 -3.42011 F 3,796,000 0.2 2,015,385 4.6 53.1 132.58 3.4 70.39 8.0CAAG 1.7% -1.3% -0.4% -3.4%
Source: Colliers PKF Consulting
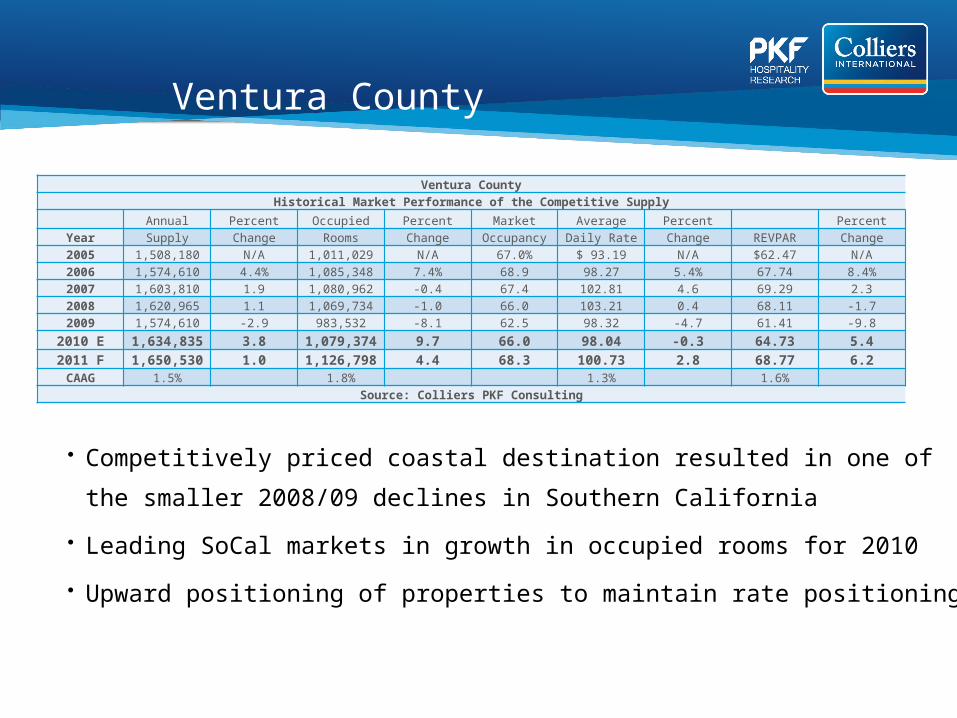
Ventura County
• Competitively priced coastal destination resulted in one of the smaller 2008/09
declines in Southern California
• Leading SoCal markets in growth in occupied rooms for 2010
• Upward positioning of properties to maintain rate positioning
Ventura County
Historical Market Performance of the Competitive Supply
Annual Percent Occupied Percent Market Average Percent Percent
Year Supply Change Rooms Change Occupancy Daily Rate Change REVPAR Change
2005 1,508,180 N/A 1,011,029 N/A 67.0% $ 93.19 N/A $62.47 N/A
2006 1,574,610 4.4% 1,085,348 7.4% 68.9 98.27 5.4% 67.74 8.4%
2007 1,603,810 1.9 1,080,962 -0.4 67.4 102.81 4.6 69.29 2.3
2008 1,620,965 1.1 1,069,734 -1.0 66.0 103.21 0.4 68.11 -1.7
2009 1,574,610 -2.9 983,532 -8.1 62.5 98.32 -4.7 61.41 -9.8
2010 E 1,634,835 3.8 1,079,374 9.7 66.0 98.04 -0.3 64.73 5.4
2011 F 1,650,530 1.0 1,126,798 4.4 68.3 100.73 2.8 68.77 6.2CAAG 1.5% 1.8% 1.3% 1.6%
Source: Colliers PKF Consulting

Santa Barbara County
• Set represents approximately 60% of Santa Barbara supply• Coastal Resorts leading recovery, return in group market.• High barriers to new hotel development, increased by economic pressure • Significant renovations at several properties has mitigated decline • North county has benefited from drive in vacations
Santa Barbara CountyHistorical Market Performance of the Competitive Supply
Annual Percent Occupied Percent Market Average Percent PercentYear Supply Change Rooms Change Occupancy Daily Rate Change REVPAR Change2005 1,853,835 N/A 1,318,299 N/A 71.1% $153.39 N/A $109.08 N/A2006 1,860,040 0.3% 1,329,952 0.9% 71.5 171.75 12.0% 122.81 12.6%2007 1,856,025 -0.2 1,321,922 -0.6 71.2 183.05 6.6 130.38 6.22008 1,880,480 1.3 1,305,699 -1.2 69.4 182.47 -0.3 126.70 -2.82009 1,939,975 3.2 1,239,684 -5.1 63.9 168.84 -7.5 107.89 -14.8
2010 E 1,950,925 0.6 1,310,981 5.8 67.2 171.25 1.4 115.08 6.72011 F 1,950,925 0.0 1,356,617 3.5 69.5 178.37 4.2 124.03 7.8CAAG 0.9% 0.5% 2.5% 2.2%
Source: Colliers PKF Consulting
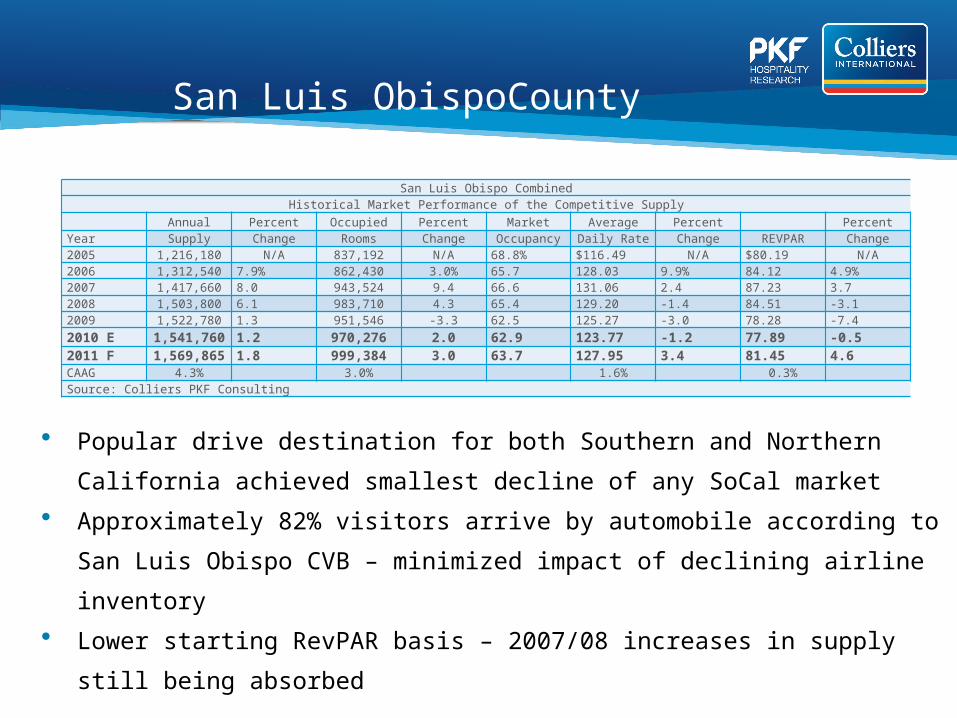
San Luis ObispoCounty
• Popular drive destination for both Southern and Northern California achieved
smallest decline of any SoCal market
• Approximately 82% visitors arrive by automobile according to San Luis Obispo
CVB – minimized impact of declining airline inventory
• Lower starting RevPAR basis – 2007/08 increases in supply still being absorbed
San Luis Obispo CombinedHistorical Market Performance of the Competitive Supply
Annual Percent Occupied Percent Market Average Percent PercentYear Supply Change Rooms Change Occupancy Daily Rate Change REVPAR Change2005 1,216,180 N/A 837,192 N/A 68.8% $116.49 N/A $80.19 N/A2006 1,312,540 7.9% 862,430 3.0% 65.7 128.03 9.9% 84.12 4.9%2007 1,417,660 8.0 943,524 9.4 66.6 131.06 2.4 87.23 3.72008 1,503,800 6.1 983,710 4.3 65.4 129.20 -1.4 84.51 -3.12009 1,522,780 1.3 951,546 -3.3 62.5 125.27 -3.0 78.28 -7.4
2010 E 1,541,760 1.2 970,276 2.0 62.9 123.77 -1.2 77.89 -0.52011 F 1,569,865 1.8 999,384 3.0 63.7 127.95 3.4 81.45 4.6CAAG 4.3% 3.0% 1.6% 0.3% Source: Colliers PKF Consulting

Coastal Market
• “First Tier ($400+) highest 2010 RevPAR growth estimate at 24.8%, Tier 3 at 7.4% (>$275) and Tier 2 -0.8% ($275<--<$400)
• Recent additions include - 2007 - Grand Del Mar - 2008 - Sheraton Carlsbad and Pelican Hill Resort- 2009 - Shorebreak Hotel in Huntington Beach and the Terranea Resort in Rancho
Palos Verdes. - No new hotels opened in 2010 or are expected to in 2011.
Coastal MarketHistorical Market Performance of the Competitive Supply
Annual Percent Occupied Percent Market Average Percent PercentYear Supply Change Rooms Change Occupancy Daily Rate Change REVPAR Change2005 2,458,701 N/A 1,701,051 N/A 69.2% $279.37 N/A $193.28 N/A2006 2,478,411 0.8% 1,748,223 2.8% 70.5 305.06 9.2% 215.18 11.3%2007 2,531,427 2.1 1,782,824 2.0 70.4 325.58 6.7 229.29 6.62008 2,669,488 5.5 1,789,490 0.4 67.0 328.37 0.9 220.12 -4.02009 2,975,358 11.5 1,703,819 -4.8 57.3 284.46 -13.4 162.90 -26.0
2010 E 3,086,501 3.7 1,930,887 13.3 62.6 282.35 -0.7 176.64 8.42011 F 3,086,501 0.0 2,023,424 4.8 65.6 296.07 4.9 194.10 9.9CAAG 3.9% 2.9% 1.0% 0.1%
Source: Colliers PKF Consulting

Coastal Submarkets
• Group demand starting to return, strong ADR growths expected in 2011, with First Tier leading the way.
• Coastal SoCal continues to develop as a self-standing international group and leisure destination.
• Significant additions to supply from 2005 to 2009 still being absorbed, but the good news is there is little in the pipeline

Q & A
What questions can we answer for you?

Thank you for your time.
27
Top Related