


Languages
Pages
Legal


© 2010 Pearson Education Canada
Lecture 4: Human Population Dynamics
Outline:
•Ecology – Population Dynamics
•Human Population Demographics
Live Estimate of Human Population:http://www.worldometers.info/world-population/

© 2010 Pearson Education Canada
Learning Outcomes:
• At the end of this week, you should be able to:
• Describe logistic growth, carrying capacity, limiting factors, and other fundamental concepts in ecology
• Assess the scope and historical patterns of human population growth
• Evaluate how human population, affluence, culture and technology affect the environment
• Explain the fundamental concepts of demography and outline the concept of demographic transition
• Characterize the dimensions of the HIV/AIDS pandemic and its impacts on population, the environment, and sustainability
3-2

© 2010 Pearson Education Canada
Population characteristics
• All populations show characteristics that help scientists predict their future dynamics
• Population size = the number of individual organisms present at a given time
- Numbers can increase, decrease, or remain the same
• Population density = the number of individuals within a population per unit area
- High densities make it easier to find mates, but increase competition, and vulnerability to predation
- Low densities make it harder to find mates, but individuals enjoy plentiful resources and space
3-3

© 2010 Pearson Education Canada
• Sex ratio = proportion of males to females
• Age Structure = the relative numbers of organisms of each age within a population
- Age structure diagrams (pyramids)
Population characteristics
3-4
© 2010 Pearson Education Canada
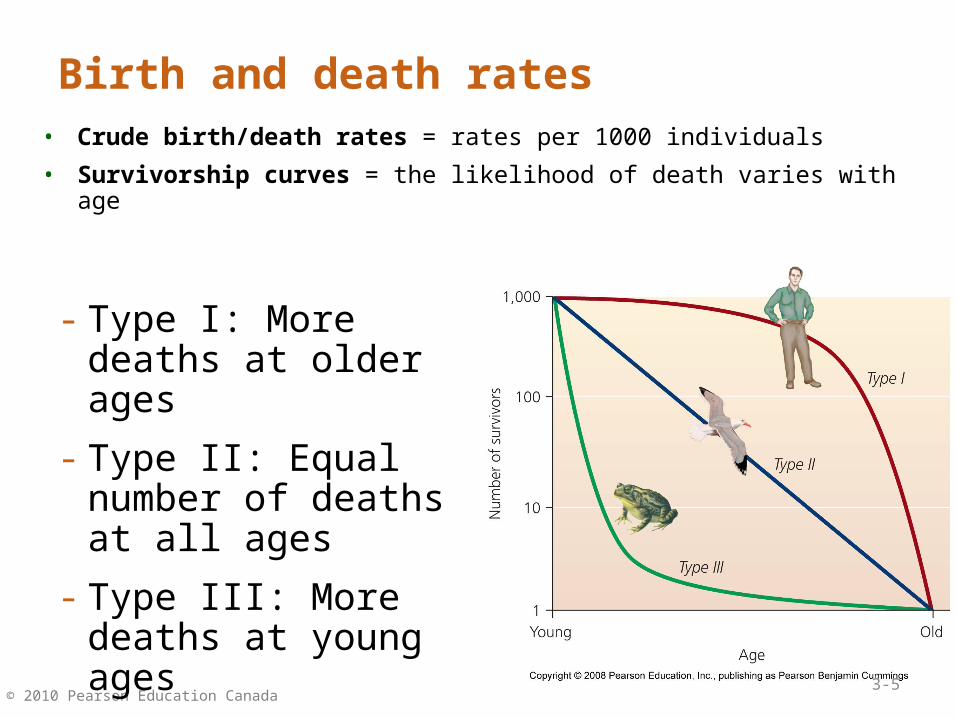
Birth and death rates
- Type I: More deaths at older ages
- Type II: Equal number of deaths at all ages
- Type III: More deaths at young ages
3-5
• Crude birth/death rates = rates per 1000 individuals
• Survivorship curves = the likelihood of death varies with age

© 2010 Pearson Education Canada
Populations may grow, shrink, or remain stable• Natality = births within the population
• Mortality = deaths within the population
• Immigration = arrival of individuals from outside the population
• Emigration = departure of individuals from the population
• Growth rate = (Crude birth rate + immigration rate) - (Crude death rate + emigration rate)
3-6

© 2010 Pearson Education Canada
Unregulated populations
• Steady growth rates cause exponential population growth
- Something increases by a fixed percent
- Graphed as a J-shaped curve
3-7
• Exponential growth cannot be sustained indefinitely
- It occurs in nature with a small population and ideal conditions

© 2010 Pearson Education Canada
Limiting factors restrain growth
• Limiting factors = physical, chemical and biological characteristics that restrain population growth
- Water, space, food, predators, and disease
• Environmental resistance = All limiting factors taken together
3-8

© 2010 Pearson Education Canada
Carrying capacity
• Carrying capacity = the maximum population size of a species that its environment can sustain
- An S-shaped logistic growth curve
- Limiting factors slow and stop exponential growth
• Carrying capacity changes
Humans have raised their carrying capacity by decreasing the carrying capacity for other species
FIGURE 3.15
3-9
© 2010 Pearson Education Canada
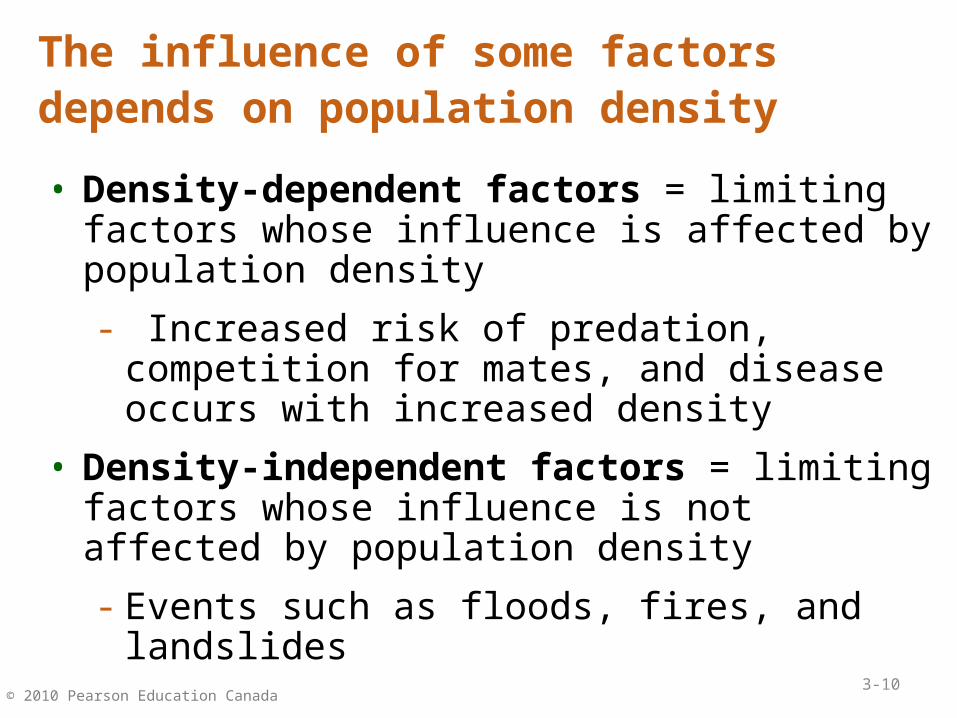
The influence of some factors depends on population density
• Density-dependent factors = limiting factors whose influence is affected by population density
- Increased risk of predation, competition for mates, and disease occurs with increased density
• Density-independent factors = limiting factors whose influence is not affected by population density
- Events such as floods, fires, and landslides
3-10

© 2010 Pearson Education Canada
Human Population distribution
FIGURE 6.9
6-11
© 2010 Pearson Education Canada
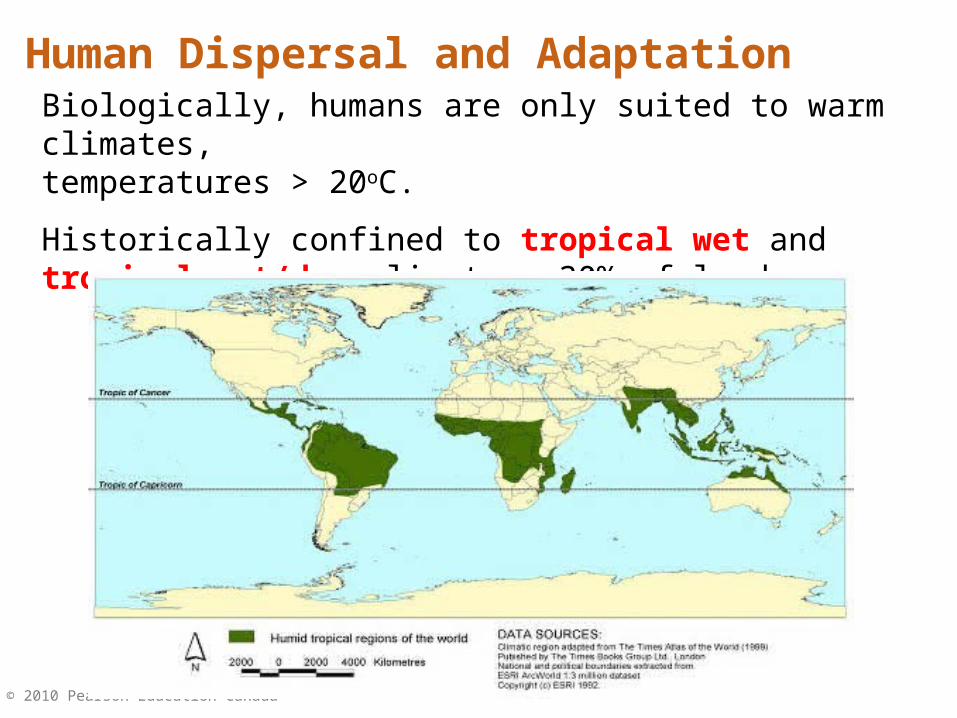
Human Dispersal and AdaptationBiologically, humans are only suited to warm climates, temperatures > 20oC.
Historically confined to tropical wet and tropical wet/dry climates, 30% of land.
© 2010 Pearson Education Canada
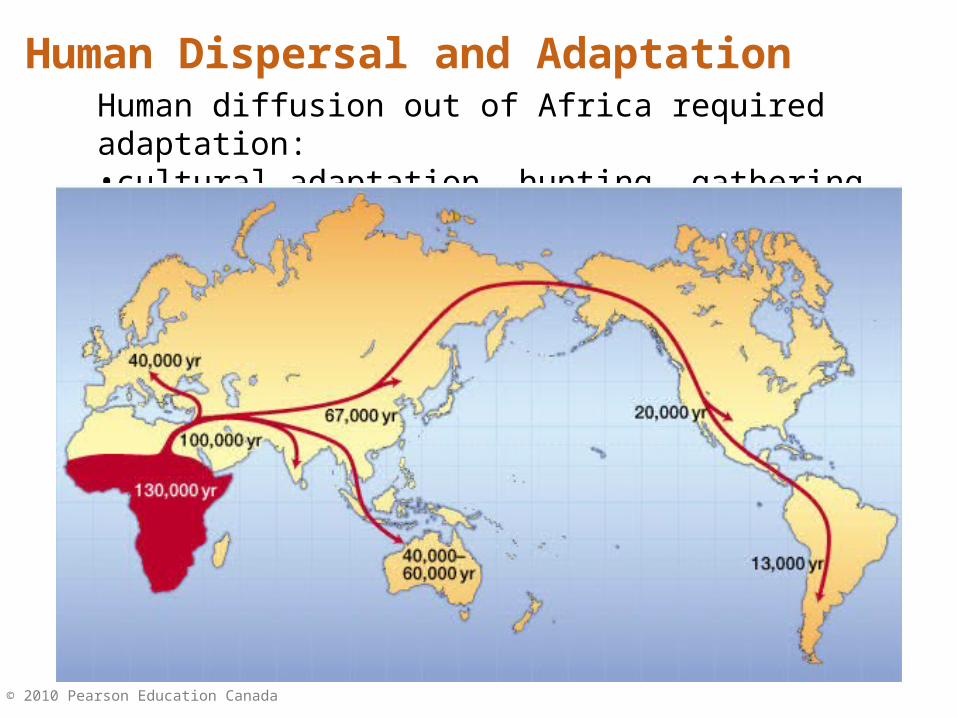
Human Dispersal and AdaptationHuman diffusion out of Africa required adaptation:•cultural adaptation, hunting, gathering and shelter.

© 2010 Pearson Education Canada
Human Dispersal and AdaptationMost diffusion took place between 40,000 and 10,000 years ago.
20,000 years ago

© 2010 Pearson Education Canada
Human Dispersal and AdaptationUntil ~12,000 years ago, human populations were very small and had little impact on the environment.
People lived in small mobile groups and survived by hunting and gathering.

© 2010 Pearson Education Canada
The Rise of Human PopulationsAgriculture: allowed for higher rate of food production.
•Humans were able to settle and support larger populations. •Led to cleared land, soil erosion, water diversion and pollution.

© 2010 Pearson Education Canada
The Rise of Human PopulationsGlobal Power Centres:•1500-1800: England, France and Spain.
•Established global trade routes that gave rise to modern industrial economies and consumerism.

© 2010 Pearson Education Canada
The Rise of Human PopulationsGlobal Power Centres:•1900s: Europe and North America
•Relied on exploitation of resources.
Original Forest Cover

© 2010 Pearson Education Canada
The Rise of Human PopulationsGlobal Power Centres:•1900s: Europe and North America
•Relied on exploitation of resources.
Current Forest Cover

© 2010 Pearson Education Canada
The Rise of Human PopulationsGlobal Power Centres:•Exploitation has lead to vast waste pollution, air pollution and soil degradation.

© 2010 Pearson Education Canada
Human population: 7 billion by 2013• It took all of human history to reach 1 billion
• In 1930, 130 years later, we reached 2 billion, and added the most recent billion in 12 years
FIGURE 6.26-21

© 2010 Pearson Education Canada
Human population: 7 billion by 2013
FIGURE 6.26-22

© 2010 Pearson Education Canada
Population Patterns and TrendsWhy are we spread unevenly across the continents?
People per km2

© 2010 Pearson Education Canada
Population Patterns and TrendsTemporal and Spatial Variations in Population:
Physical environment: 60% of all land is unfavorable.•Dry lands•Cold lands•Mountains•Wet tropics

© 2010 Pearson Education Canada
Population Patterns and TrendsTemporal and Spatial Variations in Population:
Physical environment: 60% of all land is unfavorable.
Human modification of the environment: irrigation …

© 2010 Pearson Education Canada
Population Patterns and TrendsTemporal and Spatial Variations in Population:
Today: population movement is mainly due to economic hardship, political unrest and war.

© 2010 Pearson Education Canada
Population Patterns and TrendsInternational Comparisons of Population Size and Density:
Relative Population Size

© 2010 Pearson Education Canada
Population Patterns and TrendsInternational Comparisons of Population Size:
Source: Wikipedia “World Population”

© 2010 Pearson Education Canada
Population Patterns and TrendsInternational Comparisons of Population Size and Density:
Population Density: number of people divided by land area.
People per km2

© 2010 Pearson Education Canada
Population Patterns and TrendsInternational Comparisons of Population Size and Density:
Physiologic Density: number of people divided by area of cropland. Reflects intensity of agriculture in developing countries.
© 2010 Pearson Education Canada
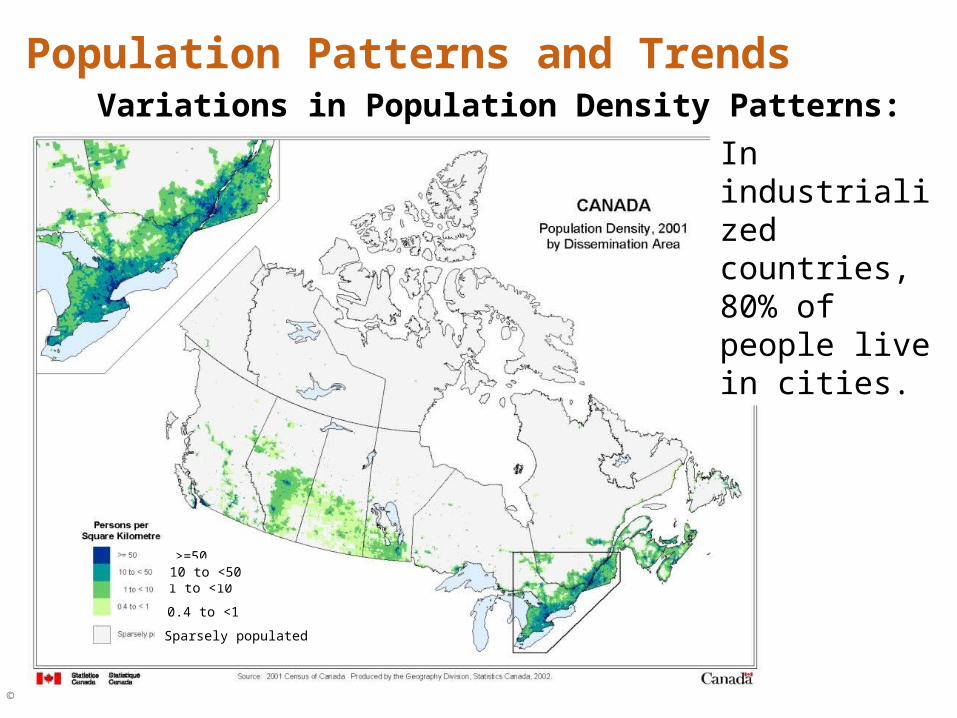
Population Patterns and TrendsVariations in Population Density Patterns:
In industrialized countries, 80% of people live in cities.
1 to <10
>=50
0.4 to <1
Sparsely populated
10 to <50

© 2010 Pearson Education Canada
Population Patterns and TrendsMechanisms responsible for temporal and spatial population changes:
• Birth rates• Death rates• Migration
• Migration between countries has become less import but migration within countries is still significant.
© 2010 Pearson Education Canada
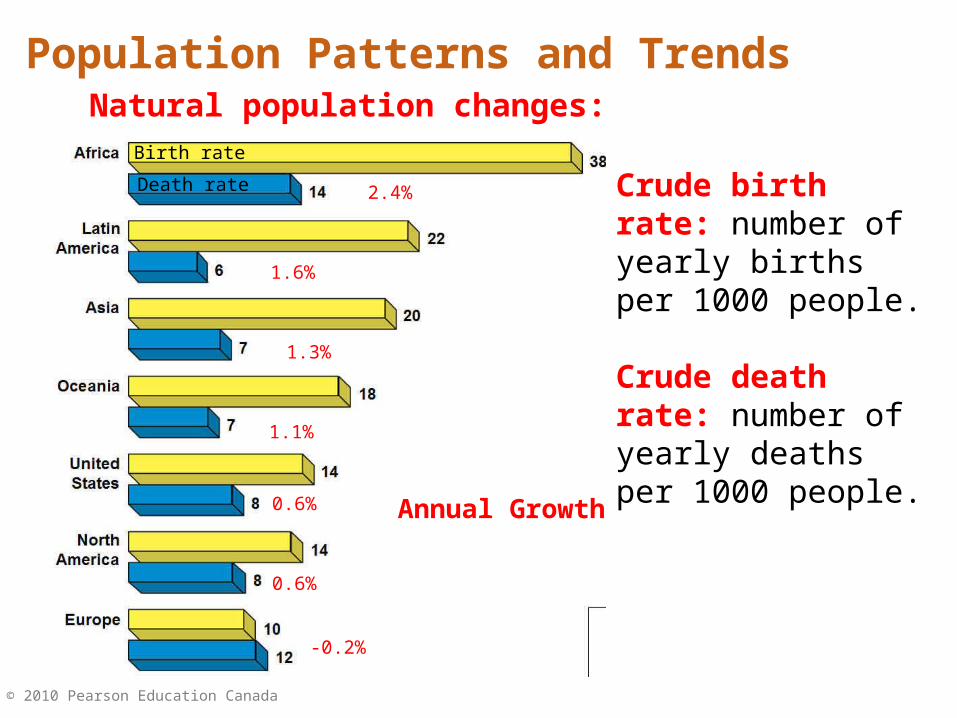
Population Patterns and TrendsNatural population changes:
Crude birth rate: number of yearly births per 1000 people.
Crude death rate: number of yearly deaths per 1000 people.
Annual Growth
2.4%
1.6%
1.3%
1.1%
0.6%
0.6%
-0.2%
Birth rate
Death rate

© 2010 Pearson Education Canada
Rates of growth vary with region
• At today’s 2.1% annual growth rate, the population will double in 33 years
• If China’s rate had continued at 2.8%, it would have had 2 billion people in 2004.
FIGURE 6.36-34

© 2010 Pearson Education Canada
Population Patterns and Trends
Natural population changes:
Life expectancy: average age at death.

© 2010 Pearson Education Canada
Population Patterns and Trends
Natural population changes:
Infant mortality: deaths per 1000 live births.

© 2010 Pearson Education Canada
Break Time!

© 2010 Pearson Education Canada
BUT, population growth is seen as a temporary phenomenon
6-38
© 2010 Pearson Education Canada
Movie (~58 mins)“Don’t Panic: Facts about Population”
• Data current to 2013
• Hans Rosling – M.D., statistician, academic, founder of Gapminder Foundation
• Take notes on the main points and graphs he makes
• Documentary film credits/info: http://www.gapminder.org/videos/dont-panic-the-facts-about-population/
3-39
https://www.youtube.com/watch?v=FACK2knC08E

© 2010 Pearson Education Canada
The demographic transition
• Demographic transition = a model of economic and cultural change to explain the declining death and birth rates in industrializing nations
• high birth and death rates change to low birth and death rates
• As mortality decreases, there is less need for large families
- Parents invest in quality of life
6-40

© 2010 Pearson Education Canada
The demographic transition’s four stages
6-41
Population size

© 2010 Pearson Education Canada
Is the demographic transition universal?
• It has occurred in Europe, U.S., Canada, Japan, and other nations over the past 200-300 years
• But, it may or may not apply to all developing nations
• The transition could fail in cultures that
- Place greater value on childbirth
- Grant women fewer freedoms
For people to attain the material standard of living of North Americans, we would need the natural resources of four and a half more Earths
6-42

© 2010 Pearson Education Canada
Age structure affects future population dynamics• Having many individuals in young age groups
results in high reproduction and rapid population growth
FIGURE 6.10
6-43
© 2010 Pearson Education Canada
Total fertility rate influences population growth
• Total fertility rate (TFR) = average number of children born per female member of a population during her lifetime
- Developed = 1.5
- Developing = 3.1
- Africa = 5.2
• Replacement fertility = the TFR that keeps the size of a population stable
6-44

© 2010 Pearson Education Canada
Factors affecting total fertility rate
• Increasing urbanization decreases TFR
- Children go to school, and increase costs
• With social security, elderly parents need fewer children to support them
• Greater education allows women to enter the labor force, with less emphasis on child rearing
6-45

© 2010 Pearson Education Canada
Female literacy is associated with birth rates
6-46

© 2010 Pearson Education Canada
• Poorer societies have higher growth rates than wealthier societies
- Consistent with the demographic transition theory
- They have higher fertility and growth rates, with lower contraceptive use
• 99% of the next billion people added will be born in poor, less developed regions that are least able to support them
• Poverty often results in environmental degradation (e.g. soil degradation, hunting of large mammals)
Poverty is strongly correlated with population growth
6-47

© 2010 Pearson Education Canada
The wealth gap and population growth contribute to conflict
FIGURE 6.19
6-48

© 2010 Pearson Education Canada
Population growth affects the environment
• The IPAT model: I = P x A x T x S
- (I) Our total impact on the environment results from the interaction of:
- (P) Population = individuals need space and resources
- (A) Affluence = greater per capita resource use
- (T) Technology = increased exploitation of resources
- (S) Sensitivity = how sensitive an area is to human pressure
6-49

© 2010 Pearson Education Canada
Population distribution• Humans are unevenly distributed around the globe
- Unpopulated areas tend to be environmentally sensitive (high S value in the IPAT equation)
FIGURE 6.9
6-50

© 2010 Pearson Education Canada
Summary• The human population is larger than at any time in the past
• However, the rate of growth has decreased because of:
- Demographics
- Better rights for women
• How will the population stop rising?
- demographic transitions
- governmental intervention
- disease
- social conflict
6-51

© 2010 Pearson Education Canada
QUESTION: ReviewWhat has accounted for the majority of the world’s population growth in recent years?
a) Women are having more babies
b) Death rates have dropped due to technology, medicine, and food
c) More women are using contraceptives
d) Nothing, the population has dropped in recent years
6-52

© 2010 Pearson Education Canada
QUESTION: Review
According to the I = P x A x T formula, what would happen if China’s 1 billion people had a lifestyle like Canadians?
a) Their population would automatically drop
b) Their population would automatically increase
c) Their affluence and technology would increase
d) Their impact on the environment would even out
6-53

© 2010 Pearson Education Canada
QUESTION: Review
How have humans been able to raise the environment’s carrying capacity for our species?
a) Through technology
b) By eliminating limiting factors
c) Through increased consumption
d) Spending more money on non-essential resources
6-54

© 2010 Pearson Education Canada
QUESTION: Review
Areas that lack significant numbers of people, and have a low population density are…
a) No longer available
b) Best able to support higher densities of people
c) Sensitive areas least able to support high densities of people
d) Located around tropical and grassland areas
6-55

© 2010 Pearson Education Canada
QUESTION: ReviewDescribe the relationship between growth rates and population size.
a) Falling growth rates automatically mean a smaller population
b) Falling growth rates automatically mean a larger population
c) Falling growth rates means we no longer have a population problem
d) Falling growth rates does not mean a smaller population, but that rates of increase are slowing
6-56

© 2010 Pearson Education Canada
QUESTION: Weighing the Issues
Would you rather live in a country with a larger population or smaller population?
a) Small population, so there will be more resources for me
b) Small population, so there will be more resources for others, including wildlife
c) Large population, so I can find a date
d) Large population, because people are our biggest resource
6-57

© 2010 Pearson Education Canada
QUESTION: Interpreting Graphs and Data
a) High birth and death rates rise cause population increases
b) High birth and death rates, but population is stable
c) High birth rates with low death rates cause population to increase
d) Low birth and death rates cause the population to decrease
What happens during the “pre-industrial” stage of the demographic transition?
FIGURE 6.14
6-58

© 2010 Pearson Education Canada
QUESTION: Interpreting Graphs and Data
According to this age pyramid, Madagascar’s future population will be…?
a) Balancedb) Largerc) Much largerd) Smallere) Much smaller
FIGURE 6.10
6-59

© 2010 Pearson Education Canada
QUESTION: Interpreting Graphs and DataAccording to these graphs, which countries had access to family planning?
a) Iraq and Pakistanb) Malawi and Haitic) Malawi and Kenyad) Kenya and Bangladesh
6-60
Top Related