Zurich Open Repository and Year: 2011 - UZH
15
Zurich Open Repository and Archive University of Zurich Main Library Strickhofstrasse 39 CH-8057 Zurich www.zora.uzh.ch Year: 2011 Toward the storage metabolome: profling the barley vacuole Tohge, T ; Ramos, M S ; Nunes-Nesi, A ; Mutwil, M ; Giavalisco, P ; Steinhauser, D ; Schellenberg, M ; Willmitzer, L ; Persson, S ; Martinoia, E ; Fernie, A R Abstract: While recent years have witnessed dramatic advances in our capacity to identify and quan- tify an ever-increasing number of plant metabolites, our understanding of how metabolism is spatially regulated is still far from complete. In an attempt to partially address this question, we studied the storage metabolome of the barley (Hordeum vulgare) vacuole. For this purpose, we used highly purifed vacuoles isolated by silicon oil centrifugation and compared their metabolome with that found in the mesophyll protoplast from which they were derived. Using a combination of gas chromatography-mass spectrometry and Fourier transform-mass spectrometry, we were able to detect 59 (primary) metabolites for which we know the exact chemical structure and a further 200 (secondary) metabolites for which we have strong predicted chemical formulae. Taken together, these metabolites comprise amino acids, organic acids, sugars, sugar alcohols, shikimate pathway intermediates, vitamins, phenylpropanoids, and favonoids. Of the 259 putative metabolites, some 12 were found exclusively in the vacuole and 34 were found exclusively in the protoplast, while 213 were common in both samples. When analyzed on a quantitative basis, however, there is even more variance, with more than 60 of these compounds being present above the detection limit of our protocols. The combined data were also analyzed with respect to the tonoplast proteome in an attempt to infer specifcities of the transporter proteins embedded in this membrane. Following comparison with recent observations made using nonaqueous fractionation of Arabidopsis (Arabidopsis thaliana), we discuss these data in the context of current models of metabolic compartmentation in plants. DOI: https://doi.org/10.1104/pp.111.185710 Posted at the Zurich Open Repository and Archive, University of Zurich ZORA URL: https://doi.org/10.5167/uzh-53837 Journal Article Published Version Originally published at: Tohge, T; Ramos, M S; Nunes-Nesi, A; Mutwil, M; Giavalisco, P; Steinhauser, D; Schellenberg, M; Willmitzer, L; Persson, S; Martinoia, E; Fernie, A R (2011). Toward the storage metabolome: profling the barley vacuole. Plant Physiology, 157(3):1469-82. DOI: https://doi.org/10.1104/pp.111.185710
Transcript of Zurich Open Repository and Year: 2011 - UZH
Zurich Open Repository andArchiveUniversity of ZurichMain LibraryStrickhofstrasse 39CH-8057 Zurichwww.zora.uzh.ch
Year: 2011
Toward the storage metabolome: profiling the barley vacuole
Tohge, T ; Ramos, M S ; Nunes-Nesi, A ; Mutwil, M ; Giavalisco, P ; Steinhauser, D ; Schellenberg, M ;Willmitzer, L ; Persson, S ; Martinoia, E ; Fernie, A R
Abstract: While recent years have witnessed dramatic advances in our capacity to identify and quan-tify an ever-increasing number of plant metabolites, our understanding of how metabolism is spatiallyregulated is still far from complete. In an attempt to partially address this question, we studied thestorage metabolome of the barley (Hordeum vulgare) vacuole. For this purpose, we used highly purifiedvacuoles isolated by silicon oil centrifugation and compared their metabolome with that found in themesophyll protoplast from which they were derived. Using a combination of gas chromatography-massspectrometry and Fourier transform-mass spectrometry, we were able to detect 59 (primary) metabolitesfor which we know the exact chemical structure and a further 200 (secondary) metabolites for whichwe have strong predicted chemical formulae. Taken together, these metabolites comprise amino acids,organic acids, sugars, sugar alcohols, shikimate pathway intermediates, vitamins, phenylpropanoids, andflavonoids. Of the 259 putative metabolites, some 12 were found exclusively in the vacuole and 34 werefound exclusively in the protoplast, while 213 were common in both samples. When analyzed on aquantitative basis, however, there is even more variance, with more than 60 of these compounds beingpresent above the detection limit of our protocols. The combined data were also analyzed with respectto the tonoplast proteome in an attempt to infer specificities of the transporter proteins embedded inthis membrane. Following comparison with recent observations made using nonaqueous fractionation ofArabidopsis (Arabidopsis thaliana), we discuss these data in the context of current models of metaboliccompartmentation in plants.
DOI: https://doi.org/10.1104/pp.111.185710
Posted at the Zurich Open Repository and Archive, University of ZurichZORA URL: https://doi.org/10.5167/uzh-53837Journal ArticlePublished Version
Originally published at:Tohge, T; Ramos, M S; Nunes-Nesi, A; Mutwil, M; Giavalisco, P; Steinhauser, D; Schellenberg, M;Willmitzer, L; Persson, S; Martinoia, E; Fernie, A R (2011). Toward the storage metabolome: profilingthe barley vacuole. Plant Physiology, 157(3):1469-82.DOI: https://doi.org/10.1104/pp.111.185710
Toward the Storage Metabolome: Profilingthe Barley Vacuole1[W][OA]
Takayuki Tohge2, Magali Schnell Ramos2, Adriano Nunes-Nesi, Marek Mutwil, Patrick Giavalisco,Dirk Steinhauser, Maja Schellenberg, Lothar Willmitzer, Staffan Persson,Enrico Martinoia, and Alisdair R. Fernie*
Max-Planck-Institute for Molecular Plant Physiology, 14476 Potsdam, Germany (T.T., A.N.-N., M.M., P.G.,D.S., L.W., S.P., A.R.F.); Institute of Plant Biology, University of Zurich, 8008 Zurich, Switzerland (M.S.R.,M.S., E.M.); Institut des Sciences du Vegetal, CNRS, 91198 Gif-sur-Yvette, France (M.S.R.); and KingAbdulaziz University, Jeddah 21589, Saudi Arabia (L.W.)
While recent years have witnessed dramatic advances in our capacity to identify and quantify an ever-increasing number ofplant metabolites, our understanding of how metabolism is spatially regulated is still far from complete. In an attempt topartially address this question, we studied the storage metabolome of the barley (Hordeum vulgare) vacuole. For this purpose,we used highly purified vacuoles isolated by silicon oil centrifugation and compared their metabolome with that found in themesophyll protoplast from which they were derived. Using a combination of gas chromatography-mass spectrometry andFourier transform-mass spectrometry, we were able to detect 59 (primary) metabolites for which we know the exact chemicalstructure and a further 200 (secondary) metabolites for which we have strong predicted chemical formulae. Taken together,these metabolites comprise amino acids, organic acids, sugars, sugar alcohols, shikimate pathway intermediates, vitamins,phenylpropanoids, and flavonoids. Of the 259 putative metabolites, some 12 were found exclusively in the vacuole and 34 werefound exclusively in the protoplast, while 213 were common in both samples. When analyzed on a quantitative basis, however,there is even more variance, with more than 60 of these compounds being present above the detection limit of our protocols.The combined data were also analyzed with respect to the tonoplast proteome in an attempt to infer specificities of thetransporter proteins embedded in this membrane. Following comparison with recent observations made using nonaqueousfractionation of Arabidopsis (Arabidopsis thaliana), we discuss these data in the context of current models of metaboliccompartmentation in plants.
Technological developments in the last decadehave rendered metabolomics, the comprehensive studyof small molecule metabolites, an important func-tional genomic tool (Fiehn, 2002; Sumner et al., 2003;Weckwerth, 2003; Farre et al., 2006; Matsuda et al.,2009; Saito and Matsuda, 2010). It is currently widelyapplied for a variety of purposes, ranging from sim-ple diagnostic applications (Catchpole et al., 2005;Tikunov et al., 2005; Baker et al., 2006; Scherling et al.,2009) and gene functional annotation (Tohge et al.,2005, 2007) to being an important component insystems biology-oriented research (Fernie et al.,
2004; Saito and Matsuda, 2010). Metabolomics hasadditionally found great utility in the characteriza-tion of the metabolic response of plant cells to a rangeof biotic and environmental stresses (Cook et al.,2004; Hirai et al., 2004; Kaplan et al., 2004; Ishizakiet al., 2005; Urbanczyk-Wochniak and Fernie, 2005;Roessner et al., 2006; Yamaguchi-Shinozaki andShinozaki, 2006; Lehmann et al., 2009). However,despite the many important breakthroughs facilitatedby this technology, we remain somewhat hamperedin our understanding by our inability to gain high-resolution spatial data on metabolism (Stitt andFernie, 2003; Fernie, 2007; Lunn, 2007).
Generally, metabolism is treated in a tissue-specificmanner but cells within a tissue are treated as homog-enous. Given that there are around 40 different celltypes in plants (Goldberg, 1988; Martin et al., 2001),this is clearly an oversimplification. Recent technicaladvances and the widespread adoption of the GUSfusion protein expression approach (Sundaresanet al., 1995) as well as the increasing availability of re-sources such as Genevestigator and the BAR databases(Zimmermann et al., 2004; Brady and Provart, 2009),however, have made the identification of cell typespecificity of gene expression facile. These develop-ments have been paralleled by the increasing use of so-
1 This work was supported by the Alexander von HumboldtFoundation (to T.T.).
2 These authors contributed equally to the article.* Corresponding author; e-mail [email protected] author responsible for distribution of materials integral to the
findings presented in this article in accordance with the policydescribed in the Instructions for Authors (www.plantphysiol.org) is:Alisdair R. Fernie ([email protected]).
[W] The online version of this article contains Web-only data.[OA] Open Access articles can be viewed online without a sub-
scription.www.plantphysiol.org/cgi/doi/10.1104/pp.111.185710
Plant Physiology�, November 2011, Vol. 157, pp. 1469–1482, www.plantphysiol.org � 2011 American Society of Plant Biologists. All Rights Reserved. 1469
called single cell techniques, allowing microdissectionof tissues into their constituent cell types (Schad et al.,2005; Cai and Lashbrook, 2006; Obel et al., 2009). Theseadvances hold great promise for being able to betteruntangle metabolism at the cell type level, and ametabolite interface for the BAR gene expression atlashas indeed recently been published (Matsuda et al.,2009).
Going to even higher levels of resolution allows theanalysis of subcellular and even suborganellar aspectsof metabolism. Generally, the spatial distribution ofmetabolites mirrors that of the proteins involved intheir metabolism. Given the large number of reportsconcerning plant organellar proteomes (Igamberdievet al., 2001; Millar et al., 2001; Carter et al., 2004;Kleffmann et al., 2004; Pendle et al., 2005; Reumannet al., 2007) and the availability of the SUBA databaseof protein localization (Heazlewood et al., 2007), itshould be relatively easy to predict the location andoperation of metabolic pathways. However, the factsof organelle-specific isoforms and dual targeting ofproteins often result in the duplication of metabolicreactions within different compartments of the cell(Carrari et al., 2003; Millar et al., 2006). Furthermore,several instances exist in which proteins are foundin locations other than where they were thought tooperate; for example, hexokinase proteins have beenfound in the nucleus, while the Suc synthase has beenlocalized to the mitochondria (Subbaiah et al., 2006;Cho et al., 2007). These observations thus render suchpredictions of metabolite localization, on the basis ofprotein localization alone, liable to error. Moreover, forstudies aimed at understanding the function of thevacuole, which is largely metabolically inert, such anassociation-based approach is likely to be highly dif-ficult. At present, there are three different approachesfor the direct determination of subcellular metabolitecontents: the expression of genetically encodedmarkerproteins (Fehr et al., 2002), the nonaqueous fractiona-tion technique (Gerhardt et al., 1983), and silicon oilcentrifugation of protoplasts (Igamberdiev et al., 2001).The first of these requires the construction and expres-sion of several variants of a marker protein for eachindividual metabolite and thus is not tractable at themetabolome level. The second approach has alreadybeen coupled to plant cells and proved to be highlyinformative in characterizing transgenic potato (Sola-num tuberosum) plants exhibiting alterations in the Suc-to-starch pathway (Farre et al., 2001, 2006). For thethird approach, several proteome studies of the vacu-ole have been presented for Arabidopsis (Arabidopsisthaliana; Carter et al., 2004; Shimaoka et al., 2004;Jaquinod et al., 2007). Our study, however, is focusedon barley (Hordeum vulgare), since it is our experiencethat the purity of vacuoles isolated from this speciesexceeds that from any other species. To this end, weisolated pure vacuoles from protoplasts derived frombarley leaves and compared the metabolome of theseorganelles with that of the protoplast populationfrom which they were derived using a combination
of gas chromatography-mass spectrometry (GC-MS)and liquid chromatography-Fourier transform-massspectrometry (LC-FT-MS). We were able to provideinformation concerning 61 metabolites of confirmedchemical structure and a further 135 putative metabo-lites on the basis of their chemical formulae and assesstheir partitioning between the vacuolar and extravac-uolar parts of the cell. Finally, the data were comparedwith literature values obtained by the nonaqueousfractionation approach and in relation to tonoplasttransporters described in the literature (Martinoiaet al., 2000, 2007; Kaspar et al., 2010) as well as withdata recently published concerning the vacuolar ion-ome (Smart et al., 2011).
RESULTS
Isolation of the Barley Vacuole from Protoplast
To investigate vacuole metabolomics, barley vacu-oles were purified from barley protoplast. Barleymesophyll protoplasts were prepared using fresh bar-ley leaves grown in a greenhouse for 8 d. Isolation andpurification of mesophyll protoplasts and vacuoleswere performed as described previously (Endler et al.,2009). In order to get rid of the isolation solution,an additional centrifugation step, as described in“Materials and Methods,” was included. Protoplastsamples were prepared as three replicates (P1– P3)and vacuole samples were prepared as six replicates(V1–V6) to evaluate biological and experimental var-iance. Purified vacuole fractions were assessed bya-mannosidase enzymatic activity, which is knownas vacuole-specific enzyme (Boller and Kende, 1979),and chlorophyll content for evaluation of the contam-ination of chloroplast. Four independent sets of vacu-ole preparations resulted in 70 6 29 milliunits mL21
(vacuole fractions) and 22 6 4 milliunits mL21 (proto-plast fractions) of a-mannosidase enzymatic activityand no (vacuole fractions) and 293 6 52 mg mL21
(protoplast fractions) of chlorophyll content, respec-tively. The liquid samples were lyophilized andextracted by 80% methanol for preliminary check byGC-MS analyses. These preparations rendered highreproducibility of metabolite data between experi-ments. To obtain enough sample for split use in bothMS-based analyses, the fractions derived from a singlesample set were frozen overnight, and after defreez-ing, 45 mL of the aqueous solution from each tube (50–60 tubes per experiment) was recovered and pooled(vacuole fraction, 77 milliunits mL21 of a-mannosidaseenzymatic activity, no chlorophyll content; protoplastfraction, 23 milliunits mL21 and 272 mg mL21, respec-tively). The pooled fractions were lyophilized andused for the metabolomic analysis. The variance of dryweight between replicates was 8.076 0.36 mg (vacuolesamples; n = 6) and 8.13 6 0.60 mg (protoplast; n = 3).For the metabolomic studies, lyophilized sampleswere extracted by 80% methanol for split use to bothMS-based analyses.
Tohge et al.
1470 Plant Physiol. Vol. 157, 2011
Global Difference and Fraction-Specific Peaks
Metabolite profiles were analyzed by GC-time offlight-MS for primary metabolites (Lisec et al., 2006)and LC-MS for secondary metabolites (Tohge andFernie, 2010). The resultant data were combined intoa single data matrix for multivariate analyses. First, weperformed principal component analysis to visualizethe extent of metabolomic changes between protoplastsamples and vacuole samples (Supplemental Fig. S1A).Since a clear separation between the protoplast sam-ples and vacuole samples was observed in PC1(74.9%), we subsequently performed a Venn diagramanalysis to illustrate the levels of commonality anddifference between samples (Supplemental Fig. S1A).In total, 259 peaks were detected by GC-MS and LC-MS. Twelve peaks detected by LC-MS were exclu-sively detected in the vacuole samples (SupplementalTable S1). On the other hand, 34 peaks were observedas protoplast-specific peaks, meaning that 213 peakswere detected in both fractions. Given that the subcel-lular vacuole volume of barley leaves has been definedto be 60.5% of the total cell volume (Winter et al., 1993),we defined those compounds that were abundant atpercentages above 60% in vacuole as “vacuolar accu-mulated.” Ninety-nine peaks were detected at highrelative abundance (more than 1.5-fold change [FC]) inthe vacuole samples, while 62 peaks were detected atlow relative abundance (less than 0.5 FC). It is impor-tant to bear in mind here that vacuole-specific peakscould, in principle, also be detected in protoplast sam-ples. For those that were solely detected in the vac-uole, it thus seems likely that their levels were underthe limit of detection in our protoplast samples. Bycontrast, protoplast-specific peaks suggest that thesemetabolites are not transported into the vacuole.
Metabolite Profiling of Primary Metabolites by GC-MS
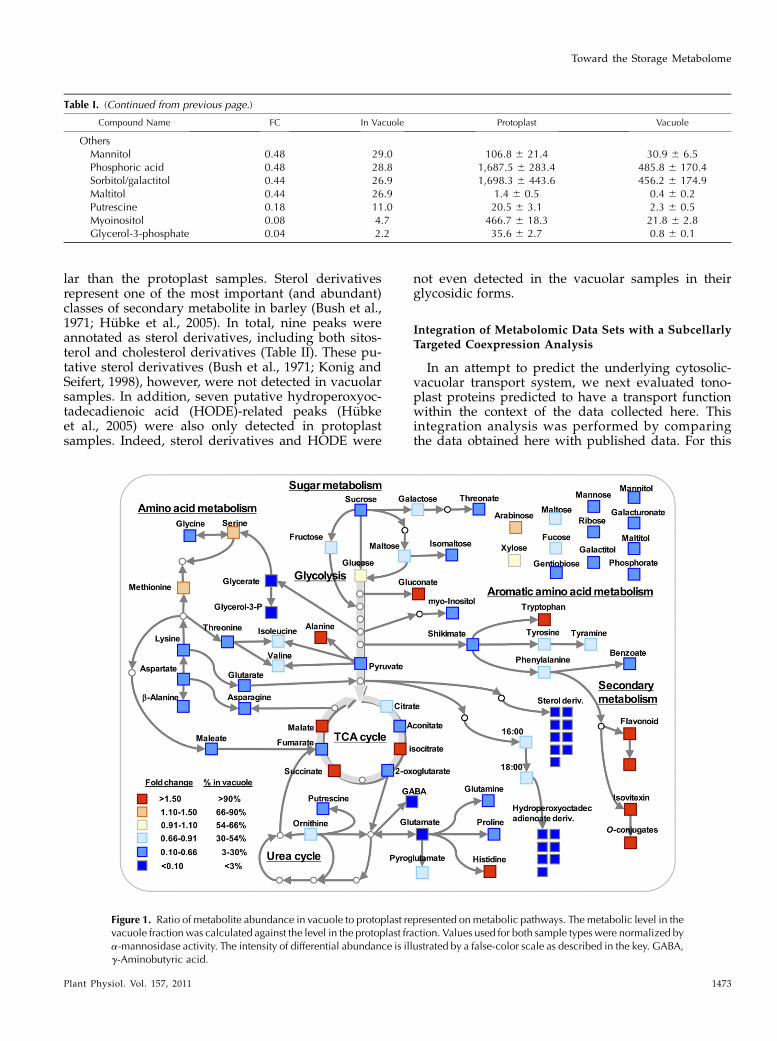
As stated above, measurements of the relative levelsof primary metabolites were performed by GC-MS(Lisec et al., 2006), and the absolute levels of 59 com-pounds were estimated based on concentration curvesof authentic standard that were run side by side withthe samples (Table I). The results show that the vacuoleaccumulates a large variety of different compounds:sugars, sugar alcohols, organic acids, and amino acids.A total of 22 amino acids and their related compoundswere determined in vacuolar and protoplast samples.Three of them had higher vacuolar than protoplastlevels (more than 90% of compound in the vacuole,more than 1.5 FC), seven were invariant (30%–90%,0.5–1.5 FC), and seven displayed a lower vacuolarlevel (less than 30%, less than 0.5 FC; Table I; Fig. 1).Interestingly, His and Ala were highly more abundantin the barley vacuole than in the protoplast, followedby Trp (1.53 FC), Met (1.43 FC), and Ser (1.24 FC). Therelative amounts of Glu (less than 0.02 FC), Pro (0.09FC), Gln (0.10 FC), and Asp (0.12 FC) were very lowinside the vacuole. The levels of other amino acids,
such as Orn, Tyr, Ile, tyramine, Val, Phe, pyro-Glu, andGly, were invariant. Additionally, we were also able todetermine g-aminobutyric acid amounts in both sam-ples, but at higher levels in the protoplast samples(Table I; Fig. 1).
Several of the organic acids measured had highervacuolar than protoplast levels (Table I). Higher levelsof the tricarboxylic acid (TCA) cycle intermediatesisocitrate, malate, succinate, and gluconate were ob-served in vacuoles. The levels of aconitate, glycerate,2-oxoglutarate, galacturonate, shikimate, maleate, glu-tarate, pyruvate, benzoate, fumarate, aconitate, andthreonate, however, were lower in the vacuole samples(Table I; Fig. 1).
We were additionally able to detect several sugars inthe vacuole samples (Table I; Fig. 1). Monosaccharidessuch as Ara exhibited higher levels in vacuolar thanprotoplast samples. Interestingly, the level of Suc wasless abundant in vacuole samples. Several other sugars,namely Glc, Xyl, Fru, Gal, and maltose, were alsofound at abundant levels within the vacuole.
Additional nitrogen-containing metabolites werealso detected in the vacuole samples, including pu-trescine (Table I; Fig. 1). The purine derivative ade-nine displayed higher levels in protoplast samples,whereas putrescine and urea levels were invariantbetween sample types. Among the other compoundsanalyzed, it is interesting that the levels of intermedi-ates involved in membrane biogenesis, such as C16:0and C18:0 fatty acids, were lower in vacuole samples(Table II).
Metabolite Profiling of Secondary Metabolites by LC-MS
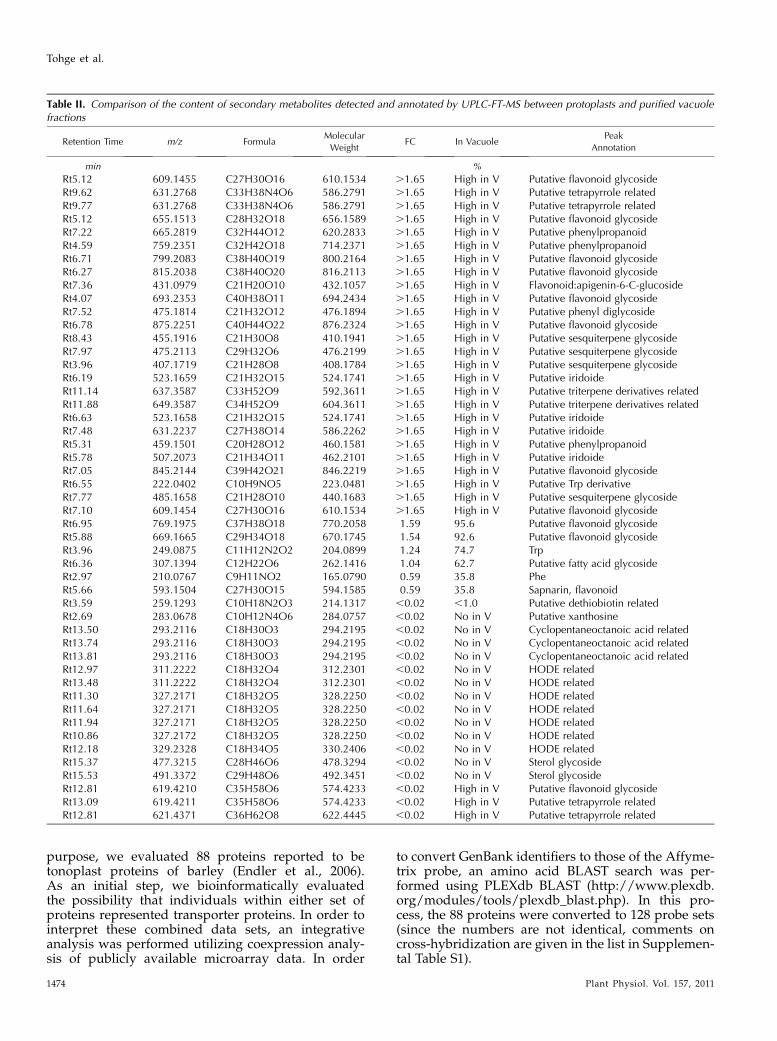
Next, ultra-performance liquid chromatography(UPLC)-FT-MS analysis was performed for the deter-mination of secondary metabolite contents in the dif-ferent samples. Detected peaks were identified andannotated by a combined usage of standard com-pounds, database surveys on the basis of accuratemass-to-charge ratio (m/z) values as analyzed by FT-MS (Giavalisco et al., 2009; Horai et al., 2010), andcomparison between coelution analysis with well-analyzed plant extracts such as Arabidopsis (Tohgeet al., 2005; Nakabayashi et al., 2010) and tomato(Solanum lycopersicum) fruits (Moco et al., 2006; Iijimaet al., 2008). By UPLC-FT-MS analysis, 200 peaks weredetected in total. Twelve of these peaks were unde-tected in the protoplast samples, whereas 34 peakswere undetected in the vacuolar samples (Supplemen-tal Table S1). Both Phe and Trp displayed similarrelative levels as analyzed by GC-MS. Of 12 vacuole-specific peaks, four peaks were annotated as glyco-flavone derivatives (Table II). The major flavonoidisovitexin (Kaspar et al., 2010), which was identified bystandard compound confirmation, was also highlydetected in vacuolar samples. In addition, analysis ofthe other six glycoflavone derivatives annotatedby UPLC-FT-MS revealed that all putative glycoflavonederivatives were more highly abundant in the vacuo-
Toward the Storage Metabolome
Plant Physiol. Vol. 157, 2011 1471

Table I. Metabolite contents of barley protoplasts and vacuole samples
Values are presented as means 6 SD of determinations on six replicates of vacuole fractions and three protoplast fractions. Percentage of contentlevels in vacuole was calculated by a-mannosidase activity. Given that the subcellular vacuole volume of barley leaves has been defined to be60.5% of the total cell volume (Winter et al., 1993), we defined those compounds that were abundant at percentages above 60% in vacuole asvacuolar accumulated.
Compound Name FC In Vacuole Protoplast Vacuole
% nmol L21 protoplast
Amino acids and derivativesHis .1.65 .100 5.6 6 1.7 21.9 6 9.8Ala .1.65 .100 1,981.6 6 127.6 4,789.2 6 1,415.7Trp 1.53 92.4 47.5 6 3.9 43.9 6 7.6Met 1.43 86.7 22.4 6 2.6 19.4 6 2.1Ser 1.24 75.2 4,190.2 6 392.4 3,150.2 6 1069.6Orn 0.79 47.6 15.9 6 0.6 7.6 6 1.6Tyr 0.78 47.4 1,612.4 6 46.5 765.0 6 92.7Ile 0.78 46.9 1,848.5 6 111.8 867.5 6 150.4Tyramine 0.65 39.4 12.8 6 1.4 5.0 6 0.8Val 0.56 33.6 4,063.4 6 442.1 1,364.0 6 304.9Phe 0.55 33.1 734.0 6 29.0 242.9 6 38.8Pyro-Glu 0.51 30.6 1,583.2 6 160.2 484.6 6 63.5Gly 0.43 26.2 1,949.2 6 258.2 509.8 6 131.9Asn 0.35 21.4 980.2 6 176.1 209.4 6 103.4Thr 0.33 20.2 4,169.7 6 233.1 842.4 6 99.1Lys 0.31 18.9 1,028.3 6 54.6 193.9 6 42.7b-Ala 0.31 18.6 143.6 6 10.0 26.6 6 2.4Asp 0.12 7.5 1,358.7 6 882.7 102.5 6 17.9Gln 0.10 5.8 990.8 6 97.8 57.1 6 9.5Pro 0.09 5.2 62.2 6 11.3 3.3 6 0.8g-Aminobutyric acid ,0.02 ,1 1,3381.1 6 784.5 101.4 6 7.9Glu ,0.02 ,1 98.8 6 15.8 0.4 6 0.1
Organic acidsIsocitric acid .1.65 .100 114.0 6 1.9 1,080.0 6 900.3Malic acid .1.65 .100 2,974.1 6 78.5 6,352.5 6 834.2Succinic acid .1.65 .100 3,229.1 6 126.5 3,709.9 6 1,126.6Gluconic acid 1.52 92.2 2,911.7 6 388.1 2,685.9 6 534.6Citric acid 0.56 33.9 126.1 6 16.6 42.7 6 7.3Threonic acid 0.46 27.8 20.5 6 2.4 5.7 6 1.3Aconitic acid 0.44 26.6 9.5 6 1.6 2.5 6 0.6Fumaric acid 0.40 23.9 179.4 6 35.4 42.9 6 12.2Benzoic acid 0.39 23.6 61.5 6 14.2 14.5 6 4.9Pyruvic acid 0.39 23.3 23.5 6 3.0 5.5 6 0.9Glutaric acid 0.31 18.9 0.5 6 0.2 0.1 6 0.1Maleic acid 0.23 14.0 65.4 6 17.3 9.1 6 2.4Shikimic acid 0.21 12.9 2.2 6 0.3 0.3 6 0.1GalUA 0.12 7.3 351.5 6 54.6 25.6 6 7.22-Oxoglutarate 0.11 6.9 3.3 6 1.1 0.2 6 0.1Glyceric acid 0.04 2.7 544.7 6 58.8 14.8 6 1.6
SugarsAra 1.44 87.2 7.9 6 0.9 6.9 6 1.2Glc 1.01 61.4 385.1 6 46.7 236.4 6 41.2Xyl 0.94 57.0 6.4 6 0.8 3.6 6 0.6Fru 0.84 51.0 28.3 6 3.4 14.4 6 2.7Gal 0.65 39.1 4.7 6 1.7 1.9 6 0.9Maltose 0.50 30.5 13.9 6 1.8 4.2 6 0.6Gentiobiose 0.43 26.2 11.9 6 2.9 3.1 6 0.5Fuc 0.42 25.5 15.9 6 2.2 4.0 6 0.8Man 0.39 23.3 1.4 6 0.3 0.3 6 0.0Isomaltose 0.38 23.1 3.9 6 0.4 0.9 6 0.2Rib 0.37 22.3 6.0 6 0.9 1.3 6 0.2Suc 0.13 7.8 54.9 6 6.2 4.3 6 0.7
Fatty acids18:00 0.57 34.7 316.9 6 81.4 110.1 6 43.016:00 0.53 32.0 305.3 6 82.7 97.6 6 40.6
(Table continues on following page.)
Tohge et al.
1472 Plant Physiol. Vol. 157, 2011
lar than the protoplast samples. Sterol derivativesrepresent one of the most important (and abundant)classes of secondary metabolite in barley (Bush et al.,1971; Hubke et al., 2005). In total, nine peaks wereannotated as sterol derivatives, including both sitos-terol and cholesterol derivatives (Table II). These pu-tative sterol derivatives (Bush et al., 1971; Konig andSeifert, 1998), however, were not detected in vacuolarsamples. In addition, seven putative hydroperoxyoc-tadecadienoic acid (HODE)-related peaks (Hubkeet al., 2005) were also only detected in protoplastsamples. Indeed, sterol derivatives and HODE were
not even detected in the vacuolar samples in theirglycosidic forms.
Integration of Metabolomic Data Sets with a SubcellarlyTargeted Coexpression Analysis
In an attempt to predict the underlying cytosolic-vacuolar transport system, we next evaluated tono-plast proteins predicted to have a transport functionwithin the context of the data collected here. Thisintegration analysis was performed by comparingthe data obtained here with published data. For this
Table I. (Continued from previous page.)
Compound Name FC In Vacuole Protoplast Vacuole
OthersMannitol 0.48 29.0 106.8 6 21.4 30.9 6 6.5Phosphoric acid 0.48 28.8 1,687.5 6 283.4 485.8 6 170.4Sorbitol/galactitol 0.44 26.9 1,698.3 6 443.6 456.2 6 174.9Maltitol 0.44 26.9 1.4 6 0.5 0.4 6 0.2Putrescine 0.18 11.0 20.5 6 3.1 2.3 6 0.5Myoinositol 0.08 4.7 466.7 6 18.3 21.8 6 2.8Glycerol-3-phosphate 0.04 2.2 35.6 6 2.7 0.8 6 0.1
Figure 1. Ratio of metabolite abundance in vacuole to protoplast represented on metabolic pathways. The metabolic level in thevacuole fraction was calculated against the level in the protoplast fraction. Values used for both sample typeswere normalized bya-mannosidase activity. The intensity of differential abundance is illustrated by a false-color scale as described in the key. GABA,g-Aminobutyric acid.
Toward the Storage Metabolome
Plant Physiol. Vol. 157, 2011 1473
purpose, we evaluated 88 proteins reported to betonoplast proteins of barley (Endler et al., 2006).As an initial step, we bioinformatically evaluatedthe possibility that individuals within either set ofproteins represented transporter proteins. In order tointerpret these combined data sets, an integrativeanalysis was performed utilizing coexpression analy-sis of publicly available microarray data. In order
to convert GenBank identifiers to those of the Affyme-trix probe, an amino acid BLAST search was per-formed using PLEXdb BLAST (http://www.plexdb.org/modules/tools/plexdb_blast.php). In this pro-cess, the 88 proteins were converted to 128 probe sets(since the numbers are not identical, comments oncross-hybridization are given in the list in Supplemen-tal Table S1).
Table II. Comparison of the content of secondary metabolites detected and annotated by UPLC-FT-MS between protoplasts and purified vacuolefractions
Retention Time m/z FormulaMolecular
WeightFC In Vacuole
Peak
Annotation
min %
Rt5.12 609.1455 C27H30O16 610.1534 .1.65 High in V Putative flavonoid glycosideRt9.62 631.2768 C33H38N4O6 586.2791 .1.65 High in V Putative tetrapyrrole relatedRt9.77 631.2768 C33H38N4O6 586.2791 .1.65 High in V Putative tetrapyrrole relatedRt5.12 655.1513 C28H32O18 656.1589 .1.65 High in V Putative flavonoid glycosideRt7.22 665.2819 C32H44O12 620.2833 .1.65 High in V Putative phenylpropanoidRt4.59 759.2351 C32H42O18 714.2371 .1.65 High in V Putative phenylpropanoidRt6.71 799.2083 C38H40O19 800.2164 .1.65 High in V Putative flavonoid glycosideRt6.27 815.2038 C38H40O20 816.2113 .1.65 High in V Putative flavonoid glycosideRt7.36 431.0979 C21H20O10 432.1057 .1.65 High in V Flavonoid:apigenin-6-C-glucosideRt4.07 693.2353 C40H38O11 694.2434 .1.65 High in V Putative flavonoid glycosideRt7.52 475.1814 C21H32O12 476.1894 .1.65 High in V Putative phenyl diglycosideRt6.78 875.2251 C40H44O22 876.2324 .1.65 High in V Putative flavonoid glycosideRt8.43 455.1916 C21H30O8 410.1941 .1.65 High in V Putative sesquiterpene glycosideRt7.97 475.2113 C29H32O6 476.2199 .1.65 High in V Putative sesquiterpene glycosideRt3.96 407.1719 C21H28O8 408.1784 .1.65 High in V Putative sesquiterpene glycosideRt6.19 523.1659 C21H32O15 524.1741 .1.65 High in V Putative iridoideRt11.14 637.3587 C33H52O9 592.3611 .1.65 High in V Putative triterpene derivatives relatedRt11.88 649.3587 C34H52O9 604.3611 .1.65 High in V Putative triterpene derivatives relatedRt6.63 523.1658 C21H32O15 524.1741 .1.65 High in V Putative iridoideRt7.48 631.2237 C27H38O14 586.2262 .1.65 High in V Putative iridoideRt5.31 459.1501 C20H28O12 460.1581 .1.65 High in V Putative phenylpropanoidRt5.78 507.2073 C21H34O11 462.2101 .1.65 High in V Putative iridoideRt7.05 845.2144 C39H42O21 846.2219 .1.65 High in V Putative flavonoid glycosideRt6.55 222.0402 C10H9NO5 223.0481 .1.65 High in V Putative Trp derivativeRt7.77 485.1658 C21H28O10 440.1683 .1.65 High in V Putative sesquiterpene glycosideRt7.10 609.1454 C27H30O16 610.1534 .1.65 High in V Putative flavonoid glycosideRt6.95 769.1975 C37H38O18 770.2058 1.59 95.6 Putative flavonoid glycosideRt5.88 669.1665 C29H34O18 670.1745 1.54 92.6 Putative flavonoid glycosideRt3.96 249.0875 C11H12N2O2 204.0899 1.24 74.7 TrpRt6.36 307.1394 C12H22O6 262.1416 1.04 62.7 Putative fatty acid glycosideRt2.97 210.0767 C9H11NO2 165.0790 0.59 35.8 PheRt5.66 593.1504 C27H30O15 594.1585 0.59 35.8 Sapnarin, flavonoidRt3.59 259.1293 C10H18N2O3 214.1317 ,0.02 ,1.0 Putative dethiobiotin relatedRt2.69 283.0678 C10H12N4O6 284.0757 ,0.02 No in V Putative xanthosineRt13.50 293.2116 C18H30O3 294.2195 ,0.02 No in V Cyclopentaneoctanoic acid relatedRt13.74 293.2116 C18H30O3 294.2195 ,0.02 No in V Cyclopentaneoctanoic acid relatedRt13.81 293.2116 C18H30O3 294.2195 ,0.02 No in V Cyclopentaneoctanoic acid relatedRt12.97 311.2222 C18H32O4 312.2301 ,0.02 No in V HODE relatedRt13.48 311.2222 C18H32O4 312.2301 ,0.02 No in V HODE relatedRt11.30 327.2171 C18H32O5 328.2250 ,0.02 No in V HODE relatedRt11.64 327.2171 C18H32O5 328.2250 ,0.02 No in V HODE relatedRt11.94 327.2171 C18H32O5 328.2250 ,0.02 No in V HODE relatedRt10.86 327.2172 C18H32O5 328.2250 ,0.02 No in V HODE relatedRt12.18 329.2328 C18H34O5 330.2406 ,0.02 No in V HODE relatedRt15.37 477.3215 C28H46O6 478.3294 ,0.02 No in V Sterol glycosideRt15.53 491.3372 C29H48O6 492.3451 ,0.02 No in V Sterol glycosideRt12.81 619.4210 C35H58O6 574.4233 ,0.02 High in V Putative flavonoid glycosideRt13.09 619.4211 C35H58O6 574.4233 ,0.02 High in V Putative tetrapyrrole relatedRt12.81 621.4371 C36H62O8 622.4445 ,0.02 High in V Putative tetrapyrrole related
Tohge et al.
1474 Plant Physiol. Vol. 157, 2011
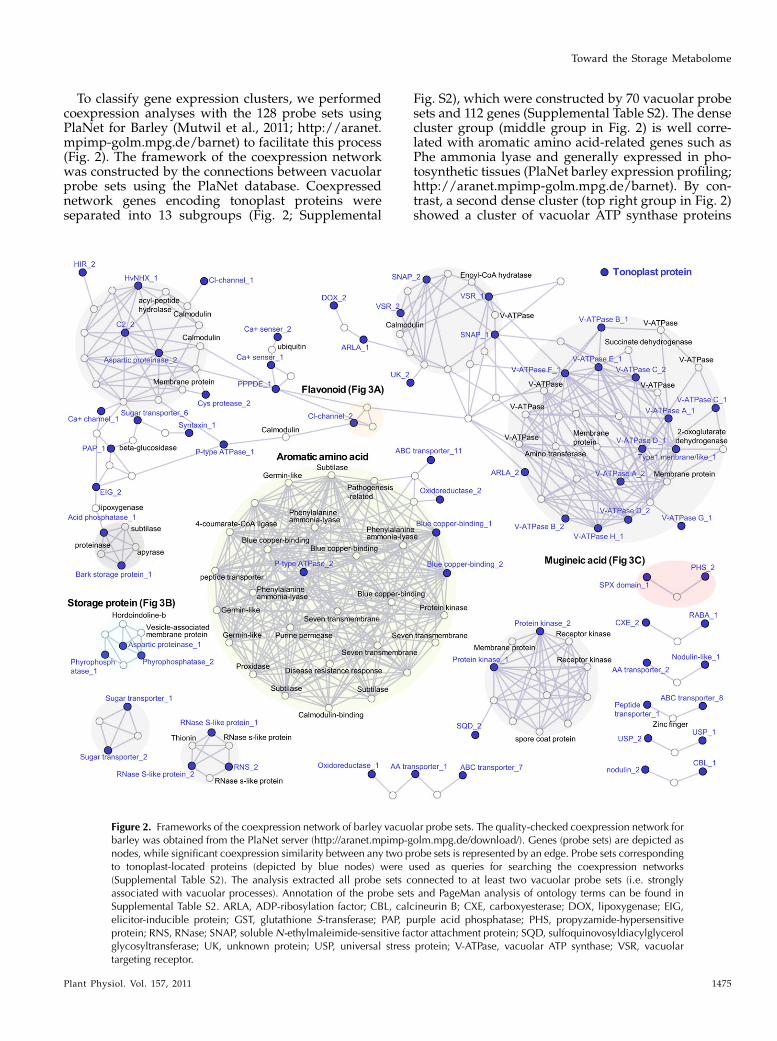
To classify gene expression clusters, we performedcoexpression analyses with the 128 probe sets usingPlaNet for Barley (Mutwil et al., 2011; http://aranet.mpimp-golm.mpg.de/barnet) to facilitate this process(Fig. 2). The framework of the coexpression networkwas constructed by the connections between vacuolarprobe sets using the PlaNet database. Coexpressednetwork genes encoding tonoplast proteins wereseparated into 13 subgroups (Fig. 2; Supplemental
Fig. S2), which were constructed by 70 vacuolar probesets and 112 genes (Supplemental Table S2). The densecluster group (middle group in Fig. 2) is well corre-lated with aromatic amino acid-related genes such asPhe ammonia lyase and generally expressed in pho-tosynthetic tissues (PlaNet barley expression profiling;http://aranet.mpimp-golm.mpg.de/barnet). By con-trast, a second dense cluster (top right group in Fig. 2)showed a cluster of vacuolar ATP synthase proteins
Figure 2. Frameworks of the coexpression network of barley vacuolar probe sets. The quality-checked coexpression network forbarley was obtained from the PlaNet server (http://aranet.mpimp-golm.mpg.de/download/). Genes (probe sets) are depicted asnodes, while significant coexpression similarity between any two probe sets is represented by an edge. Probe sets correspondingto tonoplast-located proteins (depicted by blue nodes) were used as queries for searching the coexpression networks(Supplemental Table S2). The analysis extracted all probe sets connected to at least two vacuolar probe sets (i.e. stronglyassociated with vacuolar processes). Annotation of the probe sets and PageMan analysis of ontology terms can be found inSupplemental Table S2. ARLA, ADP-ribosylation factor; CBL, calcineurin B; CXE, carboxyesterase; DOX, lipoxygenase; EIG,elicitor-inducible protein; GST, glutathione S-transferase; PAP, purple acid phosphatase; PHS, propyzamide-hypersensitiveprotein; RNS, RNase; SNAP, solubleN-ethylmaleimide-sensitive factor attachment protein; SQD, sulfoquinovosyldiacylglycerolglycosyltransferase; UK, unknown protein; USP, universal stress protein; V-ATPase, vacuolar ATP synthase; VSR, vacuolartargeting receptor.
Toward the Storage Metabolome
Plant Physiol. Vol. 157, 2011 1475
and TCA cycle-related genes, such as 2-oxoglutaratedehydrogenase and succinate dehydrogenase.
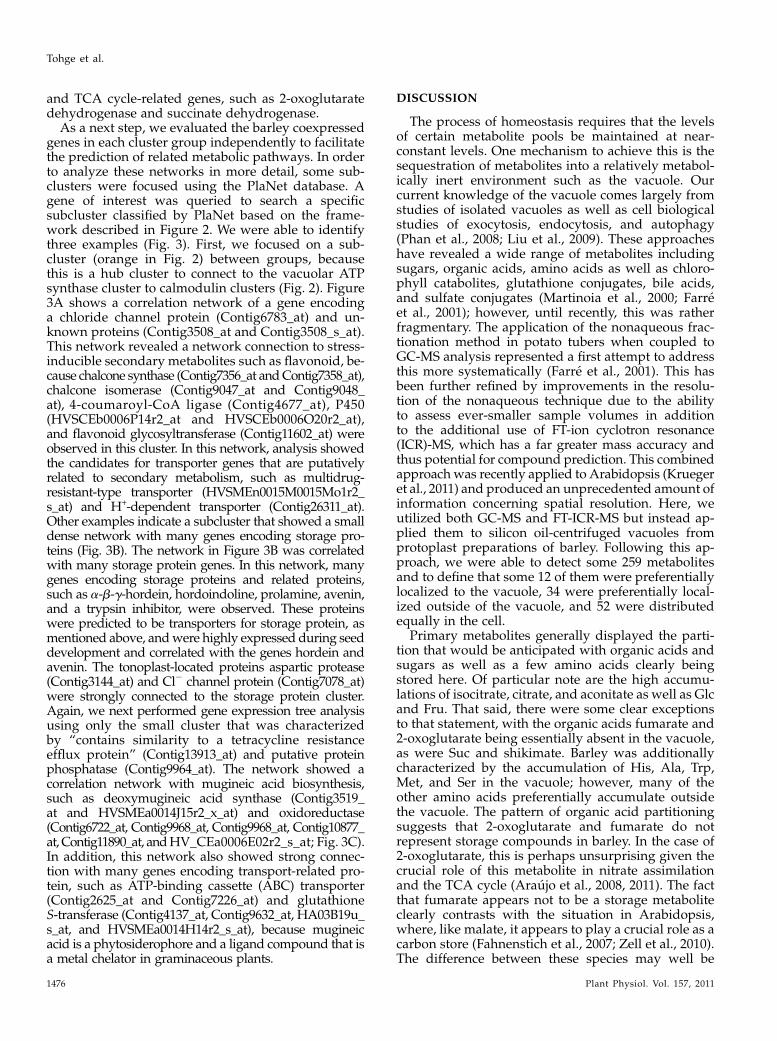
As a next step, we evaluated the barley coexpressedgenes in each cluster group independently to facilitatethe prediction of related metabolic pathways. In orderto analyze these networks in more detail, some sub-clusters were focused using the PlaNet database. Agene of interest was queried to search a specificsubcluster classified by PlaNet based on the frame-work described in Figure 2. We were able to identifythree examples (Fig. 3). First, we focused on a sub-cluster (orange in Fig. 2) between groups, becausethis is a hub cluster to connect to the vacuolar ATPsynthase cluster to calmodulin clusters (Fig. 2). Figure3A shows a correlation network of a gene encodinga chloride channel protein (Contig6783_at) and un-known proteins (Contig3508_at and Contig3508_s_at).This network revealed a network connection to stress-inducible secondary metabolites such as flavonoid, be-cause chalcone synthase (Contig7356_at andContig7358_at),chalcone isomerase (Contig9047_at and Contig9048_at), 4-coumaroyl-CoA ligase (Contig4677_at), P450(HVSCEb0006P14r2_at and HVSCEb0006O20r2_at),and flavonoid glycosyltransferase (Contig11602_at) wereobserved in this cluster. In this network, analysis showedthe candidates for transporter genes that are putativelyrelated to secondary metabolism, such as multidrug-resistant-type transporter (HVSMEn0015M0015Mo1r2_s_at) and H+-dependent transporter (Contig26311_at).Other examples indicate a subcluster that showed a smalldense network with many genes encoding storage pro-teins (Fig. 3B). The network in Figure 3B was correlatedwith many storage protein genes. In this network, manygenes encoding storage proteins and related proteins,such as a-b-g-hordein, hordoindoline, prolamine, avenin,and a trypsin inhibitor, were observed. These proteinswere predicted to be transporters for storage protein, asmentioned above, andwere highly expressed during seeddevelopment and correlated with the genes hordein andavenin. The tonoplast-located proteins aspartic protease(Contig3144_at) and Cl2 channel protein (Contig7078_at)were strongly connected to the storage protein cluster.Again, we next performed gene expression tree analysisusing only the small cluster that was characterizedby “contains similarity to a tetracycline resistanceefflux protein” (Contig13913_at) and putative proteinphosphatase (Contig9964_at). The network showed acorrelation network with mugineic acid biosynthesis,such as deoxymugineic acid synthase (Contig3519_at and HVSMEa0014J15r2_x_at) and oxidoreductase(Contig6722_at, Contig9968_at, Contig9968_at, Contig10877_at,Contig11890_at, andHV_CEa0006E02r2_s_at; Fig. 3C).In addition, this network also showed strong connec-tion with many genes encoding transport-related pro-tein, such as ATP-binding cassette (ABC) transporter(Contig2625_at and Contig7226_at) and glutathioneS-transferase (Contig4137_at, Contig9632_at, HA03B19u_s_at, and HVSMEa0014H14r2_s_at), because mugineicacid is a phytosiderophore and a ligand compound that isa metal chelator in graminaceous plants.
DISCUSSION
The process of homeostasis requires that the levelsof certain metabolite pools be maintained at near-constant levels. One mechanism to achieve this is thesequestration of metabolites into a relatively metabol-ically inert environment such as the vacuole. Ourcurrent knowledge of the vacuole comes largely fromstudies of isolated vacuoles as well as cell biologicalstudies of exocytosis, endocytosis, and autophagy(Phan et al., 2008; Liu et al., 2009). These approacheshave revealed a wide range of metabolites includingsugars, organic acids, amino acids as well as chloro-phyll catabolites, glutathione conjugates, bile acids,and sulfate conjugates (Martinoia et al., 2000; Farreet al., 2001); however, until recently, this was ratherfragmentary. The application of the nonaqueous frac-tionation method in potato tubers when coupled toGC-MS analysis represented a first attempt to addressthis more systematically (Farre et al., 2001). This hasbeen further refined by improvements in the resolu-tion of the nonaqueous technique due to the abilityto assess ever-smaller sample volumes in additionto the additional use of FT-ion cyclotron resonance(ICR)-MS, which has a far greater mass accuracy andthus potential for compound prediction. This combinedapproachwas recently applied to Arabidopsis (Kruegeret al., 2011) and produced an unprecedented amount ofinformation concerning spatial resolution. Here, weutilized both GC-MS and FT-ICR-MS but instead ap-plied them to silicon oil-centrifuged vacuoles fromprotoplast preparations of barley. Following this ap-proach, we were able to detect some 259 metabolitesand to define that some 12 of them were preferentiallylocalized to the vacuole, 34 were preferentially local-ized outside of the vacuole, and 52 were distributedequally in the cell.
Primary metabolites generally displayed the parti-tion that would be anticipated with organic acids andsugars as well as a few amino acids clearly beingstored here. Of particular note are the high accumu-lations of isocitrate, citrate, and aconitate as well as Glcand Fru. That said, there were some clear exceptionsto that statement, with the organic acids fumarate and2-oxoglutarate being essentially absent in the vacuole,as were Suc and shikimate. Barley was additionallycharacterized by the accumulation of His, Ala, Trp,Met, and Ser in the vacuole; however, many of theother amino acids preferentially accumulate outsidethe vacuole. The pattern of organic acid partitioningsuggests that 2-oxoglutarate and fumarate do notrepresent storage compounds in barley. In the case of2-oxoglutarate, this is perhaps unsurprising given thecrucial role of this metabolite in nitrate assimilationand the TCA cycle (Araujo et al., 2008, 2011). The factthat fumarate appears not to be a storage metaboliteclearly contrasts with the situation in Arabidopsis,where, like malate, it appears to play a crucial role as acarbon store (Fahnenstich et al., 2007; Zell et al., 2010).The difference between these species may well be
Tohge et al.
1476 Plant Physiol. Vol. 157, 2011
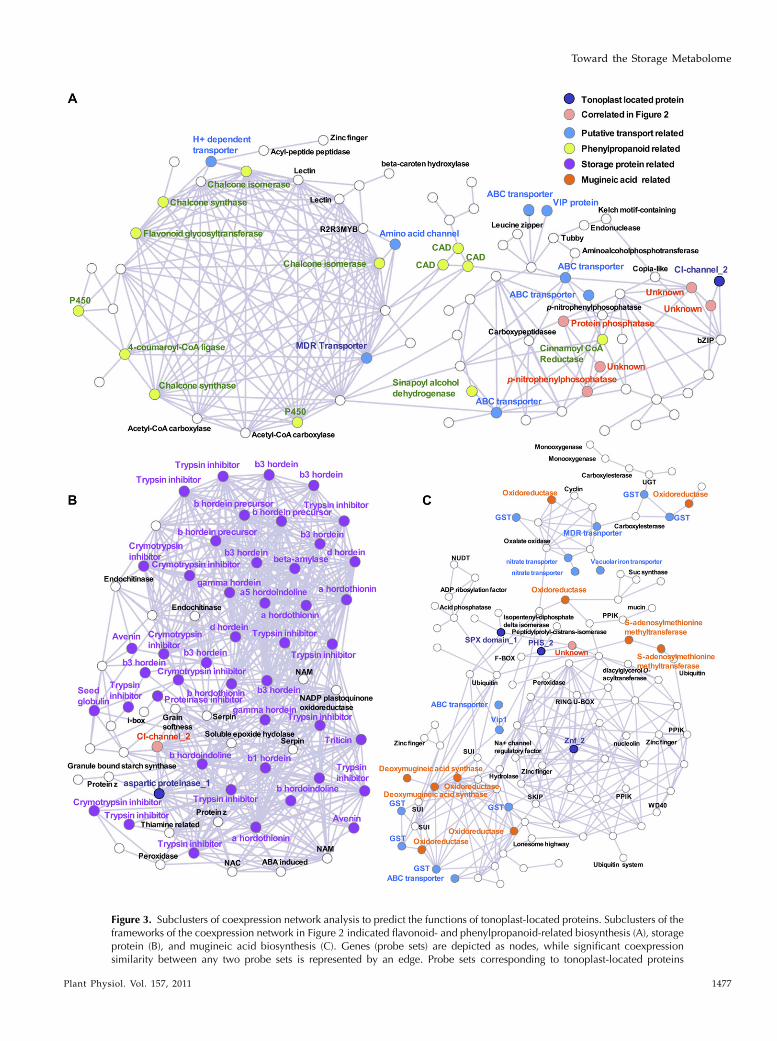
Figure 3. Subclusters of coexpression network analysis to predict the functions of tonoplast-located proteins. Subclusters of theframeworks of the coexpression network in Figure 2 indicated flavonoid- and phenylpropanoid-related biosynthesis (A), storageprotein (B), and mugineic acid biosynthesis (C). Genes (probe sets) are depicted as nodes, while significant coexpressionsimilarity between any two probe sets is represented by an edge. Probe sets corresponding to tonoplast-located proteins
Toward the Storage Metabolome
Plant Physiol. Vol. 157, 2011 1477
explained by the presence of a cytosolic fumarase(Pracharoenwattana et al., 2010) and the fact thatfumarate is an important transport form of carbon inArabidopsis (Chia et al., 2000). The relative levels ofsugars is consistent with a very high vacuolar inver-tase activity in barley, as has been described for otherspecies including potato, maize (Zea mays), carrot(Daucus carota), and tobacco (Nicotiana tabacum; Bussiset al., 1997; Tang et al., 1999; Trouverie et al., 2004;Junker et al., 2006). Furthermore, it is consistent withthe presence of a large number of sugar-conjugatedsecondary metabolites in this compartment.
Perhaps surprisingly, a large number of the second-ary metabolites we detected were not found to bepreferentially accumulated in the vacuole; however,there are some clear exceptions to this. Among the 49peaks that were annotated, a chemical formula byaccurate m/z value, 26 of the secondary metaboliteswere detected to be at higher abundance in the vacu-ole. Characterization of the chemical composition ofsecondary metabolites in barley has not been exten-sively reported, although there are some publica-tions concerning flavonoids (Norbaek et al., 2000;Kaspar et al., 2010), sterol derivatives (Bush et al.,1971; Konig and Seifert, 1998), and HODE (Hambergand Hamberg, 1996; Hubke et al., 2005). In our metab-olite profiling by FT-MS with accurate m/z value forchemical formula prediction, we confirmed a formulafor these compounds. All peaks we listed in Table IIexcept Phe and Trp were not observed in Arabidopsisor tomato tissues, but similar peaks such as glycofla-vone glycosides were detected in monocot plants suchas rice (Oryza sativa) and maize (Besson et al., 1985;Snook et al., 1995). In our measurement of barleysecondary metabolites, 12 putative flavonoids, sevenputative HODE-related compounds, three cyclopenta-neoctanoic acid-related compounds, and nine putativesterol derivatives were annotated. The compounds ineach class displayed similar behavior; for example, allflavonoids were higher in vacuole, whereas HODE-related compounds and sterol-related compoundswere not detected in vacuole samples. The sterol-related compounds are likely located at the tonoplastmembrane (Yoshida and Uemura, 1986). In addition,the cycloartenol synthase protein (AAT38887 homo-log, Contig11705_at; Supplemental Table S2), which isinvolved in sterol biosynthesis, was previously iden-tified as a “membrane fusion and remodeling protein”(Endler et al., 2006).
In the case of dicot plants such as Arabidopsisleaves, flavonol-O-glycoside, anthocyanin, and gluco-sinolates have been identified as major secondary
metabolites (Tohge et al., 2005; Maruyama-Nakashitaet al., 2006; Hirai et al., 2007; Matsuda et al., 2009),whereas other dicots such as Solanaceae species, in-cluding tomato and tobacco, accumulate glycoalka-loids, quinate derivatives, and acylated sugars (Mocoet al., 2006; Butelli et al., 2008; Iijima et al., 2008; Adatoet al., 2009). On the other hand, in leaves of monocotplant species such as rice, maize, and barley, flavonol-O-glycoside and flavonol-C-glycoside (glycoflavone)are reported (Norbaek et al., 2000; Kaspar et al., 2010).Typical flavonoids such as flavonol and anthocyaninare transported to the vacuole after their conversion toglycosides and in some cases acylates, either in ex-change for protons or by direct energization by ABCtransporters. In Arabidopsis research, multidrug andtoxic compound extrusion-type transporter (Debeaujonet al., 2001; Marinova et al., 2007) and the solubleglutathione S-transferase proteins (Kitamura et al.,2004, 2010) are characterized as key players of flavo-noid transport into the vacuole. In maize, geneticevidence was provided that ABC transporters areimplicated in anthocyanin transport (Goodman et al.,2004). Based on this assumption, an integration anal-ysis was performed utilizing coexpression analysis ofpublicly available microarray data. Generally, coex-pression analysis does not work well for transport-related proteins, since the expression of genes encodingtransport-related proteins such as ABC transporters isgenerally low, and they are not usually stress respon-sive (Klein et al., 2006). Despite this, gene coexpressionanalysis using data obtained for different develop-mental stages has previously revealed that TT12 (amultidrug and toxic compound extrusion transporterfor seed pigment proanthocyanidin in Arabidopsis)was well correlated with enzymatic genes of proan-thocyanidin metabolism, such as BAN leucocyanidinleucopelargonidin (At1g61720) and laccase-like poly-phenol oxidase (AtLAC15; At5g48100; Tohge andFernie, 2010). In the other example of transporters forglucosinolate that accumulated in the vacuole ofBrassica species, BAT5 (At4g12030), which is requiredfor the biosynthesis of Met-derived glucosinolates,was well correlated in the coexpression network anal-ysis (Hirai et al., 2007; Gigolashvili et al., 2009). Ourtrial of coexpression network analysis gave us manyhints that may aid in understanding of the vacuolartransport system for flavonoid, storage proteins, andmugineic acid. The case of flavonoid acts as a positivecontrol, given that this accumulation in the vacuolewas experimentally annotated in several plant species(Song et al., 2010). Intriguingly, it also suggested atransport system for phytosiderophores, and it would
Figure 3. (Continued.)(depicted by blue nodes; Supplemental Figure S3) were used as queries for searching the coexpression networks (SupplementalTable S2). Annotation of the probe sets and PageMan analysis of ontology terms can be found in Supplemental Table S2. CAD,Cinnamoyl-alcohol dehydrogenase; GST, glutathione S-transferase; MDR, multidrug-resistant-type transporter; NAM, no apicalmeristem; NUDT, nudix hydrolase homolog; PHS, propyzamide-hypersensitive protein; PPIK, phosphatidylinositol 3- and4-kinase; SKIP, SKP-interacting partner; UGT, UDP-glycosyltransferase; VIP, vanabin-interacting protein.
Tohge et al.
1478 Plant Physiol. Vol. 157, 2011
seem likely that such a system plays a role in metalchelators under metal stress and nutrient-deficientconditions. As we showed in Figures 2 and 3, somemetabolites that need to be transported into the vac-uole revealed correlation in gene expression betweenthose genes involved in their biosynthesis and thoseinvolved in their transport system. In this study, weused barley as an example of the power of combiningdata frommetabolite profiling, subcellular proteomics,and in silico coexpression analysis in order to betterunderstand the storage metabolome. Using this ap-proach, we were able to characterize the storagemetabolome of this species in spite of the fact thatthe genome sequence of barley is not yet available.In summary, the results presented here provide the
basis for a more comprehensive understanding of thevacuolar systems of transport and metabolism. Whilethe partitioning of a number of these metabolites is inkeeping with what would be anticipated, we addi-tionally provide information on a number of othermetabolites. That said, comparison between the barleyvacuole data presented here and that found in Arabi-dopsis suggests that while many factors are con-served between species, there are subtle differencesalso. While it is possible that some of these differ-ences are due to the different approaches used be-tween the two studies, it would appear likely that thevacuolar metabolome, like the cellular metabolome(Fiehn, 2007; Krueger et al., 2011), is context depen-dent. With this in mind, it will be highly interesting infuture studies to compare the storage metabolomes ofa broad range of tissues types and its dynamic re-sponse to cellular circumstances, including exposureto salt stress, drought, and conditions that inducesenescence.
MATERIALS AND METHODS
Plant Materials and Harvest
Barley (Hordeum vulgare var Baraka) was grown in vermiculite (Vermica) in
a controlled-environment chamber (16 h of light/8 h of dark, 300 mE m–2 s–1,
227�C, 60% relative humidity) and watered with Luwasa hydroculture nutri-
ent solution (Interhydro). The primary leaves were harvested between 8 and
9 AM as described by Rentsch and Martinoia (1991) and Endler et al. (2006).
Protoplast and Vacuole Isolation for Metabolomics
Barley protoplasts and vacuoles for metabolomics were isolated by a slight
modification of the procedure described by Rentsch and Martinoia (1991).
Briefly, for protoplast isolation, after digestion of the leaves, protoplasts were
collected by centrifugation at 1,200g for 10 min on a cushion constituted of
digestion medium (500 mM sorbitol, 1 mM CaCl2, and 10 mM MES-KOH, pH 6)
containing 30% Percoll (v/v). The supernatant was removed, the protoplasts
were mixed with the Percoll cushion, and additional osmotically dissolved
Percoll (digestion medium solved in Percoll) was added to give a final Percoll
concentration of about 40%. For the metabolomics of the protoplasts, the
protoplast solution was overlaid with medium C (500 mM sorbitol, 20%
Percoll, pH 6, 1 mM CaCl2, and 10 mM MES-KOH, pH 5.6) and medium D (500
mM betaine, 1 mM CaCl2, and 10 mM MES-KOH, pH 5.6). The volume used
depended on the quantity of protoplasts isolated. After centrifugation for 10
min at 1,200g, the protoplasts were recovered from the upper interphase. For
the metabolomic studies of protoplasts, 200 mL of a silicon oil mixture (AR200:
AR20, 8:2) was placed at the bottom of polyethylene microcentrifugation tubes
(400-mL capacity). Two milliliters of protoplasts was mixed with 2 mL of
medium D, and 200 mL of this mix was placed on the top of the silicon oil
mixture. Protoplasts were sedimented by a 2 3 20-s centrifugation at 10,000g.
The polyethylene tubes (50 per experiment) were frozen overnight. The
bottoms of the frozen tubes were cut with a razor blade and collected. One
milliliter of water was added and vortexed, and the aqueous fraction containing
a tiny amount of silicon oil but no tube tips was transferred in a fresh tube. The
mixture was centrifuged at 4,000g for 10 min. The water phase was removed,
lyophilized, and used for the metabolomic analysis.
For the vacuole isolation, protoplasts were purified using a similar gradi-
ent but replacing medium C by C# (400 mM sorbitol, 20% Percoll, pH 7.2, 30
mM KCl, 20 mM HEPES-KOH, pH 7.2, 0.1% bovine serum albumin, and 0.2 mM
dithiothreitol) and medium D by D# (400 mM betaine, 30 mM KCl, 20 mM
HEPES-KOH, pH 7.2, and 0.2 mM dithiothreitol). Vacuoles were released from
protoplasts by forcing the protoplasts through a syringe and purified by
flotation as described by Rentsch and Martinoia (1991). This procedure
occurred at 4�C. In order to get rid of the isolation medium, 30 mL of vacuoles
was added to 70 mL of a medium containing 22% Percoll, pH 7.2, 400 mM
sorbitol, 30 mM KCl, 20 mM HEPES-KOH, pH 7.2, 0.1% bovine serum albumin,
and 0.2 mM dithiothreitol. The samples were overlaid with 200 mL of silicone
oil AR200 and 60 mL of water. After mixing for 6 min, the vacuoles were
floated by centrifugation at 10,000g for 20 s. Tubes were frozen overnight, and
after defreezing, 45 mL of the aqueous solution from each tube (50–60 per
experiment) was recovered and pooled. The pooled fraction was lyophilized
and used for the metabolomic analysis.
Extraction for Metabolite Analysis
Lyophilized sample was homogenized using a ball mill precooled with
liquid nitrogen and extracted in 1,400 mL of methanol, and 60 mL of internal
standard (0.2 mg ribitol mL–1 water) was subsequently added as a quantifi-
cation standard. Samples were homogenized by the Retsch Muhle mixer mill
for 2 min at 25 L s–1. One thousand two hundred microliters of supernatant
after centrifugation at 14,000 rpm for 10 min was transferred to a glass vial.
After mixing with 750 mL of CHCl3, 1,500 mL of water was added and vortexed
for 15 s. After centrifugation for 15 min at 4,000 rpm, supernatant was taken
(50 and 100 mL for GC-MS analysis and 1,000 mL for LC-MS analysis) from the
upper polar phase into fresh Eppendorf tubes (also 2 mL). Sample dried by the
SpeedVac for at least 2 h without heating was used for metabolite analysis.
Derivatization and Analysis of Primary MetabolitesUsing GC-MS
Metabolite extraction for GC-MS was performed by a method modified
from that described by Roessner-Tunali et al. (2003). The extraction, deriva-
tization, standard addition, and sample injection were exactly as described
previously (Lisec et al., 2006). Both chromatograms and mass spectra were
evaluated using either TAGFINDER (Luedemann et al., 2008) or the MAS-
SLAB program (ThermoQuest), and the resulting data were prepared and
presented as described (Roessner et al., 2001).
UPLC-FT-MS of Secondary Metabolites
UPLC separation of secondary metabolites was performed according to a
previously published protocol (Giavalisco et al., 2009) using a Waters Acquity
UPLC system. The UPLC apparatus was equipped with an HSS T3 C18
reverse-phase column (1003 2.1 mm i.d., 1.8-mm particle size; Waters), which
was operated at a temperature of 40�C. The mobile phases consisted of 0.1%
formic acid in water (solvent A) and 0.1% formic acid in acetonitrile (solvent
B). The flow rate of the mobile phase was 400 mL min–1, and 2 mL of sample
was loaded per injection. The following gradient profile was applied: after a
1-min isocratic run at 99% A, a linear 12-min gradient was applied to 65% A;
this was immediately followed by a 1.5-min gradient to 30% A before a 1-min
gradient to 1% A; then, a 1.5-min isocratic period at 1% A followed, before
switching back to 99% A to reequilibrate the column for 2.5 min, before the
next sample could be injected. The UPLC device was connected to the FT-ICR
apparatus via a TriVersa NanoMate (Advion). The UPLC flow rate at 400 mL
min–1 was split 1:1,000 with a T-valve (Advion). One-tenth of 1% (400 nL min–1)
was directly loaded to the FT-ICR-MS device, while 99.9% was discarded. The
sample was infused into the mass spectrometer via a nanospray chip (type A;
Toward the Storage Metabolome
Plant Physiol. Vol. 157, 2011 1479
Advion) by applying a voltage of 1.8 kV in the positive and 1.9 kV in the
negative ionization mode. Spray sensing was used between 1 and 17 min of
the UPLC gradient. The mass spectra were acquired using the LTQ FT-ICR-
Ultra mass spectrometer (Thermo-Fisher). The spectra were recorded using
full-scan mode, covering a mass range from m/z 100 to 1,500. Resolution was
set to 50,000, and maximum loading time for the ICR cell was set to 500 ms.
The transfer capillary temperature was set to 200�C, and the MS spectra were
recorded from 0 to 19 min of the UPLC gradient. Molecular masses, retention
times, and associated peak intensities were extracted from the raw files using
the RefinerMS software (version 5.3; GeneData). Peak prediction and anno-
tation in the data matrix by LC-MS was conducted by databases (for review,
see Tohge and Fernie, 2009) such as MASSBANK (Horai et al., 2010) and
KNApSAcK (Shinbo et al., 2006), based on accurate m/z analyzed by FT-MS.
Coexpression Analysis via Proteome Data
The coexpression network analysis of wheat (Triticum aestivum) was
performed by PlaNet (Mutwil et al., 2011) using Supplemental Table S2.
Supplemental Data
The following materials are available in the online version of this article.
Supplemental Figure S1.Global comparison of all detected compounds by
GC-MS and LC-MS in protoplast and vacuole.
Supplemental Figure S2. Probe identifiers of genes shown in the frame-
work of the coexpression network in Figure 2.
Supplemental Figure S3. Probe identifiers of genes shown in the frame-
work of the coexpression network in Figure 3.
Supplemental Table S1. Secondary metabolite-related peaks detected by
UPLC-FT-MS
Supplemental Table S2. The barley vacuole proteins used for coexpression
analysis.
Received August 19, 2011; accepted September 21, 2011; published September
26, 2011.
LITERATURE CITED
Adato A, Mandel T, Mintz-Oron S, Venger I, Levy D, Yativ M, Dominguez
E, Wang ZH, De Vos RCH, Jetter R, et al (2009) Fruit-surface flavonoid
accumulation in tomato is controlled by a SIMYB12-regulated tran-
scriptional network. PLoS Genet 5: 23
Araujo WL, Nunes-Nesi A, Osorio S, Usadel B, Fuentes D, Nagy R, Balbo
I, Lehmann M, Studart-Witkowski C, Tohge T, et al (2011) Antisense
inhibition of the iron-sulfur subunit of succinate dehydrogenase en-
hances photosynthesis and growth in tomato via an organic acid-
mediated effect on stomatal aperture. Plant Cell 23: 600–627
Araujo WL, Nunes-Nesi A, Trenkamp S, Bunik VI, Fernie AR (2008)
Inhibition of 2-oxoglutarate dehydrogenase in potato tuber suggests the
enzyme is limiting for respiration and confirms its importance in
nitrogen assimilation. Plant Physiol 148: 1782–1796
Baker JM, Hawkins ND, Ward JL, Lovegrove A, Napier JA, Shewry PR,
Beale MH (2006) A metabolomic study of substantial equivalence of
field-grown genetically modified wheat. Plant Biotechnol J 4: 381–392
Besson E, Dellamonica G, Chopin J, Markham KR, Kim M, Koh HS,
Fukami H (1985) C-Glycosylflavones from Oryza sativa. Phytochemis-
try 24: 1061–1064
Boller T, Kende H (1979) Hydrolytic enzymes in the central vacuole of
plant cells. Plant Physiol 63: 1123–1132
Brady SM, Provart NJ (2009) Web-queryable large-scale data sets for
hypothesis generation in plant biology. Plant Cell 21: 1034–1051
Bush PB, Grunwald C, Davis DL (1971) Changes in sterol composition
during greening of etiolated barley shoots. Plant Physiol 47: 745–749
Bussis D, Heineke D, Sonnewald U, Willmitzer L, Raschke K, Heldt HW
(1997) Solute accumulation and decreased photosynthesis in leaves of
potato plants expressing yeast-derived invertase either in the apoplast,
vacuole or cytosol. Planta 202: 126–136
Butelli E, Titta L, Giorgio M, Mock HP, Matros A, Peterek S, Schijlen EG,
Hall RD, Bovy AG, Luo J, et al (2008) Enrichment of tomato fruit with
health-promoting anthocyanins by expression of select transcription
factors. Nat Biotechnol 26: 1301–1308
Cai SQ, Lashbrook CC (2006) Laser capture microdissection of plant cells
from tape-transferred paraffin sections promotes recovery of structur-
ally intact RNA for global gene profiling. Plant J 48: 628–637
Carrari F, Nunes-Nesi A, Gibon Y, Lytovchenko A, Loureiro ME, Fernie
AR (2003) Reduced expression of aconitase results in an enhanced rate
of photosynthesis and marked shifts in carbon partitioning in illumi-
nated leaves of wild species tomato. Plant Physiol 133: 1322–1335
Carter C, Pan SQ, Zouhar J, Avila EL, Girke T, Raikhel NV (2004) The
vegetative vacuole proteome of Arabidopsis thaliana reveals predicted
and unexpected proteins. Plant Cell 16: 3285–3303
Catchpole GS, Beckmann M, Enot DP, Mondhe M, Zywicki B, Taylor J,
Hardy N, Smith A, King RD, Kell DB, et al (2005) Hierarchical
metabolomics demonstrates substantial compositional similarity be-
tween genetically modified and conventional potato crops. Proc Natl
Acad Sci USA 102: 14458–14462
Chia DW, Yoder TJ, Reiter WD, Gibson SI (2000) Fumaric acid: an
overlooked form of fixed carbon in Arabidopsis and other plant species.
Planta 211: 743–751
Cho YH, Yoo SD, Sheen J (2007) Glucose signaling through nuclear
hexokinase1 complex in Arabidopsis. Plant Signal Behav 2: 123–124
Cook D, Fowler S, Fiehn O, Thomashow MF (2004) A prominent role for
the CBF cold response pathway in configuring the low-temperature
metabolome of Arabidopsis. Proc Natl Acad Sci USA 101: 15243–15248
Debeaujon I, Peeters AJM, Leon-Kloosterziel KM, Koornneef M (2001)
The TRANSPARENT TESTA12 gene of Arabidopsis encodes a multidrug
secondary transporter-like protein required for flavonoid sequestration
in vacuoles of the seed coat endothelium. Plant Cell 13: 853–871
Endler A, Meyer S, Schelbert S, Schneider T, Weschke W, Peters SW,
Keller F, Baginsky S, Martinoia E, Schmidt UG (2006) Identification of
a vacuolar sucrose transporter in barley and Arabidopsis mesophyll
cells by a tonoplast proteomic approach. Plant Physiol 141: 196–207
Endler A, Reiland S, Gerrits B, Schmidt UG, Baginsky S, Martinoia E
(2009) In vivo phosphorylation sites of barley tonoplast proteins iden-
tified by a phosphoproteomic approach. Proteomics 9: 310–321
Fahnenstich H, Saigo M, Niessen M, Zanor MI, Andreo CS, Fernie AR,
Drincovich MF, Flugge UI, Maurino VG (2007) Alteration of organic
acid metabolism in Arabidopsis overexpressing the maize C4 NADP-
malic enzyme causes accelerated senescence during extended darkness.
Plant Physiol 145: 640–652
Farre EM, Tech S, Trethewey RN, Fernie AR, Willmitzer L (2006) Subcel-
lular pyrophosphate metabolism in developing tubers of potato (Sola-
num tuberosum). Plant Mol Biol 62: 165–179
Farre EM, Tiessen A, Roessner U, Geigenberger P, Trethewey RN,
Willmitzer L (2001) Analysis of the compartmentation of glycolytic
intermediates, nucleotides, sugars, organic acids, amino acids, and sugar
alcohols in potato tubers using a nonaqueous fractionation method. Plant
Physiol 127: 685–700
Fehr M, Frommer WB, Lalonde S (2002) Visualization of maltose uptake in
living yeast cells by fluorescent nanosensors. Proc Natl Acad Sci USA 99:
9846–9851
Fernie AR (2007) The future of metabolic phytochemistry: larger numbers
of metabolites, higher resolution, greater understanding. Phytochemis-
try 68: 2861–2880
Fernie AR, Trethewey RN, Krotzky AJ, Willmitzer L (2004) Metabolite
profiling: from diagnostics to systems biology. Nat Rev Mol Cell Biol 5:
763–769
Fiehn O (2002) Metabolomics: the link between genotypes and phenotypes.
Plant Mol Biol 48: 155–171
Fiehn O (2007) Cellular metabolomics: the quest for pathway structure. In
JC Lindon, JK Nicholson, E Holmes, eds, The Handbook of Metabo-
nomics and Metabolomics, Chapter 2. Elsevier BV, Amsterdam, pp
35–54
Gerhardt R, Stitt M, Heldt HW (1983) Subcellular metabolite determination
in spinach leaves through non-aqueous fractionation. Physiol Chem 364:
1130–1131
Giavalisco P, Kohl K, Hummel J, Seiwert B, Willmitzer L (2009) 13C
isotope-labeled metabolomes allowing for improved compound anno-
tation and relative quantification in liquid chromatography-mass
spectrometry-based metabolomic research. Anal Chem 81: 6546–6551
Gigolashvili T, Yatusevich R, Rollwitz I, Humphry M, Gershenzon J,
Tohge et al.
1480 Plant Physiol. Vol. 157, 2011
Flugge UI (2009) The plastidic bile acid transporter 5 is required for the
biosynthesis of methionine-derived glucosinolates in Arabidopsis thali-
ana. Plant Cell 21: 1813–1829
Goldberg RB (1988) Plants: novel developmental processes. Science 240:
1460–1467
Goodman CD, Casati P, Walbot V (2004) A multidrug resistance-associated
protein involved in anthocyanin transport in Zea mays. Plant Cell 16:
1812–1826
Hamberg M, Hamberg G (1996) Peroxygenase-catalyzed fatty acid epox-
idation in cereal seeds: sequential oxidation of linoleic acid into 9(S),12
(S),13(S)-trihydroxy-10(E)-octadecenoic acid. Plant Physiol 110: 807–815
Heazlewood JL, Verboom RE, Tonti-Filippini J, Small I, Millar AH (2007)
SUBA: the Arabidopsis subcellular database. Nucleic Acids Res 35:
D213–D218
Hirai MY, Sugiyama K, Sawada Y, Tohge T, Obayashi T, Suzuki A, Araki
R, Sakurai N, Suzuki H, Aoki K, et al (2007) Omics-based identification
of Arabidopsis Myb transcription factors regulating aliphatic glucosi-
nolate biosynthesis. Proc Natl Acad Sci USA 104: 6478–6483
Hirai MY, Yano M, Goodenowe DB, Kanaya S, Kimura T, Awazuhara M,
Arita M, Fujiwara T, Saito K (2004) Integration of transcriptomics and
metabolomics for understanding of global responses to nutritional
stresses in Arabidopsis thaliana. Proc Natl Acad Sci USA 101: 10205–
10210
Horai H, Arita M, Kanaya S, Nihei Y, Ikeda T, Suwa K, Ojima Y, Tanaka
K, Tanaka S, Aoshima K, et al (2010) MassBank: a public repository for
sharing mass spectral data for life sciences. J Mass Spectrom 45: 703–714
Hubke H, Garbe LA, Tressl R (2005) Characterization and quantification of
free and esterified 9- and 13-hydroxyoctadecadienoic acids (HODE) in
barley, germinating barley, and finished malt. J Agric Food Chem 53:
1556–1562
Igamberdiev AU, Romanowska E, Gardestrom P (2001) Photorespiratory
flux and mitochondrial contribution to energy and redox balance of
barley leaf protoplasts in the light and during light-dark transitions.
J Plant Physiol 158: 1325–1332
Iijima Y, Nakamura Y, Ogata Y, Tanaka K, Sakurai N, Suda K, Suzuki T,
Suzuki H, Okazaki K, Kitayama M, et al (2008) Metabolite annotations
based on the integration of mass spectral information. Plant J 54:
949–962
Ishizaki K, Larson TR, Schauer N, Fernie AR, Graham IA, Leaver CJ
(2005) The critical role of Arabidopsis electron-transfer flavoprotein:
ubiquinone oxidoreductase during dark-induced starvation. Plant Cell
17: 2587–2600
Jaquinod M, Villiers F, Kieffer-Jaquinod S, Hugouvieux V, Bruley C,
Garin J, Bourguignon J (2007) A proteomics dissection of Arabidopsis
thaliana vacuoles isolated from cell culture. Mol Cell Proteomics 6:
394–412
Junker BH, Wuttke R, Nunes-Nesi A, Steinhauser D, Schauer N, Bussis
D, Willmitzer L, Fernie AR (2006) Enhancing vacuolar sucrose cleavage
within the developing potato tuber has only minor effects on metabo-
lism. Plant Cell Physiol 47: 277–289
Kaplan F, Kopka J, Haskell DW, Zhao W, Schiller KC, Gatzke N, Sung
DY, Guy CL (2004) Exploring the temperature-stress metabolome of
Arabidopsis. Plant Physiol 136: 4159–4168
Kaspar S, Matros A, Mock HP (2010) Proteome and flavonoid analysis
reveals distinct responses of epidermal tissue and whole leaves upon
UV-B radiation of barley (Hordeum vulgare L.) seedlings. J Proteome
Res 9: 2402–2411
Kitamura S, Matsuda F, Tohge T, Yonekura-Sakakibara K, Yamazaki M,
Saito K, Narumi I (2010) Metabolic profiling and cytological analysis of
proanthocyanidins in immature seeds of Arabidopsis thaliana flavonoid
accumulation mutants. Plant J 62: 549–559
Kitamura S, Shikazono N, Tanaka A (2004) TRANSPARENT TESTA 19 is
involved in the accumulation of both anthocyanins and proanthocya-
nidins in Arabidopsis. Plant J 37: 104–114
Kleffmann T, Russenberger D, von Zychlinski A, Christopher W,
Sjolander K, Gruissem W, Baginsky S (2004) The Arabidopsis thaliana
chloroplast proteome reveals pathway abundance and novel protein
functions. Curr Biol 14: 354–362
Klein M, Burla B, Martinoia E (2006) The multidrug resistance-associated
protein (MRP/ABCC) subfamily of ATP-binding cassette transporters
in plants. FEBS Lett 580: 1112–1122
Konig M, Seifert K (1998) Uptake and translocation of exogenously
applied 7-oxysterols in barley. Phytochemistry 49: 1257–1263
Krueger S, Giavalisco P, Krall L, Steinhauser M-C, Bussis D, Usadel B,
Flugge UI, Fernie AR, Willmitzer L, Steinhauser D (2011) A topological
map of the compartmentalized Arabidopsis thaliana leaf metabolome.
PLoS ONE 6: e17806
Lehmann M, Schwarzlander M, Obata T, Sirikantaramas S, Burow M,
Olsen CE, Tohge T, Fricker MD, Møller BL, Fernie AR, et al (2009) The
metabolic response of Arabidopsis roots to oxidative stress is distinct
from that of heterotrophic cells in culture and highlights a complex
relationship between the levels of transcripts, metabolites, and flux. Mol
Plant 2: 390–406
Lisec J, Schauer N, Kopka J, Willmitzer L, Fernie AR (2006) Gas chroma-
tography mass spectrometry-based metabolite profiling in plants. Nat
Protoc 1: 387–396
Liu YM, Xiong Y, Bassham DC (2009) Autophagy is required for tolerance
of drought and salt stress in plants. Autophagy 5: 954–963
Luedemann A, Strassburg K, Erban A, Kopka J (2008) TagFinder for the
quantitative analysis of gas chromatography-mass spectrometry (GC-
MS)-based metabolite profiling experiments. Bioinformatics 24: 732–737
Lunn JE (2007) Compartmentation in plant metabolism. J Exp Bot 58: 35–47
Marinova K, Pourcel L, Weder B, Schwarz M, Barron D, Routaboul JM,
Debeaujon I, Klein M (2007) The Arabidopsis MATE transporter TT12
acts as a vacuolar flavonoid/H+ -antiporter active in proanthocyanidin-
accumulating cells of the seed coat. Plant Cell 19: 2023–2038
Martin F, Duplessis S, Ditengou F, Lagrange H, Voiblet C, Lapeyrie F
(2001) Developmental cross talking in the ectomycorrhizal symbiosis:
signals and communication genes. New Phytol 151: 145–154
Martinoia E, Maeshima M, Neuhaus HE (2007) Vacuolar transporters and
their essential role in plant metabolism. J Exp Bot 58: 83–102
Martinoia E, Massonneau A, Frangne N (2000) Transport processes of
solutes across the vacuolar membrane of higher plants. Plant Cell
Physiol 41: 1175–1186
Maruyama-Nakashita A, Nakamura Y, Tohge T, Saito K, Takahashi H
(2006) Arabidopsis SLIM1 is a central transcriptional regulator of plant
sulfur response and metabolism. Plant Cell 18: 3235–3251
Matsuda F, Yonekura-Sakakibara K, Niida R, Kuromori T, Shinozaki K,
Saito K (2009) MS/MS spectral tag-based annotation of non-targeted
profile of plant secondary metabolites. Plant J 57: 555–577
Millar AH, Sweetlove LJ, Giege P, Leaver CJ (2001) Analysis of the
Arabidopsis mitochondrial proteome. Plant Physiol 127: 1711–1727
Millar AH, Whelan J, Small I (2006) Recent surprises in protein targeting
to mitochondria and plastids. Curr Opin Plant Biol 9: 610–615
Moco S, Bino RJ, Vorst O, Verhoeven HA, de Groot J, van Beek TA,
Vervoort J, deVosCHR (2006)A liquid chromatography-mass spectrometry-
based metabolome database for tomato. Plant Physiol 141: 1205–1218
Mutwil M, Klie S, Tohge T, Giorgi FM, Wilkins O, Campbell MM, Fernie
AR, Usadel B, Nikoloski Z, Persson S (2011) PlaNet: combined se-
quence and expression comparisons across plant networks derived from
seven species. Plant Cell 23: 895–910
Nakabayashi R, Yamazaki M, Saito K (2010) A polyhedral approach for
understanding flavonoid biosynthesis in Arabidopsis. N Biotechnol 27:
829–836
Norbaek R, Brandt K, Kondo T (2000) Identification of flavone
C-glycosides including a new flavonoid chromophore from barley
leaves (Hordeum vulgare L.) by improved NMR techniques. J Agric
Food Chem 48: 1703–1707
Obel N, Erben V, Schwarz T, Kuhnel S, Fodor A, Pauly M (2009)
Microanalysis of plant cell wall polysaccharides. Mol Plant 2: 922–932
Pendle AF, Clark GP, Boon R, Lewandowska D, Lam YW, Andersen J,
Mann M, Lamond AI, Brown JWS, Shaw PJ (2005) Proteomic analysis
of the Arabidopsis nucleolus suggests novel nucleolar functions. Mol
Biol Cell 16: 260–269
Phan NQ, Kim SJ, Bassham DC (2008) Overexpression of Arabidopsis
sorting nexin AtSNX2b inhibits endocytic trafficking to the vacuole. Mol
Plant 1: 961–976
Pracharoenwattana I, Zhou WX, Keech O, Francisco PB, Udomchalothorn
T, Tschoep H, Stitt M, Gibon Y, Smith SM (2010) Arabidopsis has a
cytosolic fumarase required for the massive allocation of photosynthate
into fumaric acid and for rapid plant growth on high nitrogen. Plant J 62:
785–795
Rentsch D, Martinoia E (1991) Citrate transport into barley mesophyll
vacuoles: comparison with malate-uptake activity. Planta 184: 532–537
Reumann S, Babujee L, Ma CL, Wienkoop S, Siemsen T, Antonicelli GE,
Rasche N, Luder F, Weckwerth W, Jahn O (2007) Proteome analysis of
Toward the Storage Metabolome
Plant Physiol. Vol. 157, 2011 1481
Arabidopsis leaf peroxisomes reveals novel targeting peptides, metabolic
pathways, and defense mechanisms. Plant Cell 19: 3170–3193
Roessner U, Patterson JH, Forbes MG, Fincher GB, Langridge P, Bacic A
(2006) An investigation of boron toxicity in barley using metabolomics.
Plant Physiol 142: 1087–1101
Roessner U, Willmitzer L, Fernie AR (2001) High-resolution metabolic
phenotyping of genetically and environmentally diverse potato tuber
systems: identification of phenocopies. Plant Physiol 127: 749–764
Roessner-Tunali U, Hegemann B, Lytovchenko A, Carrari F, Bruedigam C,
Granot D, Fernie AR (2003) Metabolic profiling of transgenic tomato
plants overexpressing hexokinase reveals that the influence of hexose
phosphorylation diminishes during fruit development. Plant Physiol
133: 84–99
Saito K, Matsuda F (2010) Metabolomics for functional genomics, systems
biology, and biotechnology. Annu Rev Plant Biol 61: 463–489
Schad M, Mungur R, Fiehn O, Kehr J (2005) Metabolic profiling of laser
microdissected vascular bundles of Arabidopsis thaliana. Plant
Methods 1: 1–10
Scherling C, Ulrich K, Ewald D, Weckwerth W (2009) A metabolic
signature of the beneficial interaction of the endophyte Paenibacillus
sp. isolate and in vitro-grown poplar plants revealed by metabolomics.
Mol Plant Microbe Interact 22: 1032–1037
Shimaoka T, Ohnishi M, Sazuka T, Mitsuhashi N, Hara-Nishimura I,
Shimazaki KI, MaeshimaM, Yokota A, Tomizawa KI, Mimura T (2004)
Isolation of intact vacuoles and proteomic analysis of tonoplast from
suspension-cultured cells of Arabidopsis thaliana. Plant Cell Physiol 45:
672–683
Shinbo Y, Nakamura Y, Altaf-Ul-Amin M, Asahi H, Kurokawa K, Arita
M, Saito K, Ohta D, Shibata D, Kanaya S (2006) KNApSAcK: a
comprehensive species-metabolite relationship database. Plant Metab-
olomics 57: 165–181
Smart KE, Smith JA, Kilburn MR, Martin BG, Hawes C, Grovenor CR
(2011) High-resolution elemental localization in vacuolate plant cells by
nano-scale secondary ion mass spectrometry. Plant J 63: 870–879
Snook ME, Widstrom NW, Wiseman BR, Byrne PF, Harwood JS, Costello
CE (1995) New C-4$-hydroxy derivatives of maysin and 3#-methoxy-
maysin isolated from corn silks (Zea mays). J Agric Food Chem 43:
2740–2745
Song WY, Park J, Mendoza-Cozatl DG, Suter-Grotemeyer M, Shim D,
Hortensteiner S, Geisler M, Weder B, Rea PA, Rentsch D, et al (2010)
Arsenic tolerance in Arabidopsis is mediated by two ABCC-type
phytochelatin transporters. Proc Natl Acad Sci USA 107: 21187–21192
Stitt M, Fernie AR (2003) From measurements of metabolites to metab-
olomics: an ‘on the fly’ perspective illustrated by recent studies of
carbon-nitrogen interactions. Curr Opin Biotechnol 14: 136–144
Subbaiah CC, Palaniappan A, Duncan K, Rhoads DM, Huber SC, Sachs
MM (2006) Mitochondrial localization and putative signaling function
of sucrose synthase in maize. J Biol Chem 281: 15625–15635
Sumner LW, Mendes P, Dixon RA (2003) Plant metabolomics: large-scale
phytochemistry in the functional genomics era. Phytochemistry 62: 817–836
Sundaresan V, Springer P, Volpe T, Haward S, Jones JDG, Dean C, Ma H,
Martienssen R (1995) Patterns of gene action in plant development
revealed by enhancer trap and gene trap transposable elements. Genes
Dev 9: 1797–1810
Tang GQ, Luscher M, Sturm A (1999) Antisense repression of vacuolar and
cell wall invertase in transgenic carrot alters early plant development
and sucrose partitioning. Plant Cell 11: 177–189
Tikunov Y, Lommen A, de Vos CHR, Verhoeven HA, Bino RJ, Hall RD,
Bovy AG (2005) A novel approach for nontargeted data analysis for
metabolomics: large-scale profiling of tomato fruit volatiles. Plant
Physiol 139: 1125–1137
Tohge T, Fernie AR (2009) Web-based resources for mass-spectrometry-
based metabolomics: a user’s guide. Phytochemistry 70: 450–456
Tohge T, Fernie AR (2010) Combining genetic diversity, informatics and
metabolomics to facilitate annotation of plant gene function. Nat Protoc
5: 1210–1227
Tohge T, Nishiyama Y, Hirai MY, Yano M, Nakajima J, Awazuhara M,
Inoue E, Takahashi H, Goodenowe DB, Kitayama M, et al (2005)
Functional genomics by integrated analysis of metabolome and tran-
scriptome of Arabidopsis plants over-expressing an MYB transcription
factor. Plant J 42: 218–235
Tohge T, Yonekura-Sakakibara K, Niida R, Watanabe-Takahashi A, Saito
K (2007) Phytochemical genomics in Arabidopsis thaliana: a case study
for functional identification of flavonoid biosynthesis genes. Pure Appl
Chem 79: 811–823
Trouverie J, Chateau-Joubert S, Thevenot C, Jacquemot MP, Prioul JL
(2004) Regulation of vacuolar invertase by abscisic acid or glucose in
leaves and roots from maize plantlets. Planta 219: 894–905
Urbanczyk-Wochniak E, Fernie AR (2005) Metabolic profiling reveals
altered nitrogen nutrient regimes have diverse effects on the metabolism
of hydroponically-grown tomato (Solanum lycopersicum) plants. J Exp
Bot 56: 309–321
Weckwerth W (2003) Metabolomics in systems biology. Annu Rev Plant
Biol 54: 669–689
Winter H, Robinson DG, Heldt HW (1993) Subcellular volumes and
metabolite concentrations in barley leaves. Planta 191: 180–190
Yamaguchi-Shinozaki K, Shinozaki K (2006) Transcriptional regulatory
networks in cellular responses and tolerance to dehydration and cold
stresses. Annu Rev Plant Biol 57: 781–803
Yoshida S, Uemura M (1986) Lipid composition of plasma membranes and
tonoplasts isolated from etiolated seedlings of mung bean (Vigna radiata
L.). Plant Physiol 82: 807–812
Zell MB, Fahnenstich H, Maier A, Saigo M, Voznesenskaya EV, Edwards
GE, Andreo C, Schleifenbaum F, Zell C, Drincovich MF, et al (2010)
Analysis of Arabidopsis with highly reduced levels of malate and
fumarate sheds light on the role of these organic acids as storage carbon
molecules. Plant Physiol 152: 1251–1262
Zimmermann P, Hirsch-Hoffmann M, Hennig L, Gruissem W (2004)
GENEVESTIGATOR: Arabidopsis microarray database and analysis
toolbox. Plant Physiol 136: 2621–2632
Tohge et al.
1482 Plant Physiol. Vol. 157, 2011