ZP Recorder - Tension, Torque, Force, Thickness, Speed ... · page 4 page 21 What is ZP Recorder?...
12
INSTRUCTION MANUAL For Force Gauge Models: ZP, ZPH and ZPS ZP Recorder Force Data Analyzer
-
Upload
nguyenkien -
Category
Documents
-
view
218 -
download
0
Transcript of ZP Recorder - Tension, Torque, Force, Thickness, Speed ... · page 4 page 21 What is ZP Recorder?...

INSTRUCTION MANUAL
For Force Gauge Models: ZP, ZPH and ZPS
ZP RecorderForce Data Analyzer
page 23page 2
Notes2 YEAR WARRANTY (RESTRICTIONS APPLY)
Imada, Inc. warrants its products to the original purchaser to be free from defects
in workmanship and material under normal use and proper maintenance for two
years (one year for adapters, attachments and cables) from original purchase. This
warranty shall not be effective if the product has been subject to overload, shock
load, misuse, negligence, accident or repairs attempted by others than Imada, Inc.
During the warranty period, we will, at our option, either repair or replace defec-
tive products. Please call our customer service department for a return authorization
number and return the defective product to us with freight prepaid.
The foregoing warranty constitutes the SOLE AND EXCLUSIVE WARRANTY, and we
hereby disclaim all other warranties, express, statutory or implied, applicable to the
products and/or software, including but not limited to all implied warranties of mer-
chantability, fitness, non-infringement, results, accuracy, security and freedom from
computer virus. In no event shall Imada, Inc. and/or its affiliated companies be liable
for any incidental, consequential or punitive damages in connection with the use of its
products and/or software.

page 3page 22
License Agreement . . . . . . . . . . . . . . . . . . . . . . . . . . . . . . . . . . . 2
What is ZP-Recorder? . . . . . . . . . . . . . . . . . . . . . . . . . . . . . . . . . 4
Hardware/Software Requirements . . . . . . . . . . . . . . . . . . . . . . 4
Installing USB Driver . . . . . . . . . . . . . . . . . . . . . . . . . . . . . . . . . 4
Installing Microsoft .NET Framework . . . . . . . . . . . . . . . . . 5-6
Installing ZP-Recorder Software . . . . . . . . . . . . . . . . . . . . . . . . 6
Working with ZP RecorderUsing ZP-Recorder for the First Time . . . . . . . . . . . . . . . . . . . 7Main Screen Keys . . . . . . . . . . . . . . . . . . . . . . . . . . . . . . . . . . . 8Basic Configuration . . . . . . . . . . . . . . . . . . . . . . . . . . . . . . . . . 9
Quadrants . . . . . . . . . . . . . . . . . . . . . . . . . . . . . . . . . . . . . 9Sign Complement . . . . . . . . . . . . . . . . . . . . . . . . . . . . . . . 9Measuring Units . . . . . . . . . . . . . . . . . . . . . . . . . . . . . . . . . 9Axes Tab . . . . . . . . . . . . . . . . . . . . . . . . . . . . . . . . . . . . . . 10Comparator Tab (High/Low Limits). . . . . . . . . . . . . . . . . 10
Preview Mode (No File Saving or Statistics) . . . . . . . . . . . . . 10
Recording Data (File Saving and Statistics)Manual Mode . . . . . . . . . . . . . . . . . . . . . . . . . . . . . . . . . . . . . 11Automatic Mode . . . . . . . . . . . . . . . . . . . . . . . . . . . . . . . . 11-12
Gauge Memory Download . . . . . . . . . . . . . . . . . . . . . . . . . . . . 12
Saving Data FilesDefault Data Directory. . . . . . . . . . . . . . . . . . . . . . . . . . . . . . 13CSV Data Export . . . . . . . . . . . . . . . . . . . . . . . . . . . . . . . . 13-14
Analyzing Saved DataZoom and Navigation Palette . . . . . . . . . . . . . . . . . . . . . . 14-15Mouse Over Graph . . . . . . . . . . . . . . . . . . . . . . . . . . . . . . . . 15Selected Range. . . . . . . . . . . . . . . . . . . . . . . . . . . . . . . . . . . . 16First Peak Detection. . . . . . . . . . . . . . . . . . . . . . . . . . . . . . . . 17First Peak Detection and Selected Range . . . . . . . . . . . . . . . 18Viewing Multiple Graphs . . . . . . . . . . . . . . . . . . . . . . . . . 18-19Aligning to the Base Graph . . . . . . . . . . . . . . . . . . . . . . . . . . 19Statistics . . . . . . . . . . . . . . . . . . . . . . . . . . . . . . . . . . . . . . . . . 20
PrintingPaper Size. . . . . . . . . . . . . . . . . . . . . . . . . . . . . . . . . . . . . . . . 20Bandwidth @Print Tab. . . . . . . . . . . . . . . . . . . . . . . . . . . . . . 21Print Preview . . . . . . . . . . . . . . . . . . . . . . . . . . . . . . . . . . . . . 21
Notes

page 21page 4
What is ZP Recorder?The ZP Recorder is force analysis software designed to interface
with Imada Z Series (USB) force gauges. ZP Recorder records and
processes 1,000 data per second (not just the peak) and gener-
ates a graph with statistics. Zoom into any part of the graph to
see individual data points at intervals of 1mS. Mouse over data
points to display their force value.
Further analysis can be done on the entire range or by selecting
part of the graph to detect the first peak or generate statistics
within that time interval. Compare and align multiple graphs.
Save graphs or export data to CSV format.
ZP Recorder offers a new toolbox to analyze force data.
Hardware/Software RequirementsPC: Pentium II 400MHz or equivalent with USB port
Operating System: Microsoft Windows NT, 2000, XP
Gauge: Imada Force Gauge with USB port
Install USB driver:1. Turn on the gauge and confirm the USB
caption is visible on the gauge display
(If you have already installed the USB
Driver for ZP Logger you do not have to do it again).
If the caption is not present turn off the gauge.
Press again while holding , CF9 flashes with solid m0.
Press or to cycle CF9m0, CF9m1, CF9m2, CF9m3 and
CF9End. When CF9 m3 appears press to select.
Then press or to cycle. ‘USb’: USb output or ‘232C’:
RS232 output. Press to select ‘USb’, CF9End displays,
press to exit.
Bandwidth @Print Tab (Print Reference Lines)
Print reference lines to illustrate the High/Low values or other
parameters by entering them here. The red line on the printed
graph is the high limit (Ceiling) and the blue line is the low limit
(Bottom).
Print PreviewTo display a graph as it will look when printed select Preview
from the Print menu. Statistics, peaks, bandwidth, date, time and
file path information are also included. Maximize or minimize the
preview by continuously clicking the left or right mouse buttons
while on the preview screen.

page 5page 20
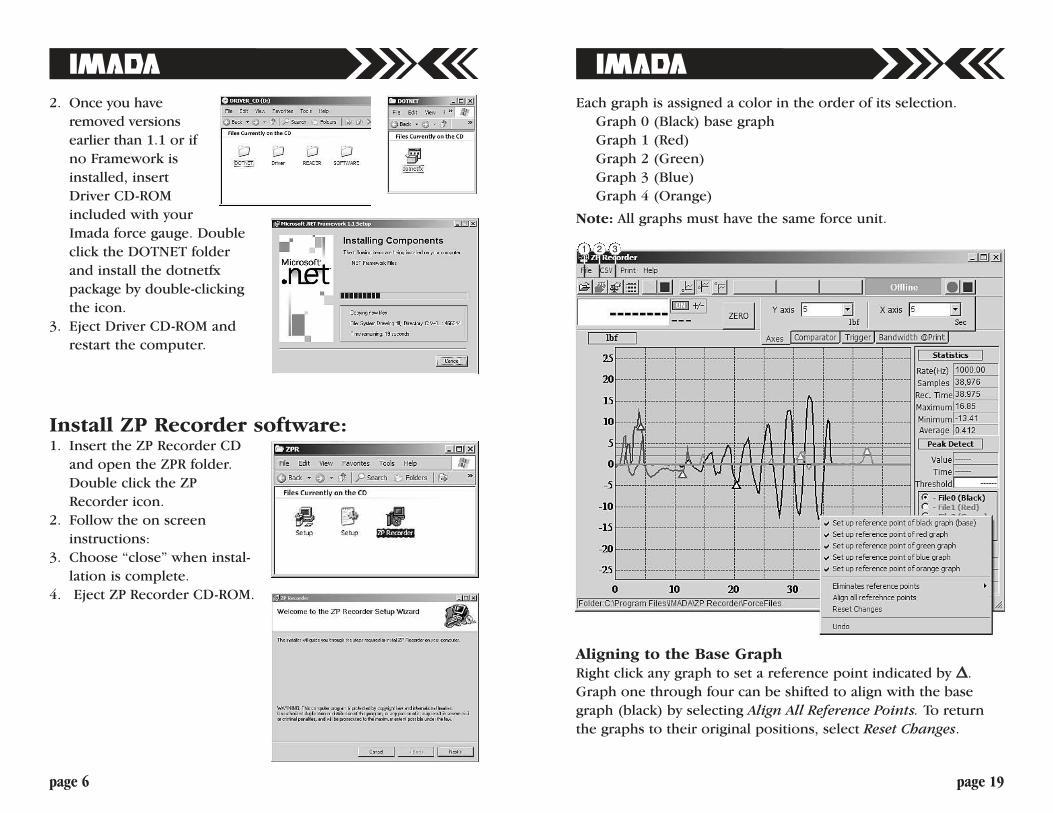
Installing Microsoft .NET FrameworkMicrosoft .NET Framework 1.1 or later must be installed prior to
running ZP Recorder software. If Microsoft.NET Framework 1.0
has been previously installed it must be removed.
1. Check to see if you already have the .NET Framework installed
by clicking Start on your Windows desktop, selecting Control
Panel, and then double-clicking the Add or Remove Programs
icon. When that window appears, scroll through the list of
applications. Highlight and remove all .NET applications earli-
er than version 1.1. If you see Microsoft .NET Framework 1.1
listed, you do not need to install it again. Proceed to install ZP
Recorder.
2. Connect the ZP, ZPH or ZPS
force gauge to computer
with the USB cable provided.
Welcome to the Found New
Hardware Wizard should
appear.
3. Insert the Driver CD-ROM
(included with force gauge)
and select “install software
automatically.” Click Next
and follow onscreen instruc-
tions. When prompted to
search the Web select “No
not this time” and click Next.
4. If a Windows XP compatibil-
ity message appears, select
“continue anyway.”
5. After the ZP driver is
installed select “Finish.”
6. Eject the Driver CD-ROM.
Printing
Paper SizeStandard international paper sizes
like ISO A4 are widely used. Many
U.S. office suppliers are now stock-
ing these dimensions. Refer to
your printer’s manual for paper
size configurations.
A4 210 x 297mm (8 1/4" x 11 3/4") approx. letter size
B4 250 x 353mm (9 7/8" x 13 7/8") approx. legal size
A3 297 x 420mm (11 3/4" x 16 1/2") approx. tabloid size
Statistics
After recording data, view statistics of the entire graph or selected
range by clicking (key ), then click either the Entire range or
the Selected range buttons. For Selected Range refer to page 16.
4
4
Printing a GraphChoose Print� Print.
page 19page 6
2. Once you have
removed versions
earlier than 1.1 or if
no Framework is
installed, insert
Driver CD-ROM
included with your
Imada force gauge. Double
click the DOTNET folder
and install the dotnetfx
package by double-clicking
the icon.
3. Eject Driver CD-ROM and
restart the computer.
Install ZP Recorder software:1. Insert the ZP Recorder CD
and open the ZPR folder.
Double click the ZP
Recorder icon.
2. Follow the on screen
instructions:
3. Choose “close” when instal-
lation is complete.
4. Eject ZP Recorder CD-ROM.
Each graph is assigned a color in the order of its selection.
Graph 0 (Black) base graph
Graph 1 (Red)
Graph 2 (Green)
Graph 3 (Blue)
Graph 4 (Orange)
Note: All graphs must have the same force unit.
Aligning to the Base GraphRight click any graph to set a reference point indicated by ∆.
Graph one through four can be shifted to align with the base
graph (black) by selecting Align All Reference Points. To return
the graphs to their original positions, select Reset Changes.
321
page 7page 18
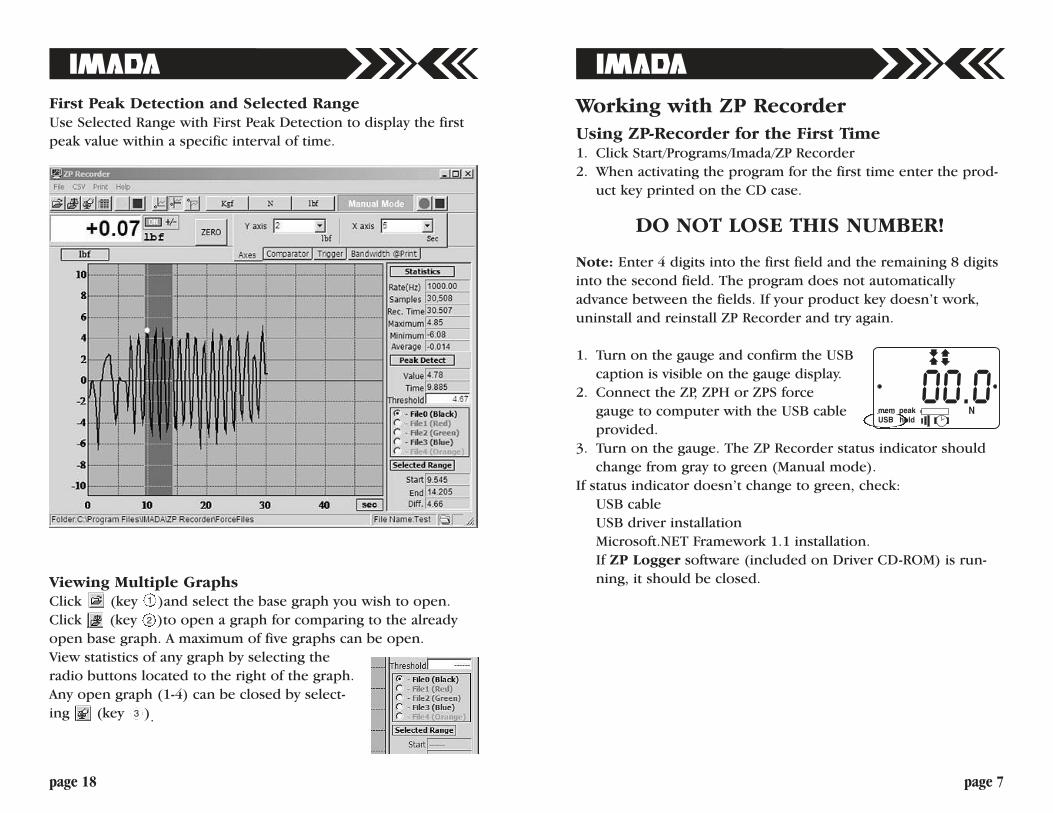
First Peak Detection and Selected RangeUse Selected Range with First Peak Detection to display the first
peak value within a specific interval of time.
Viewing Multiple Graphs Click (key )and select the base graph you wish to open.
Click (key )to open a graph for comparing to the already
open base graph. A maximum of five graphs can be open.
View statistics of any graph by selecting the
radio buttons located to the right of the graph.
Any open graph (1-4) can be closed by select-
ing (key ).3
2
1
Working with ZP Recorder
Using ZP-Recorder for the First Time1. Click Start/Programs/Imada/ZP Recorder
2. When activating the program for the first time enter the prod-
uct key printed on the CD case.
DO NOT LOSE THIS NUMBER!
Note: Enter 4 digits into the first field and the remaining 8 digits
into the second field. The program does not automatically
advance between the fields. If your product key doesn’t work,
uninstall and reinstall ZP Recorder and try again.
1. Turn on the gauge and confirm the USB
caption is visible on the gauge display.
2. Connect the ZP, ZPH or ZPS force
gauge to computer with the USB cable
provided.
3. Turn on the gauge. The ZP Recorder status indicator should
change from gray to green (Manual mode).
If status indicator doesn’t change to green, check:
USB cable
USB driver installation
Microsoft.NET Framework 1.1 installation.
If ZP Logger software (included on Driver CD-ROM) is run-
ning, it should be closed.
page 17page 8
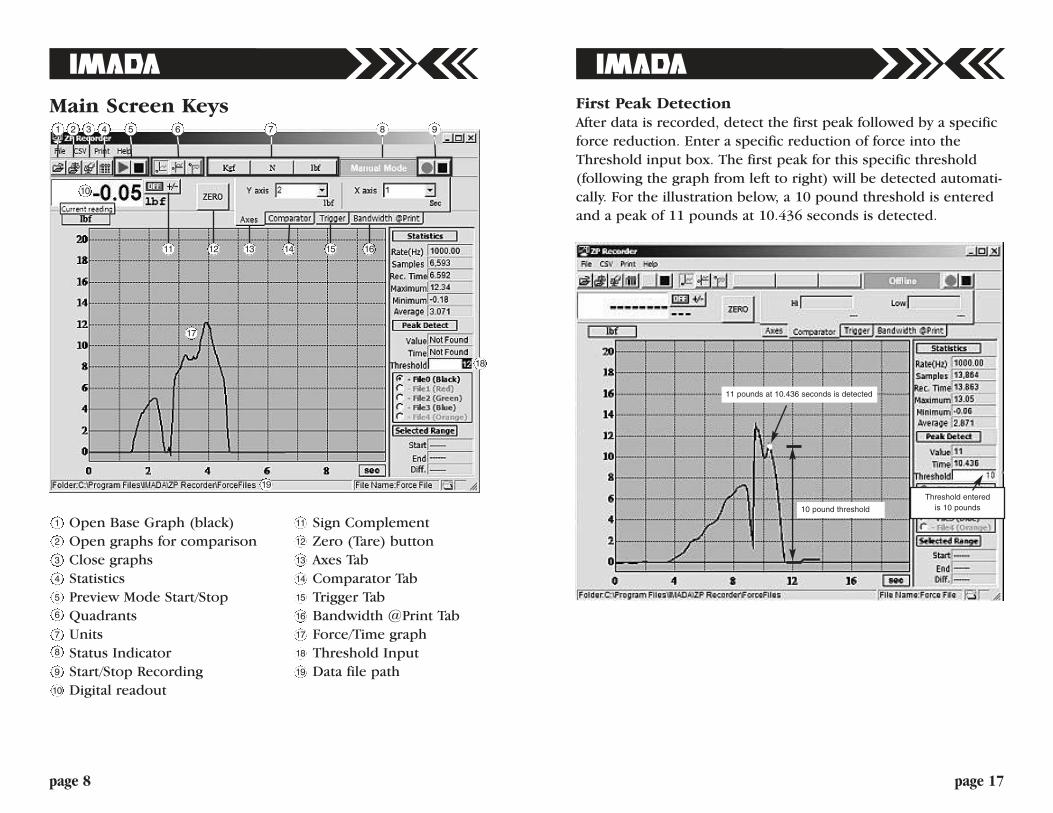
Open Base Graph (black)
Open graphs for comparison
Close graphs
Statistics
Preview Mode Start/Stop
Quadrants
Units
Status Indicator
Start/Stop Recording
Digital readout10
9
8
7
6
5
4
3
2
1 Sign Complement
Zero (Tare) button
Axes Tab
Comparator Tab
Trigger Tab
Bandwidth @Print Tab
Force/Time graph
Threshold Input
Data file path19
18
17
16
15
14
13
12
11
6321 4 7 98
10
17
19
14
5
18
Main Screen Keys
13 15 1611 12
First Peak DetectionAfter data is recorded, detect the first peak followed by a specific
force reduction. Enter a specific reduction of force into the
Threshold input box. The first peak for this specific threshold
(following the graph from left to right) will be detected automati-
cally. For the illustration below, a 10 pound threshold is entered
and a peak of 11 pounds at 10.436 seconds is detected.
11 pounds at 10.436 seconds is detected
10 pound threshold
Threshold entered
is 10 pounds
page 9page 16
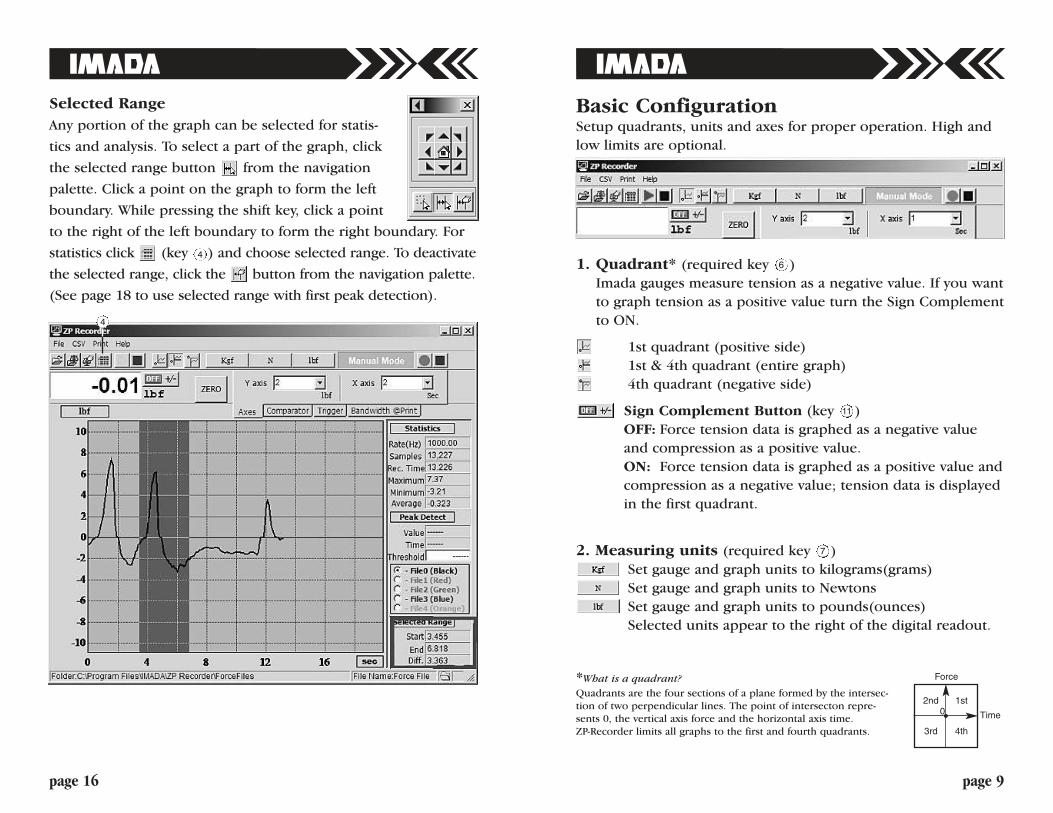
Selected Range
Any portion of the graph can be selected for statis-
tics and analysis. To select a part of the graph, click
the selected range button from the navigation
palette. Click a point on the graph to form the left
boundary. While pressing the shift key, click a point
to the right of the left boundary to form the right boundary. For
statistics click (key ) and choose selected range. To deactivate
the selected range, click the button from the navigation palette.
(See page 18 to use selected range with first peak detection).
4
4
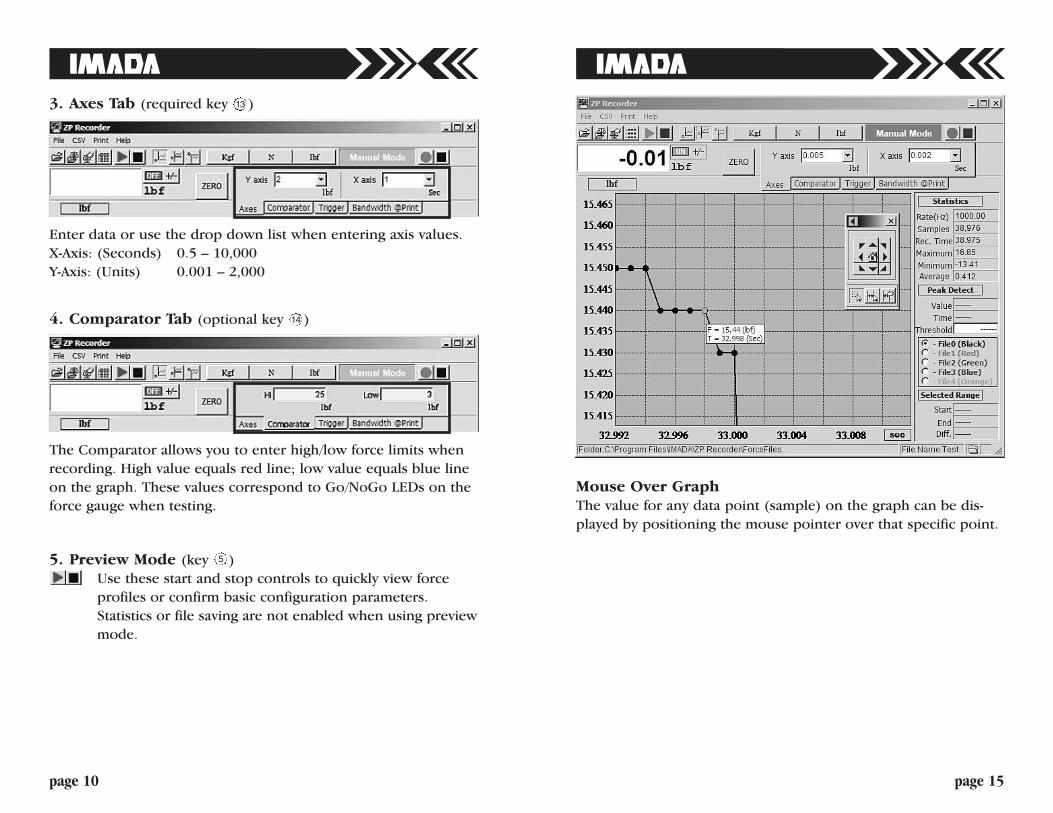
1. Quadrant* (required key )
Imada gauges measure tension as a negative value. If you want
to graph tension as a positive value turn the Sign Complement
to ON.
1st quadrant (positive side)
1st & 4th quadrant (entire graph)
4th quadrant (negative side)
Sign Complement Button (key )
OFF: Force tension data is graphed as a negative value
and compression as a positive value.
ON: Force tension data is graphed as a positive value and
compression as a negative value; tension data is displayed
in the first quadrant.
11
6
2. Measuring units (required key )
Set gauge and graph units to kilograms(grams)
Set gauge and graph units to Newtons
Set gauge and graph units to pounds(ounces)
Selected units appear to the right of the digital readout.
7
*What is a quadrant?
Quadrants are the four sections of a plane formed by the intersec-
tion of two perpendicular lines. The point of intersecton repre-
sents 0, the vertical axis force and the horizontal axis time.
ZP-Recorder limits all graphs to the first and fourth quadrants.
Basic ConfigurationSetup quadrants, units and axes for proper operation. High and
low limits are optional.
1st
Force
Time0
4th
2nd
3rd
page 15page 10
4. Comparator Tab (optional key )14
The Comparator allows you to enter high/low force limits when
recording. High value equals red line; low value equals blue line
on the graph. These values correspond to Go/NoGo LEDs on the
force gauge when testing.
5. Preview Mode (key )
Use these start and stop controls to quickly view force
profiles or confirm basic configuration parameters.
Statistics or file saving are not enabled when using preview
mode.
5
3. Axes Tab (required key )13
Enter data or use the drop down list when entering axis values.
X-Axis: (Seconds) 0.5 – 10,000
Y-Axis: (Units) 0.001 – 2,000
Mouse Over GraphThe value for any data point (sample) on the graph can be dis-
played by positioning the mouse pointer over that specific point.

page 11page 14
Zoom and Navigation Palette After data is recorded the zoom and navigation
palette appears. Use the arrow keys to shift the
graph in the viewing window. Click to return to
the original view.
Use the zoom tool to magnify any part of your
graph. Click and hold the mouse button while dragging the
mouse over a selected part of the graph to create a rectangle.
Release the mouse button to magnify the area within the rectan-
gle. You may repeat the process and magnify the graph so indi-
vidual data points at intervals of 1mS are visible. Click to
return to the original view.
The zoom tool may be used in combination with Selected Area,
First Peak Detection, or Viewing Multiple Graphs.
Analyzing Saved Data
Saving the Selected Range of a Graph as a New CSV FileHighlight any portion of a graph to determine its selected range
(see page 16 for details). With the range of the graph highlighted,
choose CSV � Save as selected range CSV file… Enter the file
name and if desired modify the file path. Note: If no selected
range is defined the entire graph will be saved.
Adding the Selected Range of a Graph to an existingCSV fileHighlight any portion of a graph to determine its selected range.
See page 16 for details. With the range of the graph highlighted,
choose CSV � Save existing range CSV file… Select a CSV file you
wish to modify and click open. The next available column in the
CSV file selected will be populated with data. Note: If no selected
range is defined the entire graph will be added to the file.
Automatic ModeCan be configured to capture and save data for both destructive
and nondestructive testing (See the chart below).
Recording DataRecording can be configured in two modes: Manual or Automatic.
Manual Mode1. Click the trigger tab and then click .
2. Check Manual mode. Status indicator is green.
3. Press Zero to tare weight of the attachment on the gauge.
4. Click the red button to begin recording. Click the black
button to stop recording.
(See File Saving section for an explanation on system archiving.)
A
B
C
Start parameter is required. Stop parameters and are
optional. Stop parameter sets the high limit and stops test-
ing if force drops below the
start value. Stop recording at
any time by clicking black
button .
CB
CBA
STOP START STOPVALUE VALUE VALUE
< <
Destructive Tests x x
Non-Destructive Tests x x
Non-Destructive Tests x x x
with Safety Stop
BAC

page 13page 12
Data ExportAll recorded files with less
than 65,536 data points
(samples) can be saved as a
CSV file. A CSV (comma sep-
arated values) file contains
the values in a table as a
series of ASCII text lines arranged so that a comma separates
each column. Many applications like Microsoft Excel or Microsoft
Access can read CSV files.
When exporting, the ZP recorder designates the first five rows of
CSV information as statistics.
Saving a New CSV FileWith a file open, go to the file menu and choose CSV � Save as
CSV file. Enter the file name and if desired modify the file path.
Adding a Column to an existing CSV fileWith a file open, go to the file menu and choose CSV � Existing
CSV file. Select a CSV file you wish to modify and click open. The
next available column in the CSV file selected will be populated
with data.
Saving FilesData DirectoryChoose File � Setting � Save
as… to modify the name and
path of the data files saved in
the recording mode. By
default, files are saved at C:\
Program Files \ Imada \ ZP
recorder \ ForceFiles.
1. Click the trigger tab and then click .
2. Check Automatic mode. Status indicator is
yellow.
3. Enter start parameter into the F>= input box. Press the
Return key.
4. Enter stop parameters F> and/or F< into their respec-
tive input boxes. Press the Return key. Select the correspond-
ing check boxes to activate these parameters.
5. Press Zero to tare weight of the attachment on the gauge.
6. Click red button to enable recording. The status indicator
displays yellow until the start parameter is
met, and then changes to red .
Recording stops, when the value of either stop parameter
or is reached, or the black button is pressed.
(See File Saving section for an explanation on system archiving.)
File Saving (System Archiving)While recording, the system automatically saves file(s) with a fce
extension. The first file saved is Force File001. The next file
saved is incremented to Force File002. The default file path is C:\
Program Files \ Imada \ ZP recorder \ ForceFiles. To modify the
file name and file path choose File � Setting � Save as…
Gauge Memory DownloadUse ZP Logger to download gauge memory to your computer. ZP
Logger is included with the gauge on the USB Driver CD-ROM.
ZP Recorder must be closed when using ZP Logger.
C
B
A
CB
A