ZoomCharts User Guide Net Graph - Company Network, with Icon
7
Product Name: NET CHART Network Graph, Company Network, With Icons USER MANUAL / GUIDE FOR IPHONE ZoomCharts http://www.zoomcharts.com The world’s most interactive data visualization software
-
Upload
zoomcharts -
Category
Documents
-
view
35 -
download
0
description
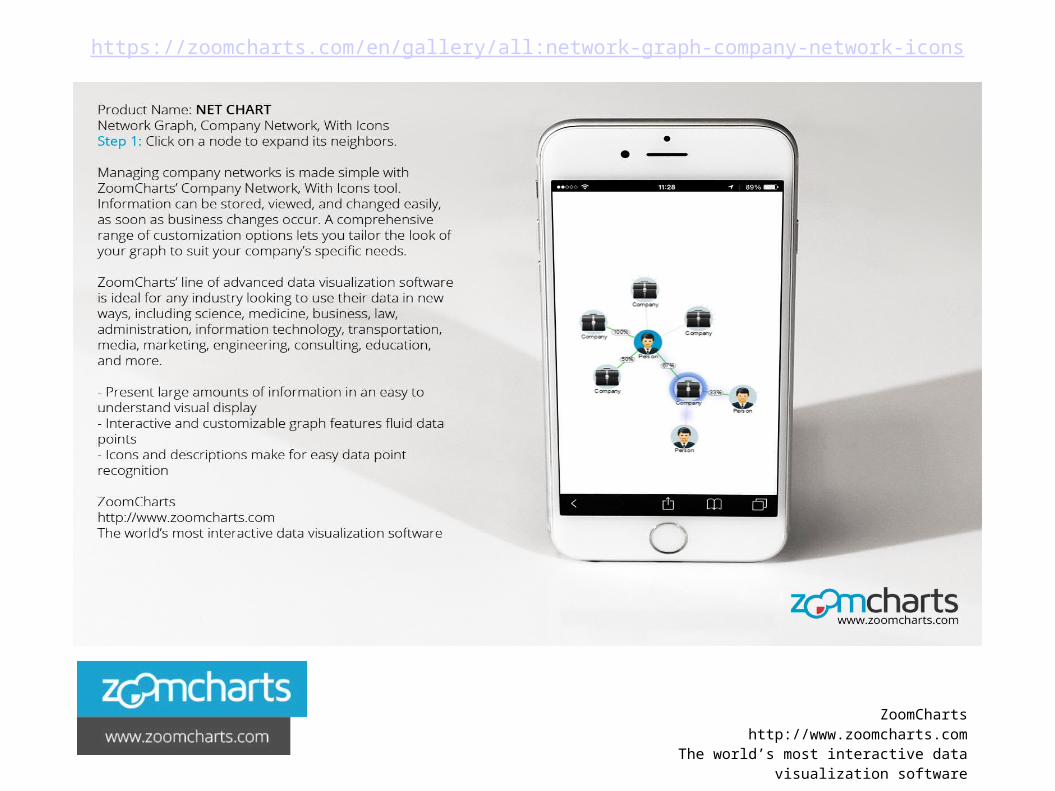
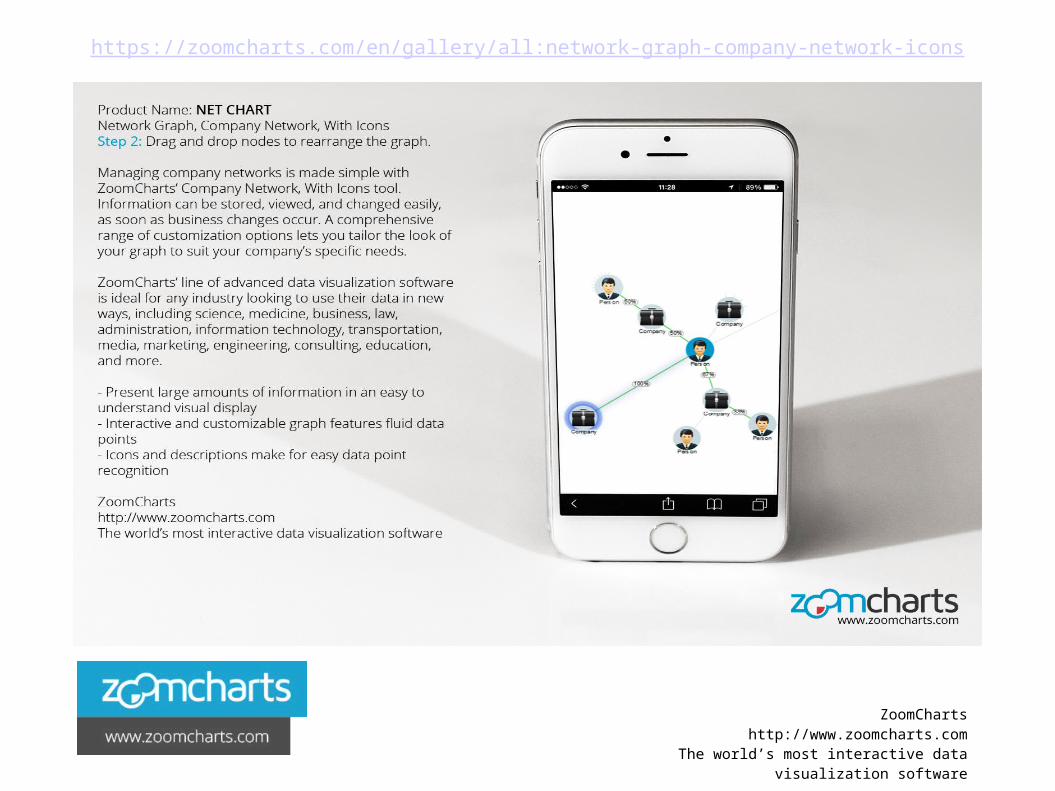
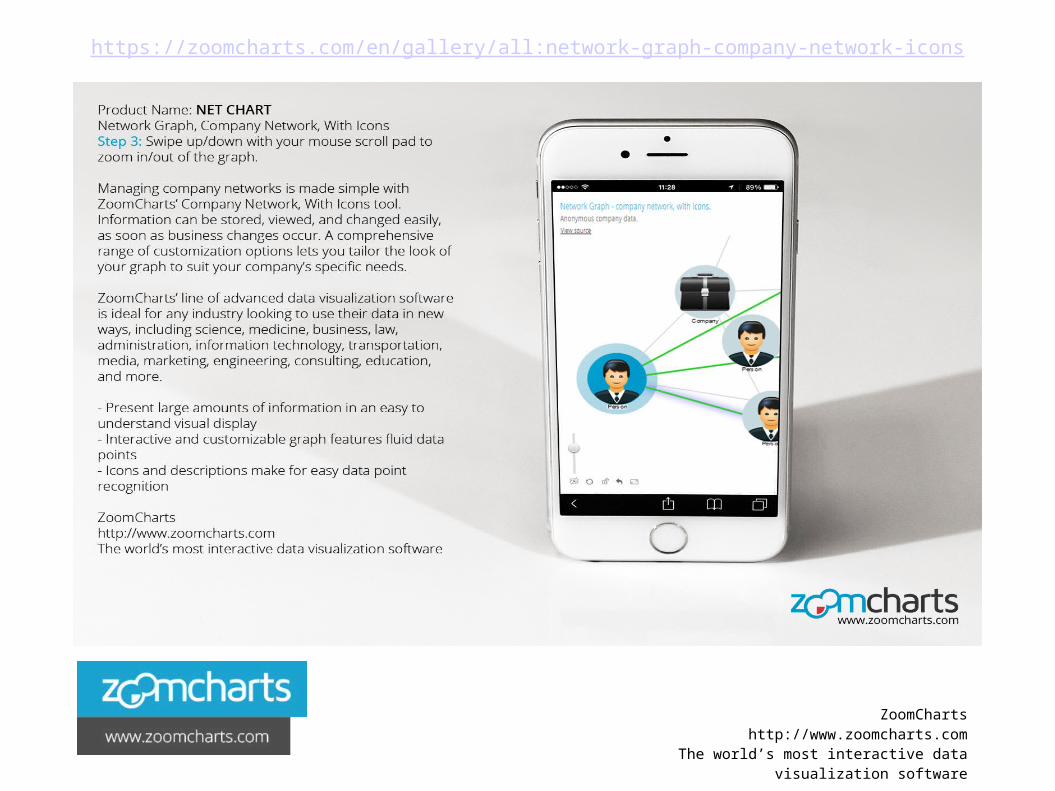
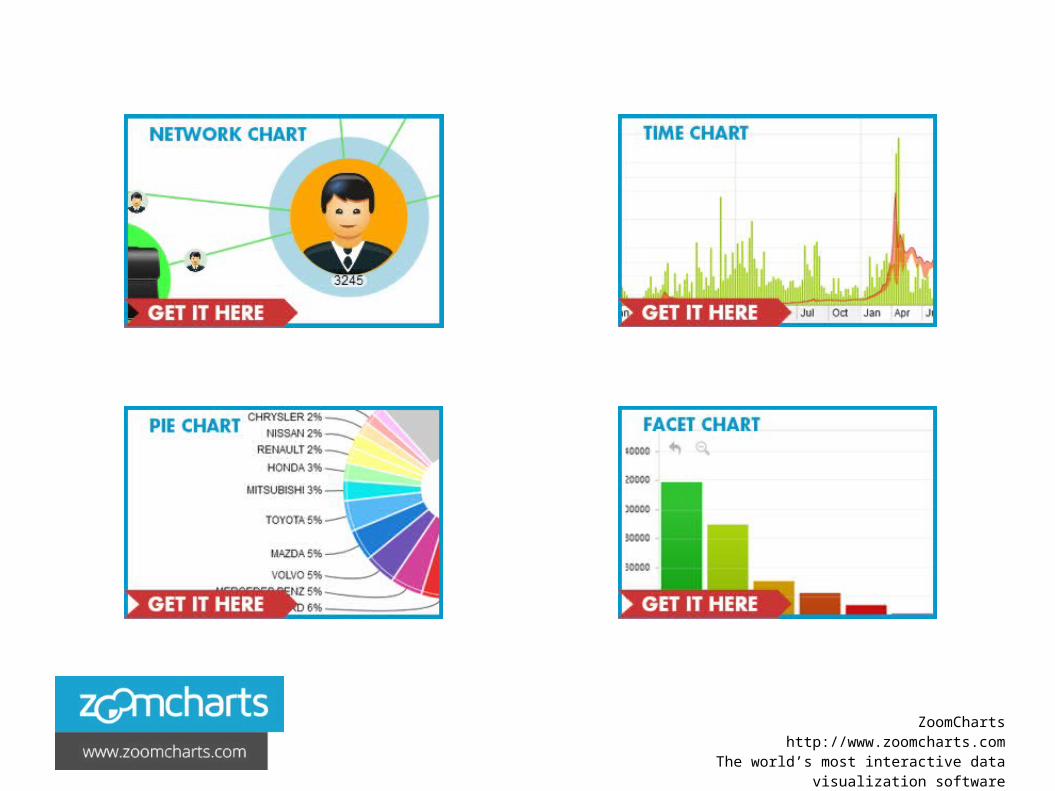
https://zoomcharts.com/en/gallery/all:network-graph-company-network-icons Managing company networks is made simple with ZoomCharts’ Company Network, With Icons tool. Information can be stored, viewed, and changed easily, as soon as business changes occur. A comprehensive range of customization options lets you tailor the look of your graph to suit your company’s specific needs. ZoomCharts’ line of advanced data visualization software is ideal for any industry looking to use their data in new ways, including science, medicine, business, law, administration, information technology, transportation, media, marketing, engineering, consulting, education, and more. - Present large amounts of information in an easy to understand visual display - Interactive and customizable graph features fluid data points - Icons and descriptions make for easy data point recognition Step 1 Click on a node to expand its neighbors. Step 2 Drag and drop nodes to rearrange the graph. Step 3 Swipe up/down with your mouse scroll pad to zoom in/out of the graph. Step 4 Right clicking on a node will give you more options. Check out ZoomCharts products: Network Chart Big network exploration Explore linked data sets. Highlight relevant data with dynamic filters and visual styles. Incremental data loading. Exploration with focus nodes. Time Chart Time navigation and exploration tool Browse activity logs, select time ranges. Multiple data series and value axes. Switch between time units. Pie Chart Amazingly intuitive hierarchical data exploration Get quick overview of your data and drill down when necessary. All in a single easy to use chart. Facet Chart Scrollable bar chart with drill-down Compare values side by side and provide easy access to the long tail. ZoomCharts http://www.zoomcharts.com The world’s most interactive data visualization software - PowerPoint PPT Presentation
Transcript of ZoomCharts User Guide Net Graph - Company Network, with Icon
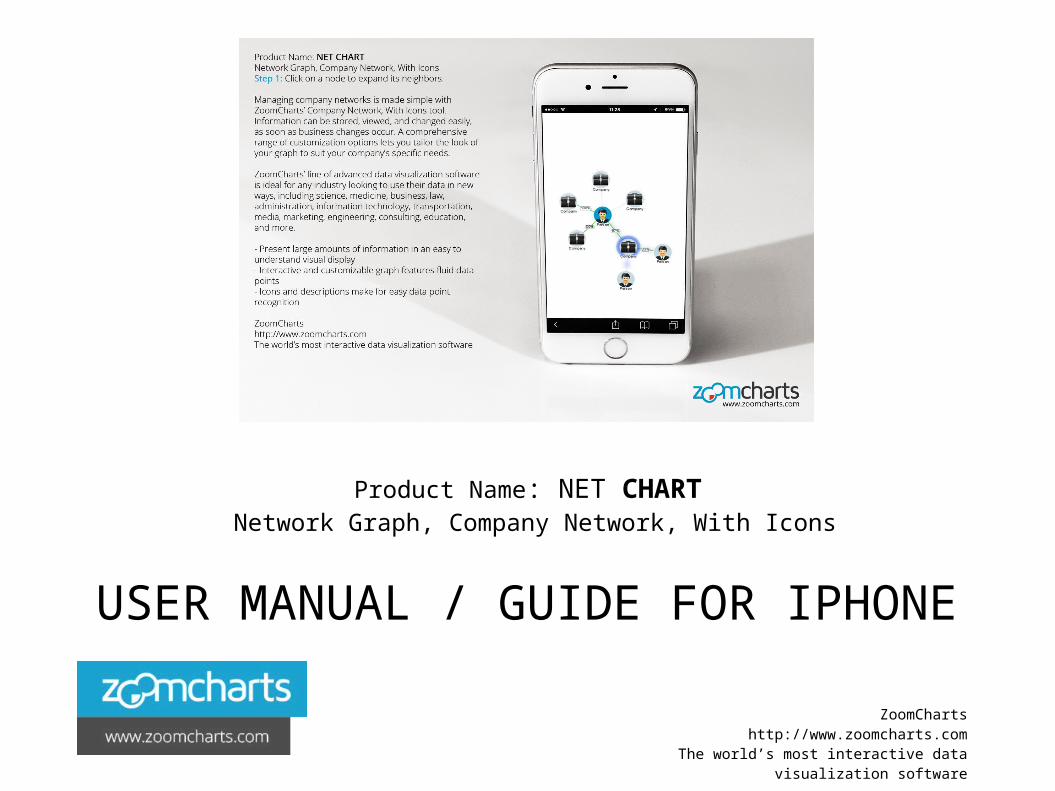
Product Name: NET CHART Network Graph, Company Network, With Icons
USER MANUAL / GUIDE FOR IPHONE
ZoomChartshttp://www.zoomcharts.com
The world’s most interactive data visualization software
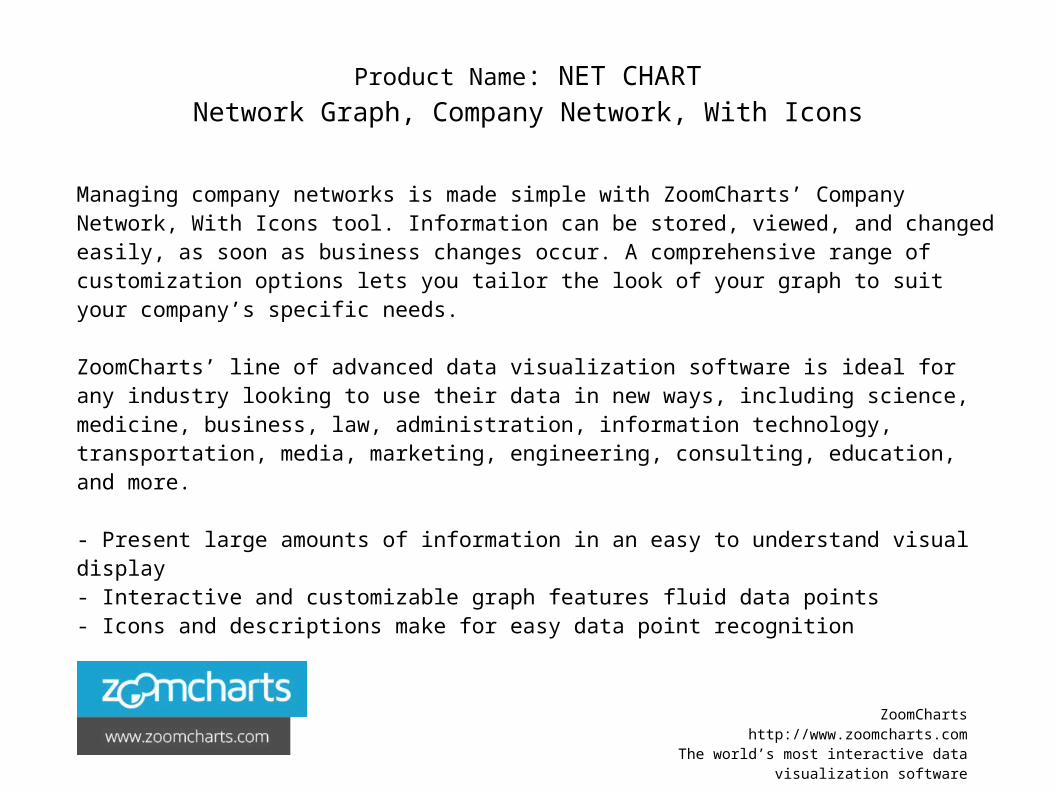
Managing company networks is made simple with ZoomCharts’ Company Network, With Icons tool. Information can be stored, viewed, and changed easily, as soon as business changes occur. A comprehensive range of customization options lets you tailor the look of your graph to suit your company’s specific needs.
ZoomCharts’ line of advanced data visualization software is ideal for any industry looking to use their data in new ways, including science, medicine, business, law, administration, information technology, transportation, media, marketing, engineering, consulting, education, and more.
- Present large amounts of information in an easy to understand visual display- Interactive and customizable graph features fluid data points- Icons and descriptions make for easy data point recognition
Product Name: NET CHARTNetwork Graph, Company Network, With Icons
ZoomChartshttp://www.zoomcharts.com
The world’s most interactive data visualization software
ZoomCharts
http://www.zoomcharts.comThe world’s most interactive data visualization
software
https://zoomcharts.com/en/gallery/all:network-graph-company-network-icons
ZoomCharts
http://www.zoomcharts.comThe world’s most interactive data visualization
software
https://zoomcharts.com/en/gallery/all:network-graph-company-network-icons
ZoomCharts
http://www.zoomcharts.comThe world’s most interactive data visualization
software
https://zoomcharts.com/en/gallery/all:network-graph-company-network-icons

ZoomCharts
http://www.zoomcharts.comThe world’s most interactive data visualization
software
https://zoomcharts.com/en/gallery/all:network-graph-company-network-icons
ZoomCharts
http://www.zoomcharts.comThe world’s most interactive data visualization
software