ZoomCharts Time Chart Custom Background for PC
7
Product Name: Time Chart USER MANUAL / GUIDE CUSTOM BACKGROUND IMAGE PC http://www.zoomcharts.com/ The world’s most interactive data visualization software
-
Upload
zoomcharts -
Category
Documents
-
view
29 -
download
1
description
https://zoomcharts.com/en/gallery/all:time-chart-custom-background-image-historical-weather-paris-france With ZoomCharts’ Custom Background Image feature, you can incorporate custom visuals into your graphs to enhance data presentation. Instead of a bland background, why not support your data with visuals that match your subject matter? ZoomCharts’ Custom Background Image is an attractive feature currently being used to meet the advanced data visualization needs of various educational fields, including sciences and mathematics, such as anatomy, biochemistry, ecology, microbiology, nutrition, neuroscience, physiology, zoology, chemical engineering, geochemistry, molecular biology, geology, paleontology, physics, astronomy, algebra, computer science, geometry, logic, and statistics, and the arts such as, music, dance, theatre, film, animation, architecture, applied arts, photography, graphic design, interior design, and mixed media. - Interactive chart that supports large amounts of data - Chart background can be customized to suit your needs - Data presentation is functional and visually appealing Step 1 Customizable images allow you to style your chart background. Step 2 Hover over time segments to display detailed information. Step 3 Click on a time segment to expand data. Step 4 Zoom in and out of the chart by swiping up or down with your mouse scroll pad, or by using the Zoom-out feature at the top left. Check out ZoomCharts products: Network Chart Big network exploration Explore linked data sets. Highlight relevant data with dynamic filters and visual styles. Incremental data loading. Exploration with focus nodes. Time Chart Time navigation and exploration tool Browse activity logs, select time ranges. Multiple data series and value axes. Switch between time units. Pie Chart Amazingly intuitive hierarchical data exploration Get quick overview of your data and drill down when necessary. All in a single easy to use chart. Facet Chart Scrollable bar c - PowerPoint PPT Presentation
Transcript of ZoomCharts Time Chart Custom Background for PC
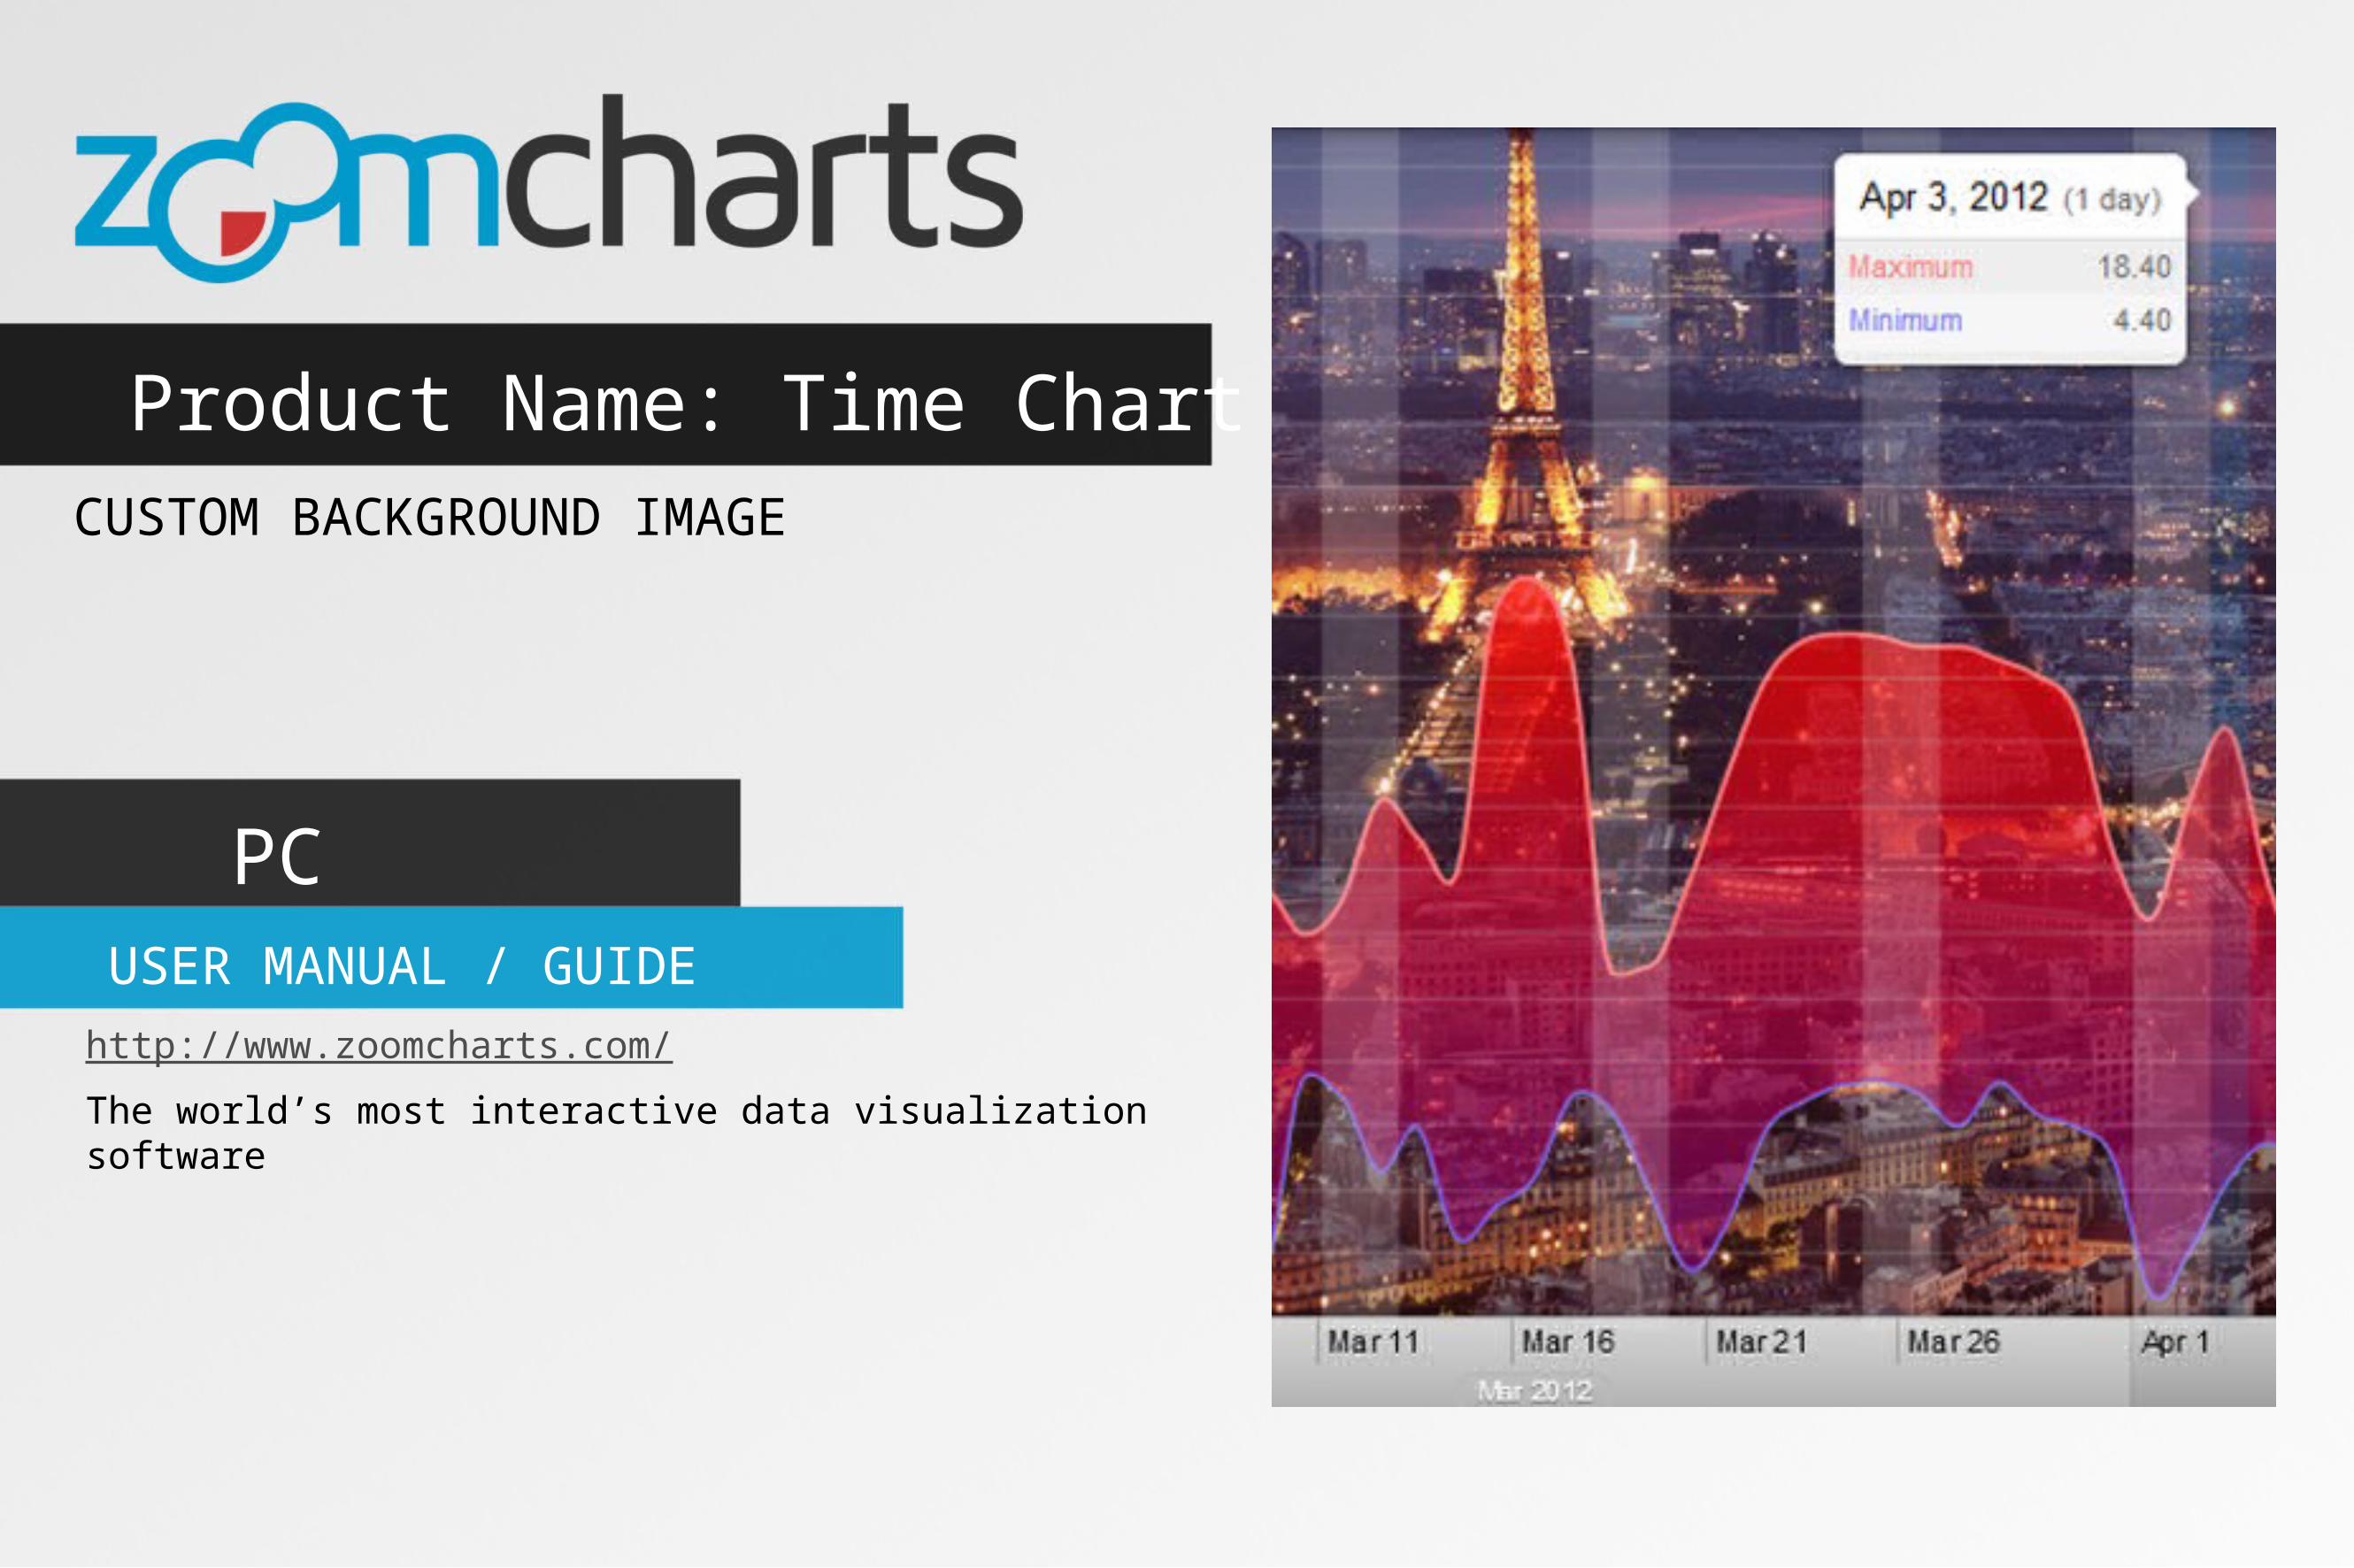
Product Name: Time Chart
USER MANUAL / GUIDE
CUSTOM BACKGROUND IMAGE
PC
http://www.zoomcharts.com/
The world’s most interactive data visualization software
Product Name: Time ChartCUSTOM BACKGROUND IMAGE
With ZoomCharts’ Custom Background Image feature, you can incorporate custom visuals into your graphs to enhance data presentation. Instead of a bland background, why not support your data with visuals that match your subject matter?
ZoomCharts’ Custom Background Image is an attractive feature currently being used to meet the advanced data visualization needs of various educational fields, including sciences and mathematics, such as anatomy, biochemistry, ecology, microbiology, nutrition, neuroscience, physiology, zoology, chemical engineering, geochemistry, molecular biology, geology, paleontology, physics, astronomy, algebra, computer science, geometry, logic, and statistics, and the arts such as, music, dance, theatre, film, animation, architecture, applied arts, photography, graphic design, interior design, and mixed media.
- Interactive chart that supports large amounts of data- Chart background can be customized to suit your needs- Data presentation is functional and visually appealing
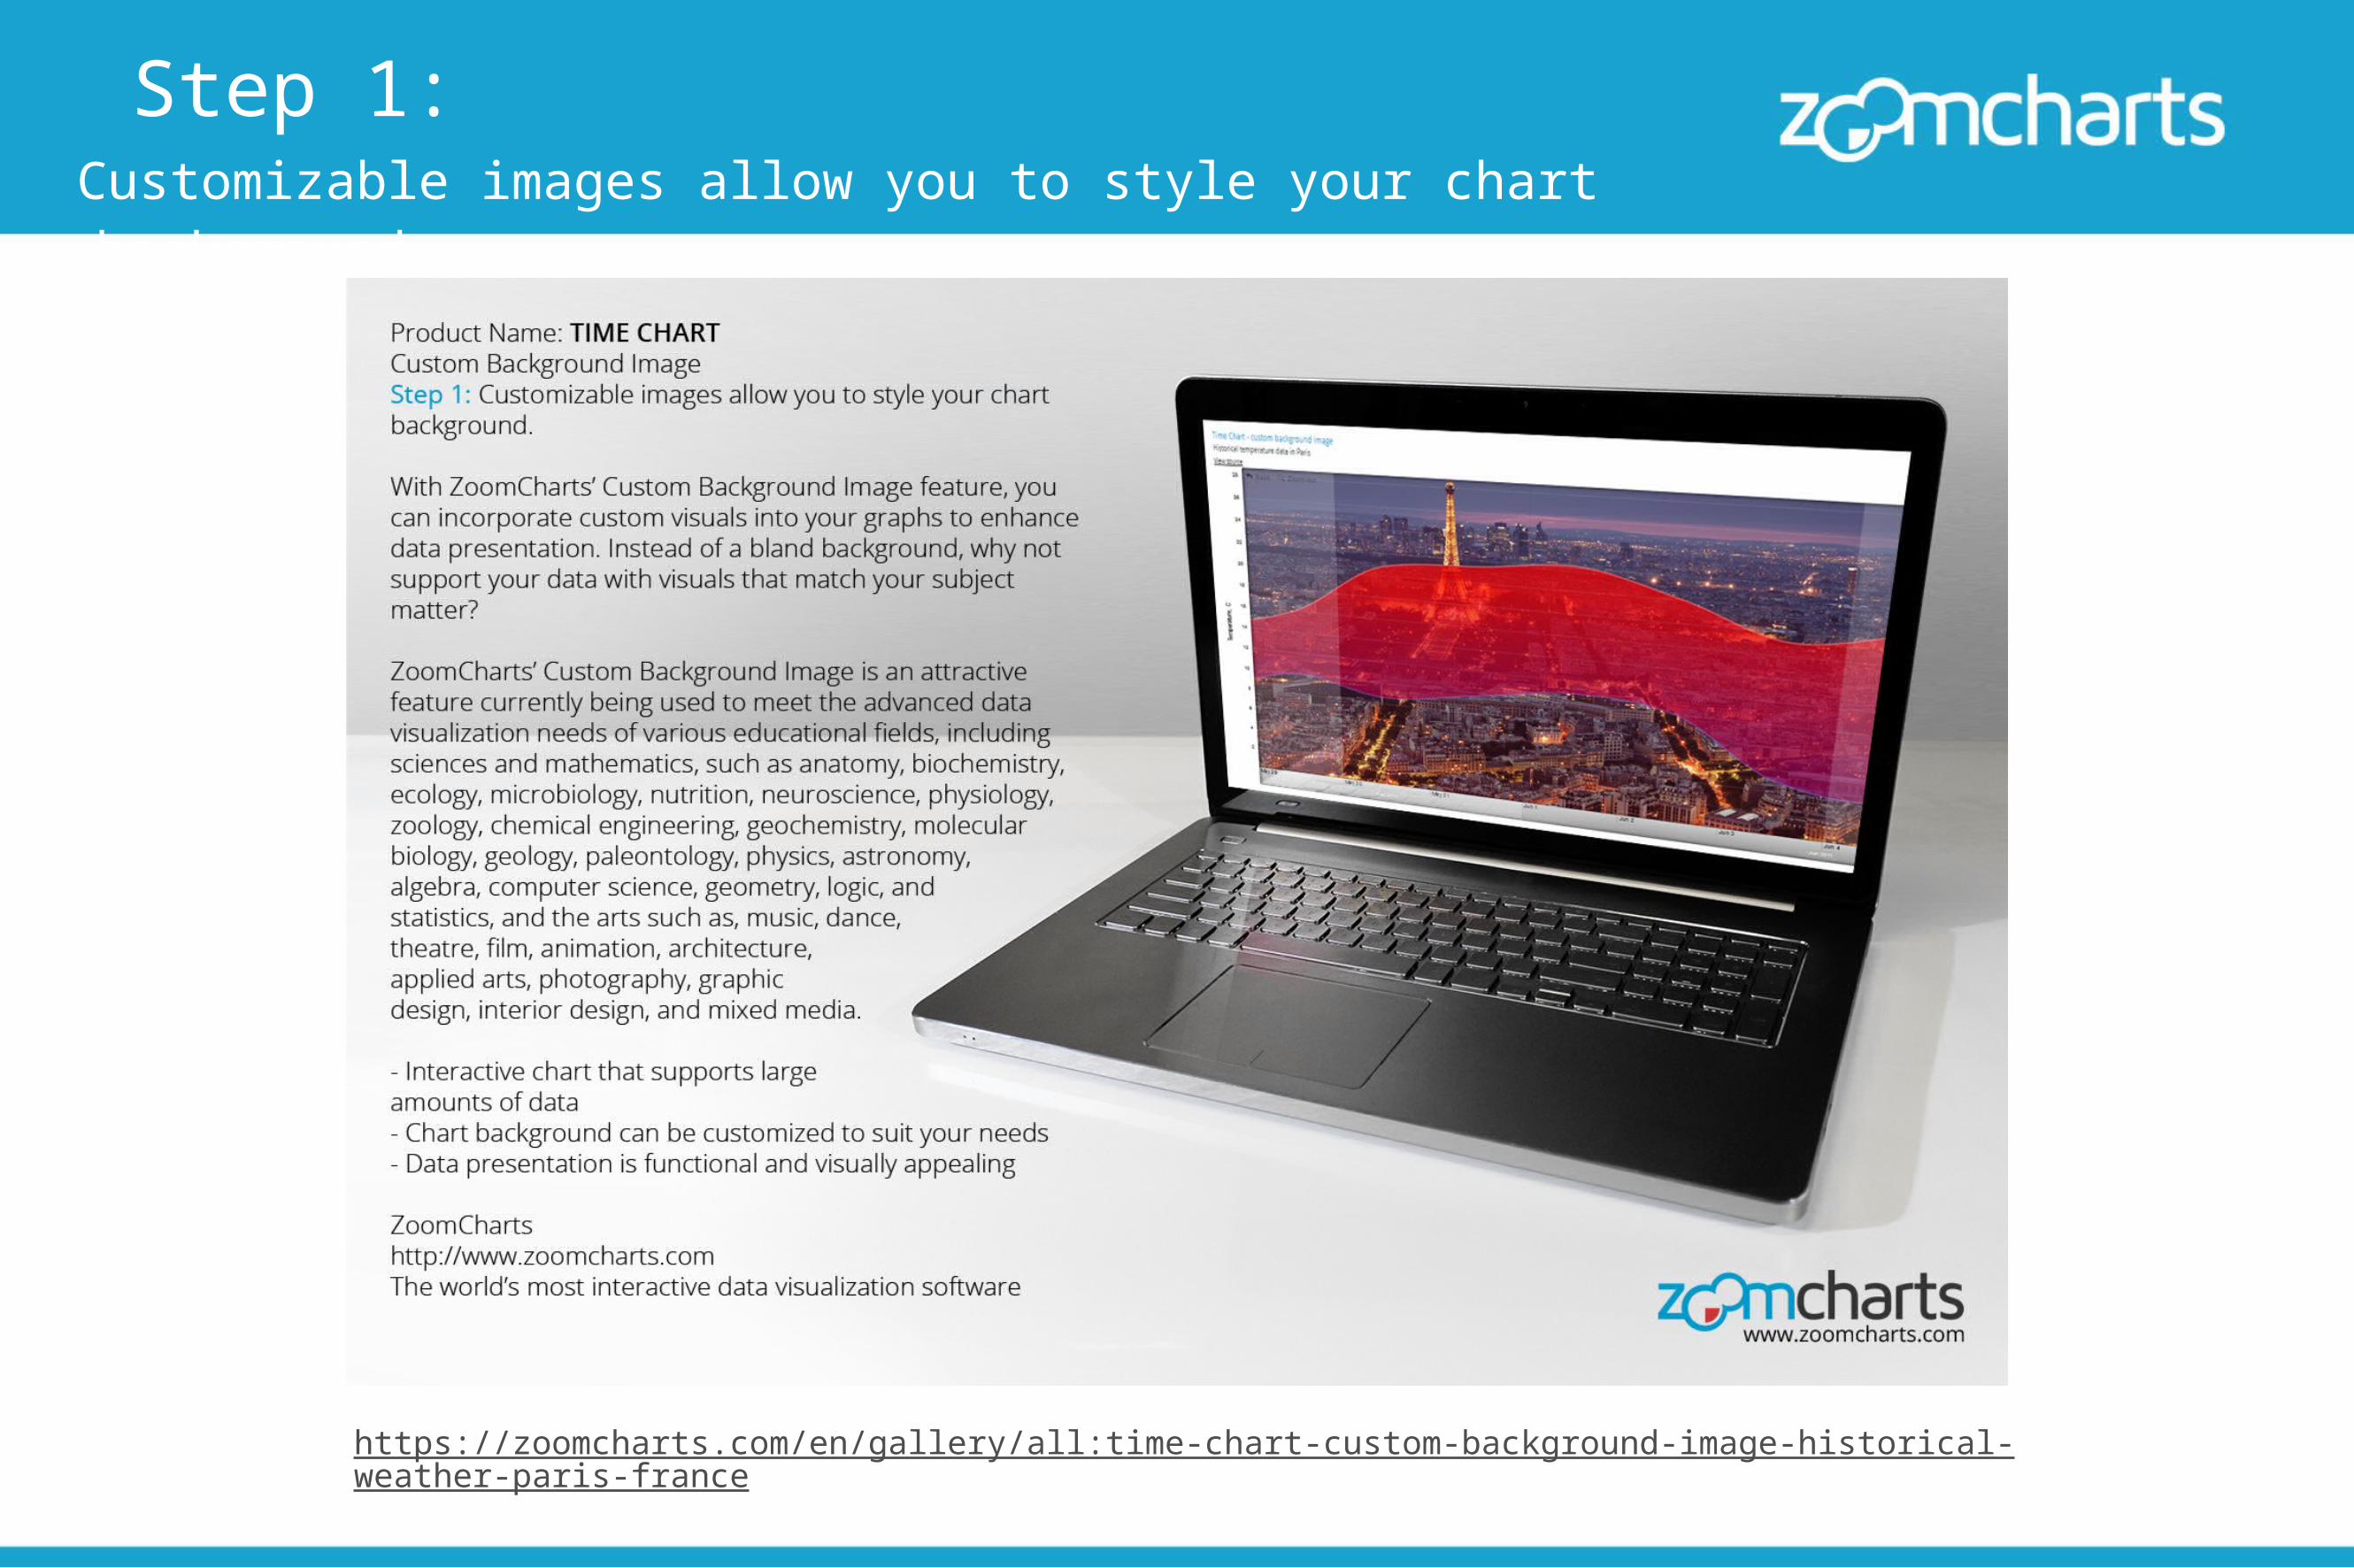
Step 1: Customizable images allow you to style your chart background.
https://zoomcharts.com/en/gallery/all:time-chart-custom-background-image-historical-weather-paris-france
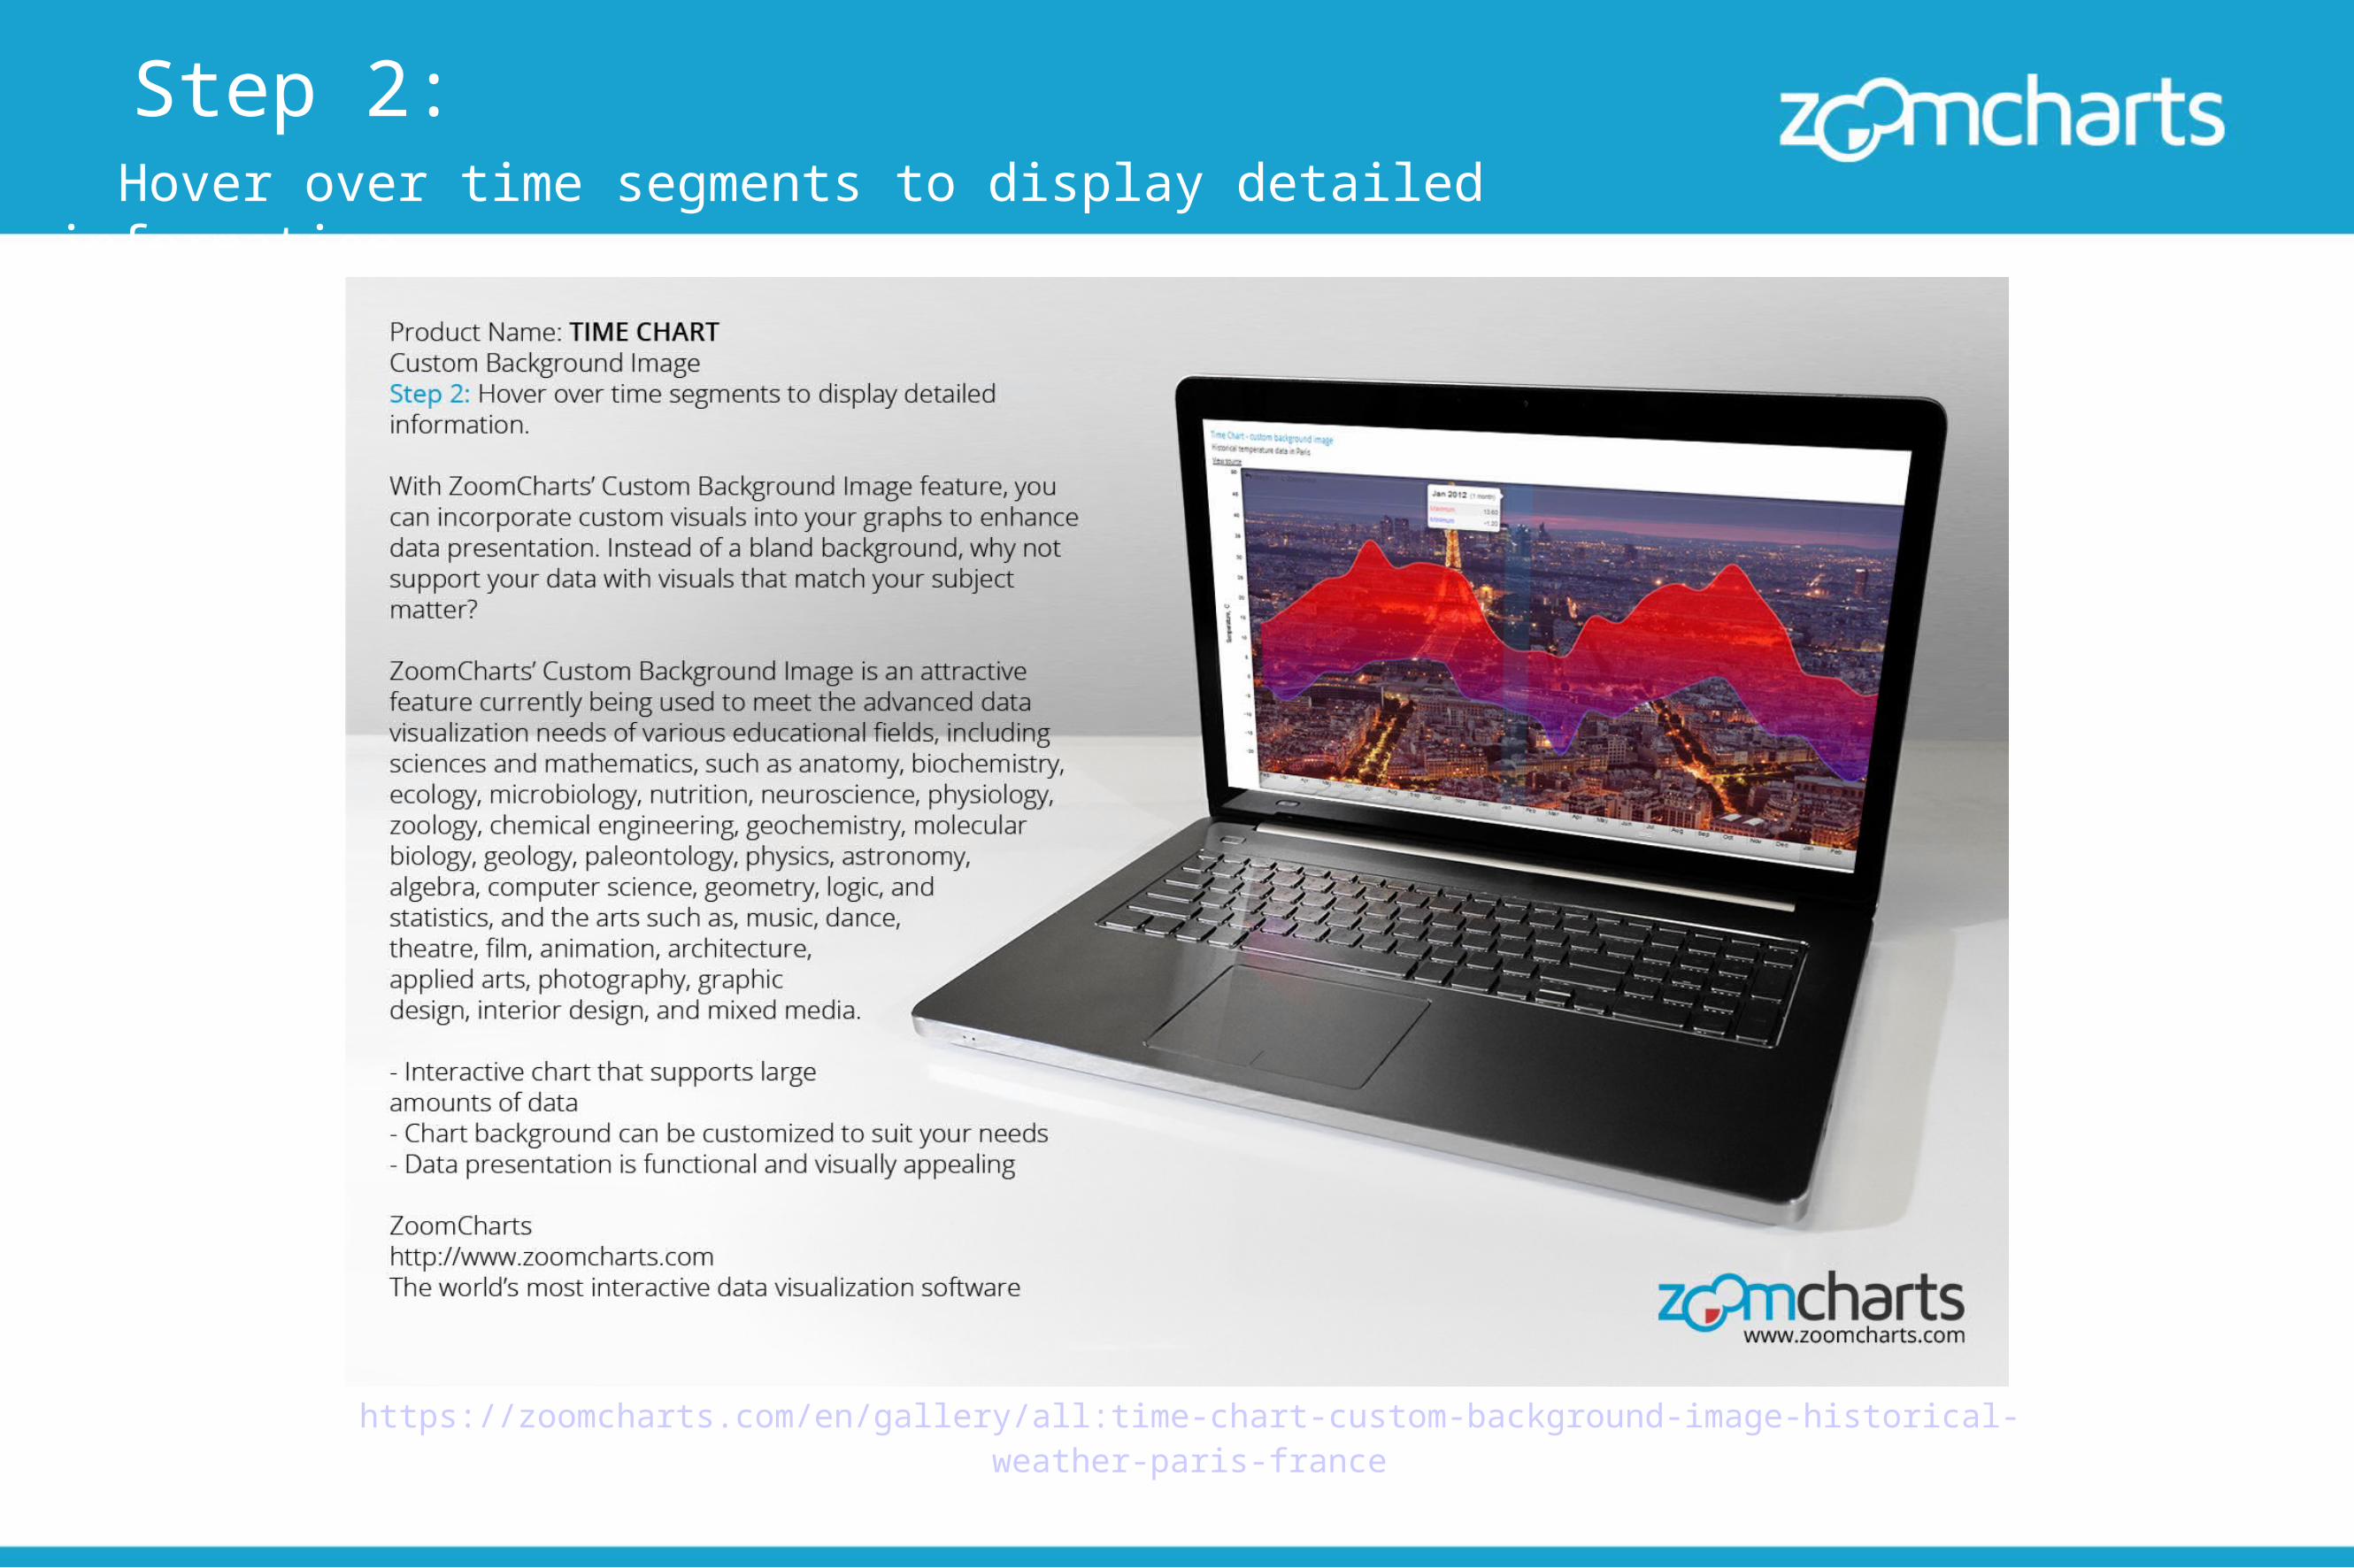
Step 2: Hover over time segments to display detailed information.
https://zoomcharts.com/en/gallery/all:time-chart-custom-background-image-historical-weather-paris-france
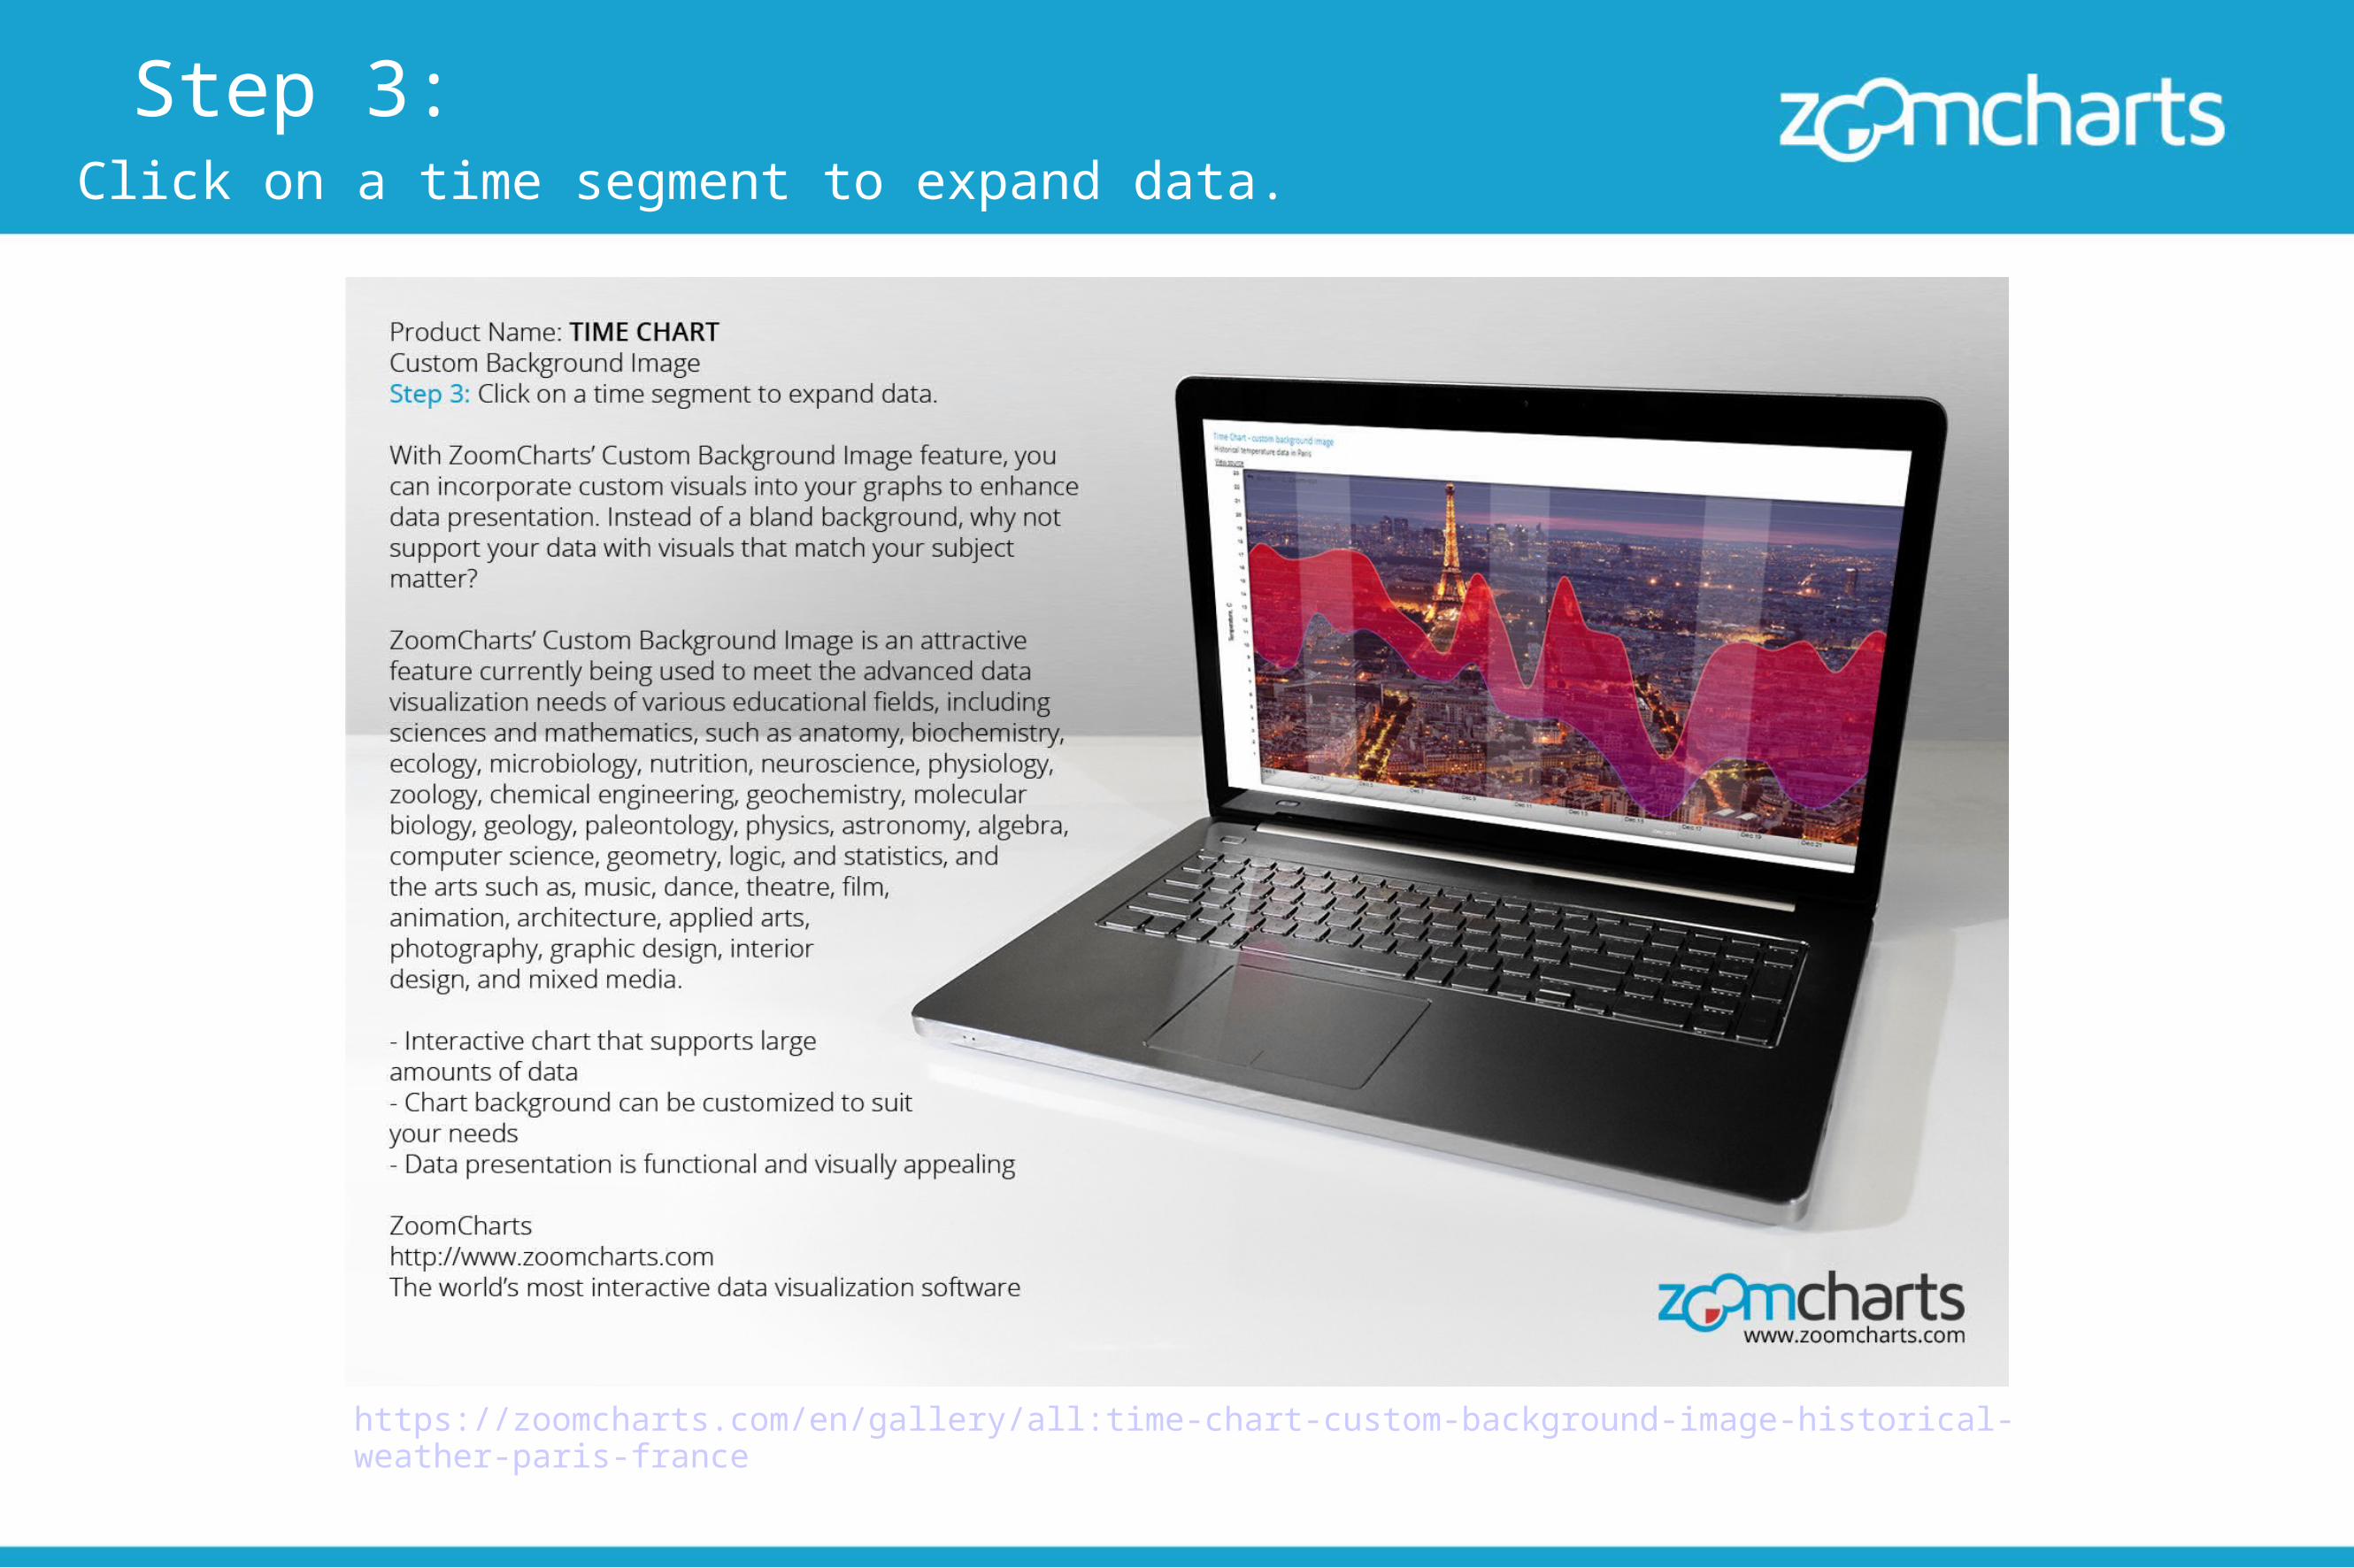
Step 3: Click on a time segment to expand data.
https://zoomcharts.com/en/gallery/all:time-chart-custom-background-image-historical-weather-paris-france
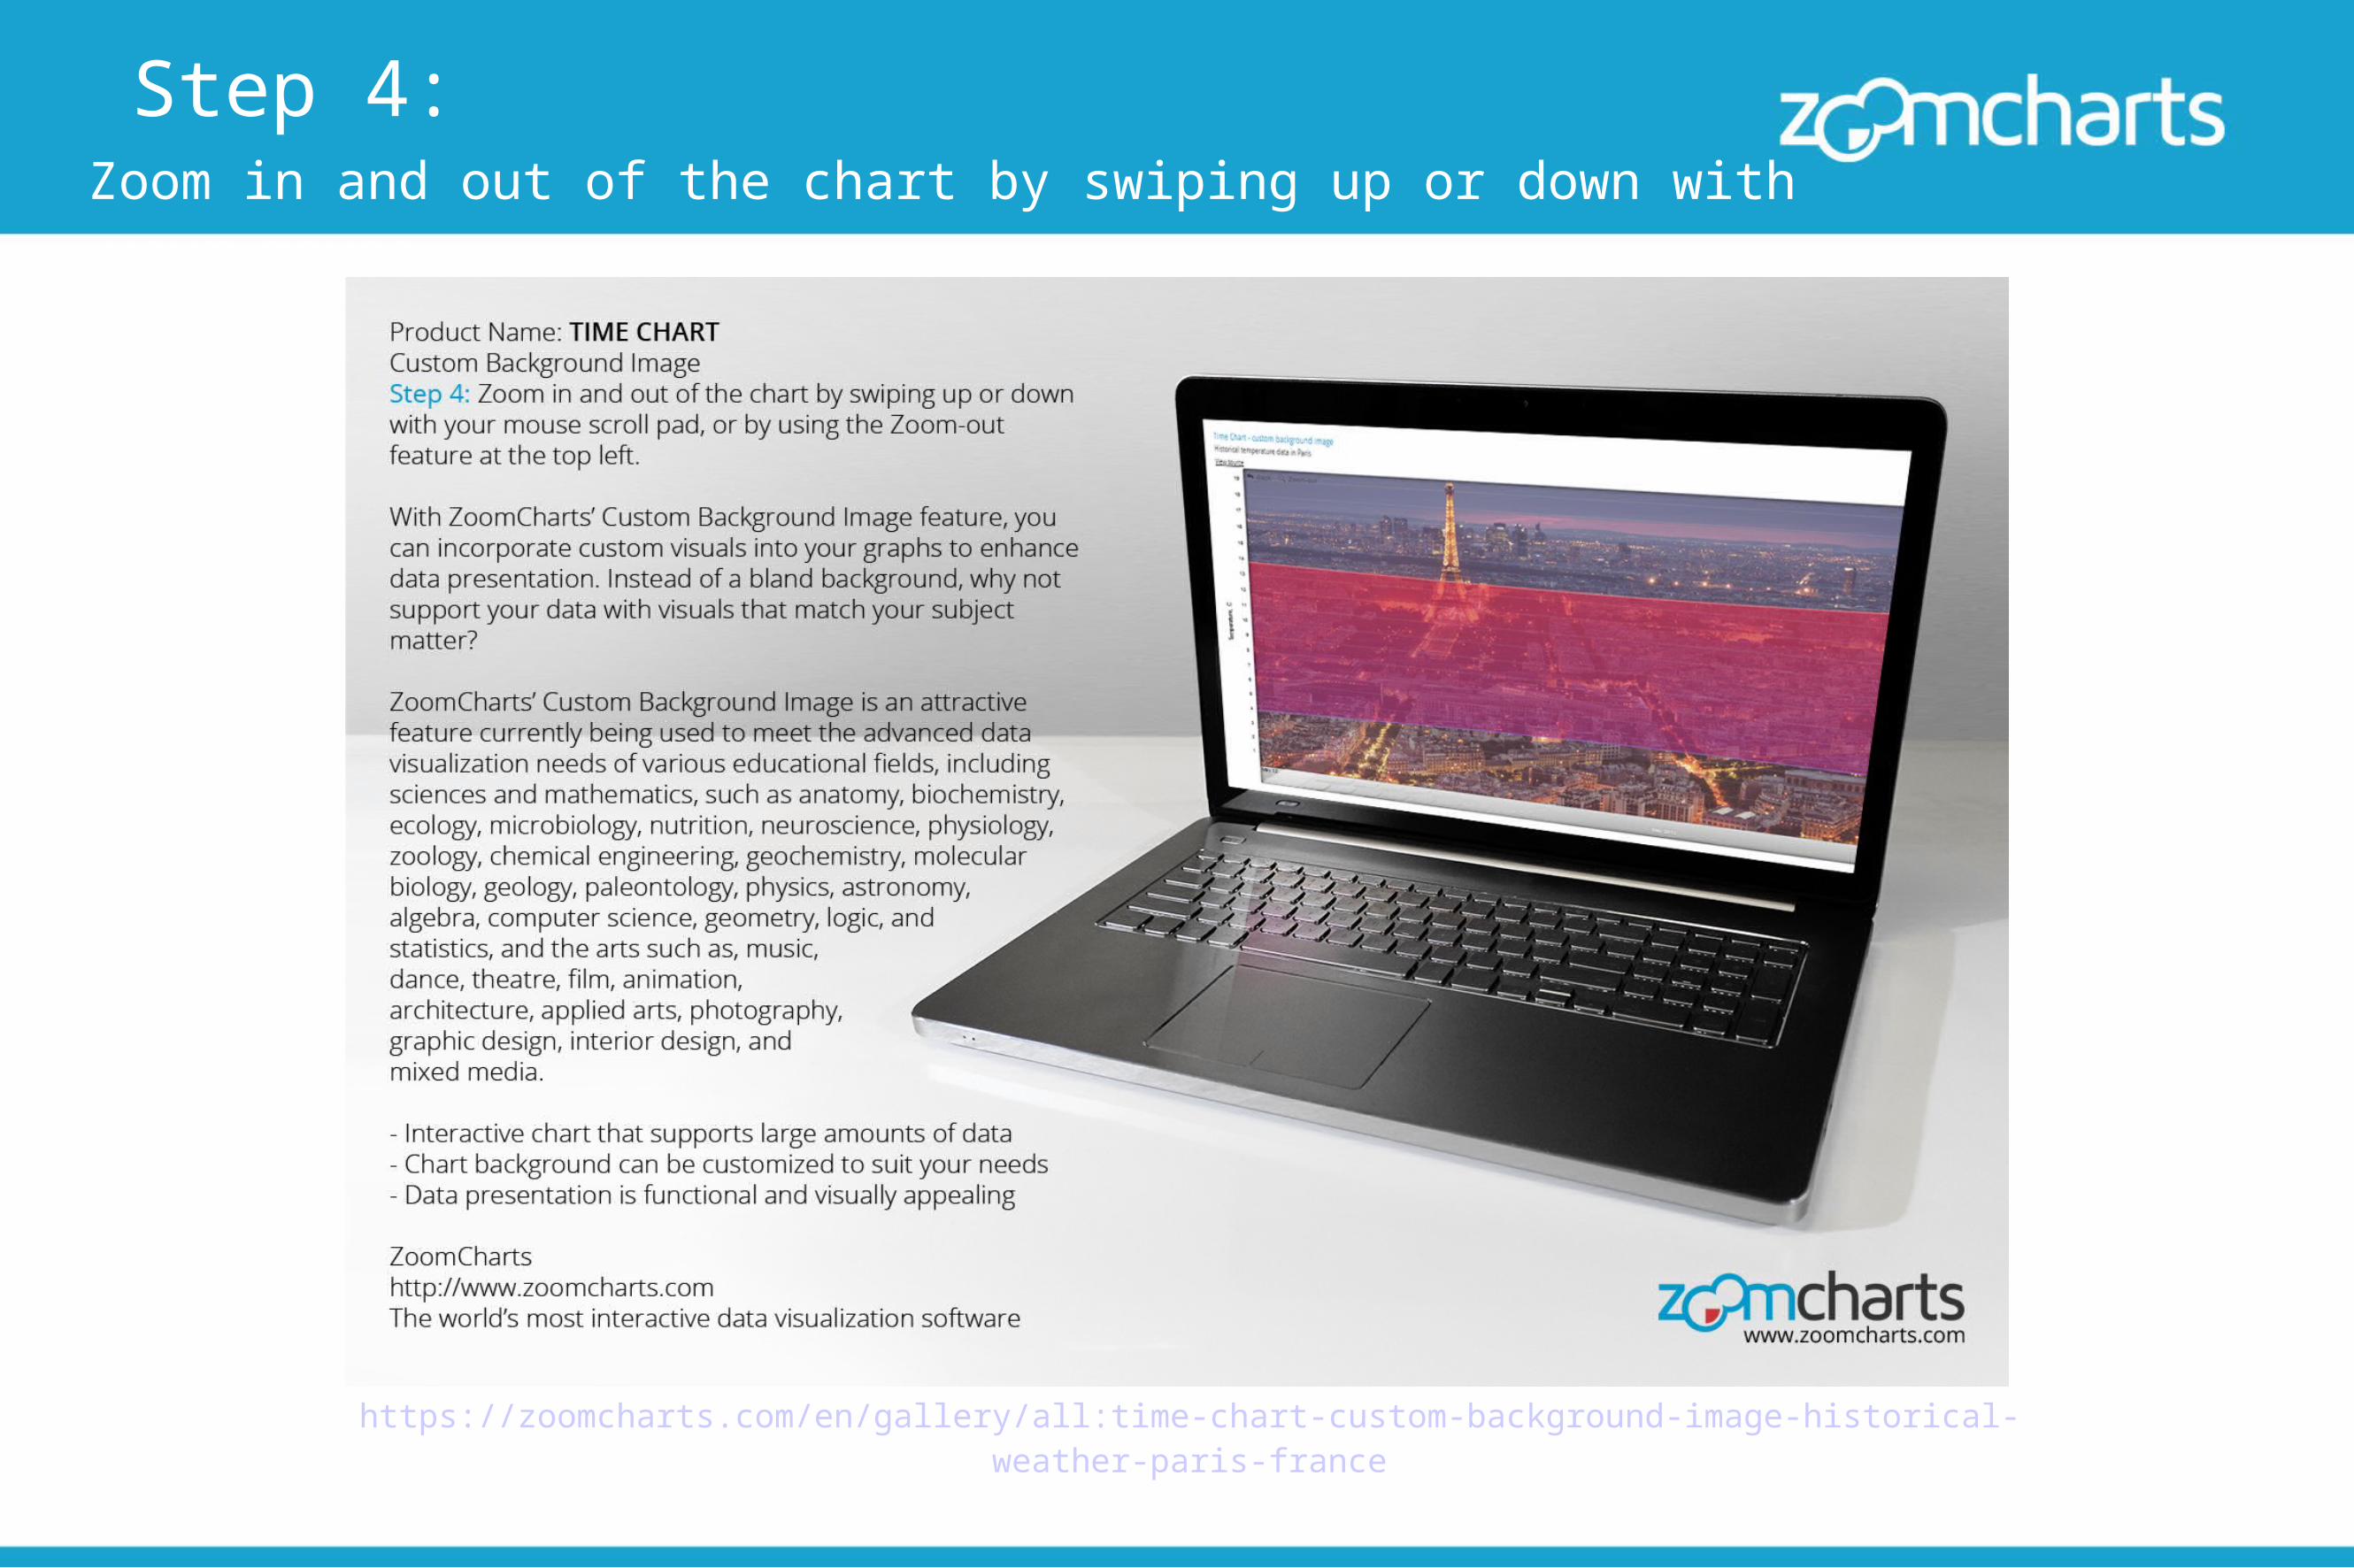
Step 4: Zoom in and out of the chart by swiping up or down with your mouse.
https://zoomcharts.com/en/gallery/all:time-chart-custom-background-image-historical-weather-paris-france
Network ChartBig network explorationExplore linked data sets. Highlight relevant data with dynamic filters and visual styles. Incremental data loading. Exploration with focus nodes.
Time ChartTime navigation and exploration toolBrowse activity logs, select time ranges. Multiple data series and value axes. Switch between time units.
Pie ChartAmazingly intuitive hierarchical data explorationGet quick overview of your data and drill down when necessary. All in a single easy to use chart.
Facet ChartScrollable bar chart with drill-downCompare values side by side and provide easy access to the long tail.
ZoomChartshttp://www.zoomcharts.com/ The world’s most interactive data visualization software
Check out ZoomCharts products: