Zooarchaeology and Taphonomy Consulting · zooarchaeology, including the study of crustaceans,...
30
Zooarchaeology and Taphonomy Consulting http://www.taphonomy.com [email protected] FAUNAL ANALYSIS OF THE COREY SITE, NEW YORK Prepared by: April M. Beisaw, RPA Zooarchaeology and Taphonomy Consulting 414 Clubhouse Rd. #3 Vestal, NY 13850 Prepared for: Jack Rossen Ithaca College 1150 Gannett Center Ithaca, New York 14850-7275 July 2006
Transcript of Zooarchaeology and Taphonomy Consulting · zooarchaeology, including the study of crustaceans,...

Zooarchaeology and Taphonomy Consulting
http://www.taphonomy.com [email protected]
FAUNAL ANALYSIS OF THE COREY SITE, NEW YORK
Prepared by:
April M. Beisaw, RPA
Zooarchaeology and Taphonomy Consulting
414 Clubhouse Rd. #3
Vestal, NY 13850
Prepared for:
Jack Rossen
Ithaca College
1150 Gannett Center
Ithaca, New York 14850-7275
July 2006
ii
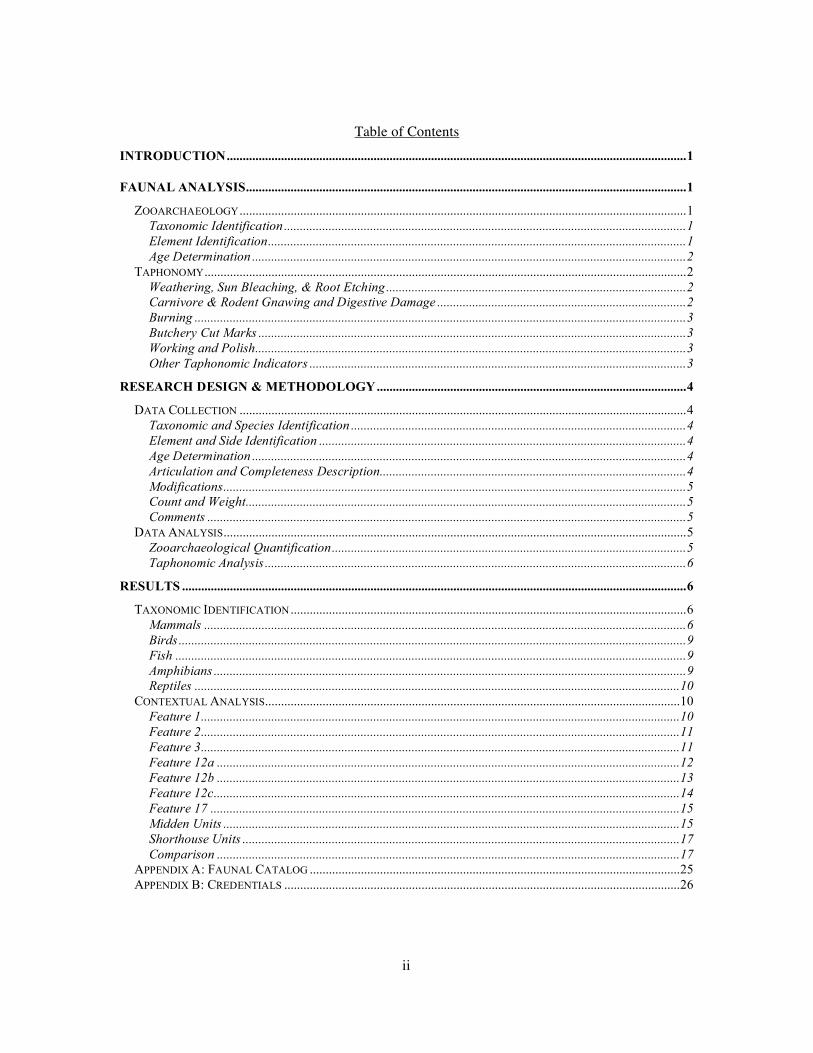
Table of Contents
INTRODUCTION................................................................................................................................................1
FAUNAL ANALYSIS..........................................................................................................................................1
ZOOARCHAEOLOGY............................................................................................................................................1
Taxonomic Identification ..............................................................................................................................1
Element Identification...................................................................................................................................1
Age Determination ........................................................................................................................................2
TAPHONOMY.......................................................................................................................................................2
Weathering, Sun Bleaching, & Root Etching ..............................................................................................2
Carnivore & Rodent Gnawing and Digestive Damage ..............................................................................2
Burning ..........................................................................................................................................................3
Butchery Cut Marks ......................................................................................................................................3
Working and Polish.......................................................................................................................................3
Other Taphonomic Indicators ......................................................................................................................3
RESEARCH DESIGN & METHODOLOGY.................................................................................................4
DATA COLLECTION ............................................................................................................................................4
Taxonomic and Species Identification .........................................................................................................4
Element and Side Identification ...................................................................................................................4
Age Determination ........................................................................................................................................4
Articulation and Completeness Description................................................................................................4
Modifications.................................................................................................................................................5
Count and Weight..........................................................................................................................................5
Comments ......................................................................................................................................................5
DATA ANALYSIS.................................................................................................................................................5
Zooarchaeological Quantification...............................................................................................................5
Taphonomic Analysis ....................................................................................................................................6
RESULTS ..............................................................................................................................................................6
TAXONOMIC IDENTIFICATION............................................................................................................................6
Mammals .......................................................................................................................................................6
Birds...............................................................................................................................................................9
Fish ................................................................................................................................................................9
Amphibians ....................................................................................................................................................9
Reptiles ........................................................................................................................................................10
CONTEXTUAL ANALYSIS..................................................................................................................................10
Feature 1......................................................................................................................................................10
Feature 2......................................................................................................................................................11
Feature 3......................................................................................................................................................11
Feature 12a .................................................................................................................................................12
Feature 12b .................................................................................................................................................13
Feature 12c..................................................................................................................................................14
Feature 17 ...................................................................................................................................................15
Midden Units ...............................................................................................................................................15
Shorthouse Units .........................................................................................................................................17
Comparison .................................................................................................................................................17
APPENDIX A: FAUNAL CATALOG ....................................................................................................................25
APPENDIX B: CREDENTIALS ............................................................................................................................26
iii
List of Tables
Table 1. Taxons identified in the Corey faunal assemblage including the Minimum Number of Individuals
(MNI) calculated for the site as a whole. ____________________________________________________7
Table 2. Taxons identified in Feature 1.____________________________________________________10
Table 3. Taxons identified in Feature 2.____________________________________________________11
Table 4. Taxons identified in Feature 3.____________________________________________________12
Table 5. Taxons identified in Feature 12a.__________________________________________________13
Table 6. Taxons identified in Feature 12b.__________________________________________________13
Table 7. Taxons identified in Feature 12c.__________________________________________________14
Table 8. Taxons identified in Feature 17.___________________________________________________15
Table 9. Taxons identified in Midden units. _________________________________________________16
Table 10. Taxons identified in Shorthouse units. _____________________________________________17
Table 11. Comparison of bone modifications by weight per feature.______________________________18
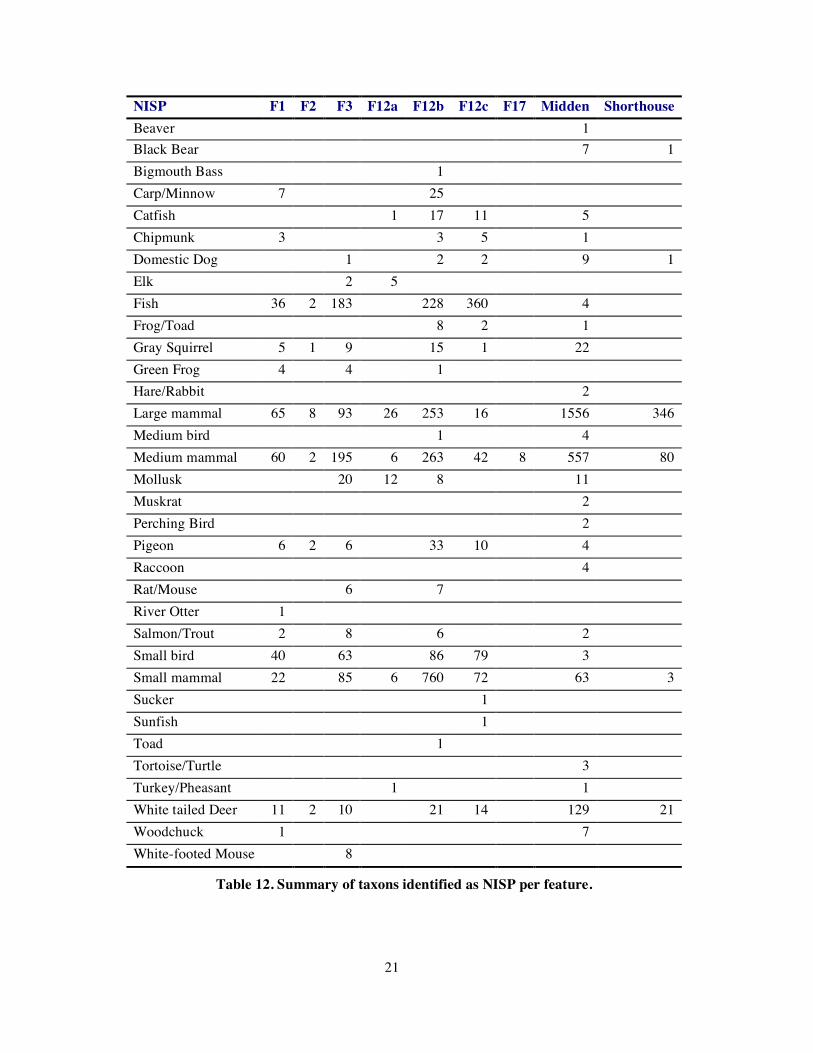
Table 12. Summary of taxons identified as NISP per feature. ___________________________________21
Table 13. Summary of taxons identified as percent NISP per feature. _____________________________22
Table 14. Summary of taxonomic classes identified as percent NISP per feature.____________________23
List of Figures
Figure 1. Chart showing the percent of modified bone by feature. _______________________________18
Figure 2. Comparison of relative percentage of bone modification by feature.______________________19
1
Introduction
In June 2006, April M. Beisaw, RPA, undertook the faunal analysis of the faunal assemblage
recovered from a 1500s-1600s Cayuga Village, for Jack Rossen of Ithaca College. The assemblage
included that from the 2003 excavation of the site midden and the 2005 excavation of a shorthouse
and row of hearth/pit features.
Faunal Analysis The analysis of animal bones from archaeological sites, at its empirical core, provides information
regarding the diet of a site's occupants and their immediate habitat. Using standard
zooarchaeological techniques such as species and element identification, quantification of animal
remains produces a list of common food items that can be rank ordered for analysis of preference.
Similar quantification can demonstrate exploitation of neighboring ecosystems or climatic shifts.
Recent research has demonstrated the susceptibility of standard zooarchaeological data to biasing
factors. These factors can be cultural, such as differential methods of food preparation and
disposal, or environmental, such as the differential destruction of bone through decompositional
processes. The adoption of taphonomy, originally a paleontological field, into faunal analysis has
provided analysts with a means of recovering information lost due to biasing factors. Additionally
taphonomic analysis provides a framework for data analysis and interpretation that has moved
faunal analysis well past the standard dietary and habitat assessments.
Zooarchaeology
Zooarchaeological analysis, at its simplest, consists of a tabulation of the taxons present in an
assemblage. The presence/absence of mammal, fish, bird, reptile, or amphibian remains in a faunal
assemblage is determined by the study of the morphology of each bone. Before species
identification can be undertaken, the skeletal element that a bone represents must be determined.
Element identification also allows estimation of age at death and, in some cases, determination of
sex to proceed.
Taxonomic Identification
Zoological classification follows the basic hierarchy: Kingdom, Phylum, Class, Order, Family,
Genus, and Species. Zooarchaeology deals exclusively with the Kingdom of Animalia. Some
zooarchaeology, including the study of crustaceans, deals with Phylum other than Chordata but for
the purposes of this project, only the Chordata Phylum, animals with a spinal cord or vertebral
column, were analyzed.
Class identification includes the sorting of a faunal assemblage into mammal, fish, bird, reptile and
amphibian remains and usually is undertaken as the initial sort of an assemblage. The simplest
method for determining the Order of faunal remains is through analysis of teeth, which preserve
well in archaeological contexts. Common Orders encountered in zooarchaeology include
carnivores and primates. If teeth are unavailable for this determination the functional morphology
of each skeletal element is used for the identification of Order, Family, Genus, and Species.
Element Identification
Within each taxonomic class, such as mammal, fish, or bird, the basic shape and number of the
elements of the skeleton are fairly constant. Determining the class of a bone therefore narrows the
range of possibilities of the element that it represents. Complete elements are, of course, the easiest
2
to identify but in many cases even small fragments of a bone contain enough diagnostic
morphology to allow for identification. It is therefore important to document the completeness of
an element to assess the certainty of identification and to establish the number of each element that
is actually represented in an assemblage. For example, four femur fragments do not necessarily
equate to four femurs.
Age Determination
Many mammalian bones are made up of a central shaft, or diaphysis, which is capped on each end
by an epiphysis. The region between the diaphysis and the epiphysis, the metaphysis, represents
the region where bone growth occurs. In juvenile mammals, the epiphysis is not fused to the shaft
to allow for this growth. The timing of the fusion of the epiphysis and shaft occurs at different
ages for each element. For example, the last element to completely fuse in a human is the
collarbone or clavicle, which usually occurs around the age of 35 years, well after the complete
fusion of the humerus, which occurs at approximately 21 years of age. The patterns of wear of
teeth can also be used to estimate an animal's age. Malnutrition can cause both of these methods to
produce a high degree of error.
Taphonomy
Taphonomy is, in general terms, a study of the postmortem, pre-burial, and post-burial histories of
faunal remains (Lyman 1994). Taphonomic analysis attempts to reconstruct the chronology of a
variety of postmortem processes that have produced a faunal assemblage or a subset of the
assemblage. Many of these processes leave signatures on the surface of bone, which, if properly
identified, provide a powerful method of assessing natural and cultural formation processes.
Weathering, Sun Bleaching, & Root Etching
The slow decomposition of bone results in a somewhat predictable alteration of the bone surface.
Cracking of the surface, parallel to fiber structure, results in surface exfoliation. The loss of the
outermost surface causes the bone to have a fibrous appearance, which increases in coarseness
with increased exposure until the bone loses integrity (Behrensmeyer 1978). In areas of root
activity, chemicals secreted by roots etch the bone surface and accelerate this weathering process.
Bone that remains unburied for extended periods of time can also become bleached white by the
sun. This bleaching also accelerates the weathering process of a bone.
Carnivore & Rodent Gnawing and Digestive Damage
Unburied and near surface bone is often subject to alteration by scavenging carnivores. In their
attempts to remove meat from the bone, and even transport the bone itself, carnivore teeth leave
characteristic markings on the bone surface, which can often be identified with the naked eye or
minor magnification. While carnivores tend to prefer fresh bone for flesh and marrow
procurement, rodents tend to gnaw at dry bone to obtain minerals and to sharpen and shorten their
ever-growing incisors. Rodent gnawing leaves a predictable pattern of markings on bone surfaces,
which are easily identified by the naked eye. Documentation of carnivore and rodent modification
of bone reveals important information regarding disposal practices as well as environmental
conditions.
When carnivores swallow bone the acidic digestive environment etches the bone in an attempt to
digest it. Only the smallest consumed bone can be digested, larger fragments are regurgitated or
passed through the digestive system. These bones show distinctive patterns of damage, often a
3
smooth polish with pock marked surface texture. Digestively damaged bones suggest the activity
of carnivores on site that would be contemporaneous with human occupation. Very high rates of
digestive damage suggest that some of the site’s faunal assemblage may be the result of carnivore
kills.
Burning
When in contact with heat or fire for a relatively short duration of time, bone becomes charred or
blackened. Bone that is in contact with heat for long periods of time or is repeatedly heated and
cooled attains the white appearance of calcined bone. The effect of burning on the resiliency of
bone varies with animal class, skeletal element, and intensity of the burning (Beisaw 2000).
Documentation of burned & calcined bone signatures allows for analysis of cooking and disposal
practices.
Butchery Cut Marks
In addition to the size and shape of faunal remains allowing for identification of those cuts of meat
obtained from a carcass, taphonomic analysis provides information regarding the types of tools
used to obtain these cuts. Sawed, chopped, and fractured bones retain signatures of skinning,
evisceration, disarticulation, and marrow extraction. For a complete butchery analysis, the location
and description of each cut mark should be documented. The results of butchery analysis allow for
a variety of cultural and economic analyses to proceed.
Working and Polish
Bone can be used as a raw material for the construction of formal or expedient tools, ornaments,
and even musical instruments. The identification of working on a bone can be expected both on
the resulting object and on the refuse from the construction of the object. The most common
worked bones recovered from North American sites are awls, tubes, and beads. Bone that has been
utilized often develops a shine or polish from the rubbing of the bone on the hands of the user or
on the object it is being used on, such as animal hides. The identification of worked and polished
bone is therefore important to the understanding of the role of this raw material within a site.
Other Taphonomic Indicators
A variety of additional taphonomic indicators can be used to obtain a more complete
understanding of a faunal assemblage and its creation. For example, small animals are particularly
sensitive to climatic variation and therefore their presence absence can be used to assess
seasonality, temporal shifts, and changes in hunting ranges to name a few. Another important
taphonomic indicator is the association of skeletal elements and animal classes, which can reveal
re-deposition events. Related artifact and ecofact analysis as well as a study of the changes in soil
microstratigraphy within a feature can reveal the sequence of depositional events that have
occurred.
As archaeological excavation is part of the taphonomic history of an assemblage, the effects of
excavation and recovery are an integral part of taphonomic analysis. Surface marks and breaks that
occur during and after excavation are easily identified. Together with an assessment of the
recovery techniques used, (screen aperture size, excavation tools used, etc.) an analysis of the
excavations impact on the representativeness of the assemblage can proceed. For example, an
excavation that utilizes 3/8" aperture to screen soil should not expect to recover the remains of
small animals.
4
Research Design & Methodology Upon receiving the faunal collection, an initial bag check served to inventory the collection and to
evaluate the variation that is evident is undertaken. As requested, a Microsoft Excel database was
constructed to serve as the catalog for this faunal collection. A hardcopy of the faunal catalog
accompanies this report as Appendix A. Electronic copies of the report and catalog are included
on a compact disc.
Data Collection
Data collection proceeded, in order, by unit and feature number. This number was assigned by the
excavators and it represents the context from which a subset of material was obtained. Each bag
was cataloged individually, with the unit, level, and date copied from the bag and retained in the
faunal catalog. All non-bone material was retained and separated from the bag’s bone material
with the use of archival quality zip lock bags. None bone material included lithic and pottery
fragments, charcoal, other vegetal specimens, and unmodified rocks.
Taxonomic and Species Identification
Minimally, each specimen is identified to the class level. As this level of distinction is possible on
virtually every bone fragment, regardless of size, it is the first level of taxonomic analysis
undertaken. Species level identification, unless resulting from a complete or near complete adult
skeletal element, are always tentative. Levels of certainty are ascribed by the inclusion of a
question mark after the ID or by the information provided in the comment field. For certain
elements, such as ribs, species level identification is highly problematic and therefore the use of
size groups usually represents the level of analysis that is possible. Size groups are also used for
bone fragments that are not otherwise identifiable to the less specific family or genus levels.
Element and Side Identification
In most cases, determining the skeletal element is necessary before taxonomic identification,
beyond the class level, is possible. Once the element has been identified, a determination of the
side it represents, left or right, aides in the assessment of the relative completeness of an individual
and in counts of the minimum numbers of individuals (MNI) present in the assemblage.
Age Determination
If a skeletal element is identified to the species level, assessing the age at death and sex of an
individual animal can proceed. A variety of charts and tables, which are based on known
populations of specific species, are consulted (e.g. Silver 1970). As a variety or environmental and
cultural factors can skew these results, age determinations are to be considered estimation, within a
range.
Articulation and Completeness Description
To aid in quantification of an assemblage, it is important to maintain a record of the completeness
of cataloged specimens. Similarly, retaining data regarding which, if any, articulation is present
allows for assessment of the certainty of age and side determinations as well as butchery patterns.

5
Modifications
Any signs of bone modifications observed are noted in the two modification columns. The first
column was used primarily for evidence of burning, gnawing, and digestive damage while the
second column was used for cut marks, working, and polish. If more than one modification was
observed on a specimen (i.e. digestive damage and charring) this pattern may have been violated
to allow for complete recording.
Count and Weight
A count field for each entry is also included in the catalog, which, in general, should equal one. In
cases where multiple mend-able fragments were cataloged, the count equals one. When multiple
similar fragments whose entry would not have differed from each other where encountered in a
given provenience, the specimens were cataloged as a bone group and the count field was used to
quantify the number of bone fragments included. All weights are reported in grams using a scale
with 0.1 gram sensitivity.
Comments
A comment field is included in the faunal database for three reasons: 1. To further describe the
specimen(s), 2. To aid in the assessment of the certainty and value of the description(s), 3. To
guide secondary analyses.
Data Analysis
Data analysis for the faunal collections proceeded along three lines: 1. The zooarchaeological
quantification of the assemblage, 2. The utilization of database queries to assess patterns, 3.
Taphonomic analysis of the assemblage.
Zooarchaeological Quantification
Number of Identified Specimens (NISP)
Also termed Total Number of Fragments (TNF), TNF or NISP calculations have been used to
estimate relative abundance of species. Recent research has shown that NISP calculations are
taphonomically erroneous and generally misleading. However, given NISP's simplicity it is often
provided for comparison with other analyzed assemblages. A degree of mending of bone
fragments with recent breaks has been undertaken to strengthen the usefulness of the NISP data for
this assemblage. For this project mendable bone was identified but no actual mend was made.
Minimum Number of Individuals (MNI)
The most common method of illustrating the constituents of an assemblage is through a calculation
of the minimum number of individuals (MNI) that would have to have existed to create a given
sample. There are numerous means of calculating this number and the method selected is usually
based on the type of assemblage. Empirically, MNI is determined by the most frequent element in
an assemblage. For example, an assemblage with 13 tibias suggests that, minimally, the
assemblage represents 7 individuals. Using element siding, 13 left tibias would suggest that
minimally 13 individuals are represented.

6
Taphonomic Analysis
After a complete cataloging of taphonomic indicators is created the contexts for certain subsets of
the faunal assemblage are reviewed to assess the site formation processes of the archaeological
sites. In particular, evidence of natural and/or cultural re-deposition is evaluated. Where
applicable, suggestions for secondary artifact or ecofact analysis, which would aid in this
assessment, are made.
Results
Taxonomic Identification
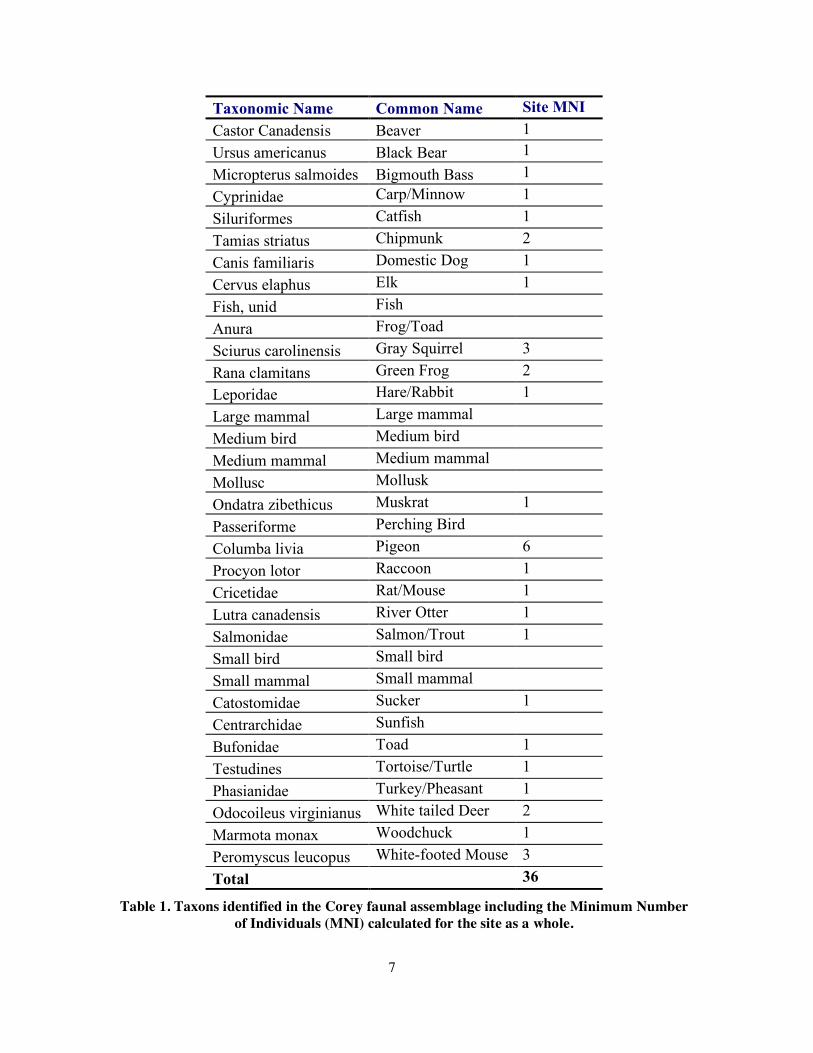
Thirty five taxonomic categories were used to describe the Corey faunal assemblage (Table 1).
Material that was not taxonomically identifiable beyond class (mammal, fish, bird, etc.) was
cataloged using approximate size groupings. Material identifiable to the genus and/or species level
was classified using seven distinct mammal categories.
Site wide MNIs were calculated using the entire faunal database as one assemblage. MNIs were
also calculated such that they would be mutually exclusive from other categories. Therefore no
MNI is listed for the unidentified fish, since most of these specimens are likely components of
those fish that were identified to order, family, or genus. Similarly no MNI is listed for
Centrarchidae (Sunfish) as identified Micropterus salmoides belongs to the Centrarchidae family.
Once the faunal remains were identified the University of Michigan Animal Diversity Web was
consulted for information on habitat and abundance of each taxonomic group. This information
serves as the basis of the descriptive information on each species provided below, unless otherwise
noted.
Mammals
Castor canadensis – American Beaver
The American beaver is found throughout North America, in the vicinity of lakes, ponds, rivers,
and streams. These aquatic rodents are commonly sought for their waterproof pelts.
Ursus americanus – Black Bear
The black bear is found throughout North America’s forests, usually in areas with changing
topography. Although they are carnivores, the black bear diet consists mainly of vegetable matter.
This species hibernates in the winter months.
Tamias striatus – Eastern Chipmunk
The eastern chipmunk is found throughout North America, mainly living in burrows of lightly
forested areas. Because they are a burrowing species they may be intrusive to archaeological sites,
especially in areas of rock piles.
Canis familiaris – Domestic Dog
The domestic dog is found at archaeological sites throughout North America. This species has
been used as hunting aides, pack animals, pets, and a food source.
7
Taxonomic Name Common Name Site MNI
Castor Canadensis Beaver 1
Ursus americanus Black Bear 1
Micropterus salmoides Bigmouth Bass 1
Cyprinidae Carp/Minnow 1
Siluriformes Catfish 1
Tamias striatus Chipmunk 2
Canis familiaris Domestic Dog 1
Cervus elaphus Elk 1
Fish, unid Fish
Anura Frog/Toad
Sciurus carolinensis Gray Squirrel 3
Rana clamitans Green Frog 2
Leporidae Hare/Rabbit 1
Large mammal Large mammal
Medium bird Medium bird
Medium mammal Medium mammal
Mollusc Mollusk
Ondatra zibethicus Muskrat 1
Passeriforme Perching Bird
Columba livia Pigeon 6
Procyon lotor Raccoon 1
Cricetidae Rat/Mouse 1
Lutra canadensis River Otter 1
Salmonidae Salmon/Trout 1
Small bird Small bird
Small mammal Small mammal
Catostomidae Sucker 1
Centrarchidae Sunfish
Bufonidae Toad 1
Testudines Tortoise/Turtle 1
Phasianidae Turkey/Pheasant 1
Odocoileus virginianus White tailed Deer 2
Marmota monax Woodchuck 1
Peromyscus leucopus White-footed Mouse 3
Total 36
Table 1. Taxons identified in the Corey faunal assemblage including the Minimum Number
of Individuals (MNI) calculated for the site as a whole.
8
Cervus elaphus – Elk
Elk were once common throughout North America but are now only found in western regions.
This species prefers open woodlands.
Sciurus carolinensis – Eastern Gray Squirrel
This species of squirrel is common throughout the woodlands of eastern North America. They are
most active in the spring, summer, and autumn months. These rodents live in trees, not burrows,
and therefore are more likely to represent a food source than an intrusive species in archaeological
sites.
Leporidae – Hares and Rabbits
The hares and rabbits family includes 54 species. Hares differ from rabbits in having longer legs
and ears and preferring areas of open vegetation.
Ondatra zibethicus – Muskrat
The muskrat is found throughout North America, in marshes, swamps, and bogs associated with
lakes, ponds, river, and streams. Muskrats have been sought for their pelts.
Procyon lotor – Northern Raccoon
The northern raccoon is common throughout North America. This species is not habitat specific.
Raccoons have been sought for their pelts.
Cricetidae – New World Rats, Mice, Voles, and Hamsters
The cricetidae family of rodents is very diverse and includes the subfamilies of North American
rats and mice (Neotominae) to which the white-footed mouse (Peromyscus leucopus) belongs.
Lutra canadensis – Northern River Otter
The northern river otter is also known as Lontra canadensis. This species was once common
throughout North America. Semi-aquatic, this species lives near lakes, ponds, river, streams, and
even along the coast. This species has been hunted for its pelts.
Odocoileus virginianus – White tailed Deer
The white-tailed deer is common throughout eastern North America. While deer can inhabit a
variety of ecosystems, they prefer areas that include both thick vegetation and open edges to
provide protection and food.
Peromyscus leucopus – White-footed Mouse
The white-footed mouse is common throughout eastern North America.
Marmota monax – Woodchuck
The woodchuck is common throughout eastern North America. This species prefers the forest
edges and grassy pastures. As a burrowing species, woodchuck remains may be intrusive to
archaeological sites.

9
Birds
Passeriformes – Perching Birds
The order Passeriformes includes perching birds of the world.
Columba livia - Pigeon
The specimens identified as pigeon within this assemblage are likely those of the now extinct
passenger pigeon (Ectopistes migratorius). However, due to the difficulty in obtaining
comparative specimens of extinct species, these specimens could only be compared to the common
pigeon, which is not native to North America. The passenger pigeon was a migratory species,
moving north in March and south in the late autumn or early winter. The birds were most easily
captured during their spring nesting period (Orlandini 1996).
Phasianidae – Turkeys, Grouse, Pheasants, and Partridges
This family includes the turkey and other wild pheasants.
Fish
Micropterus salmoides – Bigmouth Bass
The bigmouth bass is native to eastern North America’s lakes, ponds, rivers, and streams. They
prefer quiet shallow waters with ample vegetation. This species is considered an important game
fish.
Cyprinidae – Carps and Minnows
This family includes 53 species that occur in northeastern North America. Some species are small
stream dwellers while others are large riverine inhabitants (Daniels 1996).
Siluriformes – Catfish
This order includes many species of catfish that inhabit freshwater of every continent except
Antarctica. Catfish do not have scales.
Salmonidae – Salmons, Salmonids, and Trouts
This family is comprised of relatively large fish that were important food sources to Native
Americans (Daniels 1996).
Catostomidae – Suckers
This family of fresh-water fish is common in the lakes and rivers of the Northeast. These relatively
large fish were important food sources to Native Americans (Daniels 1996).
Centrarchidae – Sunfish
This family of fish includes species of sunfish, perch, bass, and crappie. The species of bigmouth
bass (Micropterus salmoides) identified in this assemblage is a member of this family.
Amphibians
Anura – Frogs and Toads
This order includes the frogs and toads of the world.

10
Rana clamitans – Green Frog
The green frog is common around inland waters of the east cost of North America. Lakes, ponds,
river, streams, marshes, swamps, and bogs are the primary habitats of this species. Green frogs
spend the winter buried in the substrate below shallow water.
Bufonidae – Toads
This family is made up of the true toads, which have thick and warty skins and tend to be
terrestrial.
Reptiles
Testudines – Tortoises and Turtles
This order includes the tortoises and turtles of the world.
Contextual Analysis
Feature 1
This feature contains 263 mammal, bird, fish, and amphibian remains, and totaling 109.5 grams in
weight.
ID Name Count Weight MNI
Cyprinidae Carp/Minnow 7 0.4 1
Tamias striatus Chipmunk 3 0.3 1
Fish, unidentified Fish 36 1.8
Sciurus carolinensis Gray Squirrel 5 0.9 1
Rana clamitans Green Frog 4 0.5 1
Large mammal Large mammal 65 40.2
Medium mammal Medium mammal 60 9.0
Columba livia Pigeon 6 1.0 2
Lutra Canadensis River Otter 1 0.5 1
Salmonidae Salmon/Trout 2 0.5 1
Small bird Small bird 40 1.6
Small mammal Small mammal 22 1.4
Odocoileus virginianus White tailed Deer 11 50.9 1
Marmota monax Woodchuck 1 0.5 1
Total 263 109.5 10
Table 2. Taxons identified in Feature 1.
Twenty eight percent of the feature’s specimens are burned, gnawed, worked, or show digestive
damage. Forty-two specimens are calcined (21.1 grams), ten are charred (21.8 grams), and one

11
appears to have had some exposure to heat (0.3 grams). All of the burned bones are fragments of
unidentified medium to large mammal bone with the exception of four deer foot bones (navicular,
metatarsal, phalange) and two green frog leg bones. Nineteen unburned specimens (9.4 grams)
show evidence of digestive damage including unidentified medium to large mammal bone and two
fragments of deer phalange. Carnivore gnawing was evident on one woodchuck tibia (0.5 grams)
and rodent gnawing on one medium mammal long bone (0.2 grams). One large mammal long bone
(3.1 grams) shows evidence of working and was probably used as an awl or needle.
One hundred eighty nine specimens (53.1 grams) appear unmodified and include carp/minnow
(n=7), chipmunk (n=3), unidentified fish (n=36), gray squirrel (n=5), green frog (n=2), large
mammal (n=11), medium mammal (n=49), pigeon (n=6), river otter (n=1), salmon/trout (n=2),
small bird (n=40), small mammal (n=22), and deer (n=5).
Feature 2
This feature contains 17 mammal, bird, and fish remains, totaling 22.9 grams in weight.
ID Name Count Weight MNI
Fish, unidentified Fish 2 0.1 1
Sciurus carolinensis Gray Squirrel 1 0.2 1
Large mammal Large mammal 8 10.6
Medium mammal Medium mammal 2 3.2
Columba livia Pigeon 2 4.2 1
Odocoileus virginianus White tailed Deer 2 4.6 1
Total 17 22.9 4
Table 3. Taxons identified in Feature 2.
Forty seven percent of the feature’s specimens are burned, gnawed, worked, or show digestive
damage. Four specimens are calcined (1.5 grams) and one is charred (3.9 grams). All of the burned
bones are fragments of unidentified medium to large mammal bone with the exception of the
calcined deer pelvis fragment. One unburned specimen (0.4 grams) show evidence of digestive
damage, a large mammal bone. Carnivore gnawing was evident on one large mammal long bone
(1.1 grams). One medium mammal long bone (3.0 grams) shows evidence of working and was
possible part of an awl.
Nine specimens (13.0 grams) appear unmodified and include unidentified fish (n=2), gray squirrel
(n=1), large mammal (n=3), pigeon (n=2), and deer (n=1).
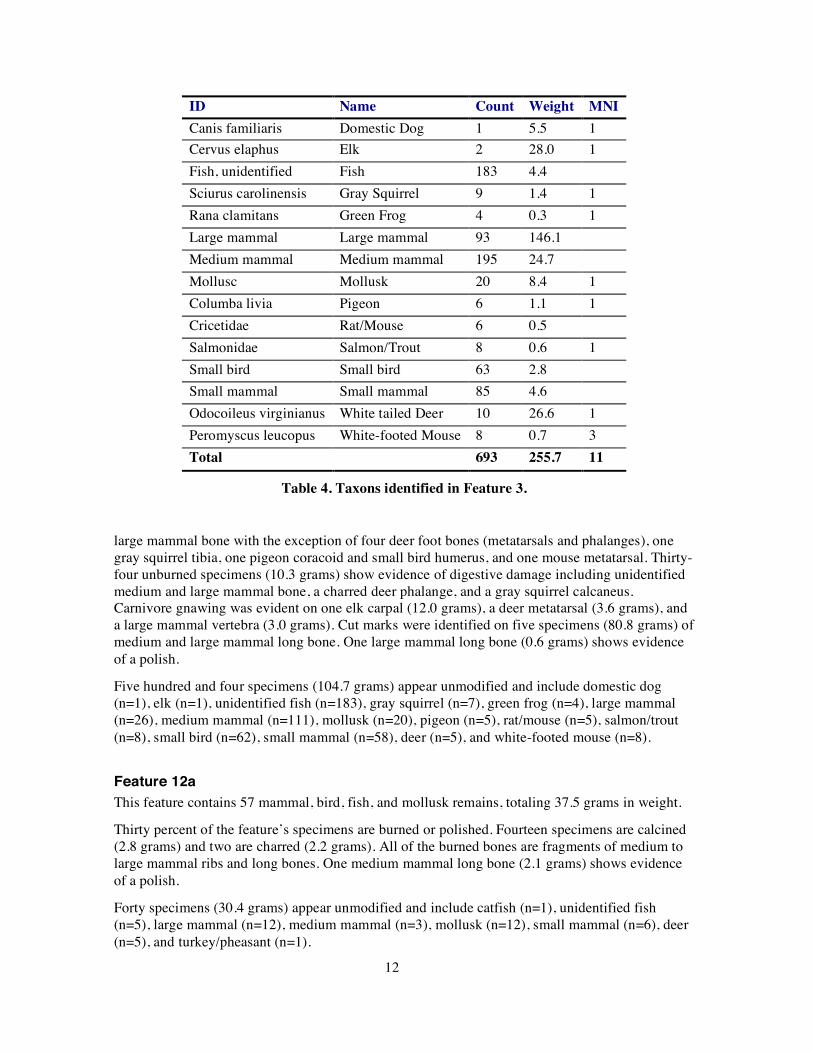
Feature 3
This feature contains 693 mammal, bird, fish, amphibian, and mollusk remains, totaling 255.7
grams in weight.
Twenty seven percent of the feature’s specimens are burned, gnawed, polished, cut marked, or
show digestive damage. One hundred thirty specimens are calcined (30.2 grams) and seventeen are
charred (12.7 grams). All of the burned bones are fragments of unidentified small, medium, and
12
ID Name Count Weight MNI
Canis familiaris Domestic Dog 1 5.5 1
Cervus elaphus Elk 2 28.0 1
Fish, unidentified Fish 183 4.4
Sciurus carolinensis Gray Squirrel 9 1.4 1
Rana clamitans Green Frog 4 0.3 1
Large mammal Large mammal 93 146.1
Medium mammal Medium mammal 195 24.7
Mollusc Mollusk 20 8.4 1
Columba livia Pigeon 6 1.1 1
Cricetidae Rat/Mouse 6 0.5
Salmonidae Salmon/Trout 8 0.6 1
Small bird Small bird 63 2.8
Small mammal Small mammal 85 4.6
Odocoileus virginianus White tailed Deer 10 26.6 1
Peromyscus leucopus White-footed Mouse 8 0.7 3
Total 693 255.7 11
Table 4. Taxons identified in Feature 3.
large mammal bone with the exception of four deer foot bones (metatarsals and phalanges), one
gray squirrel tibia, one pigeon coracoid and small bird humerus, and one mouse metatarsal. Thirty-
four unburned specimens (10.3 grams) show evidence of digestive damage including unidentified
medium and large mammal bone, a charred deer phalange, and a gray squirrel calcaneus.
Carnivore gnawing was evident on one elk carpal (12.0 grams), a deer metatarsal (3.6 grams), and
a large mammal vertebra (3.0 grams). Cut marks were identified on five specimens (80.8 grams) of
medium and large mammal long bone. One large mammal long bone (0.6 grams) shows evidence
of a polish.
Five hundred and four specimens (104.7 grams) appear unmodified and include domestic dog
(n=1), elk (n=1), unidentified fish (n=183), gray squirrel (n=7), green frog (n=4), large mammal
(n=26), medium mammal (n=111), mollusk (n=20), pigeon (n=5), rat/mouse (n=5), salmon/trout
(n=8), small bird (n=62), small mammal (n=58), deer (n=5), and white-footed mouse (n=8).
Feature 12a
This feature contains 57 mammal, bird, fish, and mollusk remains, totaling 37.5 grams in weight.
Thirty percent of the feature’s specimens are burned or polished. Fourteen specimens are calcined
(2.8 grams) and two are charred (2.2 grams). All of the burned bones are fragments of medium to
large mammal ribs and long bones. One medium mammal long bone (2.1 grams) shows evidence
of a polish.
Forty specimens (30.4 grams) appear unmodified and include catfish (n=1), unidentified fish
(n=5), large mammal (n=12), medium mammal (n=3), mollusk (n=12), small mammal (n=6), deer
(n=5), and turkey/pheasant (n=1).
13
ID Name Count Weight MNI
Siluriformes Catfish 1 0.1 1
Fish, unidentified Fish 5 0.3
Large mammal Large mammal 26 18.2 1
Medium mammal Medium mammal 6 2.9
Mollusc Mollusk 12 15.2 1
Small mammal Small mammal 6 0.3 1
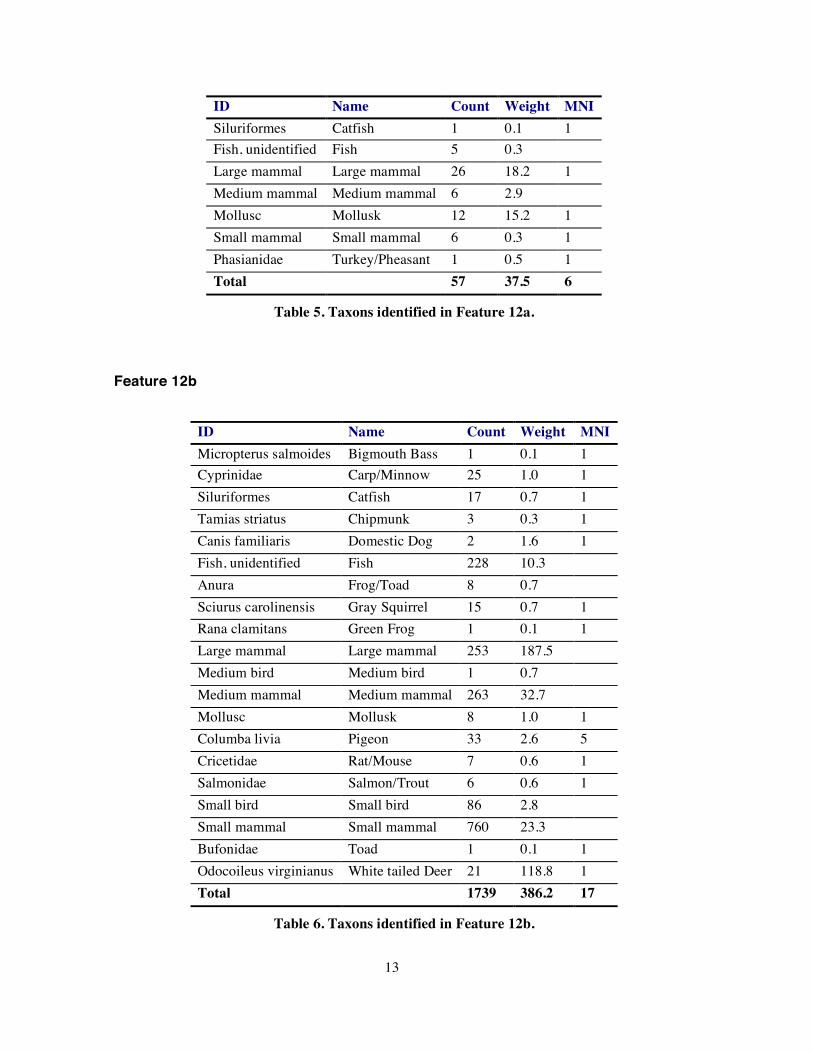
Phasianidae Turkey/Pheasant 1 0.5 1
Total 57 37.5 6
Table 5. Taxons identified in Feature 12a.
Feature 12b
ID Name Count Weight MNI
Micropterus salmoides Bigmouth Bass 1 0.1 1
Cyprinidae Carp/Minnow 25 1.0 1
Siluriformes Catfish 17 0.7 1
Tamias striatus Chipmunk 3 0.3 1
Canis familiaris Domestic Dog 2 1.6 1
Fish, unidentified Fish 228 10.3
Anura Frog/Toad 8 0.7
Sciurus carolinensis Gray Squirrel 15 0.7 1
Rana clamitans Green Frog 1 0.1 1
Large mammal Large mammal 253 187.5
Medium bird Medium bird 1 0.7
Medium mammal Medium mammal 263 32.7
Mollusc Mollusk 8 1.0 1
Columba livia Pigeon 33 2.6 5
Cricetidae Rat/Mouse 7 0.6 1
Salmonidae Salmon/Trout 6 0.6 1
Small bird Small bird 86 2.8
Small mammal Small mammal 760 23.3
Bufonidae Toad 1 0.1 1
Odocoileus virginianus White tailed Deer 21 118.8 1
Total 1739 386.2 17
Table 6. Taxons identified in Feature 12b.

14
This feature contains 1739 mammal, bird, fish, amphibian, and mollusk remains, totaling 386.2
grams in weight.
Thirty three percent of the feature’s specimens are burned, gnawed, worked, or show digestive
damage. Three hundred twenty four specimens are calcined (39.5 grams), one hundred ninety four
are charred (86.3 grams), and two have been exposed to some heat (5.6 grams). All of the burned
bones are fragments of unidentified small, medium, and large mammal bone with the exception of
a chipmunk femur, a dog phalange, one carp and one catfish vertebra and twenty eight additional
fish bones, one frog leg bone, a squirrel tarsal and tooth, nine pigeon bones, a mouse metatarsal,
sixteen small and medium bird bones, nine deer foot bones, and a deer mandible and humerus.
Fifty-nine unburned specimens (17.4 grams) show evidence of digestive damage including
fragments of unidentified medium and large mammal rib, crania, and tarsals, a deer phalange, and
a pigeon coracoid. Carnivore gnawing was evident on one medium mammal long bone (0.6 grams)
and a large mammal rib (4.4 grams). One medium mammal long bone (0.5 grams) appears to have
been worked into a bone tube.
One thousand one hundred and fifty seven specimens (231.9 grams) appear unmodified and
include bigmouth bass (n=1), carp/minnow (n=24), catfish (n=16), chipmunk (n=2), dog (n=1),
unidentified fish (n=202), frog/toad (n=7), gray squirrel (n=12), green frog (n=1), large mammal
(n=96), medium mammal (n=117), mollusk (n=6), pigeon (n=23), rat/mouse (n=6), salmon/trout
(n=6), small bird (n=71), small mammal (n=556), toad (n=1), and deer (n=9).
Feature 12c
This feature contains 616 mammal, bird, fish, and amphibian remains, totaling 34.7 grams in
weight.
ID Name Count Weight MNI
Siluriformes Catfish 11 0.6 1
Tamias striatus Chipmunk 5 0.5 1
Canis familiaris Domestic Dog 2 0.1 1
Fish, unidentified Fish 360 9.9
Anura Frog/Toad 2 0.2 1
Sciurus carolinensis Gray Squirrel 1 0.1 1
Large mammal Large mammal 16 3.5
Medium mammal Medium mammal 42 5.5
Columba livia Pigeon 10 1 1
Small bird Small bird 79 1.6
Small mammal Small mammal 72 2.3
Catostomidae Sucker 2 0.1 1
Centrarchidae Sunfish 1 0.1 1
Odocoileus virginianus White tailed Deer 14 9.1 1
Total 616 34.7 9
Table 7. Taxons identified in Feature 12c.

15
Eleven percent of the feature’s specimens are burned, gnawed, or show digestive damage. Forty
four specimens are calcined (3.2 grams), and sixteen are charred (9.6 grams). All of the burned
bones are fragments of unidentified small, medium, and large mammal ribs and long bone with the
exception of fourteen fragments of deer metatarsal, two large mammal teeth, and eleven small bird
bones. Seven unburned specimens (1.0 grams) show evidence of digestive damage including
fragments of unidentified medium and large mammal long bone.
Five hundred forty nine specimens (20.9 grams) appear unmodified and include catfish (n=11),
chipmunk (n=5), dog (n=1), unidentified fish (n=360), frog/toad (n=2), gray squirrel (n=1), large
mammal (n=1), medium mammal (n=29), pigeon (n=10), small bird (n=68), small mammal
(n=58), sucker (n=2), and sunfish (n=1).
Feature 17
This feature contains 8 mammal remains, totaling 1.3 grams in weight.
ID Name Count Weight MNI
Medium mammal Medium mammal 8 1.3 1
Total 8 1.3 1
Table 8. Taxons identified in Feature 17.
All specimens appear unmodified and include both long bone (n=4) and cranial elements (n=4).
Midden Units
The 2003 excavation of units within the site midden yielded 2401 fragments of mammal, fish,
bird, amphibian, reptile, and mollusk remains, totaling 1003.8 grams.
Forty five percent of the feature’s specimens are burned, gnawed, sun bleached, cut marked,
polished, worked, or show digestive damage. One thousand two hundred and four specimens are
calcined (389.7 grams), one hundred ninety one are charred (124.4 grams), and ten have been
exposed to some heat (6.0 grams). All of the burned bones are fragments of unidentified small,
medium, and large mammal bone with the exception of deer humerus, ulna, radius, antler, tooth,
and many foot bones, a black bear phalange, dog lumbar vertebra, a fragment of turtle carapace.
Twenty-three unburned specimens (7.5 grams) show evidence of digestive damage including
fragments of unidentified medium and large mammal long bones, squirrel femur and tarsal, a deer
tarsal, and a large mammal mandible fragment. Rodent gnawing was evident on one medium
mammal long bone (0.2 grams) and sun bleaching was recorded on 6 specimens (3.5 grams)
including small, medium, and large mammal crania, vertebra, rib, and long bone fragments and a
fragment of fish crania.
Cut marks were recorded on two calcined fragments of deer antler, a fragment of charred large
mammal long bone. Larger cut marks, described as hack marks, were noted on one deer antler. In
all 4 specimens showed these cut marks (4.7 grams). A clear polish was noted on 14 specimens
(7.6 grams), all medium and large mammal long bone, deer antler and deer metacarpal. Two of
these specimens were calcined, six were charred, and one was heat-treated. Eleven additional

16
specimens (9.6 grams) showed a lighter polish, including large mammal long bone fragments, a
vertebra fragment, and a section of deer metatarsal. These polished specimens occurred in units 2,
3, 4, 6, 7, 8, and 9 and mostly in levels 3 and 4. Two additional specimens appear to be both
polished and worked, these are charred and calcined large mammal long bone fragments from
level 4 of units 6 and 8. Five additional specimens (1.3 grams) may have evidence of working.
These are charred medium and large mammal long bone fragments and an unburned deer
metatarsal from levels 3 and 4 of units 2, 6, and 8. Clear working was evident on six specimens
(3.4 grams) of medium and large mammal long bone. Three of these are charred and one is
calcined. These worked specimens occur in levels 3, 4 and 5 of units 1, 4, 6, and 9. One artifact is
clearly an awl (unit 1W level 4) while another may also be an awl (unit 6S level 3). One worked
specimen is a bone bead or tube fragment from unit 6N, level 4.
ID Name Count Weight MNI
Castor Canadensis Beaver 1 0.2 1
Ursus americanus Black Bear 7 8.3 1
Siluriformes Catfish 5 0.6 1
Tamias striatus Chipmunk 1 0.1 1
Canis familiaris Domestic Dog 9 6.2 1
Fish, unidentified Fish 6 0.7
Anura Frog/Toad 1 0.1 1
Sciurus carolinensis Gray Squirrel 22 5.7 2
Leporidae Hare/Rabbit 2 0.4 1
Large mammal Large mammal 1556 699.9
Medium bird Medium bird 4 1.2
Medium mammal Medium mammal 557 99.8
Mollusc Mollusk 11 1.3 1
Ondatra zibethicus Muskrat 2 0.5 1
Passeriforme Perching Bird 2 0.2
Columba livia Pigeon 4 0.5 1
Procyon lotor Raccoon 4 1.8 1
Salmonidae Salmon/Trout 2 0.3 1
Small bird Small bird 3 0.2
Small mammal Small mammal 63 7.7
Testudines Tortoise/Turtle 3 0.7 1
Phasianidae Turkey/Pheasant 1 0.7 1
Odocoileus virginianus White tailed Deer 129 164.5 2
Marmota monax Woodchuck 7 2.7 1
Total 2401 1003.8 19
Table 9. Taxons identified in Midden units.
17
Nine hundred fifty eight specimens (469.7 grams) appear unmodified and include beaver (n=1),
black bear (n=6), catfish (n=5), chipmunk (n=1), dog (n=8), unidentified fish (n=5), frog/toad
(n=1), gray squirrel (n=20), hare/Rabbit (n=2), large mammal (n=604), medium bird (n=4),
medium mammal (n=155), mollusk (n=11), muskrat (n=2), pigeon (n=23), perching bird (n=2),
pigeon (n=4), raccoon (n=4), salmon/trout (n=2), small bird (n=3), small mammal (n=47),
turkey/pheasant (n=1), deer (n=62), woodchuck (n=7).
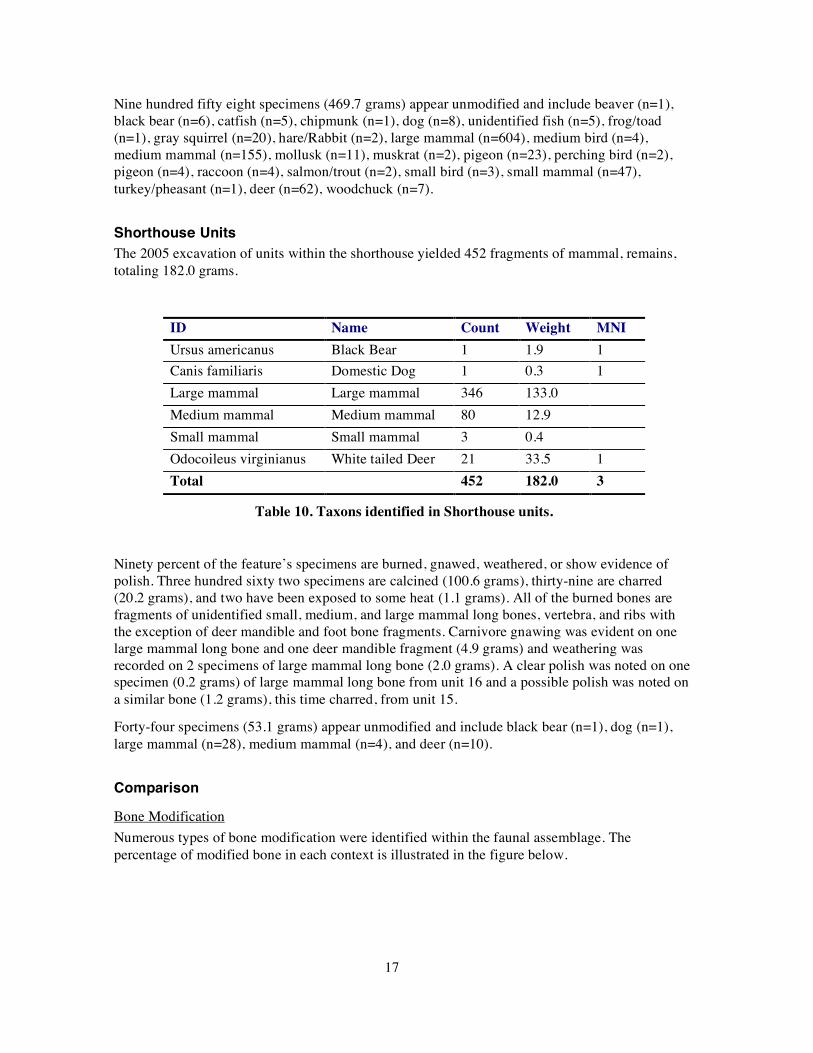
Shorthouse Units
The 2005 excavation of units within the shorthouse yielded 452 fragments of mammal, remains,
totaling 182.0 grams.
ID Name Count Weight MNI
Ursus americanus Black Bear 1 1.9 1
Canis familiaris Domestic Dog 1 0.3 1
Large mammal Large mammal 346 133.0
Medium mammal Medium mammal 80 12.9
Small mammal Small mammal 3 0.4
Odocoileus virginianus White tailed Deer 21 33.5 1
Total 452 182.0 3
Table 10. Taxons identified in Shorthouse units.
Ninety percent of the feature’s specimens are burned, gnawed, weathered, or show evidence of
polish. Three hundred sixty two specimens are calcined (100.6 grams), thirty-nine are charred
(20.2 grams), and two have been exposed to some heat (1.1 grams). All of the burned bones are
fragments of unidentified small, medium, and large mammal long bones, vertebra, and ribs with
the exception of deer mandible and foot bone fragments. Carnivore gnawing was evident on one
large mammal long bone and one deer mandible fragment (4.9 grams) and weathering was
recorded on 2 specimens of large mammal long bone (2.0 grams). A clear polish was noted on one
specimen (0.2 grams) of large mammal long bone from unit 16 and a possible polish was noted on
a similar bone (1.2 grams), this time charred, from unit 15.
Forty-four specimens (53.1 grams) appear unmodified and include black bear (n=1), dog (n=1),
large mammal (n=28), medium mammal (n=4), and deer (n=10).
Comparison
Bone Modification
Numerous types of bone modification were identified within the faunal assemblage. The
percentage of modified bone in each context is illustrated in the figure below.
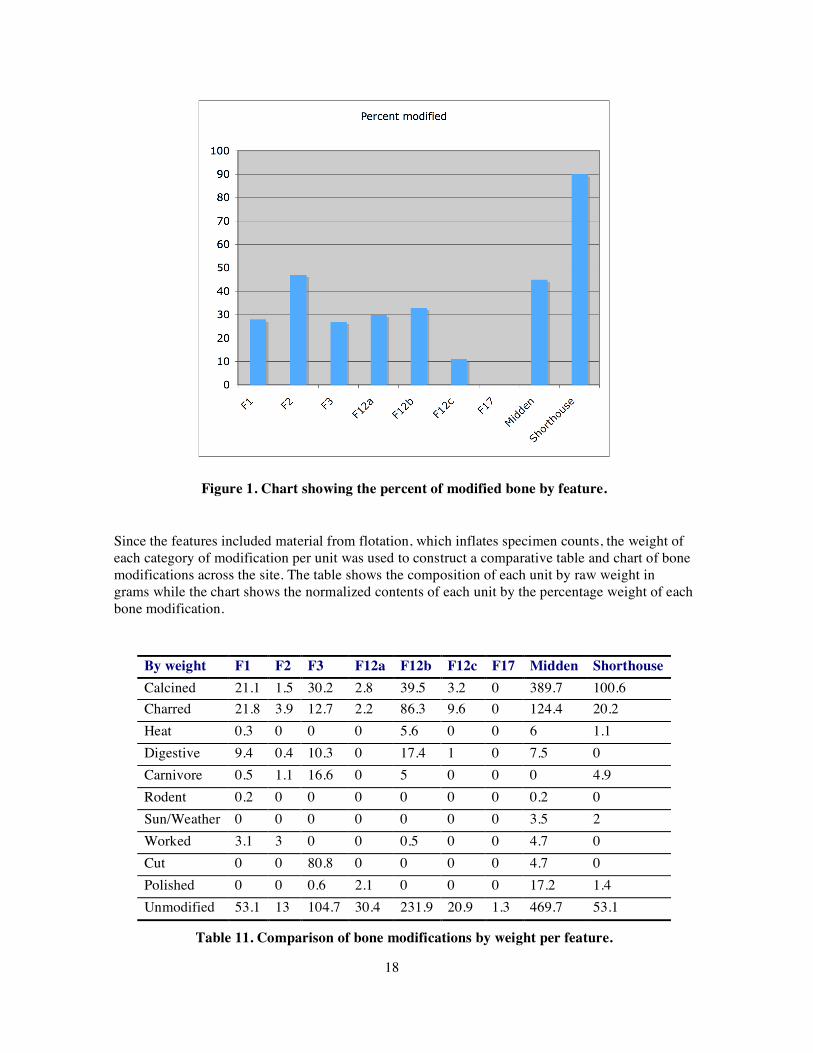
18
Figure 1. Chart showing the percent of modified bone by feature.
Since the features included material from flotation, which inflates specimen counts, the weight of
each category of modification per unit was used to construct a comparative table and chart of bone
modifications across the site. The table shows the composition of each unit by raw weight in
grams while the chart shows the normalized contents of each unit by the percentage weight of each
bone modification.
By weight F1 F2 F3 F12a F12b F12c F17 Midden Shorthouse
Calcined 21.1 1.5 30.2 2.8 39.5 3.2 0 389.7 100.6
Charred 21.8 3.9 12.7 2.2 86.3 9.6 0 124.4 20.2
Heat 0.3 0 0 0 5.6 0 0 6 1.1
Digestive 9.4 0.4 10.3 0 17.4 1 0 7.5 0
Carnivore 0.5 1.1 16.6 0 5 0 0 0 4.9
Rodent 0.2 0 0 0 0 0 0 0.2 0
Sun/Weather 0 0 0 0 0 0 0 3.5 2
Worked 3.1 3 0 0 0.5 0 0 4.7 0
Cut 0 0 80.8 0 0 0 0 4.7 0
Polished 0 0 0.6 2.1 0 0 0 17.2 1.4
Unmodified 53.1 13 104.7 30.4 231.9 20.9 1.3 469.7 53.1
Table 11. Comparison of bone modifications by weight per feature.

19
By raw weight the features appear to show some differentiation with 1 and 2 containing the most
worked bone, 3 containing the most cut and carnivore gnawed bone, 12a containing the most
polished bone, and 12b containing the most bone showing digestive damage. When the raw
weights are divided by the total weight of the bone in each context the interpretation changes
slightly. Feature 1 now has the most burned and digestive damaged bone, 2 still has the most
worked bone, feature 3 still has the most cut and carnivore gnawed bone, 12a still has the most
polished bone, and 12c has the most burned bone.
Figure 2. Comparison of relative percentage of bone modification by feature.
20
One means of interpreting these differences is that each contains the refuse of different activities
that were taking place around the shorthouse. With high amounts of burned and digestive damaged
bone, Feature 1 appears to be a receptacle for general refuse from cooking. Due to the delay
between ingestion and regurgitation of bone that produces digestive damage, it is likely that dogs
were active in the vicinity of this feature. The recovery of an awl suggests some type of leather or
basketry work may have occurred here too. The contents of Feature 2 are very similar to Feature 1,
only with more carnivore gnawed than digestive damaged bone. Another awl fragment was also
recovered from this context. The higher amounts of cut bone and lower amounts of burned bone
suggest that Feature 3 was in the vicinity of a butchery location. The overall rates of carnivore
gnawing and digestive damage are high here, which also supports this interpretation. Feature 12a
contains very little burned bone and no carnivore gnawed or digestive damaged bone. However,
this feature contains more polished bone than any other feature. This polish is difficult to interpret
further than an analogy to the shine that is produced on the handles of worked bone from skin oils
or on objects used in the hide tanning process. It is possible that some oil-dependent or oil-
producing activity occurred near this location. Features 12b and c are very similar in their
contents, with the exception of no worked bone, to Feature 1.
When comparing the contents of midden to shorthouse units, the most difference appears to be in
the higher amounts of calcined and carnivore gnawed bone in the shorthouse. A high amount of
calcined bone is common in habitation areas as it is a byproduct of cooking and is scattered about
during hearth cleanings. The higher amounts of carnivore gnawed bones suggest that does were
allowed to consume scraps in and around the habitation area and not relegated to picking through
the refuse midden.
Species
The taxonomic contents of the units and features varied across the site. The tables below
summarize the raw counts (NISP or TNF) and the relative percentage of each taxonomic category
used, per unit or feature.
By raw counts both Feature 12b and 12c appear to have high amounts of fish bone. However, by
percentage of each feature’s contents it becomes clear that Features 3 and 12c contains a much
higher percent of fish than 12b. Similarly while 12b has the highest number of pigeon bones,
Feature 2 contains a much higher percentage of pigeon. The counts and percentages of small
species, such as fish, pigeon, and small rodents is much lower in the midden and shorthouse units
than in the features but this is likely due to the use of flotation to recover small bones from
features.
21
NISP F1 F2 F3 F12a F12b F12c F17 Midden Shorthouse
Beaver 1
Black Bear 7 1
Bigmouth Bass 1
Carp/Minnow 7 25
Catfish 1 17 11 5
Chipmunk 3 3 5 1
Domestic Dog 1 2 2 9 1
Elk 2 5
Fish 36 2 183 228 360 4
Frog/Toad 8 2 1
Gray Squirrel 5 1 9 15 1 22
Green Frog 4 4 1
Hare/Rabbit 2
Large mammal 65 8 93 26 253 16 1556 346
Medium bird 1 4
Medium mammal 60 2 195 6 263 42 8 557 80
Mollusk 20 12 8 11
Muskrat 2
Perching Bird 2
Pigeon 6 2 6 33 10 4
Raccoon 4
Rat/Mouse 6 7
River Otter 1
Salmon/Trout 2 8 6 2
Small bird 40 63 86 79 3
Small mammal 22 85 6 760 72 63 3
Sucker 1
Sunfish 1
Toad 1
Tortoise/Turtle 3
Turkey/Pheasant 1 1
White tailed Deer 11 2 10 21 14 129 21
Woodchuck 1 7
White-footed Mouse 8
Table 12. Summary of taxons identified as NISP per feature.

22
% NISP F1 F2 F3 F12a F12b F12c F17 Midden Shorthouse
Beaver 0.1
Black Bear 0.3 0.2
Bigmouth Bass 0.1
Carp/Minnow 2.7 1.4
Catfish 1.8 1.0 1.8 0.2
Chipmunk 1.1 0.2 0.8
Domestic Dog 0.1 0.1 0.3 0.4 0.2
Elk 0.3 8.8
Fish 13.7 11.8 26.4 13.1 58.4 0.2
Frog/Toad 0.5 0.3
Gray Squirrel 1.9 5.9 1.3 0.9 0.2 0.9
Green Frog 1.5 0.6 0.1
Hare/Rabbit 0.1
Large mammal 24.7 47.1 13.4 45.6 14.5 2.6 64.8 76.5
Medium bird 0.1 0.2
Medium mammal 22.8 11.8 28.1 10.5 15.1 6.8 100.0 23.2 17.7
Mollusk 2.9 21.1 0.5 0.5
Muskrat 0.1
Perching Bird 0.1
Pigeon 2.3 11.8 0.9 1.9 1.6 0.2
Raccoon 0.2
Rat/Mouse 0.9 0.4
River Otter 0.4
Salmon/Trout 0.8 1.2 0.3 0.1
Small bird 15.2 9.1 4.9 12.8 0.1
Small mammal 8.4 12.3 10.5 43.7 11.7 2.6 0.7
Sucker 0.1
Sunfish 0.1
Toad 0.1
Tortoise/Turtle 0.1
Turkey/Pheasant 1.8
Deer 4.2 11.8 1.4 1.2 2.3 5.4 4.6
Woodchuck 0.4 0.3
Mouse 1.2
Table 13. Summary of taxons identified as percent NISP per feature.
23
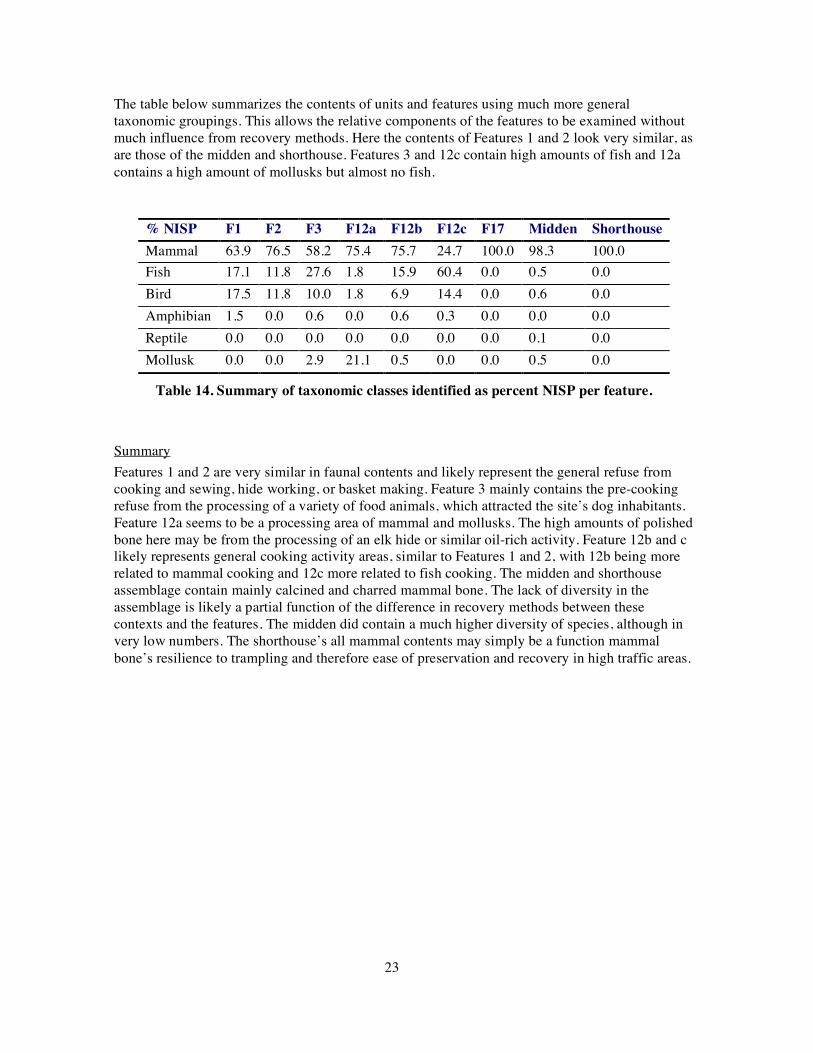
The table below summarizes the contents of units and features using much more general
taxonomic groupings. This allows the relative components of the features to be examined without
much influence from recovery methods. Here the contents of Features 1 and 2 look very similar, as
are those of the midden and shorthouse. Features 3 and 12c contain high amounts of fish and 12a
contains a high amount of mollusks but almost no fish.
% NISP F1 F2 F3 F12a F12b F12c F17 Midden Shorthouse
Mammal 63.9 76.5 58.2 75.4 75.7 24.7 100.0 98.3 100.0
Fish 17.1 11.8 27.6 1.8 15.9 60.4 0.0 0.5 0.0
Bird 17.5 11.8 10.0 1.8 6.9 14.4 0.0 0.6 0.0
Amphibian 1.5 0.0 0.6 0.0 0.6 0.3 0.0 0.0 0.0
Reptile 0.0 0.0 0.0 0.0 0.0 0.0 0.0 0.1 0.0
Mollusk 0.0 0.0 2.9 21.1 0.5 0.0 0.0 0.5 0.0
Table 14. Summary of taxonomic classes identified as percent NISP per feature.
Summary
Features 1 and 2 are very similar in faunal contents and likely represent the general refuse from
cooking and sewing, hide working, or basket making. Feature 3 mainly contains the pre-cooking
refuse from the processing of a variety of food animals, which attracted the site’s dog inhabitants.
Feature 12a seems to be a processing area of mammal and mollusks. The high amounts of polished
bone here may be from the processing of an elk hide or similar oil-rich activity. Feature 12b and c
likely represents general cooking activity areas, similar to Features 1 and 2, with 12b being more
related to mammal cooking and 12c more related to fish cooking. The midden and shorthouse
assemblage contain mainly calcined and charred mammal bone. The lack of diversity in the
assemblage is likely a partial function of the difference in recovery methods between these
contexts and the features. The midden did contain a much higher diversity of species, although in
very low numbers. The shorthouse’s all mammal contents may simply be a function mammal
bone’s resilience to trampling and therefore ease of preservation and recovery in high traffic areas.
24
References
Behrensmeyer, A. K.
1978 Taphonomic and ecologic information from bone weathering. Paleobiology
4:150-162.
Beisaw, A. M.
2000 Cultural Influences on the Differential Decomposition of Animal Bone. Presented
at the annual meeting of the Society for American Archaeology, Philadelphia, PA.
Daniels, Robert A.
1996 Guide to the Identification of Scales of Inland Fishes of Northeastern North
America. New York State Museum Bulletin Number 488.
Lyman, R. L.
1994 Vertebrate Taphonomy: Cambridge Manual in Archaeology. Cambridge
University Press.
Orlandini, J. B.
1996 The Passenger Pigeon: A Seasonal Native American Food Source. Pennsylvania
Archaeologist 66(2):71-77.
Silver, I. A.
1970 The Ageing of Domestic Animals. In: Science in Archaeology. Don Brothwell and
Eric Higgs, editors. Prager Publishers, New York.

Appendix A: Faunal Catalog

Appendix B: Credentials

April M. Beisaw, RPA
Education
1998 MA in Anthropology, Binghamton University, New York
1996 BA in Chemistry/Anthropology, Rutgers University, New Jersey
Experience
Eleven years of experience with prehistoric and historic sites in Arizona, California, Colorado,
Maryland, Michigan, New Jersey, New Mexico, New York, Texas, Utah, and Wisconsin. .
Specializations include zooarchaeology, taphonomy, human osteology, forensic anthropology,
public archaeology, and cultural resource management.
Selected Publications and Presentations
2006 Plague or Promise? Frogs and Toads from New York’s Engelbert Site (2006). Paper
presented at the 71st Annual Meeting of the Society for American Archaeology, San Juan,
Puerto Rico
2006 Evaluating Iroquois Occupational Continuity with a Historical Ecology-Based
Zooarchaeology (2006). Presentation at the 30th Annual Biological Sciences Research
Symposium, Binghamton University, NY
2005 Differentiating the Dogs: Morphological & Ancient DNA Analysis of Archaeological
Canids (2005). Paper presented at the 70th Annual Meeting of the Society for American
Archaeology, Salt Lake City, UT (with Della Stumbaugh)
2004 Faunal Analysis of Texas, New Mexico, and Arizona Portions of the AT&T NexGen/Core
Project. Prepared for Western Cultural Resource Management, Farmington, NM.
2004 Faunal Analysis of the White Mesa 42SA22483 Site, San Juan County, Utah. Prepared for
Abajo Archaeology, Bluff UT.
2004 Faunal Analysis of the Gothic Town Hall (5GN1525) Renovation, Colorado. Prepared for
Alpine Archaeological Consultants, Montrose, CO.
2003 Faunal Analysis of the Hamblin and Wellington Town Sites (42JB388 & 42WS1585),
Utah. Prepared for Alpine Archaeological Consultants, Montrose, CO.
2002 Faunal Analysis of the 1994 Belair Mansion (18PR135) Collection, Bowie, MD. Prepared
for James G. Gibb, Archaeological Consultant, Annapolis, MD.
2001 Turtle Ecology and Feature Taphonomy in the Chesapeake Region. Presented at the
Annual Meeting of the Society for American Archaeology, New Orleans, LA.
2000 Faunal Analysis of the 1999 Berwind (5LA2175) Collection. Prepared for the Colorado
Coalfield War Archaeology Project, University of Denver, Colorado.
2000 Cultural Influences on the Differential Decomposition of Animal Bone. Presented at the
annual meeting of the Society for American Archaeology, Philadelphia, PA.
2000 Eating Like a Pig in a Colonial Tavern: The Taphonomy of Tavern Assemblages.
Presented at the annual meeting of the Society for Historical Archaeology, Quebec,
Canada (with Kate Levendosky).
1998 Differential Decomposition and Recovery: Bone Taphonomy at the Thomas/Luckey Site,
Ashland, NY. Unpublished Masters Thesis. Binghamton University, Binghamton, NY.