Zinc Ion Interactions in a Two-Dimensional Covalent ... · 2Physical/ Materials Chemistry Division,...
40
S1 Zinc Ion Interactions in a Two-Dimensional Covalent Organic Framework based Aqueous Zinc Ion Battery Abdul Khayum M, 1, 2 Meena Ghosh, 1, 2 Vidyanand Vijayakumar, 1, 2 Arjun Halder, 1, 2 Maryam Nurhuda, 3 Sushil Kumar, 2 Matthew Addicoat, 3 Sreekumar Kurungot, 1, 2* Rahul Banerjee 4* 1 Academy of Scientific and Innovative Research (AcSIR). Ghaziabad, Uttar Pradesh 201002, India. 2 Physical/ Materials Chemistry Division, CSIR-National Chemical Laboratory, Dr. Homi Bhabha Road, Pune- 411008, India. 3 School of Science and Technology, Nottingham Trent University, Clifton Lane, NG11 8NS Nottingham, United Kingdom. 4 Department of Chemical Sciences, Indian Institute of Science Education and Research, Kolkata, Mohanpur 741246, India. Section S-1 General information S-2 Synthetic procedures S-3 Structural modelling, PXRD and DFTB S-4 FT – IR S-5 13 C CP MAS solid state NMR spectroscopy S-6 TGA & Gas adsorption analysis S-7 SEM & TEM S-8 XPS S-9 Electrochemical analysis S-10 References Electronic Supplementary Material (ESI) for Chemical Science. This journal is © The Royal Society of Chemistry 2019
Transcript of Zinc Ion Interactions in a Two-Dimensional Covalent ... · 2Physical/ Materials Chemistry Division,...

S1
Zinc Ion Interactions in a Two-Dimensional Covalent Organic
Framework based Aqueous Zinc Ion Battery
Abdul Khayum M, 1, 2
Meena Ghosh, 1, 2
Vidyanand Vijayakumar, 1, 2
Arjun Halder, 1, 2
Maryam
Nurhuda, 3 Sushil Kumar,
2 Matthew Addicoat,
3 Sreekumar Kurungot,
1, 2* Rahul Banerjee
4*
1 Academy of Scientific and Innovative Research (AcSIR). Ghaziabad, Uttar Pradesh 201002, India. 2Physical/ Materials Chemistry Division, CSIR-National Chemical Laboratory, Dr. Homi Bhabha Road, Pune-
411008, India. 3School of Science and Technology, Nottingham Trent University, Clifton Lane, NG11 8NS Nottingham, United
Kingdom.
4Department of Chemical Sciences, Indian Institute of Science Education and Research, Kolkata, Mohanpur 741246,
India.
Section
S-1 General information
S-2 Synthetic procedures
S-3 Structural modelling, PXRD and DFTB
S-4 FT – IR
S-5 13
C CP MAS solid state NMR
spectroscopy
S-6 TGA & Gas adsorption analysis
S-7 SEM & TEM
S-8 XPS
S-9 Electrochemical analysis
S-10 References
Electronic Supplementary Material (ESI) for Chemical Science.This journal is © The Royal Society of Chemistry 2019

S2
S-1: General information
General remarks: 1,3,5- triformylphloroglucinol was synthesized by the reference of reported
literatures.1, 2
All other chemicals were commercially available and used as such without any
further purification. 2,5-diaminohydroquinone dihydrochloride was purchased from Sigma
Aldrich. Wide-angle X-ray diffraction (WAXD) patterns were recorded on a Rigaku, MicroMax-
007HF with high-intensity Microfocus rotating anode X-ray generator. All samples were
recorded in the 2θ range of 2–40 degrees and data was collected with the help of Control Win
software. A Rigaku, R-axis IV++ detector was employed in wide-angle experiments. The
radiation used as CuK (1.54 Å) with a Ni filter, and the data collection was carried out using an
aluminium holder. Fourier transform infrared (FT-IR) spectra were taken on a Bruker Optics
ALPHA-E spectrometer with a universal Zn-Se ATR (attenuated total reflection) accessory in
the 600-4000 cm–1
region or using a Diamond ATR (Golden Gate). Thermo gravimetric analyses
(TGA) were carried out on a TG50 analyzer (Mettler-Toledo) or a SDT Q600 TG-DTA analyzer
under N2 atmosphere at a heating rate of 20 ºC min–1
within a temperature range of 50-900° C.
Low-pressure volumetric N2 gas adsorption measurements were performed on activated COF at
77 K, maintained by a liquid nitrogen bath, with pressures ranging from 0 to 760 Torr (1 bar) on
a Quantachrome, Quadrasorb automatic volumetric instrument. SEM images were obtained with
a Zeiss DSM 950 scanning electron microscope and FEI, QUANTA 200 3D Scanning Electron
Microscope with tungsten filament as electron source operated at 10 kV. The samples were
sputtered with Au (nano-sized film) prior to imaging by a SCD 040 Balzers Union. TEM images
were recorded using FEI Tecnai G2 F20 X-TWIN TEM at an accelerating voltage of 200 kV.
The TEM Samples were prepared by the HqTp COF dispersed in acetonitrile solvent by 20
minute sonication and then drop casted on copper grids TEM Window (TED PELLA, INC. 200
mesh). 13
C CP MAS Solid state NMR (SSNMR) spectra were taken in a Bruker 300 MHzNMR
spectrometer. X-ray photoelectron spectroscopy (XPS) measurement was carried out by a VG
Microtech, model ESCA 3000 instrument equipped with ion gun (EX-05) for cleaning the
surface. All electrochemical analysis include cyclic voltammetry (CV), impedance
measurements (Electrochemical Impedance Spectroscopic [EIS]) investigation was performed
from 106 to 0.01 Hz frequency against the open circuit potential with a sinus amplitude of 10 mV
[Vrms = 7.07mV]) and galvanostatic charge/discharge measurements (GCDC) were carried out

S3
using a Bio-LogicSP-300 PG Stat instrument. Electrochemical data were analyzed in EC-Lab
software V10.19.
Atomic positions and cell sizes of the HqTp COF layers were optimized using the Self-
Consistent-Charge Density-Functional Tight-Binding (SCC-DFTB) method, including Lennard-
Jones dispersion. C, N, O, H atoms were described using the mio-0-1 parameter set [DOI:
10.1103/PhysRevB.58.7260], and Zn atoms were described using the znorg-0-1 parameters
[DOI:10.1021/ct800455a].The monolayer, eclipsed (AA), slipped-AA and staggered (AB)
stacking were considered. To determine the positions of the Zinc atoms, 6 Zn atoms per unit cell
were randomly placed in the previously optimized AA and slipped-AA COF models and
optimized. From 50 optimizations, the lowest energy structure of Zn-HqTp was kept.
S-2: Synthetic procedure
HqTp COF: 2, 5-diaminohydroquinone dihydrochloride (Hq, 0.6 mmol) and p-toluenesulphonic
acid (PTSA, 3 mmol) are thoroughly mixed at room temperature and 50 µl of water is added to
the system. To the homogeneous mixture 1,3,5-triformylphloroglucinol (Tp, 0.4 mmol) is added
and again mixed vigorously for 10 minutes. The obtained black coloured paste is heated to 90°C
for 24 hours under closed condition. Later, the COF after the thermal treatment is washed by the
following order with water (3 times), N,N-dimethylacetamide (3 times), water (3 times) and
acetone (3 times) (Isolated yield: >80%).
PaTp COF: p-Phenylenediamine (Pa, 0.6 mmol) and p-toluenesulphonic acid (PTSA, 3 mmol)
are thoroughly mixed at room temperature and 50 µl of water is added to the system. To the
homogeneous mixture 1,3,5-triformylphloroglucinol (Tp, 0.4 mmol) is added and again mixed
vigorously for 10 minutes. The obtained paste is heated to 90°C for 24 hours under closed
condition. Later, the COF after the thermal treatment is washed by the following order with
water (3 times), N, N-dimethylacetamide (3 times), water (3 times) and acetone (3 times)
(Isolated yield: >90%).
S4
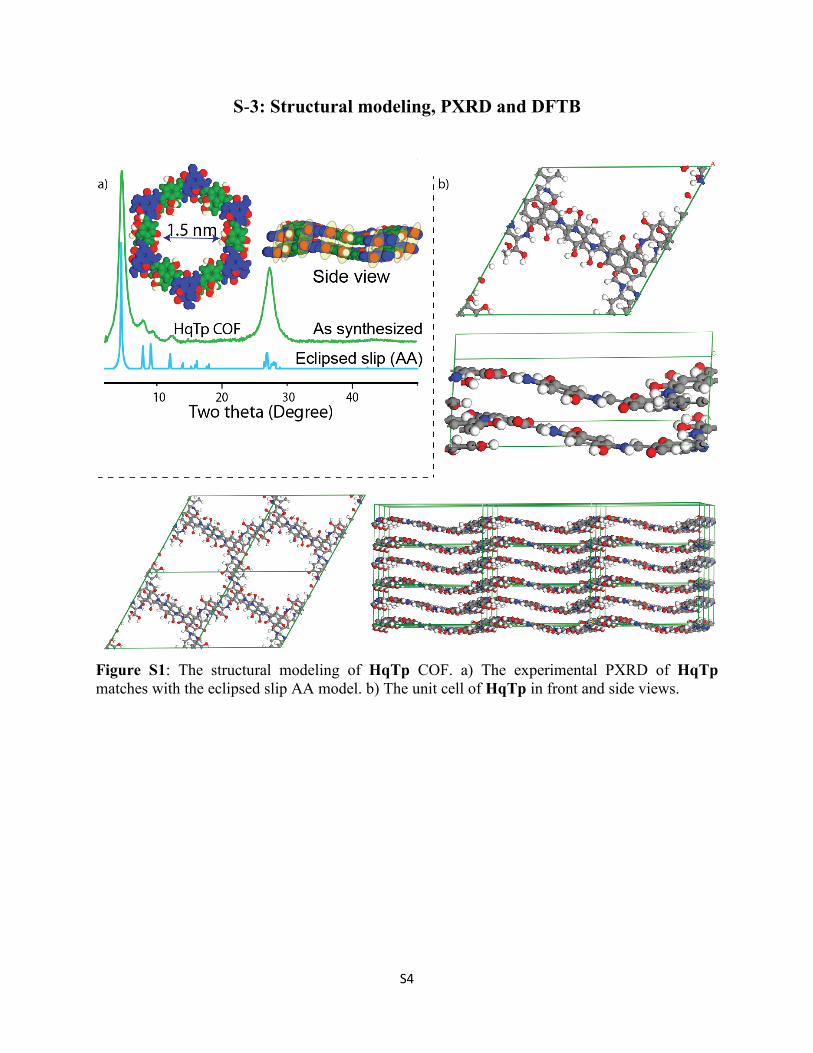
S-3: Structural modeling, PXRD and DFTB
Figure S1: The structural modeling of HqTp COF. a) The experimental PXRD of HqTp
matches with the eclipsed slip AA model. b) The unit cell of HqTp in front and side views.

S5
Figure S2: The unit cells of HqTp in quinone form in a) AA and b) slip AA stacked models
with the perlayer stabilization energy. It indicates the slip form exhibits more stabilization energy
compared to the AA stacked.

S6
Figure S3: The DFTB models of Zinc interaction with a) AA stacked and b) slip AA stacked
HqTp COF. The Zinc interaction with slip form of COF provides a large enhancement in energy
stabilization compared to the simple AA stacked form of COF.

S7
Figure S4: The DFTB models of Zinc interaction with a) AA stacked and b) slip AA stacked
PaTp COF. Due to the less number of the active sites, the number of zinc ions interacts with
COF also less when compared to the HqTp COF.

S8
Figure S5: The electro static potential (ESP) mapping of a) HqTp and b) PaTp COFs by
considering a bi-layer single pore and a unit cell. In HqTp, the density isosurface (the edge of
the "bubble" is 0.03 au and the Coulomb potential ranges from-0.035 au (red) to 0.47 au (blue)
for the single pore and -0.33 au (red) to 0.061 au (blue) for the unit cell. Similarly, in PaTp, it
ranges from -0.054 au (red) to 0.42 au (blue) for the single pore and -0.4 au (red) to 0.066 au
(blue) for unit cells. Herein, the negative ESP (red) reflects the affinity of the sites toward the
zinc uptake. Therefor, from the ESP calculations, it is clear that quinone C=O, Tp C=O exhibits
more –ve compared to the NH sites. Whereas, the ESP of a benzene linked β-ketoenamine PaTp
COF showcases only Tp C=O groups as active sites for uptaking the Zn2+
ions. It further
suggests the excellent candidacy of HqTp COF.

S9
S-4: FT-IR spectroscopy
Figure S6: FT-IR spectroscopy of a) HqTp and the building units; b) COF after electrochemical
analysis

S10
S-5: 13
C CP MAS Solid-state NMR
Figure S7: The 13
C CP MAS solid-state NMR of pristine HqTp COF and after discharged to 0.2
V.
S11
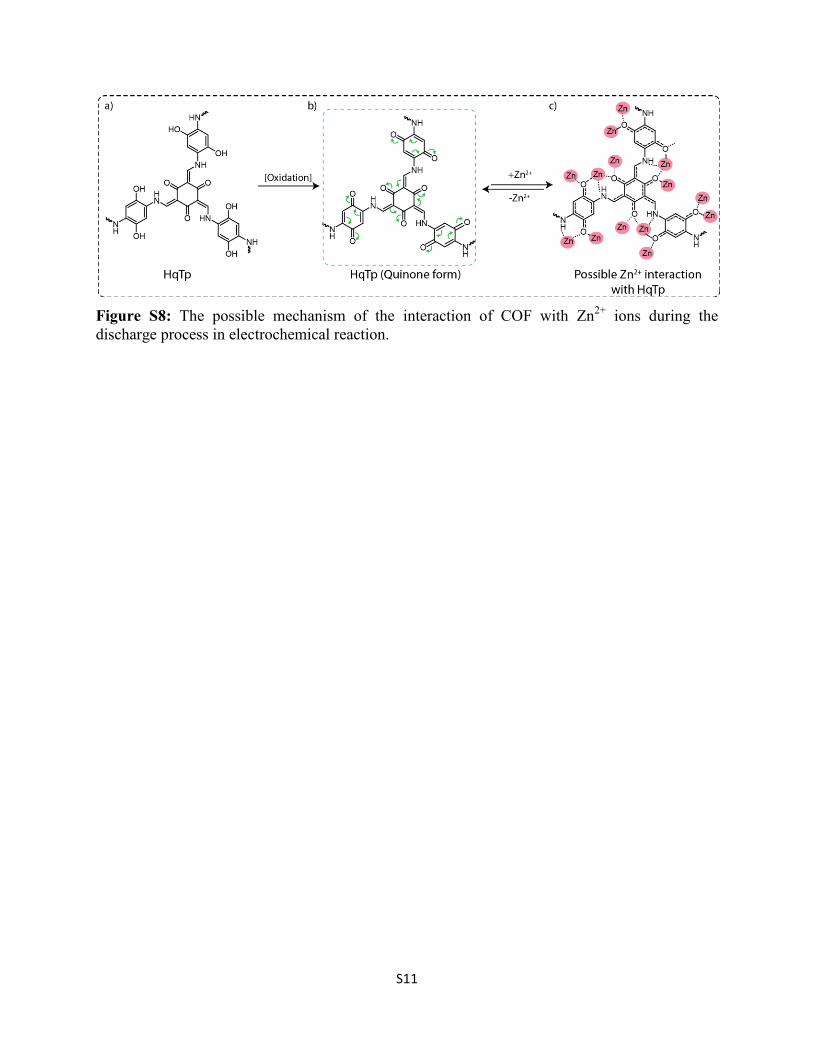
Figure S8: The possible mechanism of the interaction of COF with Zn2+
ions during the
discharge process in electrochemical reaction.

S12
S-6: TGA & N2 gas adsorption analysis
Figure S9: TGA of HqTp COF at N2 atmosphere.

S13
Figure S10: N2 gas adsorption analysis of HqTp COF.
S14
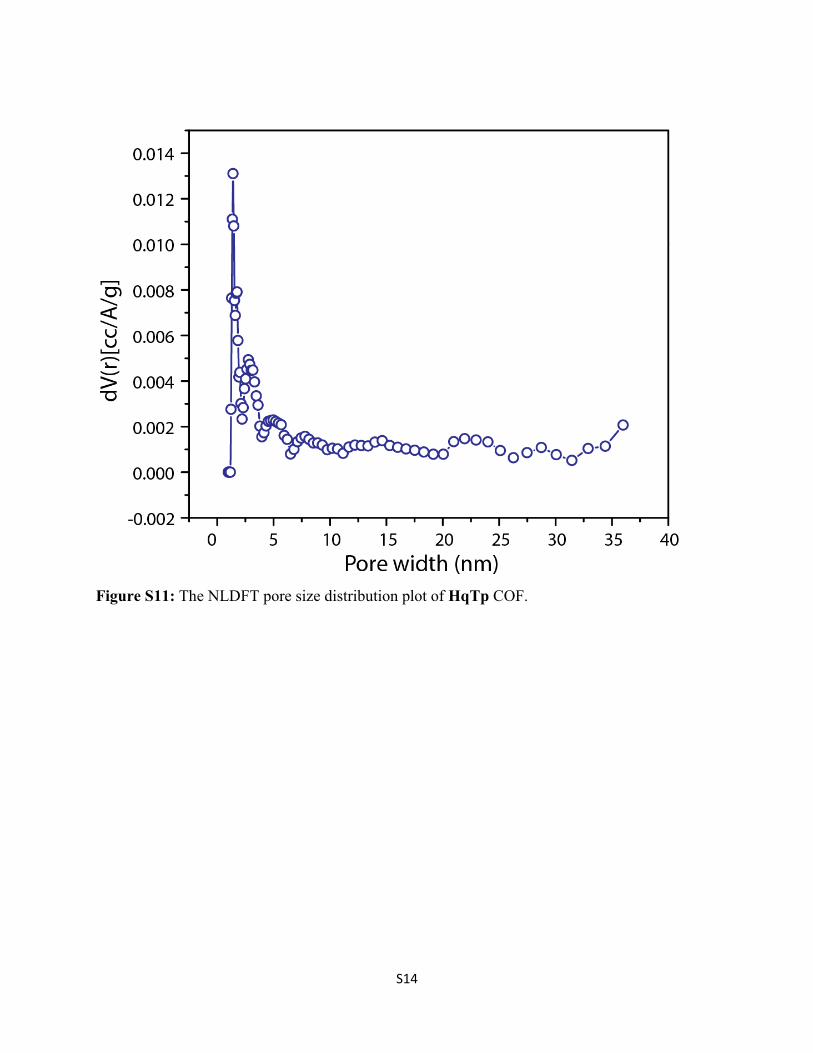
Figure S11: The NLDFT pore size distribution plot of HqTp COF.

S15
S-7: TEM and SEM
Figure S12: TEM images of HqTp COF.
Figure S13: TEM elemental mapping of discharged (0.2 V) cathode of HqTp COF.

S16
Figure S14: FESEM images of HqTp COF.

S17
Figure S15: ESEM elemental mapping of pristine, charged (1.8 V) and discharged (0.2 V)
cathode of HqTp COF.

S18
Figure S16: ESEM of HqTp cathode after 500 charge-discharge cycles.
S-8: X-ray Photoelectron Spectroscopy
Figure S17: The deconvoluted XPS profiles C1s; N1s & O1s of pristine HqTp cathode.

S19
Figure S18: The deconvoluted XPS profiles C1s; N1s & O1s of charged (1.8 V) HqTp cathode.

S20
Figure S19: The deconvoluted XPS profiles C1s; N1s & O1s of discharged (0.2 V) HqTp
cathode.
All XPS samples were analyzed by the direct mounting of the pristine, charged (1.8 V),
discharged (0.2 V) electrodes. The charged and discharged electrodes were thoroughly washed
with water to remove excess amount of ZnSO4 electrolyte.

S21
S-9: Electrochemical characterization
Fabrication of Zn/HqTp cell- For the fabrication of cathode, uniform slurry was prepared by
mixing HqTp COF (4 mg) and pristine CNF (1 mg) as conducting additives in 3:1 water-IPA
solution (1ml). Later, 5wt% Nafion solution as binder was added into the slurry. The slurry was
coated over 1cm2 area of modified carbon fiber paper to obtain 1 mg cm
-2 loading of HqTp and
CNF composite (the hydrophobic surface of pristine carbon fiber paper was modified by
anodizing at constant voltage of 10 V for 5 min in 0.1 M Na2SO4 solution followed by annealing
at 250oC for 2 h to remove the excess surface functional groups). The coated electrodes are dried
at 60oC. A piece of metallic Zn foil (1 cm
2 area) was used as an anode. A modified Nafion 212
membrane was applied as separator. The pristine Nafion 212 membrane was treated at 80o C
subsequently with 4wt% H2O2, DI water, 0.8M H2SO4 and DI water. The pretreated Nafion
membrane was stored in aqueous solution of 3M ZnSO4 for two days to ensure complete
impregnation of the electrolyte. Finally the cathode, anode and separator were assembled in
CR2032 coin cell.
Here, in paper, the terms anode and cathode are used for the negative and positive electrodes,
respectively, considering the discharging process of the cell.
Electrochemical characterization- The performance of the Zn/HqTp cells was assessed by CV
analyses (at scan rates of 1.0, 0.5, and 0.1 mV s-1
) and galvanostatic charge/discharge (GCD) (at
constant current rates of 125, 312.5, 625, 1250 and 3750 mA g-1
) analyses. The cell was operated
in a potential range of 1.8V to 0.2 V vs. Zn/Zn2+
. The electrochemical impedance spectroscopy
was carried out from higher frequency of 1 MHz to lower frequency of 1 Hz against an open
circuit potential with a sinus amplitude of 10 mV (Vrms= 7.07 mV). The cycling stability of the
cell was investigated by GCD experiment at current rate of 3000 mA g-1
.
Equations:
1. Specific capacity
The capacity of the Zn/HqTp cell is calculated from the galvanostatic charge-discharge plot by
using Equation S1:
Capacity = Discharge time hour × applied current density (A 𝑔−1) × 1000 (Equation S1)

S22
2. Calculation of energy density (ED) and power density (PD)
𝐸𝐷 = 𝐴𝑣𝑒𝑟𝑎𝑔𝑒 discharge capacity 𝑚𝐴 𝑔−1 × V …. (Equation S2)
where, ‘V’ is the average voltage (calculation of average voltage is given in Figure S24,
Equation S6).
𝑃𝐷 =ED
Discharge time hour …. (Equation S3)
3. Calculation of the number discharged of Zn2+
ion per unit cell of COF
1. Based on the number of carbonyl groups in the unit cell:
The theoretical specific capacity4 =
No .of electrons × 96485
3600 ×Molecular weight …. (Equation S4)
4
The number of carbonyl groups in the unit cell (from Hq and Tp) = 24
If we consider two carbonyls are interacted with one Zn2+
ion, maximum number of Zn2+
ions
interacted in the unit cell of slip AA stacked HqTp COF = 24/2 = 12
Total number of electrons = 12 ×2 = 24
Molecular weight of the COF (based on the unit cell) = 1452 gmol-1
Therefore, the theoretical specific capacity = 24 × 96485
3600 ×1452 = 0.442 Ahg
-1 = 442 mAhg
-1
The experimentally obtained discharge capacity = 276 mAhg-1
The efficiency of specific capacity based on the DFTB model = Experimental capacity
Theoretical capacity × 100
…. (Equation S5)
= 62.44 %
Therefore the number of discharged Zn2+
ion interacted with COF based on the DFTB model =
62.44×12
100
= 7.49 Zn2+
ions per unit cell.
2. Based on the DFTB model of HqTp-Zn:
The theoretical specific capacity = No .of electrons × 96485
3600 ×Molecular weight …. (Equation S4)
4
Maximum number of Zn2+
ions interacted in the unit cell of slip AA stacked HqTp COF = 23
Number of electrons from one Zn2+
ion = 2
Total number of electrons = 23 ×2 = 46
Molecular weight of the COF (based on the unit cell) = 1452 gmol-1

S23
Therefore, the theoretical specific capacity = 46 × 96485
3600 ×1452 = 0.849 Ahg
-1 = 849 mAhg
-1
The experimentally obtained discharge capacity = 276 mAhg-1
The efficiency of specific capacity based on the DFTB model =
Experimental capacity
Theoretical capacity × 100
…. (Equation S5)
= 32.5 %
Therefore the number of discharged Zn2+
ion interacted with COF based on the DFTB model =
32.5×23
100
= 7.47 Zn2+
ions per unit cell.
Figure S20: CV of HqTp COF at 0.1 mVsec-1
.
The CV profile of the HqTp COF exhibits a set of redox peaks with onset potentials (The
potential where the peak is started to form) is situated at 0.9 V (peak 1) and 1.4 V (peak 3) vs.
Zn/Zn2+
(Figure S20). As it can be observed in the same CV, two additional weak peaks (the
onset potentials of oxidation peak and reduction peaks are at 1.30 (peak 2) and 0.73 V (peak 4)
vs. Zn/Zn2+
, respectively) are also observed. The peaks 1 and 2 are easily distinguishable but at
the same time the redox pair of peak 2 is not visible in the reduction half. However, considering
the broadness of the peak 3, it can be concluded that the redox pair of peak 2 is in fact merged
S24
within the peak 3 (R. Gulaboski, P. Kokoškarova and S. Mitrev, Electrochim. Acta, 2012, 69, 86–
96). It is worth mentioning that the peak 4 is not reversible but it is present only at a low scan
rate as low as 0.1 mV sec-1
. However, if the higher scan rates, for instance 0.5 and 1 mV sec-1
are
considered (Figure S21), the peak (2) and (4) are not apparent. Moreover, the current response
obtained from the peak 2 and 4 even at 0.1 mV sec-1
are negligible and do not contribute much to
the capacity. Hence it can be concluded that the peaks 1 and 3 are the signature peaks
corresponding to the reversible shuttling of the Zn2+
-ions.
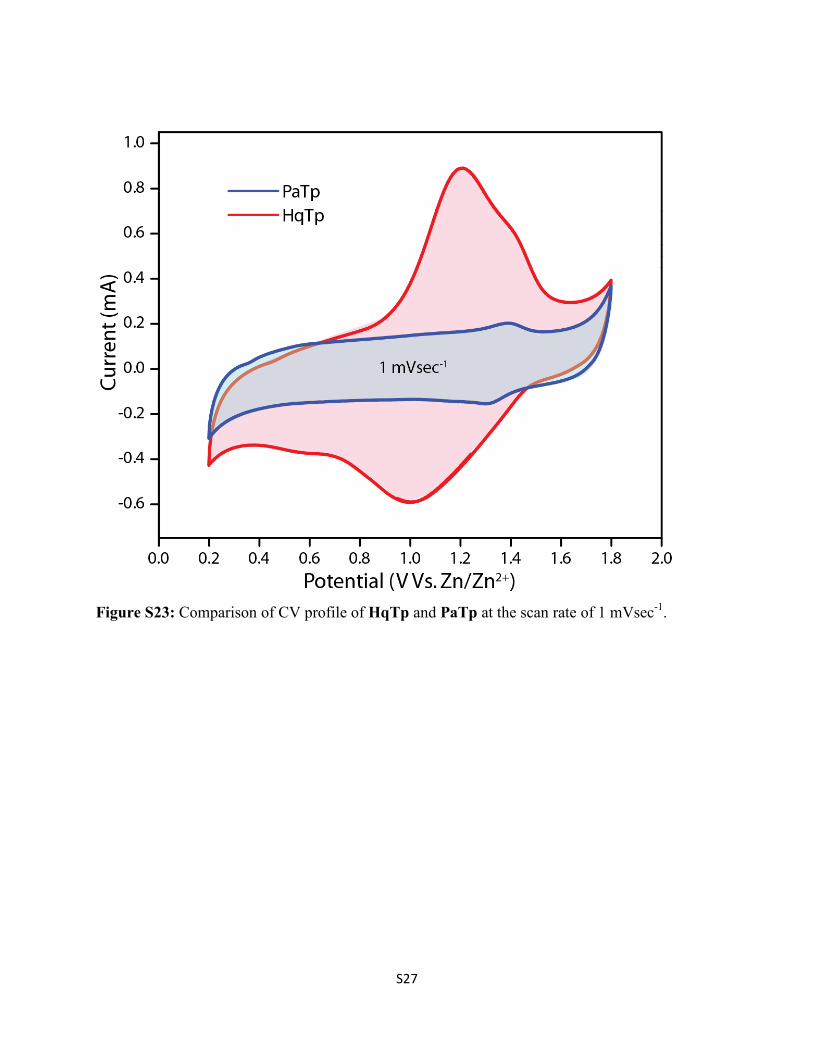
Notably, only the Tp C=Os are responsible for the redox activity in the PaTp COF. A pair of
weak redox peaks is present in the CV profile of PaTp at 1 mV sec-1
(Figure S23). Taking this
into account, we assume, the weak peak 2 in the CV of HqTp could be originated from the Tp
C=O and the corresponding reduction peak could be merged with peak 3.

S25
Figure S21: a) Cyclic voltammetry of HqTp COF in three electrode experiment at the scan rate
of 1 mVSec-1
b) Cyclic voltammetry of HqTp COF in two electrode device experiment at
different scan rates.

S26
Figure S22: Galvanostatic charge-discharge analysis of HqTp COF at different scan rates.
S27
Figure S23: Comparison of CV profile of HqTp and PaTp at the scan rate of 1 mVsec-1
.

S28
Figure S24: Galvanostatic charge-discharge analysis of PaTp COF at different scan rates.

S29
Figure S25: The galvanostatic discharging experiment (conducted at OCV) of HqTp COF at
very high loading (60 mg).
The electrochemical analysis of 60 mg of active material on the electrode has been investigated
for checking the efficiency of the high loading performance.
For the fabrication of cathode, the uniform slurry was prepared by mixing HqTp COF (60 mg)
and pristine CNF (15 mg) as conducting additives in 3:1 water-IPA solution (12 ml). Later,
5wt% Nafion solution as binder was added into the slurry. The slurry was coated over 4 cm2 area
of modified carbon fiber paper to obtain 15 mg cm-2
loading of HqTp and CNF composite. The
coated electrodes are dried at 60oC. A piece of metallic Zn foil with thickness of x um (4 cm
2
area) was used as an anode. Herein, we dipped both electrodes in 3M ZnSO4 electrolyte and the
then the discharge analysis has been done.
The galvanostatic discharging experiment of HqTp COF at very high loading at the current rate
of 16 mAg-1
delivered a specific capacitance of 66 mAhg-1
. Similarly, the areal capacitance is

S30
noted 0.97 mAhcm-2
at the current rate 0.25 mAcm-2
. The discharged COF is taken for the
further analysis of 13
C CP MAS solid-state NMR.
Figure S26: Ragone plot of HqTp COF.

S31
Figure S27: Voltage vs. discharge capacity plot of HqTp COF at a current rate of 100 mA g-1
The average voltage was calculated by integrating the area under the voltage vs. discharge
capacity plot at a current rate of 0.10 A g-1
. The area indicated in the above plot equals to the
specific energy density based on the loading of active material on cathode.5 The integrated area
from Figure S27 is calculated to be 240 Whkg-1
and the corresponding discharge capacity is 276
mA h g-1
. Therefore, the average voltage can be calculated from the following equation.
Average voltage = 𝑆𝑝𝑒𝑐𝑖𝑓𝑖𝑐 𝑒𝑛𝑒𝑟𝑔𝑦 𝑑𝑒𝑛𝑠𝑖𝑡𝑦
𝐷𝑖𝑠𝑐𝑎𝑟𝑔𝑒 𝑐𝑎𝑝𝑎𝑐𝑖𝑡𝑦 =
240
276 = 0.87 V …………………... (Equation S6)
This average voltage value is used in Equation S2 for calculating energy density at other current
rates.
S32
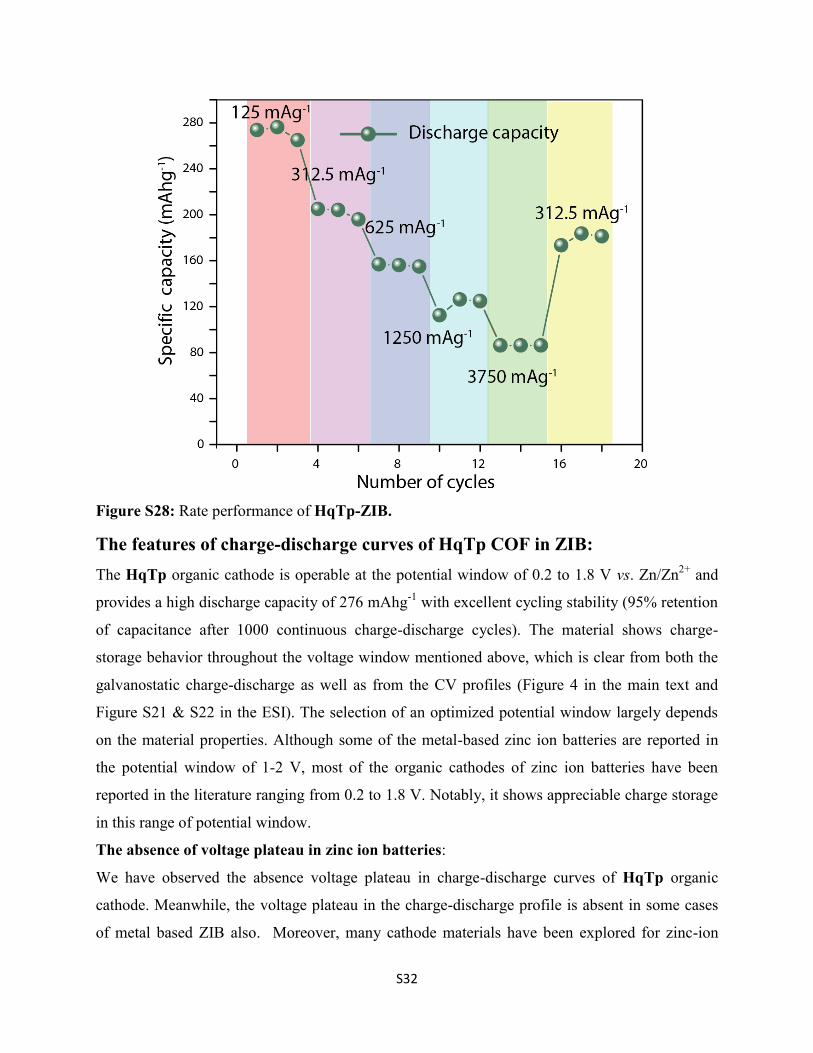
Figure S28: Rate performance of HqTp-ZIB.
The features of charge-discharge curves of HqTp COF in ZIB:
The HqTp organic cathode is operable at the potential window of 0.2 to 1.8 V vs. Zn/Zn2+
and
provides a high discharge capacity of 276 mAhg-1
with excellent cycling stability (95% retention
of capacitance after 1000 continuous charge-discharge cycles). The material shows charge-
storage behavior throughout the voltage window mentioned above, which is clear from both the
galvanostatic charge-discharge as well as from the CV profiles (Figure 4 in the main text and
Figure S21 & S22 in the ESI). The selection of an optimized potential window largely depends
on the material properties. Although some of the metal-based zinc ion batteries are reported in
the potential window of 1-2 V, most of the organic cathodes of zinc ion batteries have been
reported in the literature ranging from 0.2 to 1.8 V. Notably, it shows appreciable charge storage
in this range of potential window.
The absence of voltage plateau in zinc ion batteries:
We have observed the absence voltage plateau in charge-discharge curves of HqTp organic
cathode. Meanwhile, the voltage plateau in the charge-discharge profile is absent in some cases
of metal based ZIB also. Moreover, many cathode materials have been explored for zinc-ion

S33
batteries have different sets of voltage window and shows charge-storage properties despite the
absence of voltage plateau. It has been observed that MnO2 depending on their crystal structure
could display charge-storage properties despite the absence of voltage plateau (Table S1, column
1). Similarly, another popular cathode material for zinc-ion battery, viz., V2O5 (Vanadium based
cathodes), also displays good charge-storage behavior but do not exhibit a well-defined sharp
voltage plateau (Table S1, column 2).
Reference for the absence of voltage plateau
for Mn based cathodes
Reference for the absence of voltage plateau
for V based cathodes
H. Pan et al., Nat. Energy, 2016, 1, 16039 C. Xia et al., Angew. Chem. Int. Ed. 2018, 57,
1 – 7
D. Kundu et al., Nat. Energy, 2016 1, 16119 D. Chao et al., Adv. Mater. 2018, 1803181
C. Xu et al., Angew. Chem. Int. Ed. 2012, 51,
933 –935
V. Soundharrajan et al., Nano Lett., 2018, 18,
4, 2402-2410
Y. Jin et al., Adv. Mater. 2019, 1900567 F. Wan et al., Nat. Commun., 2018, 9 , 1656
N. Zhang et al., J. Am. Chem. Soc. 2016, 138,
12894−12901
J. Ding et al., Adv. Mater. 2018, 30, 1800762
Y. Li et al., Chem. Mater. 2019, 31,
2036−2047
N. Zhang et al., ACS Energy Lett. 2018, 3,
1366−1372
S.-D. Han et al., Chem. Mater. 2017, 29,
4874−4884
Y. Yang et al., Energy Environ. Sci., 2018,11,
3157-3162
L. Wang et al., ACS Sustainable Chem. Eng.
2018, 6, 16055−16063
P. He et al., Small 2017, 13, 1702551
J. Wang et al., J. Mater. Chem. A, 2019, 7,
13727–13735
P. Hu et al., ACS Appl. Mater. Interfaces 2017,
9, 42717−42722
Table S1: References for the absence of voltage plateau in metal (MnO2 and V2O5) cathode
based zinc ion batteries.

S34
It is important to note that, in the case of zinc-ion batteries, capacitive-like charge-discharge
profiles (charge-discharge profiles without voltage-plateaus are known as capacitive-like charge-
discharge profiles) are very common in the literature. Therefore, zinc-ion batteries are called as
zinc-ion hybrid capacitors/ battery as well (Table S2). A hybrid capacitor can deliver high energy
density and power density concurrently in a particular potential range. In this aspect, the hybrid
capacitors are well accounted in those devices which require high energy and power density at a
time for an operating potential window.
Active material (Cathode) Reference
Porous Framework Zinc Pyrovanadate
C. Xia et al., Adv. Mater. 2018, 30, 1705580
Co-polymer derived hollow carbon spheres
(HCSs)
S. Chen et al., J. Mater. Chem. A, 2019, 7,
7784–7790
Porous V2O5 P. Hu et al., ACS Appl. Mater. Interfaces 2017,
9, 42717−42722
Activated carbon P. Zhang et al., Adv.Mater.2019, 31, 1806005
Review on ‘metal ion hybrid capacitors’ L. Dong et al., J. Mater. Chem. A, 2019, 7,
13810–13832
Table S2: References for hybrid capacitive zinc ion batteries.
Notably, for COF based materials in lithium or sodium-ion batteries, it is very common that the
charge discharge-profiles are without voltage plateaus and exhibit hybrid capacitive-like charge-
discharge curves (Table S3, Figure 1). This made us believe that voltage plateau may not
necessarily important for a material to exhibit the candidacy towards the potential applications.

S35
COFs Reference
DAAQ-ECOF S. Wang et al., J. Am. Chem. Soc. 2017, 139,
12, 4258-4261
DAAQ-COF S. Gu et al.,
doi.org/10.1021/jacs.9b03467
PIBN‐G COF Z. Lou et al., Angew. Chem. Int. Ed. 2018, 57,
9443 –9446
Table S3: References for the COFs exhibits charge-discharge curves without a voltage plateau in
lithium and sodium ion batteries.
S36

S37
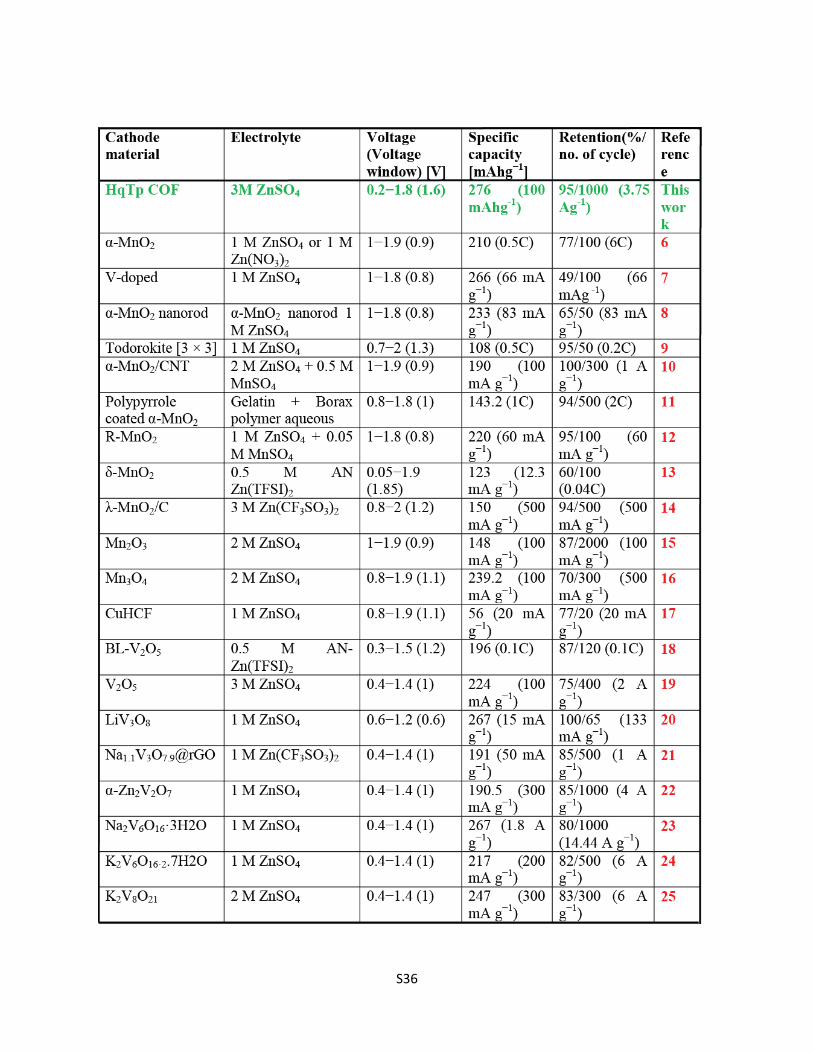
Table S4: The comparison table of HqTp COF with reported cathode materials for zinc ion
batteries.
Note: To compare the performance of the HqTp COF with reported cathode material, we have
taken the specific capacity obtained from the overall potential window of the ZIB. Herein, the
differences in the voltage plateau in charge-discharge curves of various materials have not been
considered for simplifying the comparison. Additionally, we have considered charge-discharge
cyclic stability at a particular current rate for analyzing the overall performance of the material.
Figure S29: Charging a smart phone and a stop watch.

S38
Figure S30: a) PaTp COF ; b) PXRD and c) IR of PaTp COF.
S-10: References
1. J. H. Chong, M. Sauer, B.O. Patrick, M. J. MacLachlan, Org. Lett. 2003, 5, 3823
2. R. Kantam, R. Holland, B. P. Khanna, K. D. Revell, Tetrahedron Lett.2011, 52, 5083
3. E. W. L. Chan, M.N. Yousaf, J. Am. Chem. Soc. 2006, 128, 15542-15546.
4 C. Gerbaldi, M. Destro, J. R. Nair, S. Ferrari, I. Quinzeni , E. Quartarone, Nano Energy, 2013,
2, 1279–1286.
5. L. Zhang, L. Chen, X. Zhou, Z. Liu, Advanced Energy Materials, 2015, 5, 1400930.
6. C. Xu, B. Li, H. Du, F. Kang, Angew. Chem., Int. Ed. 2012, 51, 933−935.
7. M. H. Alfaruqi, S. Islam, V. Mathew, J. Song, S. Kim, D. P. Tung, J. Jo, S. Kim, J. P. Baboo,
Z. Xiu, J. Kim, Appl. Surf. Sci. 2017, 404, 435−442.
8. M. H. Alfaruqi, J. Gim, S. Kim, J. Song, J. Jo, S. Kim, V. Mathew, J. Kim, J. Power Sources
2015, 288, 320−327.
9. J. Lee, J. B. Ju, W. I. Cho, B. W. Cho, S. H. Oh, Electrochim. Acta 2013, 112, 138−143.
10. D. Xu, B. Li, C. Wei, Y. B. He, H. Du, X. Chu, X.Qin, Q. H.Yang, F. Kang, Electrochim.
Acta 2014, 133, 254−261.
11. D. Chao, C. Zhu, M. Song, P. Liang, X. Zhang, N. H. Tiep, H. Zhao, J. Wang, R. Wang, H.
Zhang, H. J. Fan. Adv. Mater. 2018, 30, 1803181.
12. M. Chamoun, W. R. Brant, C. W. Tai, G. Karlsson, D. Noreus, Energy Storage Mater. 2018,
15, 351−360.

S39
13. S. D. Han, S. Kim, D. Li, V. Petkov, H. D. Yoo, P. J. Phillips, H. Wang, J. J. Kim, K. L.
More, B. Key, R.F. Klie, J. Cabana, V. R. Stamenkovic, T. T. Fister, N. M. Markovic, A. K.
Burrell, S. Tepavcevic, J. T. Vaughey, Chem. Mater. 2017, 29, 4874−4884.
14. N. Zhang, F. Cheng, Y. Liu, Q. Zhao, K. Lei, C. Chen, X. Liu, J. Chen, J. Am. Chem. Soc.
2016, 138, 12894−12901.
15. B. Jiang, C. Xu, C. Wu, L. Dong, J. Li, F. Kang, Electrochim. Acta 2017, 229, 422−428.
16. J. Hao, J. Mou, J. Zhang, L. Dong, W. Liu, C. Xu, F. Kang, Electrochim. Acta 2018, 259,
170−178.
17. Z. Jia, B. Wang, Y. Wang, Mater. Chem. Phys. 2015, 149−150, 601−606.
18. P. Senguttuvan, S. D. Han, S. Kim, A. L. Lipson, S. Tepavcevic, T. T. Fister, I. D. Bloom, A.
K. Burrell, C. S. Johnson, Adv. Energy Mater. 2016, 6, 1600826.
19. J. Zhou, L. Shan, Z. Wu, X. Guo, G. Fang, S. Liang, Chem. Commun. 2018, 54, 4457−4460.
20. M. H. Alfaruqi, V. Mathew, J. Song, S. Kim, S. Islam, D. T. Pham, J. Jo, S. Kim, J. P.
Baboo, Z. Xiu, K.-S. Lee, Y.-K. Sun, J. Kim, Chem. Mater. 2017, 29, 1684−1694.
21. Y. Cai, F. Liu, Z. Luo, G. Fang, J. Zhou, A. Pan, S. Liang, Energy Storage Mater. 2018, 13,
168−174.
22. B. Sambandam, V. Soundharrajan, S. Kim, M. H. Alfaruqi, J. Jo, S. Kim, V. Mathew, Y.-K.
Sun, J. Kim, J. Mater. Chem. A 2018, 6, 3850−3856.
23. V. Soundharrajan, B. Sambandam, S. Kim, M. H. Alfaruqi, D. Y. Putro, J. Jo, S. Kim, V.
Mathew, Y.-K. Sun, J. Kim, Nano Lett. 2018, 18, 2402−2410.
24. B. Sambandam, V. Soundharrajan, S. Kim, M. H. Alfaruqi, J. Jo, S. Kim, V. Mathew, Y.-K.
Sun, J. Kim, J. Mater. Chem. A 2018, 6, 15530− 15539.
25. B. Tang, G. Fang, J. Zhou, L. Wang, Y. Lei, C. Wang, T. Lin, Y. Tang, S. Liang, Nano
Energy 2018, 51, 579−587.
26. J. H. Jo, Y.-K. Sun, S.-T. Myung J. Mater. Chem. A 2017, 5, 8367−8375.
27. P. He, M. Yan, G. Zhang, R. Sun, L. Chen, Q. An, L. Mai, Adv. Energy Mater. 2017, 7,
1601920.
28. Y. Cheng, L. Luo, L. Zhong, J. Chen, B. Li, W. Wang, S. X. Mao, C. Wang, V. L. Sprenkle,;
G. Li, J. Liu, ACS Appl. Mater. Interfaces 2016, 8, 13673−13677.
29. Q. Zhao, W. Huang, Z. Luo, L. Liu, Y. Lu, Y. Li, L. Li, J. Hu, H. Ma, J. Chen, Sci. Adv.
2018, 4, eaao1761.
S40
30. D. Kundu, P. Oberholzer, C. Glaros, A. Bouzid, E. Tervoort, A. Pasquarello, M.
Niederberger, Chem. Mater. 2018, 30, 3874−3881
31. S. Zhang, N. Yu, S. Zeng, S. Zhou, M. Chen, J. Di, Q. Li, J. Mater. Chem. A 2018, 6,
12237−12243.
32. L. Ma, S. Chen, H. Li, Z. Ruan, Z. Tang, Z. Liu, Z. Wang, Y. Huang, Z. Pei, J. A. Zapien, C.
Zhi, Energy Environ. Sci. 2018, 11, 2521.
33. C. Pan, R. Zhang, R. G. Nuzzo, A. A. Gewirth, Adv. Energy Mater. 2018, 8, 1800589.
34. H.-Y. Shi, Y.-J. Ye, K. Liu, Y. Song, X. Sun, Angew.Chem.Int.Ed. 2018, 57, 16359–16363.


![Homi Bhabha - o Local Da Cultura [Livro]](https://static.fdocuments.in/doc/165x107/54e014d64a7959f2388b4730/homi-bhabha-o-local-da-cultura-livro.jpg)