ZIMRE HOLDINGS LIMITE 2020 ANNUAL REPORT
162
Transcript of ZIMRE HOLDINGS LIMITE 2020 ANNUAL REPORT

2
ZIMRE HOLDINGS LIMITED 2020 ANNUAL REPORT
Corporate Information 4
Zimre Holdings Limited (ZHL) Group Profile 5
Chairman’s Statement 6
Group CEO’s Review of Operations 10
ZHL Team 13
Corporate Governance Statement and Managment Approach 14
Directors’ Report 18
Directors’ Responsibility Statement 20
Declaration by Group Finance Executive 20
Independent Auditor’s Report 22
Group Statement of Financial Position 30
Group Statement of Comprehensive Income 32
Group Statement of Changes in Equity 34
Group Statement of Cash Flows 36
Company Statement of Financial Position 39
Company Statement of Comprehensive Income 40
Company Statement of Changes in Equity 41
Company Statement of Cash Flows 43
Notes to the Financial Statements 44
Shareholders Analysis 158
Notice of AGM 159
Proxy Form 160
CONTENTS

3
ZIMRE HOLDINGS LIMITED 2020 ANNUAL REPORT

4
ZIMRE HOLDINGS LIMITED 2020 ANNUAL REPORT
CORPORATE INFORMATION
DIRECTORSBenjamin N Kumalo (Chairperson)Mark HakenJean MaguranyangaDesmond Matete (appointed 12 April 2021)Ignatius MvereHamish BW RudlandCron von SeidelEdwin ZvandasaraStanley Kudenga (Group Chief Executive)
SECRETARY
Ruvimbo Chidora
REGISTERED OFFICE2nd Floor, Block DSmatsatsa Office ParkBorrowdaleHarare.Tel: +263 (242) 870 762-8Email: [email protected]: www. zhl.co.zw
TRANSFER SECRETARIESZB Transfer Secretaries (Private) Limited21 Natal Road,Avondale, Harare.
LEGAL ADVISORSWintertons Legal PractitionersBeverly Court,11 Selous Avenue,Harare.
Mhishi Nkomo Legal Practice86 McChlery Avenue,Eastlea, Harare.
INDEPENDENT AUDITORSPricewaterhouseCoopers Chartered Accountants (Zimbabwe)Building 4, Arundel Office Park, Norfolk Road, Mount Pleasant, Harare.
PRINCIPAL BANKERSNMB Bank LimitedAngwa City BranchHarare.
National Building SocietySocial Security Centre, 77 Park Lane, Harare.
5
ZIMRE HOLDINGS LIMITED 2020 ANNUAL REPORT
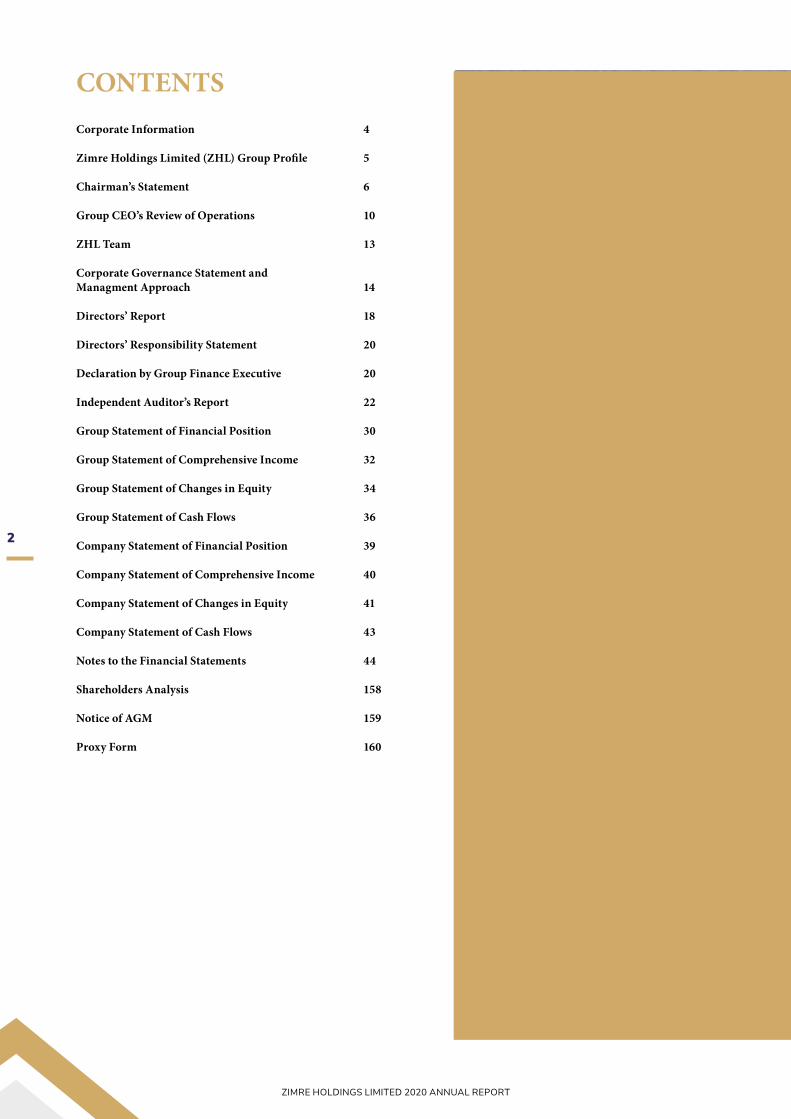
WELCOME TO ZHLA diversified investment holding company with a focus on identifying
quality investments and unlocking potential, to achieve sustainable shareholder profits.
ZimbabweLeo T Huvaya
Managing DirectorBsc – Eco (Hons) (UZ), ACII
Botswana
Patience Mashaire MarwiroManaging Director
MBA, BA – Admin, Bsc (Hons), ACII, FIISA
Malawi Christopher Mukwindidza
Managing DirectorBBS (Hons) –UZ, MBA (UZ),
ACII (SA)
MozambiqueMufaro Chauruka
Managing Director BBS (Hons) –UZ, MBA (UZ),
FIISA
ZambiaWebster Chigwende
Managing Director Msc Strategic Planning, MBA,
BCom – Insurance and RiskManagement (Hons), ACII (UK)
Edson MuvingiManaging DirectorMBL (UNISA), BBS (UZ), AIISA, FIISA
Reuben JavaChief Executive Officer
BSc Mathematics (Hons) UZ, MBA (UCT), IFoA
Calven MutyavaviriManaging DirectorMBL (UNISA), BBS (UZ), AIISA, FIISA
Also included in the ZHL Group are the following key investments and associates:-
Everyday your life home and assets are protected
Zimbabwe Regional
Chakanyuka C. Nziradzemhuka
Managing DirectorHBS (Finance &
Banking) (UZ), MSc Finance and Investment
(NUST), Exec MBA (NUST), MIFM (SA
Institute of Financial Markets)

6
ZIMRE HOLDINGS LIMITED 2020 ANNUAL REPORT

7
ZIMRE HOLDINGS LIMITED 2020 ANNUAL REPORT
CHAIRMAN’S STATEMENT FOR THE YEAR ENDED 31 DECEMBER 2020
IntroductionI am pleased to present the financial results of Zimre Holdings Limited (“ZHL”) and its subsidiaries and associates (together the “Group”) for the year ended 31 December 2020. The year 2020 experienced the unprecedented shock of the Coronavirus (“COVID-19”) global pandemic outbreak that led to the massive disruption of economic activity which in turn led to the contraction of the global economy by a record 3.3% according to the International Monetary Fund (“IMF”).
Directors responsibilityThe Directors of ZHL are responsible for the preparation and presentation of the Group’s consolidated financial statements. The financial statements have been prepared in accordance with International Financial Reporting Standards (“IFRS”), except for non-compliance with International Accounting Standard (“IAS”)21, ‘The Effects of changes in foreign exchange rates’ and consequently IAS 29, ‘Financial reporting in hyper-inflationary economies’. Notwithstanding, the financial statements comply with the Companies and Other Business Entities Act (Chapter 24:31) and the Zimbabwe Stock Exchange (“ZSE”) Listing Requirements. There were no changes to the principal accounting policies of the Group compared to those applied in the previous year.
Independent auditor’s statementThe Group annual financial statements have been audited by PricewaterhouseCoopers Chartered Accountants (Zimbabwe) who have issued an adverse opinion on the basis of non-compliance with IAS 21, ‘The Effects of changes in foreign exchange rates’, IAS 29 ‘Financial reporting in hyper-inflationary economies’ and property valuations. The generic adverse opinion has been issued on all market players.
Compliance with International Accounting Standard 29, ‘Financial reporting in hyper-inflationary economies’In line with the pronouncement of the Public Auditors and Accountants Board (“PAAB”) that Zimbabwe is a hyper-inflationary economy, the Groups financial statements have been restated using the consumer price index (“CPI”). Non-monetary assets and liabilities carried at historical cost have been restated to reflect the change in the general price index. Monetary assets and liabilities and non-monetary assets and liabilities carried at revalued amounts have not been restated as they are presented at the measuring unit current at the end of the period. Items recognised in the statement of comprehensive income have been restated by applying the changes in the general price index on the dates the transactions were initially earned or incurred. A net monetary adjustment was recognised in the statement of comprehensive income.
All items in the statement of cash flows are expressed in terms of the general price index at the end of the reporting period. Comparative amounts in the Groups financial results have been adjusted to reflect the change in the general price index. Financial results prepared under the historical cost convention have been presented as supplementary information.
Business environmentZimbabweThe economy contracted by 8.0% (“IMF”) in 2020 which was
attributed to the onset of the coronavirus pandemic and the resultant lockdowns and disruption to economic activity, as well
as the successive years of drought. However, there was growing optimism in business circles towards year end following signs
of economic stability emanating from the return of the multi-currency regime, the introduction of the currency
auction system on 23 June 2020 which brought about general exchange rate stability, declining trend in
inflation and stability in prices as well as the onset of the above normal rainy season. Headwinds
to full economic recovery and stability still remain, emanating from the hyper-inflationary environment, the power shortages putting a strain on capacity utilisation in industry, foreign currency supply constraints, subdued aggregate demand and consumer spending as well as the debt overhang and strained international relations.
BotswanaThe outbreak of the COVID-19 pandemic, the severe droughts and the volatility of the international diamond markets exposed the limitations of an undiversified economy leading to a contraction of 8.3% in 2020. However, growth is anticipated in 2021 on account of revival in the diamond, agricultural and tourism industries.
MalawiWith an undiversified economy which is largely dependent on agriculture, Malawi experienced significant challenges in 2020 exacerbated by the outbreak of the COVID-19 pandemic. The existence of a large informal sector, weakening domestic demand and lack of adequate fiscal space to respond to the challenges, coupled with weak global conditions resulted in the country’s economy growing by a marginal 0.6% in 2020. The economy is expected to rebound in 2021 on account of an anticipated good agricultural season.
ZambiaThe outbreak of the COVID-19 pandemic, depressed commodity markets for copper, increasing external debt servicing costs, a depreciating currency (44% in 2020), falling exports, domestic inflationary pressures and declining capital inflows, all worsened the country’s macroeconomic conditions. As a result, the economy contracted by 3.5% in 2020.
MozambiqueThe economy contracted by 0.5% in 2020 on account of the outbreak of the COVID-19 pandemic, the occurrence of natural disasters and the disruptions associated with the deteriorating security situation in the north of the country. Coronavirus linked travel restrictions impacted negatively on the tourism sector. Real GDP is expected to grow modestly in 2021 as coal output increases and major liquefied natural gas projects come on stream. Growth in exports and inward investment is also expected to drive economic growth in 2021.
Market overviewThe outbreak of the COVID-19 pandemic forced the Group to invest in and accelerate the digitalisation strategy, improve customer supply chains, augment existing internal and external communication as physical interactions were restricted. Effective customer and other stakeholder engagements were implemented through optimisation of technology. Business continuity plans implemented during the lockdowns ensured the continuous flow of business in all operating units. Demand for insurance and rental space remained buoyant notwithstanding trends in the rationalisation of space by tenants as most business was conducted from home during the lockdowns. There was a slowdown in property sales and increased pressure on occupancies on leased premises. The onset of hyperinflation in Zimbabwe resulted in the need to constantly review sums insured by policyholders and a spike in the cost of insurance claims and operating costs. The tight liquidity situation in Zimbabwe slowed down premium and rental collection thereby impacting investment portfolio growth.
Overall Group performanceDespite the onset of the COVID-19 pandemic which brought about severe interruptions to economic activity, the Group achieved modest growth and profitability in business underpinned by strong performance in the Botswana and Mozambique operations. The regional diversification strategy became handy as the impact of the outbreak of the COVID-19 pandemic on Group performance was less severe as different fiscal and monetary interventions in each country where the Group operates were implemented to mitigate the effects of the pandemic.

8
ZIMRE HOLDINGS LIMITED 2020 ANNUAL REPORT
CHAIRMAN’S STATEMENT FOR THE YEAR ENDED 31 DECEMBER 2020 (continued)
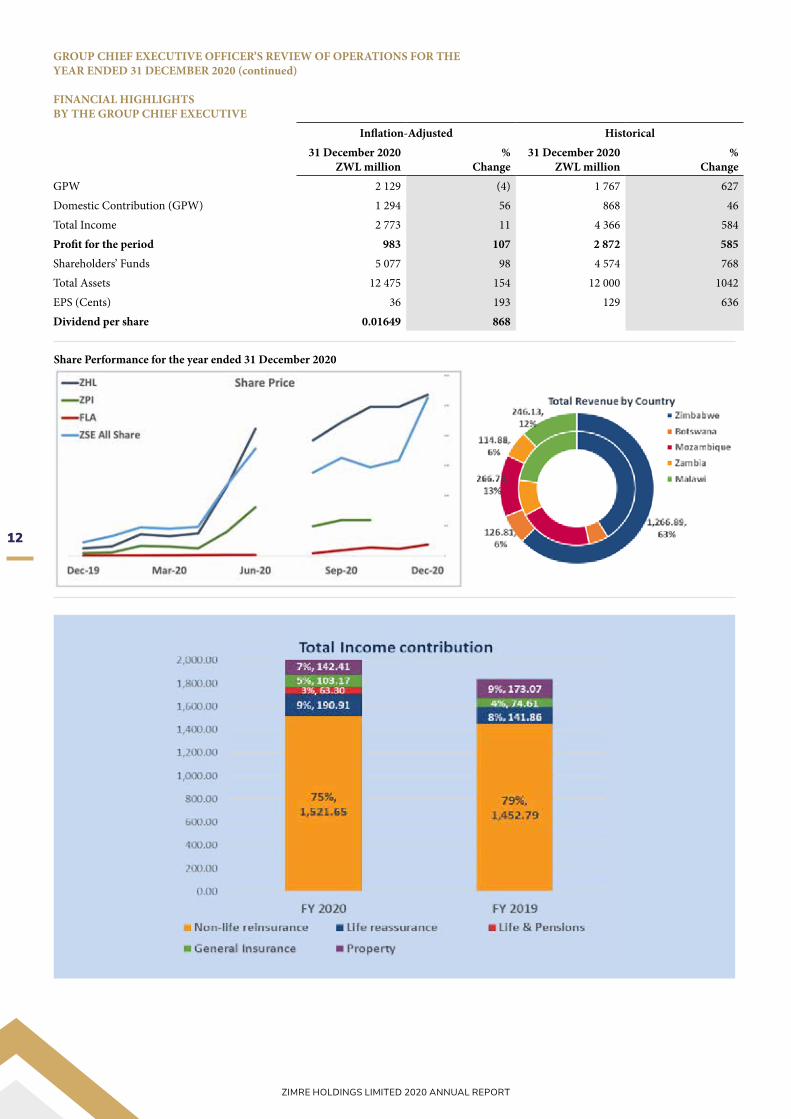
Statement of comprehensive incomeTotal incomeIn inflation-adjusted terms, total income at ZWL2.8 billion grew by 11% over the ZWL2.5 billion achieved in the same period in 2019. On a historical cost basis, total income increased by 584% from ZWL0.6 billion in 2019 to ZWL4.4 billion in 2020. The increase was mainly driven by the strong top-line growth in premium income in Botswana and Mozambique as the units consolidated their respective market positions, the growth in rental income with the coming on stream of property space with high rental yield and the upward reviews of rentals as well as property revaluation gains following the change of functional currency. The regional operations contributed 57% in GPW in 2020 compared to 64% in 2019. The contribution mix is underpinned by the clawback in the Zimbabwean operations and the continued beneficial hedging effects of the regional operations.
Total claims and expensesOn an inflation-adjusted basis, total claims and expenses declined by 27% from ZWL1.9 billion in 2019 when compared to the ZWL1.4 billion registered in 2020. The decrease was driven by an overall decline in operating expenses, acquisition costs and claims. In historical cost terms, there was an overall increase in claims and expenses due to exchange rate driven inflationary pressures experienced in the domestic economy. Management remains committed to keeping operating costs and technical expenses under control and in line with revenue growth.
Profit for the yearThe Group sustained growth in profitability in inflation-adjusted terms, registering an increase of 107% in profit for the year from the ZWL0.5 billion registered in 2019 to ZWL0.9 billion in 2020. In historical cost terms profit for the year increased by 578% from ZWL0.4 billion in 2019 to ZWL2.9 billion in 2020 on account of the strong top-line business growth in some business units and the investment portfolio fair valuations following the change of the functional currency in Zimbabwe.
Total comprehensive incomeIn inflation-adjusted terms total comprehensive income was ZWL1.4 billion against ZWL1.3 billion in 2019. On a historical cost basis it was ZWL3.9 billion against ZWL0.6 billion in 2019 and was attributed to exchange rate differences on translation of foreign operations, fair value gains on financial assets and gains on property and equipment revaluations.
Statement of financial positionTotal assetsTotal assets grew by 154% in inflation-adjusted terms from ZWL4.9 billion (ZWL1.1 billion in historical cost basis) in 2019 to ZWL12.5 billion (ZWL12 billion in historical cost terms) in 2020. The Group’s financial position remained sound mainly due to the revaluation of investment properties and other non-monetary assets.
Shareholders’ equityAt ZWL5.1 billion as at 31 December 2020 in inflation-adjusted terms, shareholders’ equity grew by 98% from ZWL2.6 billion in 2019. In historical cost terms, shareholders’ equity was at ZWL4.6 billion compared to ZWL0.5 billion as at 31 December 2019. The 768% increase was attributed to the profitability recorded by the Group.
Cash flowPositive cash flows were generated from most operations mainly due to the strong business growth momentum achieved, leasing of space to quality tenants, implementation of premium warranty policies in certain markets and strengthening of the effects of moderate improvements in credit control functions in most business units. Overall, the Group generated cash of ZWL 4.8 billion from operations which was 336% up from the comparative period in 2019.
Key developments and milestonesThe delisting of Zimre Property Investments Limited (“ZPI”) with effect from 10 November 2020, was completed when ZHL had achieved a
100% shareholding in the company as the Group sought to consolidate its operations, strengthen the balance sheet and streamline operational costs in the face of mounting economic challenges. Fidelity Life Assurance of Zimbabwe Limited (“FLA”) became a subsidiary of ZHL with effect from 4 December 2020 following the successful acquisition of a 67% equity stake in the business.
Impact of COVID-19 outbreakStrict lockdown measures introduced towards the end of March 2020 were gradually relaxed in the course of the year. However, the infection rate rose sharply across the region in December 2020 resulting in the imposition of stricter lockdown measures in January 2021 which resulted in further disruption and reduction in business activity. However, the Group’s business units continued operating with minimum interruption due to the business continuity plans put in place following the first lockdown. The Group continues to observe the Ministry of Health and Child Welfare and World Health Organization (“WHO”) guidelines to ensure the safety of employees and stakeholders. The Group’s businesses remain resilient in the face of the risks posed by the pandemic and the impact of the virus on the financial health of the Group is expected to be minimum.
DirectorateDuring the year under review, there were no changes to the ZHL Board of Directors. However, on 12th April 2021, Mr. Desmond Matete was appointed to the Board of Directors.
DividendIn line with the Company’s dividend policy and after careful consideration of the Company’s level of profitability and reserves, the national lockdowns as a result of the Coronavirus outbreak and associated risks to business growth, the Directors have found it prudent to declare a dividend of ZWL30 million, which despite being below the Company’s expected dividend policy of two and half times cover, is a result of the Directors’ recognition of the need for frequent dividend distributions particularly in the prevailing domestic economic environment. The Dividend Notice was published on the 28th of June 2021 in accordance with the Company’s Articles of Association and the Zimbabwe Stock Exchange Listing Requirements.
Outlook and strategy2021 is expected to be another challenging year given the worldwide resurgence of COVID-19 cases and the emergence of new variants. The roll out of vaccines is expected to assist in containing the spread and to mitigate the negative effects of the virus on economic activity. The above normal rainfall season in the region is expected to boost the recovery of the agricultural sector, downstream industries, and food security in support of overall economic growth. Different fiscal and monetary interventions being implemented by governments in each country to stimulate recovery will also assist economic expansion in the Southern African Development Community (“SADC”). The IMF is projecting a 3.1% GDP growth in Zimbabwe in 2021 driven by a rebound in agriculture and mining activities. Key business growth strategies will be underpinned by strong cash generation in the business units, customer focus and effective change management. The restoration of heartland investments in property and long-term insurance sectors, extracting value from synergies and ensuring sustainable re-rating of ZHL and creating value for shareholders, are on course to be achieved. Diversifying revenue streams and pursuing opportunities for mergers and acquisitions in order to grow the business portfolio leveraging on the enhanced balance sheet are being implemented.
AppreciationI would like to thank our directors throughout the Group, staff, business partners and other stakeholders who contributed to the achievement of these results.
B. N. KumaloCHAIRMAN30 June, 2021

9
ZIMRE HOLDINGS LIMITED 2020 ANNUAL REPORT

10
ZIMRE HOLDINGS LIMITED 2020 ANNUAL REPORT
GROUP CHIEF EXECUTIVE OFFICER’S REVIEW OF OPERATIONS FOR THEYEAR ENDED 31 DECEMBER 2020The Zimre Holdings Limited (“ZHL”) Group had a successful trading year registering all round positive performance and preserved value for stakeholders despite the unprecedented challenges arising from the COVID-19 pandemic outbreak. During the year under review, the Group completed the acquisition of a 100% equity stake in Zimre Property Investments Limited (“ZPI”) and a controlling interest in Fidelity Life Assurance of Zimbabwe Limited (“FLA”). The completion of the transactions marked the consummation of the Group strategy of rebuilding heartland investments, pursuing portfolio diversification and upscaling resource mobilisation initiatives. The Group is now taking steps to restructure and remodel the business portfolio. The Group business portfolio composition now consists of the following: -
BUSINESS ENVIRONMENTThe business environment in Zimbabwe and the SADC region in which the Group operates was severely impacted by the COVID-19 pandemic which caused disruption to economic activity, supply chains, international trade and curtailed aggregate demand resulting in an average contraction in GDP of about 4%. However, the easing of restrictions and reopening of economies in the second half of 2020, fiscal and monetary policies implemented by Governments to revive economic activity, as well as the roll out of vaccinations, resulted in early signs of economic recovery in these countries. In Zimbabwe, the pandemic exacerbated an already precarious and difficult operating environment characterised by hyperinflation, a largely informal economy, poor health delivery system, currency volatility, power shortages, increasing international isolation, and debt arrears resulting in an economic contraction of -8.0% (IMF) in 2020. The Zimbabwe Government launched the National Development Strategy 1 (“NDS1”), the successor economic blueprint to the Transitional Stabilisation Plan (“TSP”) which expressed the Government’s commitment for broad based macro-economic transformation and laying out the building blocks for the country to attain Middle Income Status by 2030.
CORE INVESTMENTS KEY ASSOCIATES KEY INVESTMENTS
Reinsurance
Short Term Insurance
Life and Pensions
Property
Investment Banking
Short term Insurance
Agro-Industrial
Short term Insurance

11
ZIMRE HOLDINGS LIMITED 2020 ANNUAL REPORT
GROUP CHIEF EXECUTIVE OFFICER’S REVIEW OF OPERATIONS FOR THEYEAR ENDED 31 DECEMBER 2020 (continued)
KEY MARKET INDICATORS AND IMPACT ON GROUP BUSINESSESThe Group remained resilient and implemented business continuity plans which enabled it to maintain its operations, deliver services and products to customers whilst safeguarding the safety and health of both employees and other stakeholders. In most jurisdictions where the Group operates, the Insurance Sector was designated as an essential service and exempted from some of the lockdown measures and hence operations continued amidst strict adherence to health and safety protocols. The COVID-19 pandemic outbreak accelerated the digitalization and automation strategy requiring ongoing retraining, reskilling, reallocations, working from home and employee rationalisations. It is impractical at this stage to quantify the potential financial impact of COVID-19 on the Group’s current and future operations and cashflows. Nevertheless, the Group continues to monitor the situation as the pandemic evolves and take appropriate action to minimize the effects on performance and financial position.In Zimbabwe, low disposable incomes and COVID-19 induced lockdowns meant reduced demand for services such as insurance and letting space while inflation continued to push up premiums and rentals. Interest rates remained high as government tried to curtail speculative borrowing for arbitrage opportunities in the economy. This coupled with limited availability of long term and concessionary funding, impacted negatively on property development initiatives. The reintroduction of the multi-currency system during the year increased pressure on businesses to pay creditors, suppliers, shareholder dividends and staff in United States Dollars(US$). However, a welcome development for the insurance and property sectors in Zimbabwe was the flexibility provided to reintroduce US$ denominated insurance policies and lease contracts. The Auction System introduced in June 2020 brought about stability in the foreign exchange market although convergence with the unofficial rate remained elusive. This had a negative impact on claims costs and operating expenses which tracked the unofficial rate. Constraints in the supply of foreign exchange on the official foreign exchange market still meant limitations in discharging foreign obligations including retrocession costs, legacy debts, and claims. The Group reinsurance operations intensified the thrust to build the external claims fund in order to enhance customer confidence. The external claims fund had grown to US$1.5 million by year end.
OVERALL GROUP PERFORMANCEAlthough economic headwinds in most jurisdictions where the Group operates exacerbated the decline in aggregate demand, the Group recorded commendable business growth, positive cashflows generated from operations and operating profitability. This was attributed to the overall business growth momentum started in the first quarter of the year before the outbreak of the COVID-19 pandemic and business continuity plans implemented during the lockdowns. The positive performance was driven by strong business growth in Botswana and Mozambique and signs of recovery of performance in Zambia resulting in a 56% growth in insurance revenue in historical cost terms. The property portfolio reconfiguration strategy to create high value rental space and revenue from sale of inventory property, also contributed to the commendable performance of the Group. The existence of a hyper-inflationary environment in Zimbabwe pushed up claims and operating expenses. The sustained cost control and containment strategy throughout the Group also assisted the Group to achieve profitability.
OUTLOOKDespite the challenges posed by the COVID-19 pandemic and the emergence of new variants of the virus, economies in the region are expected to recover at diferent paces on the back of the anticipated increase in the roll out of vaccines, government economic policy interventions and the good agricultural season. Predictions for the 2021 GDP growth are pointing to a strong recovery and an average 3.1% growth for the five countries in which the Group has operations. However, the volatile and escalating military conflict in northern Mozambique and suspension of the implementation of the multi-billion gas projects is expected to delay production timelines thereby dampening economic growth prospects in that country.Key business strategies being implemented include:- • the implementation of the Group’s growth triangle comprising of cash generation, customer focus and change management leading to
stakeholder value creation. • the reorganisation of the fragmented operating and support staff functions to create operational efficiency and optimise costs. • the restoration of heartland investments in property and long-term insurance are being consolidated through the ZPI delink and provision of
strategic direction to Fidelity Life Assurance to enhance performance. • the capacitation of reinsurance operations through structured internal resources, strategic partnerships, and consolidations to eliminate
duplicated business structures thereby enhancing capital adequacy. • restructuring of the property business.• cost control.• technology optimisation.• brand visibility• effective leveraging on synergies.• increasing regional footprint. • leveraging on the consolidated balance sheet to create new revenue streams.• implementing mergers and acquisition.
I wish to extend my and the Board’s gratitude to the ZHL Group employees who despite the challenges of 2020, have enabled the Group to report positive results and continue to build shareholder value.
S. KudengaGROUP CHIEF EXECUTIVE OFFICER30 June, 2021
12
ZIMRE HOLDINGS LIMITED 2020 ANNUAL REPORT
GROUP CHIEF EXECUTIVE OFFICER’S REVIEW OF OPERATIONS FOR THEYEAR ENDED 31 DECEMBER 2020 (continued)
FINANCIAL HIGHLIGHTS BY THE GROUP CHIEF EXECUTIVE
Inflation-Adjusted Historical31 December 2020
ZWL million%
Change31 December 2020
ZWL million%
ChangeGPW 2 129 (4) 1 767 627Domestic Contribution (GPW) 1 294 56 868 46Total Income 2 773 11 4 366 584Profit for the period 983 107 2 872 585Shareholders’ Funds 5 077 98 4 574 768Total Assets 12 475 154 12 000 1042EPS (Cents) 36 193 129 636Dividend per share 0.01649 868
Share Performance for the year ended 31 December 2020

13
ZIMRE HOLDINGS LIMITED 2020 ANNUAL REPORT
A GREAT TEAM FOR EVEN GREATER SUCCESS
Stanley Kudenga Group Chief Executive Officer
CA(Z), MBL (UNISA)
Lovemore MadzingaFinance Executive
BAcc (Hons) (UZ), FCCA, ACIS, MA Leadership and Management (UZ)
Ruvimbo Chidora Group Legal Executive/Company
Secretary LLB Law and Business Studies
Chakanyuka Crawford Nziradzemhuka Group Corporate Finance and
Strategy ExecutiveHBS (Finance & Banking) (UZ), MSc Finance and Investment (NUST), Exec MBA (NUST),
MIFM (SA Institute of Financial Markets)
Lovemore Madzinga, Ruvimbo Chidora, Chakanyuka C. Nziradzemhuka, Stanley Kudenga

14
ZIMRE HOLDINGS LIMITED 2020 ANNUAL REPORT
CORPORATE GOVERNANCE AND MANAGEMENT APPROACHIntroductionThe ZHL Group recognises that the expectations of shareholders and stakeholders extends beyond the financial bottom line. Balancing the interests of both shareholders and all other stakeholders continues to be a priority for the ZHL Group to sustain the credibility of the Group’s long-term strategy. As such, ZHL continues to monitor and evaluate its corporate culture in accordance with the principles of good corporate governance and global best practices. Our corporate governance values of transparency, integrity and accountability ensure we observe ethical practices to our people, the environment and shareholders.
ZHL’s Commitment to Environmental Social and Governance Regulations (ESG)Environment Since 2018, ZHL has been on a drive to adopt environmentally friendly practices. This began with an energy audit of its Borrowdale Offices to optimise its usage of electricity relative to solar energy. Accordingly, the Company has been steadily building up its solar capacity with the intention to move off the already strained national grid. In a further effort to reduce the Group’s environmental footprint, the Group has moved away from physical to electronic Board packs. The move has brought efficiency to the distribution of Board packs and in turn the Board’s ability to exercises its fiduciary duties.
Social The Coronavirus pandemic (“COVID-19”) hit the shores of Africa in 2020 resulting in multiple national lockdowns within the countries in which the Group operates. An introspective look at the Group’s social practices was undertaken for the well-being and safety of the Group’s most valuable resource, its people. In addition to introducing remote working systems and provision of Personal Protective Equipment (“PPE”), the Group took this opportunity to look into its employees’ welfare and worked towards developing a work/life balance as the boundaries of people’s homes and the workplace had become blurred. Also key during this period, was maintaining the Group’s budget and performance targets. The Group was able to maintain its staff complement without any retrenchments. In addition to the above, the units within the Group donated PPE and water to the various vulnerable groups within the communities they operate.
Governance The ZHL Group aligns itself with the Companies and Other Business Entities Act [Chapter 23:31] as read with the National Code on Corporate Governance of Zimbabwe, the Zimbabwe Stock Exchange Listing Requirements and the King Code as amended from time to time. Such alignment provides shareholders and stakeholders with the assurance that the Group is not only sustaining business prosperity but preserving the future.
Communication with Shareholders and StakeholdersIn 2020, the ZHL Group introduced a new communication plan which sought to align capital market investor perceptions to the Group’s intrinsic value. This has been achieved through the traditional Annual General Meetings, (“AGM”s), notices and announcements in the press, interim and annual reports, bi-annual analyst briefings and quarterly trading updates. The introduction of road-shows hosted by the Board and/or Executive Management via virtual media has informalised the Group’s engagement with its diverse shareholder and stakeholder community and fostered direct and continuous dialogue geared towards the success of the Group in a mutually beneficial manner. In addition to the above, shareholders and the general public are welcome to direct any communication through its Company Secretary or the Transfer Secretaries.

15
ZIMRE HOLDINGS LIMITED 2020 ANNUAL REPORT
CORPORATE GOVERNANCE AND MANAGEMENT APPROACH (continued)Declaration of Directors’ and Employee InterestsThe ZHL Board and management subscribes to the motto of “say it, do it, coach it, live it!”. Accordingly, the Closed Period being the forty-five (45) days post a Company’s financial quarter during which Directors as well as employees may not deal in the shares of the Company, is closely observed and monitored. The Company Secretary circulates a memo at the beginning and end of the closed period to inform both Directors and employees of the prohibition to trade in the shares of the Company. During the year under review no Directors or employees acquired any material interests which could cause significant conflict of interest with the Group’s objectives. The beneficial interests of the Directors and their families in the shares of ZHL are presented on page 19 In addition to the prohibition to trade during a Closed Period, the Directors and employees of the ZHL Group may not deal directly or indirectly in the shares of ZHL or its listed subsidiaries during a period when they are aware of any information, negotiations or details which may affect the share price.
The ZHL BoardThe ZHL Board is responsible for discharging the fiduciary duties to the Company and its stakeholders. This includes: -• setting the Group’s strategy and corporate culture;• aligning its subsidiaries to the Group vision, business objectives and strategic direction;• coordinating and supervising the operating entities;• implementing an efficient risk management system;• overseeing that appropriate internal controls are in place and being observed;• Managing shareholder and stakeholder relations, and• Overseeing the preparation of interim and annual financial statements of the Group and ZHL as an entity.
The Board meets quarterly to provide input and oversight to the strategic planning process of the ZHL Group while also monitoring operational performance. The ZHL Group has adopted several practices to define, regulate and ensure division of responsibilities between the Board and Management namely: -• majority non-executive directors on the Board;• an independent Chairperson;• the Chairperson and the Chief Executive Officer must be separate;• strive for majority independence among directors and committee chairpersons;• endeavour to build a diversified Board and Management in terms of skill, experience, race, gender, age etc.; and• delegate according to skill and qualification sub Board sub-committees.
Professional AdviceThe Board has unrestricted access to the advice and services of the Company Secretary and when justifiable, any independent professional.
Board of DirectorsFollowing, the appointment of Mr. Desmond Matete on 12 April 2021, the ZHL Board comprises eight (8) non-executive Directors, among whom is an elected independent chairperson and one executive Director. The Group maintains a majority of non-executive Directors to draw critical independent insight to its strategic decision-making process and corporate governance practices. The Board is also made up of individuals with proven track records and a wide range of skills and experience which they employ to the benefit of the Group. The Directors are assigned to committees according their respective strengths and capacities.
Board CommitteesAudit and Risk Management CommitteeEdwin Zvandasara (Chairperson), Mark Haken, Jean Maguranyanga, Ignatius Mvere, Stanley Kudenga (by invitation)
Key Responsibilities• Initial review of the annual consolidated financial statements, management and risk reports, dividend proposal, review of half-yearly reports
or, where applicable, quarterly financial reports or statements.• Monitoring of the financial reporting process, the effectiveness of the internal controls and audit systems, legal and compliance issues.• Monitoring of the audit procedures, including the independence of the independent auditor and the services additionally rendered, awarding
of the audit contract and determining the focal points of the audit. • The Committee has unrestricted access to the internal and independent auditors.• Monitoring of the general risk situations and special risk developments within the ZHL Group as well as monitoring the effectiveness of the
risk management system.
Finance and Investments CommitteeHamish BW Rudland (Chairperson), Ignatius Mvere, Cron von Seidel, Stanley Kudenga (ex officio)
Key Responsibilities• Formulation, implementation and review of the capital and liquidity planning for the Group and ZHL.• Providing guidelines for currency management, Group financing and internal Group capital management, as well as establishing and
overseeing a Group-wide risk management and monitoring system including dynamic stress tests.• Implementing the Group investment strategy, including monitoring Group-wide investment activities as well as approving investment related
frameworks and guidelines and individual investments within certain thresholds.
16
ZIMRE HOLDINGS LIMITED 2020 ANNUAL REPORT
CORPORATE GOVERNANCE AND MANAGEMENT APPROACH (continued)Human Resources and Nominations CommitteeBenjamin N Kumalo (Chairperson), Jean Maguranyanga, Ignatius Mvere, Hamish BW Rudland, Stanley Kudenga (by invitation)
Key Responsibilities• Undertakes the selection of executive management, concludes, amends, and when necessary terminates executive management contracts.• Prepares the compensation system for the Group and the overall compensation of the ZHL Board and executive management.• Prepares the staff development plan as well as the long-term succession planning for executive management and Board.• Sets concrete objectives for the composition of the Board including the establishment of selection criteria for shareholder representatives in
compliance with prevailing codes and legislation.• Selection of suitable candidates for election to the Board.
Remuneration of DirectorsThe Human Resources and Nominations Committee determines the remuneration packages for the non-executive and executive Directors of ZHL. The remuneration packages for non-executive Directors are available for inspection on request at the Company’s Registered Office. The executive packages include a guaranteed salary as well as a performance bonus, linked to the achievement of pre-set targets which takes into account the needs of the Company from time to time. Effective 2021, the ZHL Group seeks to introduce a Share Appreciation Scheme. The scheme is designed to focus employee attention and merge their goals to the Group strategic goals, ensure sustained growth of the Group and retaining employees.
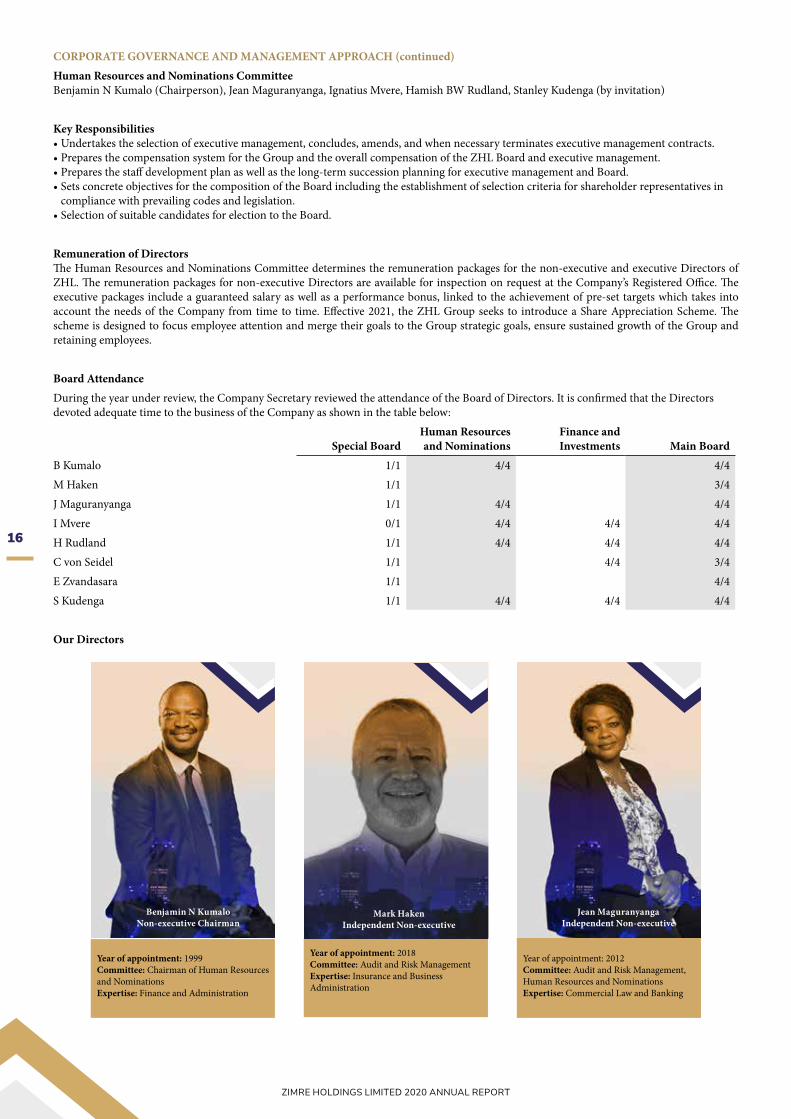
Board AttendanceDuring the year under review, the Company Secretary reviewed the attendance of the Board of Directors. It is confirmed that the Directors devoted adequate time to the business of the Company as shown in the table below:
Special BoardHuman Resources and Nominations
Finance and Investments Main Board
B Kumalo 1/1 4/4 4/4M Haken 1/1 3/4J Maguranyanga 1/1 4/4 4/4I Mvere 0/1 4/4 4/4 4/4H Rudland 1/1 4/4 4/4 4/4C von Seidel 1/1 4/4 3/4E Zvandasara 1/1 4/4S Kudenga 1/1 4/4 4/4 4/4
Our Directors
Benjamin N KumaloNon-executive Chairman
Year of appointment: 1999Committee: Chairman of Human Resources and NominationsExpertise: Finance and Administration
Jean MaguranyangaIndependent Non-executive
Year of appointment: 2012Committee: Audit and Risk Management, Human Resources and NominationsExpertise: Commercial Law and Banking
Mark HakenIndependent Non-executive
Year of appointment: 2018Committee: Audit and Risk ManagementExpertise: Insurance and Business Administration

17
ZIMRE HOLDINGS LIMITED 2020 ANNUAL REPORT
Ignatius MvereNon-executive
Year of appointment: 2013Committee: Audit and Risk Management, Finance and Investments and Human Resources and NominationsExpertise: Finance and Administration
Hamish B W RudlandNon-executive
Year of appointment: 2015Committee: Chairman of Finance and Investments and member of Human Re-sources and NominationsExpertise: Business Management and Transport
Robert C von SeidelNon-executive
Year of appointment: 2015Committee: Finance and InvestmentsExpertise: Corporate Finance and Banking
Stanley KudengaGroup Chief Executive Officer
Year of appointment: 2016Committee: All as invitee or ex officioExpertise: Investment Banking and Strategy
Edwin ZvandasaraNon-executive
Year of appointment: 2012Committee: Chairman Audit and Risk ManagementExpertise: Accounting and Financial Management
B. N. KumaloChairman30 June, 2021
Ruvimbo ChidoraGroup Legal Executive/Company Secretary30 June, 2021
CORPORATE GOVERNANCE AND MANAGEMENT APPROACH (continued)

18
ZIMRE HOLDINGS LIMITED 2020 ANNUAL REPORT
DIRECTORS’ REPORT
The Directors present their 23rd Directors’ Report together with the Audited Financial Statements of the Group for the year ended 31 December 2020.
Share CapitalFollowing the 30 September 2020 extraordinary general meeting through which the Shareholders of ZHL approved the acquisition of 35.09% of Fidelity Life Assurance of Zimbabwe Limited and 100% of Zimre Property Investments Limited, the Company issued, as consideration thereto, 284 879 849 ordinary shares from the authorized but unissued shares. The new share structure of the Company is tabled below.
31 December 2020 31 December 2019Authorised shares 2 000 000 000 2 000 000 000Issued shares 1 818 218 786 1 533 338 937Unissued shares 181 781 214 466 661 063
Placing of authorised unissued shares under the control of the DirectorsThe Company has 181 781 214 (2019:466 661 063) unissued shares and has sought in the Annual General Meeting (“AGM”) Notice, authority to place those unissued shares under the control of the Directors until the next AGM. The proposal will enable the Directors to undertake key transactions in the ordinary course of business without compromising members’ interests. The Directors shall notify the Zimbabwe Stock Exchange (“ZSE”) before any such transactions are executed and shall be in compliance with any instruction given by the ZSE.
Share Appreciation Rights SchemeThe Company is in the process of a transformation that will deliver a sustainable shareholder value proposition. In an effort to sustain, attract and retain the energy to deliver on the strategic thrust across the entire Group, the Board put together a Share Appreciation Rights Scheme. The Scheme will be supported by 90 932 745 ZHL shares equivalent to 5% of current issued shares over a 5-year period. The proposal has been placed in the AGM Notice for members’ consideration. The rules of the Scheme are available for inspection at the Company’s Registered Office.
DividendsThe Directors, at the Board Meeting held on 8 June 2021, declared a ZWL30 000 000 dividend (2020:ZWL 3 100 000). A formal dividend announcement was made to shareholders on 28 June 2021.
Jean Maguranyanga - Stanley Kudenga - Benjamin N Kumalo - Hamish B W Rudland - Edwin Zvandasara - Ignatius MvereAbsent: Mark Haken and Robert C von Seidel
19
ZIMRE HOLDINGS LIMITED 2020 ANNUAL REPORT
DIRECTORS’ REPORT (continued)
Purchase of Own SharesAt the last AGM, authority was granted for the Company to purchase its own shares up to a maximum of 5% of the number of shares in issue as at 15 August 2020. The authority is due to expire at the conclusion of the next AGM in 2021. The Notice of the AGM proposes that shareholders approve a resolution renewing the authority for the share buyback. During the year ended 31 December 2020, the Company purchased 526 100 ordinary shares amounting to ZWL997 149.
Going ConcernThe Directors consider that the Group has adequate resources to continue operating for the foreseeable future and therefore, have continued to adopt the going concern basis in preparing the annual financial statements. The Directors are satisfied that the Group is in a sound financial position and has access to facilities and resources which enable it to meet its foreseeable cash requirements.
DirectorateIn accordance with Article 75 of the Company’s Articles of Association, Messrs Haken, Mvere and von Seidel retire as Directors of the Company and all being eligible, they offer themselves for re-election. Shareholders will be requested to consider their re-election at the AGM.
Effective 12 April 2021, Mr. Desmond Matete was appointed to the Board of Directors. Mr. Matete brings with him 26 years’ worth of development finance and commercial law experience. The Board and management look forward to a long and fruitful partnership with Mr. Matete.
Directors’ RemunerationA resolution will be proposed at the AGM to approve the Directors’ Remuneration amounting to ZWL7 054 986 (2019: ZWL 9 516 597) for the year ended 31 December 2020.
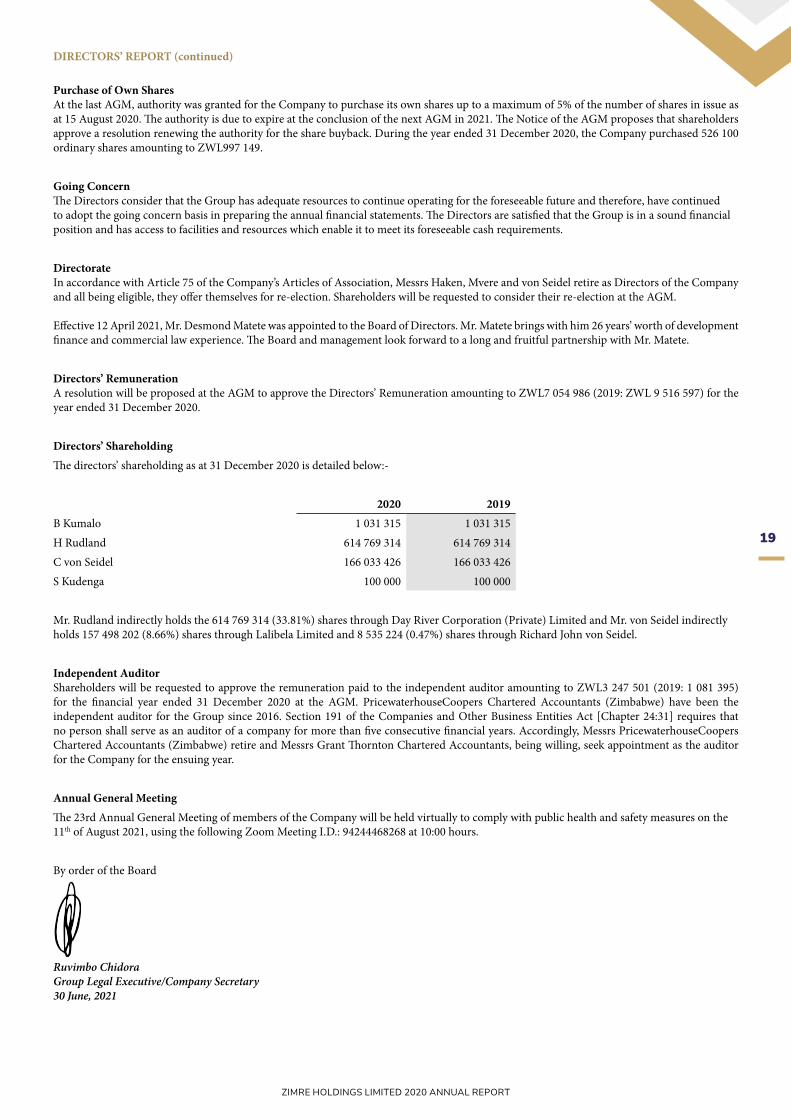
Directors’ ShareholdingThe directors’ shareholding as at 31 December 2020 is detailed below:-
2020 2019B Kumalo 1 031 315 1 031 315H Rudland 614 769 314 614 769 314C von Seidel 166 033 426 166 033 426S Kudenga 100 000 100 000
Mr. Rudland indirectly holds the 614 769 314 (33.81%) shares through Day River Corporation (Private) Limited and Mr. von Seidel indirectly holds 157 498 202 (8.66%) shares through Lalibela Limited and 8 535 224 (0.47%) shares through Richard John von Seidel.
Independent AuditorShareholders will be requested to approve the remuneration paid to the independent auditor amounting to ZWL3 247 501 (2019: 1 081 395) for the financial year ended 31 December 2020 at the AGM. PricewaterhouseCoopers Chartered Accountants (Zimbabwe) have been the independent auditor for the Group since 2016. Section 191 of the Companies and Other Business Entities Act [Chapter 24:31] requires that no person shall serve as an auditor of a company for more than five consecutive financial years. Accordingly, Messrs PricewaterhouseCoopers Chartered Accountants (Zimbabwe) retire and Messrs Grant Thornton Chartered Accountants, being willing, seek appointment as the auditor for the Company for the ensuing year.
Annual General MeetingThe 23rd Annual General Meeting of members of the Company will be held virtually to comply with public health and safety measures on the 11th of August 2021, using the following Zoom Meeting I.D.: 94244468268 at 10:00 hours.
By order of the Board
Ruvimbo ChidoraGroup Legal Executive/Company Secretary30 June, 2021

20
ZIMRE HOLDINGS LIMITED 2020 ANNUAL REPORT
DIRECTORS’ RESPONSIBILITY STATEMENT
The following statement, which should be read in conjunction with the Auditor’s Report set out on pages 22 to 28 of this 2020 ZHL Annual Report, is made with the view of distinguishing for members, the respective responsibilities of the Company’s Board of Directors (the“Board” or the “Directors”) and of the external auditor in relation to the financial statements for the year ended 31 December 2020. In conformity with International Financial Reporting Standards (ÏFRS”), Pronouncements of the Public Accountants and Auditors Board (“PAAB”) and the Companies Act (Chapter 24:03) (as amended by the Companies and Other Business Entities Act Chapter 24:31), the Directors are required to prepare financial statements for the Company, which give a true and fair view of the Company’s assets, liabilities, financial position and profit or loss. The Group Chief Executive Officer’s Report includes a fair review of the development and performance of the business and the position of the Group, together with a description of the material opportunities and risks associated with the expected development of the Group.
The Group’s accounting and internal controls are designed to provide reasonable assurance as to the integrity and reliability of these financial statements and to safeguard, verify and maintain accountability of the Group’s assets. Such controls are based on established written policies and procedures and all employees are required to maintain the highest ethical standards in ensuring the Group’s business and business practices are conducted in a manner that in all reasonable circumstances, is above reproach. The Directors are of the opinion, based on the information and explanations given by management that the system of internal control is operating in a satisfactory manner and therefore able to provide reasonable assurance that the financial records may be relied on for the preparation of the financial statements. However, any system of internal financial control can provide only a reasonable and not absolute assurance against material misstatement or loss.
The Directors have assessed the ability of the Group to continue operating as a going concern and believe that the preparation of the financial statements on a going concern basis is appropriate. Notwithstanding the foregoing, the Directors believe that under the prevailing economic and legislative environment, a continuous assessment of the Group’s going concern assumption will need to be performed.
The financial statements and the related notes set out on pages 30 to 157, which have been prepared on a going concern basis, in accordance with prevailing accounting principles and law, are hereby approved on this 6th day of July 2021.
DECLARATION BY GROUP FINANCE EXECUTIVE
These financial statements have been prepared under the supervision of the Group Finance Executive, Lovemore Madzinga. Lovemore is a Registered Public Accountant (PAAB No. 04417) and holds a Bachelors’ Degree in Accounting from the University of Zimbabwe. He is a Fellow of the Association of Chartered Certified Chartered Accountants (“FCCA”) and an Associate of the Chartered Institute of Secretaries and Administrators (“ACIS”).
L MadzingaGroup Finance Executive6 July, 2021

21
ZIMRE HOLDINGS LIMITED 2020 ANNUAL REPORT

22
ZIMRE HOLDINGS LIMITED 2020 ANNUAL REPORT
PricewaterhouseCoopers, Building No. 4, Arundel Office Park, Norfolk Road, Mount Pleasant P O Box 453, Harare, Zimbabwe T: +263 (242) 338362-8, F: +263 (242) 338395, www.pwc.com T I Rwodzi – Senior Partner The Partnership's principal place of business is at Arundel Office Park, Norfolk Road, Mount Pleasant, Harare, Zimbabwe where a list of the Partners' names is available for inspection.
Independent auditor’s report To the shareholders of Zimre Holdings Limited Our adverse opinion In our opinion, because of the significance of the matter discussed in the Basis for adverse opinion section of our report, the consolidated financial statements do not present fairly the consolidated financial position of Zimre Holdings Limited (the “Company”) and its subsidiaries (together the “Group”) as at 31 December 2020, and its consolidated financial performance and its consolidated cash flows for the year then ended in accordance with International Financial Reporting Standards and in the manner required by the Zimbabwe Companies and Other Business Entities Act (Chapter 24:31). What we have audited Zimre Holdings Limited’s consolidated financial statements, set out on pages 30 to 157, comprise:
� the consolidated statement of financial position as at 31 December 2020; � the consolidated statement of comprehensive income for the year then ended; � the consolidated statement of changes in equity for the year then ended; � the consolidated statements of cash flows for the year then ended; and � the notes to the consolidated financial statements, which include a summary of significant
accounting policies. Basis for adverse opinion An adverse opinion was issued on the consolidated financial statements as at 31 December 2019, and for the year then ended, due to the use of foreign currency exchange rates that were not considered appropriate spot rates for translation as required by International Accounting Standard 21, ‘The Effects of Changes in Foreign Exchange Rates’ ("IAS 21"), and their consequent effects on the hyperinflationary adjustments made in terms of International Accounting Standard 29, ‘Financial Reporting in Hyperinflationary Economies’ (“IAS 29”).
Our opinion on the consolidated financial statements as at 31 December 2020, and for the year then ended, is modified because of the possible effects of this matter on the comparability of the current period’s figures to that of the comparative period.
As described in note 2.1 to the consolidated financial statements, during the period from 1 January 2020 to 26 March 2020, the Group applied the interbank foreign exchange rate to translate foreign denominated transactions and balances and the financial information of foreign subsidiaries, which is not considered an appropriate spot rate for translation as required by IAS 21. For the period from 27 March 2020 to 22 June 2020, the Group translated foreign denominated transactions and balances and the financial information of foreign subsidiaries, using a fixed interbank foreign currency exchange rate as a result of a change in monetary policy measures in Zimbabwe, which was also not considered an appropriate spot rate for translation of foreign denominated transactions and balances as required by IAS 21. The misstatements described consequently affect the hyperinflationary adjustments made in accordance with IAS 29. Had the consolidated financial statements been prepared in accordance with the requirements of IAS 21, many elements in the accompanying consolidated financial statements would have been materially restated. It was not practicable to quantify the financial effects on the consolidated financial statements.
The misstatements described in the paragraph above affect the historical cost amounts which enter into the calculation of the inflation adjusted amounts. Had the underlying historical cost financial statements been prepared in accordance with the requirements of IAS 21, and then inflation adjusted in accordance with IAS 29, many elements in the accompanying consolidated financial statements would have been materially restated. It was not practicable to quantify the financial effects on the consolidated financial statements.

23
2
Furthermore, as disclosed in note 2.6, note 3.6 and note 10, the Group performed a valuation of investment property as at 31 December 2020. Valuations rely on historical market evidence for calculation inputs. Market evidence for inputs including transaction prices for comparable properties, rents, costs of construction and capitalisation rates were mainly available in United States of America Dollars (“US$”) as at 31 December 2020. In order to determine the ZWL values of these properties as at 31 December 2020, US$ inputs were used and then translated into ZWL using the interbank foreign exchange rate as per the Foreign Exchange Auction Trading System of the Reserve Bank of Zimbabwe. The application of a conversion rate from US$ valuation inputs to calculate ZWL property values is not an accurate reflection of market dynamics as the risks associated with currency trading do not reflect the risks associated with property trading. There were no further audit procedures that we could have performed to obtain sufficient and appropriate audit evidence regarding the valuation of the investment properties. As a result, we were unable to determine whether any adjustments would be required in respect of the recorded fair value of investment properties.
We conducted our audit in accordance with International Standards on Auditing (“ISAs”). Our responsibilities under those standards are further described in the Auditor’s responsibilities for the audit of the financial statements section of our report.
We believe that the audit evidence we have obtained is sufficient and appropriate to provide a basis for our adverse opinion. Independence We are independent of the Group in accordance with the International Code of Ethics for Professional Accountants (including International Independence Standards) (IESBA Code) issued by the International Ethics Standards Board for Accountants and other independence requirements applicable to performing audits of financial statements in Zimbabwe. We have fulfilled our other ethical responsibilities in accordance with the IESBA Code and other ethical requirements applicable to performing audits of financial statements in Zimbabwe.
Our audit approach Overview
Overall group materiality ZWL 21 296 000 which represents 1% of consolidated gross written premium. The inflation adjusted amounts were used in determining materiality.
Group audit scope
We performed a group scoping assessment and determined that four of the Group’s eleven components were financially significant and therefore required full scope audits. None of the components were determined to be significant based on significant risks identified at the Group. In order to comply with the Group’s statutory reporting requirements, full scope audits were performed on all eleven components. Key audit matters ● Applicable to the consolidated financial statements ● Adequacy of allowance for credit losses on trade and other
receivables. ● Valuation of insurance contract liabilities.
As part of designing our audit, we determined materiality and assessed the risks of material misstatement in the consolidated and separate financial statements. In particular, we considered where the directors made subjective judgements; for example, in respect of significant accounting estimates that involved making assumptions and considering future events that are inherently uncertain. As in all of our audits, we also addressed the risk of management override of internal controls, including among other matters, consideration of whether there was evidence of bias that represented a risk of material misstatement due to fraud.
Materiality
Group scoping
Key audit matters

24
ZIMRE HOLDINGS LIMITED 2020 ANNUAL REPORT
3
Materiality The scope of our audit was influenced by our application of materiality. An audit is designed to obtain reasonable assurance about whether the financial statements are free from material misstatement. Misstatements may arise due to fraud or error. They are considered material if, individually or in aggregate, they could reasonably be expected to influence the economic decisions of users taken on the basis of the consolidated financial statements.
Based on our professional judgement, we determined certain quantitative thresholds for materiality, including the overall group materiality for the consolidated financial statements as a whole as set out in the table below. These, together with qualitative considerations, helped us to determine the scope of our audit and the nature, timing and extent of our audit procedures and to evaluate the effect of misstatements, both individually and in aggregate, on the financial statements as a whole.
Overall materiality ZWL 21 296 000
How we determined it 1% of consolidated gross written premium. The inflation adjusted amounts were used.
Rationale for the materiality benchmark applied
A benchmark of consolidated gross written premium was selected. In our view, it is a benchmark against which the performance of the Group can be consistently measured in circumstances where the earnings are volatile year on year. This benchmark has remained a stable and key driver of the Group’s business. We chose 1% based on our professional judgment and after consideration of the range of quantitative materiality thresholds that we typically apply when using total revenue (represented by consolidated gross written premium) to compute materiality.
How we tailored our group audit scope We tailored the scope of our audit in order to perform sufficient work to enable us to provide an opinion on the consolidated financial statements as a whole, taking into account the structure of the Group, the accounting processes and controls, and the industries in which the Group operates.
The Group has eleven reporting components, operating in Zambia, Zimbabwe, Malawi, Mozambique and Botswana. We performed a group scoping assessment and determined that four of the Group’s eleven components were financially significant and required full scope audits, whilst none of the components were determined to be significant based on significant risks identified at the Group. Due to statutory audit requirements, the Company and all eleven of its subsidiaries were subjected to full scope audits.
In establishing the overall approach to the group audit, we determined the type of work that needed to be performed by us, as the group engagement team, or component auditors from other firms operating under our instructions. Where the work was performed by component auditors, we determined the level of involvement we needed to have in the audit work at those operations to be able to conclude whether sufficient appropriate audit evidence had been obtained as a basis of our opinion on the consolidated financial statements as a whole. The group engagement team inspected certain component auditors’ working papers.

25
ZIMRE HOLDINGS LIMITED 2020 ANNUAL REPORT
4
Key audit matters Key audit matters are those matters that, in our professional judgment, were of most significance in our audit of the consolidated and separate financial statements of the current period. These matters were addressed in the context of our audit of the consolidated financial statements as a whole, and in forming our opinion thereon, and we do not provide a separate opinion on these matters. In addition to the matters described in the Basis for adverse opinion section, we determined the matters described below to be key audit matters to be communicated in our report.
Except for the matters described in the Basis for adverse opinion section, we have determined that there are no other key audit matters to communicate in our report in respect of the separate financial statements.
Key audit matters How our audit addressed the key audit matter
Adequacy of allowance for credit losses on trade and other receivables IFRS 9 requires the recognition of expected credit losses (“ECL”) on all financial assets within the scope of its impairment model. Management assessed the ECL on trade and other receivables using a simplified approach which requires expected lifetime losses to be recognised from initial recognition of the trade and other receivables. The application of the standard required management to exercise significant judgment and apply estimates in the determination of the ECL. Significant judgment was required in the determination of loss rates and the use of forward looking economic expectations affecting the ability of the customers to settle the trade and other receivables. As at 31 December 2020, insurance receivables amounted to ZWL 1 118 908 188 for the Group and non- insurance receivables amounted to ZWL 36 569 818. Management provided an ECL of ZWL 178 751 312.
Our procedures to audit the expected credit losses on trade and other receivables included the following: • We obtained an understanding of management’s
process for determining the ECL on trade and other receivables;
• We considered the appropriateness of the accounting policies implemented and evaluated the impairment methodologies applied by management against the requirements of IFRS 9;
• We assessed whether the financial statement disclosures appropriately reflected the Group’s exposure to credit risk in accordance with the requirements of IFRS 7: Financial instruments: disclosures;
• We assessed the design of management’s models, including assessing the appropriateness of the forward looking economic expectations applied by management by comparing them to independent sources;
• On a sample basis, we assessed the accuracy of historical data used by management in determining the loss rates, through recomputation of historical credit loss rates and agreeing the inputs used to calculate historical data to prior year working papers and financial statements;
• We evaluated the appropriateness of adjustments for forward looking information by assessing the applied economic scenarios against the publicly available economic forecasts on Zimbabwe;
• On a sample basis, we tested the ageing of the trade and other receivables balances by recalculating the days past due; and
• We tested the mathematical accuracy of the ECL calculation through recomputations.

26
ZIMRE HOLDINGS LIMITED 2020 ANNUAL REPORT
5
Key audit matter How our audit addressed the key audit matter
We considered the ECL on trade and other receivables to be a matter of most significance to our current year audit due to the following: ● the judgement and estimates applied by
management in determining the loss rates and the use of forward looking economic expectations affecting the ability of the customers to settle the trade and other receivables; and
● the significance of the trade and other receivables to the consolidated financial statements.
Refer to the following notes to the financial statements for disclosure relating to this matter: ● note 2.10, accounting policy: trade and other
receivables; ● note 6.2.4, significant accounting judgments and
estimates: allowances for credit losses on financial assets measured at amortised cost;
● note 3.3, credit risk; and, ● note 16, trade and other receivables.
Valuation of insurance contract liabilities
As at 31 December 2020 insurance contract liabilities amounted to ZWL 4 867 052 636, comprising short term insurance contract liabilities amounting to ZWL 711 334 699 (note 21), insurance contract liabilities and investment contract liabilities amounting to ZWL 4 119 738 937 (note 21.3) and life reassurance contract liabilities amounting to ZWL 35 979 000 (note 22.2). We considered the valuation of insurance contract liabilities to be a matter of most significance to our current year audit due to the following: ● the valuation of the Group insurance contract
liabilities involves complex calculations, significant judgements, and long and short term estimates and assumptions. The methodology involves judgements about future events, both internal and external to the Group; and the value of the Group insurance contract liabilities is significant to the consolidated financial statements.
● The main valuation assumptions include mortality, expenses, expense inflation, discount rates and lapses, previous experience in claim patterns, claim settlement patterns, trends in claims frequency .
Disclosure is provided in the following notes; ● note 2.17, accounting policy: reinsurance contract
liabilities; ● note 6.2.1, significant accounting estimates and
judgements: insurance contract liabilities; ● note 5, insurance risk management; ● note 21, short term insurance contract liabilities;
and; ● note 22, life reinsurance contract assets and liabilities.
We assessed the independence, experience and competence of the statutory actuaries used by management for all the entities. We inspected the actuaries’ curricula vitae and held discussions with them and management. We utilised our actuarial expertise to evaluate the reasonableness of significant assumptions and estimates and the actuarial computations, and to evaluate the actuarial valuation report obtained from management for adequacy and reasonableness. In doing so, the following procedures were performed: ● We compared the Group’s mortality tables against
the standard actuarial mortality tables to assess the reasonableness of the assumption.
● We assessed whether the expenses and lapse rate assumptions were based on the Group’s internal experience.
● We assessed the reasonableness of the expense inflation by comparing it to external sources such as external industry research reports.
● We assessed whether discount rates used reflected the nature of the assets backing the insurance contract liabilities and also whether they reflected the conditions of the market in which these assets are held.
● We compared the actual emerging claims for prior years against the provision for the same period to assess the reasonableness of management’s previous provisions.
● We tested data used in the valuation by agreeing a sample of that data to supporting evidences;
● We assessed the valuation basis (including chain ladder methodology, run off analysis on historical loss experience,1/365 method and ⅛ method) through discussion with the statutory actuaries and assessing its appropriateness, given the nature of the business as well as actuarial best practice.
● We assessed the valuation results by rerunning the models, on a sample basis, to consider accurate application of the selected methodology and assumptions. We inspected the actuarial report for 2020 prepared by the statutory actuary and compared it to the prior year signed actuarial report in order to identify any significant changes in assumptions and methodology.
We compared the mortality, expenses, expense inflation, discount rates and lapses, previous experience in claim patterns, claim settlement patterns and trends in claims frequency to the prior year valuation in order to test whether they were consistently applied by management.

27
ZIMRE HOLDINGS LIMITED 2020 ANNUAL REPORT
6
Other information The directors are responsible for the other information. The other information comprises the information included in the document titled “Zimre Holdings Limited 2020 Annual Report”. The other information does not include the consolidated or the separate financial statements and our auditor’s report thereon.
Our opinion on the consolidated and separate financial statements does not cover the other information and we do not express an audit opinion or any form of assurance conclusion thereon.
In connection with our audit of the consolidated and separate financial statements, our responsibility is to read the other information identified above and, in doing so, consider whether the other information is materially inconsistent with the consolidated and separate financial statements or our knowledge obtained in the audit, or otherwise appears to be materially misstated. If, based on the work we have performed, we conclude that there is a material misstatement of this other information, we are required to report that fact. As described in the Basis for adverse opinion section above, the consolidated and separate financial statements contain material misstatements with respect to the application of IAS 21 and its consequent effects on the hyperinflationary adjustments made in terms of IAS 29, as well as the valuation of investment properties. We have concluded that the other information is materially misstated for the same reasons, with respect to the amounts or other items in the other information affected by these matters.
Responsibilities of the directors for the consolidated and separate financial statements
The directors are responsible for the preparation and fair presentation of the financial statements in accordance with International Financial Reporting Standards and the requirements of the Zimbabwe Companies and Other Business Entities Act (Chapter 24:31), and for such internal control as the directors determine is necessary to enable the preparation of financial statements that are free from material misstatement, whether due to fraud or error.
In preparing the financial statements, the directors are responsible for assessing the Company’s ability to continue as a going concern, disclosing, as applicable, matters related to going concern and using the going concern basis of accounting unless the directors either intend to liquidate the Company or to cease operations, or have no realistic alternative but to do so. Auditor’s responsibilities for the audit of the consolidated and separate financial statements
Our objectives are to obtain reasonable assurance about whether the consolidated and separate financial statements as a whole are free from material misstatement, whether due to fraud or error, and to issue an auditor’s report that includes our opinion. Reasonable assurance is a high level of assurance, but is not a guarantee that an audit conducted in accordance with ISAs will always detect a material misstatement when it exists. Misstatements can arise from fraud or error and are considered material if, individually or in the aggregate, they could reasonably be expected to influence the economic decisions of users taken on the basis of these consolidated and separate financial statements.
As part of an audit in accordance with ISAs, we exercise professional judgment and maintain professional scepticism throughout the audit. We also: ● Identify and assess the risks of material misstatement of the consolidated and separate financial
statements, whether due to fraud or error, design and perform audit procedures responsive to those risks, and obtain audit evidence that is sufficient and appropriate to provide a basis for our opinion. The risk of not detecting a material misstatement resulting from fraud is higher than for one resulting from error, as fraud may involve collusion, forgery, intentional omissions, misrepresentations, or the override of internal control.
● Obtain an understanding of internal control relevant to the audit in order to design audit procedures that are appropriate in the circumstances, but not for the purpose of expressing an opinion on the effectiveness of the Group’s and the Company’s internal control.
● Evaluate the appropriateness of accounting policies used and the reasonableness of accounting estimates and related disclosures made by the directors.
● Conclude on the appropriateness of the directors’ use of the going concern basis of accounting and, based on the audit evidence obtained, conclude whether a material uncertainty exists related to

28
ZIMRE HOLDINGS LIMITED 2020 ANNUAL REPORT
7
events or conditions that may cast significant doubt on the Group’s and the Company’s ability to continue as a going concern. If we conclude that a material uncertainty exists, we are required to draw attention in our auditor’s report to the related disclosures in the consolidated and separate financial statements or, if such disclosures are inadequate, to modify our opinion. Our conclusions are based on the audit evidence obtained up to the date of our auditor’s report. However, future events or conditions may cause the Group and / or Company to cease to continue as a going concern.
● Evaluate the overall presentation, structure and content of the consolidated and separate financial statements, including the disclosures, and whether the consolidated and separate financial statements represent the underlying transactions and events in a manner that achieves fair presentation.
● Obtain sufficient appropriate audit evidence regarding the financial information of the entities or business activities within the Group to express an opinion on the consolidated financial statements. We are responsible for the direction, supervision and performance of the group audit. We remain solely responsible for our audit opinion.
We communicate with the directors regarding, among other matters, the planned scope and timing of the audit and significant audit findings, including any significant deficiencies in internal control that we identify during our audit.
We also provide the directors with a statement that we have complied with relevant ethical requirements regarding independence, and communicate with them all relationships and other matters that may reasonably be thought to bear on our independence, and where applicable, actions taken to eliminate threats or safeguards applied. From the matters communicated with the directors, we determine those matters that were of most significance in the audit of the consolidated and separate financial statements of the current period and are therefore the key audit matters. We describe these matters in our auditor’s report unless law or regulation precludes public disclosure about the matter or when, in extremely rare circumstances, we determine that a matter should not be communicated in our report because the adverse consequences of doing so would reasonably be expected to outweigh the public interest benefits of such communication.
Evangelista Ravasingadi Registered Public Auditor Partner for and on behalf of PricewaterhouseCoopers Chartered Accountants (Zimbabwe) Public Accountants and Auditors Board, Public Auditor Registration Number 0391 Institute of Chartered Accountants of Zimbabwe, Public Practice Certificate Number 253514 05 July 2021 Harare Zimbabwe

29
ZIMRE HOLDINGS LIMITED 2020 ANNUAL REPORT
With a reputation for strength, stability and innovation, we offer balanced risk taking to ensure you thrive, survive and grow.
Innovative risk solutions toprotect growth and prosperity
Block D, 2nd Floor, Smatsatsa O�ce ParkStand Number 10667, Borrowdale, Harare, ZimbabweTel: +263 24 2870 762-8 | Website: www.emeritus.com

30
ZIMRE HOLDINGS LIMITED 2020 ANNUAL REPORT
GROUP STATEMENT OF FINANCIAL POSITIONAS AT 31 DECEMBER 2020
ASSETS Notes
INFLATION ADJUSTED HISTORICAL COST
Group2020ZWL
Group2019ZWL
Group2020ZWL
Group2019ZWL
Property and equipment 8 741 422 643 367 147 765 664 736 728 71 588 364
Right of use of assets 9 46 273 573 44 804 143 40 192 019 4 420 507
Investment properties 10 6 197 588 803 2 276 886 366 6 197 588 803 507 570 140
Intangible assets 11 135 026 314 13 061 744 200 907 041 665 695
Investment in associates 13 977 820 796 155 538 660 693 976 146 26 042 624
Deferred tax assets 14 86 264 671 71 405 123 79 871 904 14 382 180
Inventories 15 151 797 977 84 545 939 6 707 535 2 914 960
Trade and other assets 16 1 249 691 572 801 384 003 1 245 214 247 178 646 855
Life reassurance contract asset 22.1 13 033 000 6 431 820 13 033 000 1 433 800
Current income tax assets 47 171 446 33 485 636 47 171 446 7 464 716
Deferred acquisition costs 17 104 098 786 56 004 436 85 927 557 11 479 221
Financial assets :
- at amortised cost 18.1 443 035 188 138 485 545 443 035 188 30 871 601
- at fair value through profit or loss 18.2 736 794 728 108 901 367 736 794 728 24 276 611
- at fair value through other comprehensive income 18.3 361 667 728 350 103 492 361 667 728 78 046 090
Cash and cash equivalents 19 1 183 681 256 410 188 652 1 183 681 256 91 440 449
Total assets 12 475 368 481 4 918 374 691 12 000 505 326 1 051 243 813
EQUITY AND LIABILITIES
EQUITY
Equity attributable to equity holders of the parent
Share capital 20 511 388 554 508 539 756 18 175 447 15 326 649
Share premium 20 1 155 337 538 379 042 460 787 722 112 11 427 034
Treasury shares 20 (1 558 126) (519 126) (1 023 081) (25 932)
Revaluation reserve 471 335 043 478 236 144 465 230 460 46 318 339
Financial assets at fair value through other comprehensive income reserve 116 274 028 176 870 908 88 304 391 57 258 115
Foreign currency translation reserve 866 950 223 454 084 315 528 713 948 105 574 318
Change in ownership reserve 448 173 594 22 682 123 334 501 014 814 869
Retained earnings 1 508 800 541 548 404 922 2 351 969 692 290 497 468
Total equity attributable to equity holders of the parent 5 076 701 395 2 567 341 502 4 573 593 983 527 190 860
Non-controlling interest 674 948 559 727 765 518 803 620 028 179 612 441
Total equity 5 751 649 954 3 295 107 020 5 377 214 011 706 803 301
LIABILITIES
Deferred tax liabilities 14 239 594 597 57 410 765 192 647 632 5 393 357
Short term insurance contract liabilities 21 711 334 699 554 301 304 657 854 452 113 548 234
Insurance contract liabilities and investment contract
liabilities with discretionary participation features 21.2 3 722 269 955 3 722 269 955 -
Investment contracts without discretionary participation features 21.3 397 468 982 - 397 468 982 -
Life reassurance contract liabilities 22.2 35 979 000 29 097 502 35 979 000 6 486 500
Borrowings 23 74 464 690 64 842 518 74 464 690 14 454 883
Lease liabilities 9 43 357 960 23 692 087 43 357 960 5 281 509
Other provisions 24 51 716 608 54 722 666 51 716 608 12 198 936
Trade and other payables 25 1 415 818 773 839 200 829 1 415 818 773 187 077 093
Current income tax payable 31 421 330 - 31 421 330 -
Bank overdraft 19 291 933 - 291 933 -
Total liabilities 6 723 718 527 1 623 267 671 6 623 291 315 344 440 512
TOTAL EQUITY AND LIABILITIES 12 475 368 481 4 918 374 691 12 000 505 326 1 051 243 813
B. N. Kumalo S.KudengaChairman Group Chief Executive

31
ZIMRE HOLDINGS LIMITED 2020 ANNUAL REPORT
VISIONTo be a highly prized diversified investment Group.
MISSIONUsing our financial services capabilities, we prudently manage risks and optimise resources.
VALUES• Team Work - We value the contribution of each member and consistently make sound and collective decisions.• Integrity – We observe transparency and conduct our business in a professional and ethical manner.• Respect - We empower our employees, develop and harness the best talents in the market.• Excellence - Using technological innovations and other tools, we provide services that meet stakeholder expectations.• Commitment - We consistently meet set targets, standards and maximize returns on shareholder funds.
VALUE PROPOSITION• Maximum leveraging and utilisation.• Insurance float for cash generation.• Regionally diversified investment portfolio.• Grow shareholder value.
CHAMPIONING THEINVESTMENT SHIP
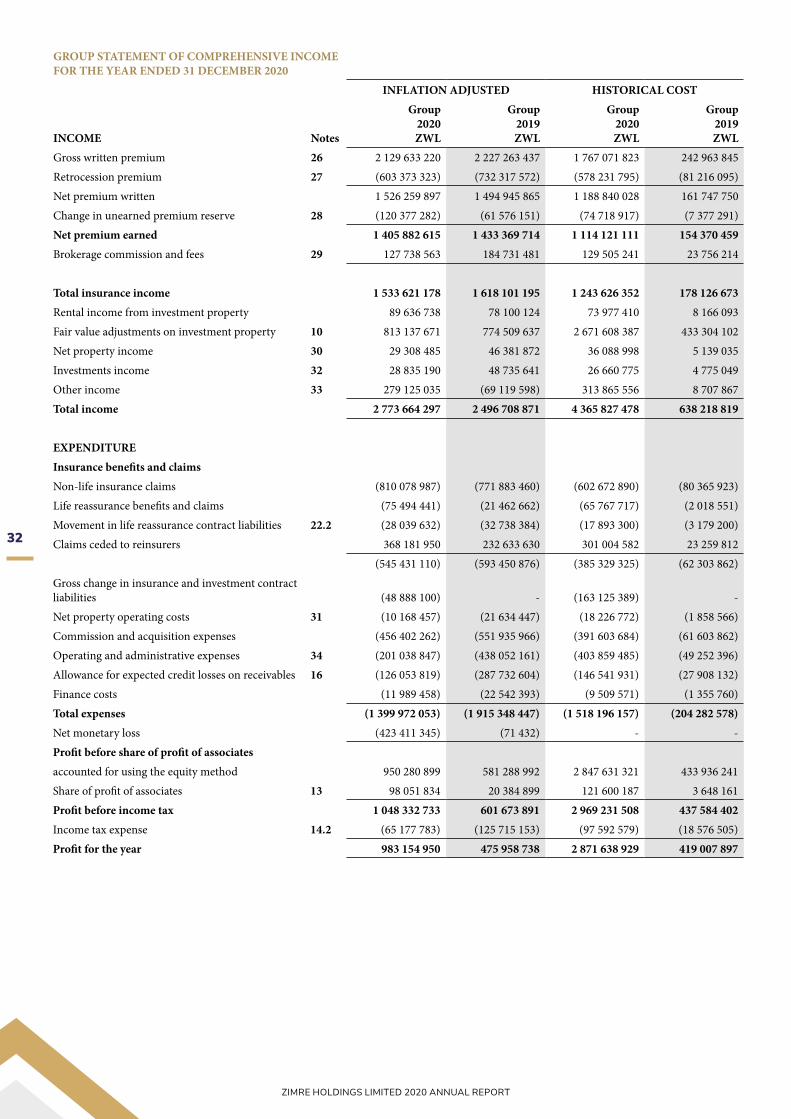
32
ZIMRE HOLDINGS LIMITED 2020 ANNUAL REPORT
GROUP STATEMENT OF COMPREHENSIVE INCOMEFOR THE YEAR ENDED 31 DECEMBER 2020
INFLATION ADJUSTED HISTORICAL COST
INCOME Notes
Group2020ZWL
Group2019ZWL
Group2020ZWL
Group2019ZWL
Gross written premium 26 2 129 633 220 2 227 263 437 1 767 071 823 242 963 845Retrocession premium 27 (603 373 323) (732 317 572) (578 231 795) (81 216 095)Net premium written 1 526 259 897 1 494 945 865 1 188 840 028 161 747 750Change in unearned premium reserve 28 (120 377 282) (61 576 151) (74 718 917) (7 377 291)Net premium earned 1 405 882 615 1 433 369 714 1 114 121 111 154 370 459Brokerage commission and fees 29 127 738 563 184 731 481 129 505 241 23 756 214
Total insurance income 1 533 621 178 1 618 101 195 1 243 626 352 178 126 673Rental income from investment property 89 636 738 78 100 124 73 977 410 8 166 093Fair value adjustments on investment property 10 813 137 671 774 509 637 2 671 608 387 433 304 102Net property income 30 29 308 485 46 381 872 36 088 998 5 139 035Investments income 32 28 835 190 48 735 641 26 660 775 4 775 049Other income 33 279 125 035 (69 119 598) 313 865 556 8 707 867Total income 2 773 664 297 2 496 708 871 4 365 827 478 638 218 819
EXPENDITUREInsurance benefits and claimsNon-life insurance claims (810 078 987) (771 883 460) (602 672 890) (80 365 923)Life reassurance benefits and claims (75 494 441) (21 462 662) (65 767 717) (2 018 551)Movement in life reassurance contract liabilities 22.2 (28 039 632) (32 738 384) (17 893 300) (3 179 200)Claims ceded to reinsurers 368 181 950 232 633 630 301 004 582 23 259 812
(545 431 110) (593 450 876) (385 329 325) (62 303 862)Gross change in insurance and investment contract liabilities (48 888 100) - (163 125 389) -Net property operating costs 31 (10 168 457) (21 634 447) (18 226 772) (1 858 566)Commission and acquisition expenses (456 402 262) (551 935 966) (391 603 684) (61 603 862)Operating and administrative expenses 34 (201 038 847) (438 052 161) (403 859 485) (49 252 396)Allowance for expected credit losses on receivables 16 (126 053 819) (287 732 604) (146 541 931) (27 908 132)Finance costs (11 989 458) (22 542 393) (9 509 571) (1 355 760)Total expenses (1 399 972 053) (1 915 348 447) (1 518 196 157) (204 282 578)Net monetary loss (423 411 345) (71 432) - -Profit before share of profit of associatesaccounted for using the equity method 950 280 899 581 288 992 2 847 631 321 433 936 241Share of profit of associates 13 98 051 834 20 384 899 121 600 187 3 648 161Profit before income tax 1 048 332 733 601 673 891 2 969 231 508 437 584 402Income tax expense 14.2 (65 177 783) (125 715 153) (97 592 579) (18 576 505)Profit for the year 983 154 950 475 958 738 2 871 638 929 419 007 897

33
ZIMRE HOLDINGS LIMITED 2020 ANNUAL REPORT
GROUP STATEMENT OF COMPREHENSIVE INCOMEFOR THE YEAR ENDED 31 DECEMBER 2020 (continued)
INFLATION ADJUSTED HISTORICAL COST
Notes
Group2020ZWL
Group2019ZWL
Group2020ZWL
Group2019ZWL
OTHER COMPREHENSIVE INCOMEItems that will not be reclassified to profit or loss:Property revaluation surplus 8 (6 298 528) 104 867 740 115 915 441 33 785 861Share of other comprehensive income ofassociates accounted for using the equity method 13 3 693 418 72 026 809 482 915 734 17 041 699Gross change in insurance liabilities throughother comprehensive income (3 339 231) - (20 785 361) -Income tax relating to components of othercomprehensive income 14.1 (1 560 090) (13 310 866) (1 560 090) (3 487 719)
(7 504 431) 163 583 683 576 485 724 47 339 841Items that may be reclassified to profit or loss:Exchange gains on translation of foreign operations 445 491 992 521 903 876 455 178 868 111 135 514Changes in fair value of financial assets at FVOCI 18 (63 303 279) 153 404 635 36 659 604 57 658 115Income tax relating to components of othercomprehensive income 14.1 2 706 398 (7 093 439) (5 613 328) (2 390 558)
384 895 111 668 215 072 486 225 144 166 403 071
Other comprehensive income for the year net of tax 377 390 680 831 798 755 1 062 710 868 213 742 912
Total comprehensive income for the year 1 360 545 630 1 307 757 493 3 934 349 797 632 750 809
Profit attributable to:Equity holders of Zimre Holdings Limited 558 250 504 187 395 112 2 015 543 197 269 729 090Non-controlling interests 424 904 446 288 563 626 856 095 733 149 278 807
983 154 950 475 958 738 2 871 638 930 419 007 897
Total comprehensive income attributable to:Equity holders of Zimre Holdings Limited 903 618 430 968 733 415 2 888 641 224 471 037 973Non-controlling interests 456 927 200 339 024 078 1 045 708 573 161 712 836
1 360 545 630 1 307 757 493 3 934 349 797 632 750 809
Earnings per share attributable to owners of Zimre Holdings LimitedBasic and diluted earnings per share (ZWL cents): 35 35.85 12.22 129.44 17.59

34
ZIMRE HOLDINGS LIMITED 2020 ANNUAL REPORT
GRO
UP
STAT
EMEN
T O
F C
HA
NG
ES IN
EQ
UIT
YFO
R T
HE
YEA
R E
ND
ED 3
1 D
ECEM
BER
202
0
INFL
ATIO
N A
DJU
STED
Not
es
Shar
eca
pita
lZW
L
Shar
epr
emiu
mZW
L
Trea
sury
sh
ares
ZWL
Reva
luat
ion
rese
rve
ZWL
Fina
ncia
l ass
ets
at fa
ir v
alue
th
roug
h ot
her
com
preh
ensi
ve
inco
me
rese
rve
ZWL
Fore
ign
curr
ency
tran
slatio
n re
serv
eZW
L
Cha
nge
in
owne
rshi
pre
serv
eZW
L
Reta
ined
earn
ings
ZWL
Attr
ibut
able
equi
ty h
olde
rsof
par
ent
ZWL
Non
-co
ntro
lling
inte
rest
ZWL
Tota
l equ
ityZW
L
Year
ende
d 31
Dec
embe
r 201
9
Bala
nce
as a
t 1 Ja
nuar
y 20
19, a
s pre
viou
sly
repo
rted
508
539
756
379
042
460
(439
188
)39
0 31
7 01
630
559
712
(93
023
664)
- 36
2 85
0 89
5 1
577
846
987
411
423
563
1 9
89 2
70 5
50
Cha
nges
on
initi
al ap
plic
atio
n of
IFRS
16
- -
- -
- -
- (1
841
085
)(1
841
085
) -
(1 8
41 0
85)
Bala
nce
as a
t 1 Ja
nuar
y 20
19, a
s res
tate
d50
8 53
9 75
637
9 04
2 46
0(4
39 1
88)
390
317
016
30 5
59 7
12(9
3 02
3 66
4) -
361
009
810
1 5
76 0
05 9
0241
1 42
3 56
3 1
987
429
465
Tota
l com
preh
ensi
ve in
com
e fo
r the
yea
r -
--
87 9
19 1
2814
6 31
1 19
654
7 10
7 97
9 -
187
395
112
968
733
415
339
024
078
1 3
07 7
57 4
93
Profi
t for
the
year
- -
- -
- -
- 18
7 39
5 11
218
7 39
5 11
228
8 56
3 62
647
5 95
8 73
8
Oth
er co
mpr
ehen
sive
inco
me
for t
he y
ear,
net o
f tax
- -
- 87
919
128
146
311
196
547
107
979
- -
781
338
303
50 4
60 4
5283
1 79
8 75
5
Tran
sact
ions
with
ow
ners
in th
eir c
apac
ity a
s ow
ners
-
-(7
9 93
8)-
--
22 6
82 1
23-
22 6
02 1
85(2
2 68
2 12
3)(7
9 93
8)
Shar
e bu
y-ba
ck -
- (7
9 93
8) -
- -
- -
(79
938)
- (7
9 93
8)
Cha
nge
in o
wne
rshi
p pe
rcen
tage
-
- -
- -
- 22
682
123
- 22
682
123
(22
682
123)
-
Bala
nce
as a
t 31
Dec
embe
r 201
950
8 53
9 75
637
9 04
2 46
0(5
19 1
26)
478
236
144
176
870
908
454
084
315
22 6
82 1
2354
8 40
4 92
2 2
567
341
502
727
765
518
3 2
95 1
07 0
20
Year
ende
d 31
Dec
embe
r 202
0
Bala
nce
as at
1 Ja
nuar
y 20
2050
8 53
9 75
637
9 04
2 46
0(5
19 1
26)
478
236
144
176
870
908
454
084
315
22,
682,
123.
36
548
404
922
2 5
67 3
41 5
0272
7 76
5 51
8 3
295
107
020
Tota
l com
preh
ensi
ve in
com
e fo
r the
yea
r -
- -
(6 9
01 1
01)
(60
596
880)
412
865
908
- 55
8 25
0 50
490
3 61
8 43
145
6 92
7 19
913
60 5
45 6
30
Profi
t for
the
year
- -
- -
- -
- 55
8 25
0 50
455
8 25
0 50
442
4 90
4 44
698
3 15
4 95
0
Oth
er co
mpr
ehen
sive
inco
me
for t
he y
ear,
net o
f tax
- -
- (6
901
101
)(6
0 59
6 88
0)41
2 86
5 90
8 -
- 34
5 36
7 92
732
022
753
377
390
680
Writ
e ba
ck o
f im
paire
men
t ass
ocia
te-
--
--
--
407
452
977
407
452
977
-40
7 45
2 97
7
No-
cont
rolli
ng in
tere
sts o
n ac
quisi
tion
of su
bsid
iary
--
- -
- -
--
-53
7 96
2 26
153
7 96
2 26
1
Tran
sact
ions
with
ow
ners
in th
eir c
apac
ity a
s ow
ners
2
848
798
776
295
078
(1 0
39 0
00)
--
- 4
25 4
91 4
71(5
307
862
) 1
198
288
485
(1 0
47 7
06 4
19)
150
582
066
Div
iden
d de
clar
ed a
nd p
aid
--
--
(5 3
07 8
62)
(5 3
07 8
62)
(1 4
62 5
64)
(6 7
70 4
27)
Issu
e of
shar
es 2
848
798
801
936
775
--
--
--
804
785
573
- 8
04 7
85 5
73
Issu
e of
shar
es tr
ansa
ctio
n co
sts
-(2
5 64
1 69
7)-
--
--
-(2
5 64
1 69
7)-
(25
641
697)
Shar
e bu
y-ba
ck-
-(1
039
000
)-
--
--
(1 0
39 0
00)
-(1
039
000
)
Cha
nge
in o
wne
rshi
p pe
rcen
tage
-
--
--
- 4
25 4
91 4
71-
425
491
471
(1 0
46 2
43 8
55)
(620
752
384
)
Bala
nce
as a
t 31
Dec
embe
r 202
0 5
11 3
88 5
54 1
155
337
538
(1 5
58 1
26)
471
335
043
116
274
028
866
950
223
448
173
594
1 5
08 8
00 5
41 5
076
701
395
674
948
559
5 7
51 6
49 9
54
GRO
UP
STAT
EMEN
T O
F C
HA
NG
ES IN
EQ
UIT
YFO
R T
HE
YEA
R E
ND
ED 3
1 D
ECEM
BER
202
0 (c
ontin
ued)
HIS
TOR
ICA
L C
OST
Not
es
Shar
eca
pita
lZW
L
Shar
epr
emiu
mZW
L
Trea
sury
sh
ares
ZWL
Reva
luat
ion
rese
rve
ZWL
Fina
ncia
l ass
ets
at fa
ir v
alue
th
roug
h ot
her
com
preh
ensi
ve
inco
me
rese
rve
ZWL
Fore
ign
curr
ency
tran
slatio
n re
serv
eZW
L
Cha
nge
in
owne
rshi
pre
serv
eZW
L
Reta
ined
earn
ings
ZWL
Attr
ibut
able
equi
ty h
olde
rsof
par
ent
ZWL
Non
-co
ntro
lling
inte
rest
ZWL
Tota
l equ
ityZW
L
Year
ende
d 31
Dec
embe
r 201
9
Bala
nce
as a
t 1 Ja
nuar
y 20
19, a
s pre
viou
sly
repo
rted
15 3
26 6
4911
427
034
(8 8
86)
14 0
17 0
381
990
559
(8 1
65 7
07)
- 20
803
807
55 3
90 4
9418
714
474
74 1
04 9
68
Cha
nge
in a
ccou
ntin
g po
licy
due
to a
dopt
ion
of IF
RS 1
6 -
- -
- -
- -
(35
430)
(35
430)
- (3
5 43
0)
Bala
nce
as a
t 1 Ja
nuar
y 20
19 a
s res
tate
d15
326
649
11 4
27 0
34(8
886
)14
017
038
1 99
0 55
9(8
165
707
) -
20 7
68 3
7755
355
064
18 7
14 4
7474
069
538
Tota
l com
preh
ensi
ve in
com
e fo
r the
yea
r -
- -
32 3
01 3
0155
267
556
113
740
025
- 26
9 72
9 09
147
1 03
7 97
316
1 71
2 83
663
2 75
0 80
9
Profi
t for
the
year
- -
- -
- -
- 26
9 72
9 09
126
9 72
9 09
114
9 27
8 80
741
9 00
7 89
8
Oth
er co
mpr
ehen
sive
inco
me
for t
he y
ear,
net o
f tax
- -
- 32
301
301
55 2
67 5
5611
3 74
0 02
5 -
- 20
1 30
8 88
212
434
029
213
742
911
Tran
sact
ions
with
ow
ners
in th
eir c
apac
ity a
s ow
ners
-
- (1
7 04
6) -
- -
814
869
- 7
97 8
23(8
14 8
69)
(17
046)
Shar
e bu
y-ba
ck20
- -
(17
046)
- -
- -
- (1
7 04
6) -
(17
046)
Cha
nge
in o
wne
rshi
p pe
rcen
tage
36
.5 -
- -
- -
- 8
14 8
69 -
814
869
(814
869
) -
Bala
nce
as a
t 31
Dec
embe
r 201
915
326
649
11 4
27 0
34(2
5 93
2)46
318
339
57 2
58 1
1510
5 57
4 31
8 8
14 8
6929
0 49
7 46
852
7 19
0 85
917
9 61
2 44
170
6 80
3 30
0
Year
ende
d 31
Dec
embe
r 202
0
Bala
nce
as a
t 1 Ja
nuar
y 20
2015
326
649
11 4
27 0
34(2
5 93
2)46
318
339
57 2
58 1
1510
5 57
4 31
8 8
14 8
6929
0 49
7 46
852
7 19
0 85
917
9 61
2 44
170
6 80
3 30
0
Tota
l com
preh
ensi
ve in
com
e fo
r the
yea
r -
--
418
912
121
31
046
276
423
139
630
- 2
015
543
197
2 8
88 6
41 2
24 1
045
708
573
3 9
34 3
49 7
97
Profi
t for
the
year
- -
--
--
- 2
015
543
197
2 0
15 5
43 1
97 8
56 0
95 7
33 2
871
638
930
Oth
er co
mpr
ehen
sive
inco
me
for t
he y
ear,
net o
f tax
- -
- 4
18 9
12 1
21 3
1 04
6 27
6 4
23 1
39 6
30-
- 8
73 0
98 0
27 1
89 6
12 8
40 1
062
710
867
Writ
e ba
ck o
f im
paire
men
t ass
ocia
te -
--
--
--
49
029
027
49
029
027
- 4
9 02
9 02
7
Non
-con
trol
ling
inte
rest
s on
acqu
isitio
n of
subs
idia
ry-
--
--
--
--
533
591
839
533
591
839
Tran
sact
ions
with
ow
ners
in th
eir c
apac
ity a
s ow
ners
2
848
798
776
295
078
(997
149
)-
--
333
686
145
(3 1
00 0
00)
1 1
08 7
32 8
73(9
55 2
92 8
25)
153
440
047
Div
iden
d de
clar
ed a
nd p
aid
--
--
--
-(3
100
000
)(3
100
000
)(8
54 2
96)
(3 9
54 2
96)
Issu
e of
shar
es 2
848
798
801
936
775
--
--
--
804
785
573
- 8
04 7
85 5
73
Issu
e of
shar
es tr
ansa
ctio
n co
sts
-(2
5 64
1 69
7)-
--
--
-(2
5 64
1 69
7)-
(25
641
697)
Shar
e bu
y-ba
ck20
--
(997
149
)-
--
--
(997
149
)-
(997
149
)
Cha
nge
in o
wne
rshi
p pe
rcen
tage
36
.5-
--
--
- 3
33 6
86 1
45-
333
686
145
(954
438
529
)(6
20 7
52 3
84)
Bala
nce
as a
t 31
Dec
embe
r 202
0 1
8 17
5 44
7 7
87 7
22 1
12(1
023
081
) 4
65 2
30 4
60 8
8 30
4 39
1 5
28 7
13 9
48 3
34 5
01 0
14 2
351
969
692
4 5
73 5
93 9
83 8
03 6
20 0
28 5
377
214
011

35
ZIMRE HOLDINGS LIMITED 2020 ANNUAL REPORT
GRO
UP
STAT
EMEN
T O
F C
HA
NG
ES IN
EQ
UIT
YFO
R T
HE
YEA
R E
ND
ED 3
1 D
ECEM
BER
202
0 (c
ontin
ued)
HIS
TOR
ICA
L C
OST
Not
es
Shar
eca
pita
lZW
L
Shar
epr
emiu
mZW
L
Trea
sury
sh
ares
ZWL
Reva
luat
ion
rese
rve
ZWL
Fina
ncia
l ass
ets
at fa
ir v
alue
th
roug
h ot
her
com
preh
ensi
ve
inco
me
rese
rve
ZWL
Fore
ign
curr
ency
tran
slatio
n re
serv
eZW
L
Cha
nge
in
owne
rshi
pre
serv
eZW
L
Reta
ined
earn
ings
ZWL
Attr
ibut
able
equi
ty h
olde
rsof
par
ent
ZWL
Non
-co
ntro
lling
inte
rest
ZWL
Tota
l equ
ityZW
L
Year
ende
d 31
Dec
embe
r 201
9
Bala
nce
as a
t 1 Ja
nuar
y 20
19, a
s pre
viou
sly
repo
rted
15 3
26 6
4911
427
034
(8 8
86)
14 0
17 0
381
990
559
(8 1
65 7
07)
- 20
803
807
55 3
90 4
9418
714
474
74 1
04 9
68
Cha
nge
in a
ccou
ntin
g po
licy
due
to a
dopt
ion
of IF
RS 1
6 -
- -
- -
- -
(35
430)
(35
430)
- (3
5 43
0)
Bala
nce
as a
t 1 Ja
nuar
y 20
19 a
s res
tate
d15
326
649
11 4
27 0
34(8
886
)14
017
038
1 99
0 55
9(8
165
707
) -
20 7
68 3
7755
355
064
18 7
14 4
7474
069
538
Tota
l com
preh
ensi
ve in
com
e fo
r the
yea
r -
- -
32 3
01 3
0155
267
556
113
740
025
- 26
9 72
9 09
147
1 03
7 97
316
1 71
2 83
663
2 75
0 80
9
Profi
t for
the
year
- -
- -
- -
- 26
9 72
9 09
126
9 72
9 09
114
9 27
8 80
741
9 00
7 89
8
Oth
er co
mpr
ehen
sive
inco
me
for t
he y
ear,
net o
f tax
- -
- 32
301
301
55 2
67 5
5611
3 74
0 02
5 -
- 20
1 30
8 88
212
434
029
213
742
911
Tran
sact
ions
with
ow
ners
in th
eir c
apac
ity a
s ow
ners
-
- (1
7 04
6) -
- -
814
869
- 7
97 8
23(8
14 8
69)
(17
046)
Shar
e bu
y-ba
ck20
- -
(17
046)
- -
- -
- (1
7 04
6) -
(17
046)
Cha
nge
in o
wne
rshi
p pe
rcen
tage
36
.5 -
- -
- -
- 8
14 8
69 -
814
869
(814
869
) -
Bala
nce
as a
t 31
Dec
embe
r 201
915
326
649
11 4
27 0
34(2
5 93
2)46
318
339
57 2
58 1
1510
5 57
4 31
8 8
14 8
6929
0 49
7 46
852
7 19
0 85
917
9 61
2 44
170
6 80
3 30
0
Year
ende
d 31
Dec
embe
r 202
0
Bala
nce
as a
t 1 Ja
nuar
y 20
2015
326
649
11 4
27 0
34(2
5 93
2)46
318
339
57 2
58 1
1510
5 57
4 31
8 8
14 8
6929
0 49
7 46
852
7 19
0 85
917
9 61
2 44
170
6 80
3 30
0
Tota
l com
preh
ensi
ve in
com
e fo
r the
yea
r -
--
418
912
121
31
046
276
423
139
630
- 2
015
543
197
2 8
88 6
41 2
24 1
045
708
573
3 9
34 3
49 7
97
Profi
t for
the
year
- -
--
--
- 2
015
543
197
2 0
15 5
43 1
97 8
56 0
95 7
33 2
871
638
930
Oth
er co
mpr
ehen
sive
inco
me
for t
he y
ear,
net o
f tax
- -
- 4
18 9
12 1
21 3
1 04
6 27
6 4
23 1
39 6
30-
- 8
73 0
98 0
27 1
89 6
12 8
40 1
062
710
867
Writ
e ba
ck o
f im
paire
men
t ass
ocia
te -
--
--
--
49
029
027
49
029
027
- 4
9 02
9 02
7
Non
-con
trol
ling
inte
rest
s on
acqu
isitio
n of
subs
idia
ry-
--
--
--
--
533
591
839
533
591
839
Tran
sact
ions
with
ow
ners
in th
eir c
apac
ity a
s ow
ners
2
848
798
776
295
078
(997
149
)-
--
333
686
145
(3 1
00 0
00)
1 1
08 7
32 8
73(9
55 2
92 8
25)
153
440
047
Div
iden
d de
clar
ed a
nd p
aid
--
--
--
-(3
100
000
)(3
100
000
)(8
54 2
96)
(3 9
54 2
96)
Issu
e of
shar
es 2
848
798
801
936
775
--
--
--
804
785
573
- 8
04 7
85 5
73
Issu
e of
shar
es tr
ansa
ctio
n co
sts
-(2
5 64
1 69
7)-
--
--
-(2
5 64
1 69
7)-
(25
641
697)
Shar
e bu
y-ba
ck20
--
(997
149
)-
--
--
(997
149
)-
(997
149
)
Cha
nge
in o
wne
rshi
p pe
rcen
tage
36
.5-
--
--
- 3
33 6
86 1
45-
333
686
145
(954
438
529
)(6
20 7
52 3
84)
Bala
nce
as a
t 31
Dec
embe
r 202
0 1
8 17
5 44
7 7
87 7
22 1
12(1
023
081
) 4
65 2
30 4
60 8
8 30
4 39
1 5
28 7
13 9
48 3
34 5
01 0
14 2
351
969
692
4 5
73 5
93 9
83 8
03 6
20 0
28 5
377
214
011

36
ZIMRE HOLDINGS LIMITED 2020 ANNUAL REPORT
GROUP STATEMENT OF CASH FLOWS FOR THE YEAR ENDED 31 DECEMBER 2020
INFLATION ADJUSTED HISTORICAL COST
Notes
Group2020ZWL
Group2019ZWL
Group2020ZWL
Group2019ZWL
Profit before income tax 1 048 332 733 601 673 894 2 969 231 508 437 584 402
Adjustments for non-cash items:
Net monetary loss 423 411 345 71 428 - -
Depreciation 8 28 750 768 36 447 674 13 587 987 2 374 852
Lease depreciation charge 9 26 069 849 9 612 583 6 123 309 772 721
Fair value adjustments on investment property 10 (813 137 671) (774 509 637) (2 671 608 387) (433 304 102)
Amortisation of intangible assets 11 1 978 409 2 078 677 819 336 105 617
Share of profit of associate 13 (98 051 834) (20 384 899) (121 600 187) (3 648 161)
Movement in life reassurance contract liabilities 22 28 039 632 32 738 384 17 893 300 3 179 200
Movement in life assurance contract liabilities 4 119 738 937 - 4 119 738 937 -Movement in allowance for credit losses 16 126 053 819 287 732 604 146 541 931 27 908 132
Movement in deferred acquisition costs 17 (48 094 350) 5 420 461 (74 448 336) (9 476 412)Movement in short term insurance contract liabilities 21 314 545 245 220 123 748 215 302 423 23 822 140
Movement in other provisions 24 61 928 144 116 758 755 39 517 672 11 324 349
Profit from disposal of property and equipment 33 (950 659) (1 231 141) (1 099 159) (117 279)
Loss from disposal of investment property 33 1 047 759 - 160 379 -Fair value gains on financial assets at fair valuethrough profit or loss 33 28 751 411 159 315 275 (57 171 162) (3 434 226)
Unrealised exchange (gains)/losses 33 (98 435 657) 39 731 318 (98 435 657) 8 879 980
Fair value on remeasurement of associate (51 113 672) - (19 177 952) -
Impairment reversal of investment in CFI (359 096 204) - (10 824 334) -
Adjustments for separately disclosed items:
Finance costs 11 989 458 22 542 393 9 509 571 1 355 760
Dividend received 32 (5 793 159) (13 623 626) (3 844 106) (1 150 412)
Interest received 32 (23 042 031) (35 112 015) (22 816 669) (3 624 637)
Working capital changes:
Increase in trade and other receivables (448 307 569) (11 227 998) (1 066 567 392) (134 135 699)
Decrease/(increase) in inventory (67 252 038) 8 333 356 (3 792 575) (109 515)
Increase/(decrease) in trade and other payables 576 617 944 412 865 775 1 228 741 680 171 895 659
Cash flows from operations 4 783 980 609 1 099 357 009 4 615 782 117 100 202 369
Finance costs (11 989 458) (22 542 393) (9 509 571) (1 355 760)
Income tax paid (13 876 390) (8 976 951) (13 129 865) (1 016 213)
Net cash flows from operating activities 4 758 114 761 1 067 837 665 4 593 142 682 97 830 396

37
ZIMRE HOLDINGS LIMITED 2020 ANNUAL REPORT
GROUP STATEMENT OF CASH FLOWS FOR THE YEAR ENDED 31 DECEMBER 2020 (continued)
INFLATION ADJUSTED HISTORICAL COST
Notes
Group2020ZWL
Group2019ZWL
Group2020ZWL
Group2019ZWL
Cash flows from investing activities
Purchase of property and equipment 8 (57 587 362) (40 248 585) (45 106 737) (4 271 076)
Purchase of intangible assets - software 11.1 (25 991 585) (491 452) (25 308 651) (109 556)Acquisition and development of investment property 10 (3 180 123 613) (169 737 792) (2 829 204 655) (11 203 014)
Acquisition of an associate 12 (13 426 719) (23 240 850) (7 727 058) (2 715 932)
Purchase of financial assets at amortised cost 18.1 (154 562 437) (78 231 685) (31 164 429) (8 742 077)
Purchase of financial assets at fair value through
profit or loss 18.2 (519 045 674) (71 330 851) (592 487 627) (2 785 652)
Purchase of financial assets at FVOCI 18.3 - (25 944 452) - (2 518 957)
Proceeds from disposal of financial assets at
amortised cost 18.1 102 082 402 13 155 924 10 134 513 2 070 625
Proceeds from disposal of financial assets
through profit or loss 18.2 367 035 255 34 817 138 176 700 496 231 728Proceeds from disposal of financial assets at FVOCI 18.3 336 351 - 336 351 -
Dividends received 32 5 793 159 13 623 626 3 844 106 1 150 412
Interest received 32 23 042 031 35 112 015 22 816 669 3 624 637
Proceeds from sale of property and equipment 8 824 130 9 104 615 3 233 234 2 251 354
Cash (used in) investing activities (3 443 624 062) (303 412 349) (3 313 933 788) (23 017 508)
Financing activities
Dividends paid to Company shareholders 37 (5 307 862) - (3 100 000) -Dividends paid to non-controlling interests in subsidiaries (1 462 564) - (854 296) -
Share issue transaction costs (25 641 697) - (25 641 697) -
Loan drawdown 23 9 150 288 42 653 902 9 150 288 3 940 000
Loan repayment 23 (10 022 140) (25 339 898) (7 112 332) (2 248 072)
Lease payments 9 (19 665 873) (7 285 622) (38 076 451) (707 364)
Share buy-back 20 (1 039 000) (79 938) (997 149) (17 046)
Cash (used in)/generated from financing activities (53 988 849) 9 948 444 (66 631 637) 967 518-
Inflation effect (347 068 090) (827 222 244) - -
Net increase in cash and cash equivalents 1 273 437 457 774 373 760 1 228 924 054 75 780 405
Cash and cash equivalents at the beginning of the year 410 188 652 272 858 292 91 440 449 9 792 554Effects of exchange rate changes on cash and cash equivalents (153 168 696) 190 178 844 (153 168 696) 5 867 490
-
Cash and cash equivalents at the end of the year 19 1 183 389 323 410 188 652 1 183 389 323 91 440 449

38
ZIMRE HOLDINGS LIMITED 2020 ANNUAL REPORT
dmp.credsure.co.zw

39
ZIMRE HOLDINGS LIMITED 2020 ANNUAL REPORT
COMPANY STATEMENT OF FINANCIAL POSITIONAS AT 31 DECEMBER 2020
INFLATION ADJUSTED HISTORICAL COST
ASSETS Notes
Company2020ZWL
Company2019ZWL
Company2020ZWL
Company2019ZWL
Property and equipment 8 2 309 420 5 388 710 69 623 162 454Right of use of assets 9 8 218 290 29 766 693 2 136 735 1 068 315Investment in subsidiaries 12 2 209 658 282 1 391 445 988 856 475 991 43 963 360Investment in associates 13 23 657 957 28 651 137 713 218 863 749Deferred tax assets - - 448 851 - Other receivables and prepayments 16 3 334 559 2 998 035 3 334 559 668 331Financial assets :- at amortised cost 18.1 46 864 210 225 46 864 46 864- at fair value through profit or loss 18.2 6 390 221 20 950 580 6 390 221 4 670 364- at fair value through other comprehensive income 18.3 25 667 737 56 927 150 25 667 737 12 690 366Cash and cash equivalents 19 12 104 747 2 547 650 12 104 747 567 929Total assets 2 291 388 077 1 538 886 168 907 388 546 64 701 732
EQUITY AND LIABILITIESEQUITYEquity attributable to equity holders of the parentShare capital 20 511 388 554 508 539 754 18 175 447 15 326 649Share premium 1 155 337 539 379 042 460 787 722 113 11 427 034Treasury shares (1 558 126) (519 126) (1 023 081) (25 932)Financial assets at fair value through othercomprehensive income reserve (14 545 720) 16 367 640 19 597 157 6 763 449Retained earnings 573 068 920 561 067 961 17 854 896 16 712 356Total equity 2 223 691 167 1 464 498 689 842 326 532 50 203 556
LIABILITIESDeferred tax liabilities 14 2 634 896 9 809 835 - 102 341Lease liabilities 9 2 105 260 4 973 013 2 105 260 1 108 599Other provisions 24 3 144 058 964 581 3 144 058 215 027Trade and other payables 25 59 520 763 58 640 050 59 520 763 13 072 209Bank overdraft 291 933 291 933Total liabilities 67 696 910 74 387 479 65 062 014 14 498 177
TOTAL EQUITY AND LIABILITIES 2 291 388 077 1 538 886 168 907 388 546 64 701 732
dmp.credsure.co.zw

40
ZIMRE HOLDINGS LIMITED 2020 ANNUAL REPORT
COMPANY STATEMENT OF COMPREHENSIVE INCOMEFOR THE YEAR ENDED 31 DECEMBER 2020
INFLATION ADJUSTED HISTORICAL COST
INCOME Notes
Company2020ZWL
Company2019ZWL
Company2020ZWL
Company2019ZWL
Investments income 32 1 331 824 2 281 040 1 037 100 144 108Other gains/(losses) 33 16 416 984 (79 441 681) 25 598 628 1 071 720Total income 17 748 808 (77 160 641) 26 635 728 1 215 828
EXPENDITUREOperating and administrative expenses 34 (61 419 896) (56 799 791) (22 877 863) (4 505 047)Net impairment losses on financial assets - - - -Finance costs (361 294) (1 080 400) (210 180) (106 472)
Total expenses (61 781 190) (57 880 191) (23 088 043) (4 611 519)Gains/(losses) on net monetary position 69 176 454 184 612 813 - -
Profit/(loss) before tax 25 144 072 49 571 981 3 547 685 (3 395 691)
Income tax (expense)/credit 14.3 (7 835 252) (5 577 462) 694 856 10 672
Profit/(loss) for the year 17 308 820 43 994 519 4 242 541 (3 385 019)
OTHER COMPREHENSIVE INCOMEItems that will not be reclassified to profit or lossItems that may be reclassified to profit or loss:Fair value gains for financial assets at FVOCI 18.3 (31 259 413) 13 020 985 12 977 371 11 114 591Income tax relating to components of other comprehen-sive income 346 053 (74 254) (143 664) (63 382)Other comprehensive (loss)/income for the year net of tax (30 913 360) 12 946 731 12 833 707 11 051 209
Total comprehensive income for the year (13 604 540) 56 941 250 17 076 248 7 666 190
Profit/(loss) attributable to:Equity holders of Zimre Holdings Limited 17 308 819 43 994 519 4 242 541 (3 385 019)Non-controlling interests - - - -
17 308 819 43 994 519 4 242 541 (3 385 019)
Total comprehensive (loss)/income attributable to:Equity holders of Zimre Holdings Limited (13 604 540) 56 941 250 17 076 248 7 666 190Non-controlling interests - - - -
(13 604 540) 56 941 250 17 076 248 7 666 190
Earnings per share from profit of continuingoperations attributable to owners of ZimreHoldings LimitedBasic and diluted earnings per share (ZWL cents): 35 1.13 2.87 0.28 (0.22)

41
ZIMRE HOLDINGS LIMITED 2020 ANNUAL REPORT
COMPANY STATEMENT OF CHANGES IN EQUITYFOR THE YEAR ENDED 31 DECEMBER 2020
INFLATION ADJUSTED NotesShare capital
ZWL
Sharepremium
ZWL
Treasury shares ZWL
Financialassets at fair
value throughother
comprehen-sive
incomereserve
ZWL
Retainedearnings
ZWL Total
ZWL
Balance as at 31 December 2019
Balance as at 1 January 2019 508 539 754 379 042 460 (439 188) 3 420 909 517 176 889 1 407 740 824
Change in accounting policy due toadoption of IFRS 16 - - - - (103 444) (103 444)
Balance as at 1 January 2019, as restated 508 539 754 379 042 460 (439 188) 3 420 909 517 073 445 1 407 637 380
Total comprehensive income for the year - - - 12 946 731 43 994 519 56 941 250
Profit for the year - - - - 43 994 519 43 994 519
Other comprehensive income for theyear, net of tax - - - 12 946 731 - 12 946 731
Transactions with owners in their capacity as owners - - (79 938) - - (79 941)
Dividend declared and paid 37 - - - - - -
Share buyback 20 - - (79 938) - - (79 941)
Balance as at 31 December 2019 508 539 754 379 042 460 (519 126) 16 367 640 561 067 964 1 464 498 689
Year ended 31 December 2020
Balance as at 1 January 2020, as restated 508 539 754 379 042 460 (519 126) 16 367 640 561 067 964 1 464 498 692
Total comprehensive income for the year - - - (30 913 360) 17 308 819 (13 604 541)
Profit for the year - - - - 17 308 819 17 308 819
Other comprehensive income for the
year, net of tax - - - (30 913 360) - (30 913 360)
Transactions with owners in theircapacity as owners 2 848 800 776 295 079 (1 039 000) - (5 307 862) 772 797 016
Dividend declared and paid 37 - - - - (5 307 862) (5 307 862)
Issue of shares 2 848 800 801 936 775 804 785 575
Issue of shares transaction costs (25 641 696) (25 641 696)
Share buyback 20 - - (1 039 000) - - (1 039 000)
Balance as at 31 December 2020 511 388 554 1 155 337 539 (1 558 126) (14 545 720) 573 068 921 2 223 691 167

42
ZIMRE HOLDINGS LIMITED 2020 ANNUAL REPORT
COMPANY STATEMENT OF CHANGES IN EQUITYFOR THE YEAR ENDED 31 DECEMBER 2020 (continued)HISTORICAL COST
NotesShare capital
ZWL
Sharepremium
ZWL
Treasury shares ZWL
Financialassets at fair
value throughother
comprehen-sive
incomereserve
ZWL
Retainedearnings
ZWL Total
ZWL
Year ended 31 December 2019
Balance as at 1 January 2019 15 326 649 11 427 034 (8 886) (4 287 759) 20 101 086 42 558 124
Change in accounting policy due toadoption of IFRS 16 - - - - (3 713) (3 713)
Balance as at 1 January 2019, as restated 15 326 649 11 427 034 (8 886) (4 287 759) 20 097 373 42 554 411
Comprehensive income for the year - - - 11 051 209 (3 385 018) 7 666 191
Profit for the year - - - - (3 385 018) (3 385 018)
Other comprehensive income for theyear, net of tax - - - 11 051 209 - 11 051 209
Transactions with owners in their capac-ity as owners - - (17 046) - - (17 046)
Dividend declared and paid 37 - - - - - -
Share buyback 20 - - (17 046) - - (17 046)
Balance as at 31 December 2019 15 326 649 11 427 034 (25 932) 6 763 450 16 712 355 50 203 556
Year ended 31 December 2020
Balance as at 1 January 2020 15 326 649 11 427 034 (25 932) 6 763 450 16 712 355 50 203 556
Change in accounting policy due toadoption of IFRS 16 2.30 - - - - - -
Balance as at 1 January 2020, as restated 15 326 649 11 427 034 (25 932) 6 763 450 16 712 355 50 203 556
Comprehensive income for the year - - - 12 833 707 4 242 541 17 076 248
Profit for the year - - - - 4 242 541 4 242 541
Other comprehensive income for the
year, net of tax - - - 12 833 707 - 12 833 707
Transactions with owners in their capac-ity as owners 2 848 799 776 295 079 (997 149) - (3 100 000) 775 046 729
Dividend declared and paid 37 - - - - (3 100 000) (3 100 000)
Issue of shares 2 848 799 801 936 775 - - - 804 785 574
Issue of shares transaction costs - (25 641 696) - - - (25 641 696)
Share buyback 20 - - (997 149) - - (997 149)
Balance as at 31 December 2020 18 175 448 787 722 113 (1 023 081) 19 597 157 17 854 896 842 326 533
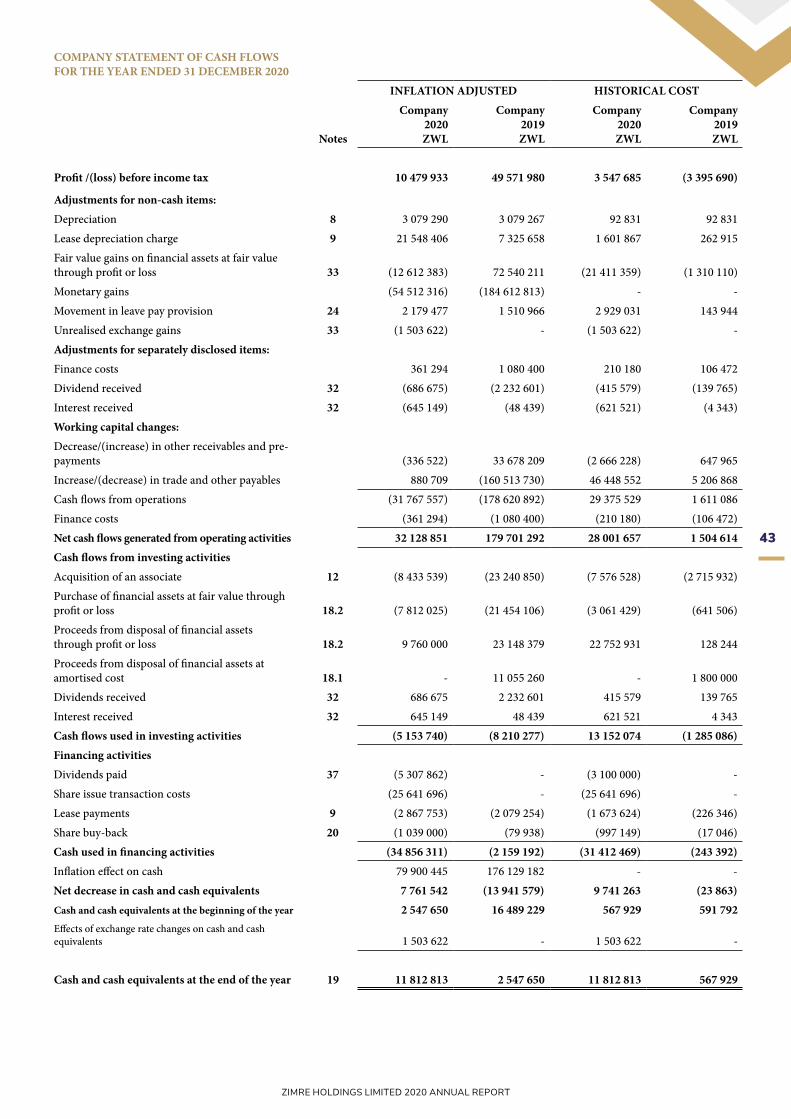
43
ZIMRE HOLDINGS LIMITED 2020 ANNUAL REPORT
COMPANY STATEMENT OF CASH FLOWSFOR THE YEAR ENDED 31 DECEMBER 2020
Notes
INFLATION ADJUSTED HISTORICAL COSTCompany
2020ZWL
Company2019ZWL
Company2020ZWL
Company2019ZWL
Profit /(loss) before income tax 10 479 933 49 571 980 3 547 685 (3 395 690)
Adjustments for non-cash items:Depreciation 8 3 079 290 3 079 267 92 831 92 831Lease depreciation charge 9 21 548 406 7 325 658 1 601 867 262 915Fair value gains on financial assets at fair valuethrough profit or loss 33 (12 612 383) 72 540 211 (21 411 359) (1 310 110)Monetary gains (54 512 316) (184 612 813) - -Movement in leave pay provision 24 2 179 477 1 510 966 2 929 031 143 944Unrealised exchange gains 33 (1 503 622) - (1 503 622) -Adjustments for separately disclosed items:Finance costs 361 294 1 080 400 210 180 106 472Dividend received 32 (686 675) (2 232 601) (415 579) (139 765)Interest received 32 (645 149) (48 439) (621 521) (4 343)Working capital changes:Decrease/(increase) in other receivables and pre-payments (336 522) 33 678 209 (2 666 228) 647 965Increase/(decrease) in trade and other payables 880 709 (160 513 730) 46 448 552 5 206 868Cash flows from operations (31 767 557) (178 620 892) 29 375 529 1 611 086Finance costs (361 294) (1 080 400) (210 180) (106 472)Net cash flows generated from operating activities 32 128 851 179 701 292 28 001 657 1 504 614Cash flows from investing activitiesAcquisition of an associate 12 (8 433 539) (23 240 850) (7 576 528) (2 715 932)Purchase of financial assets at fair value throughprofit or loss 18.2 (7 812 025) (21 454 106) (3 061 429) (641 506)Proceeds from disposal of financial assetsthrough profit or loss 18.2 9 760 000 23 148 379 22 752 931 128 244Proceeds from disposal of financial assets atamortised cost 18.1 - 11 055 260 - 1 800 000Dividends received 32 686 675 2 232 601 415 579 139 765Interest received 32 645 149 48 439 621 521 4 343Cash flows used in investing activities (5 153 740) (8 210 277) 13 152 074 (1 285 086)Financing activitiesDividends paid 37 (5 307 862) - (3 100 000) -Share issue transaction costs (25 641 696) - (25 641 696) -Lease payments 9 (2 867 753) (2 079 254) (1 673 624) (226 346)Share buy-back 20 (1 039 000) (79 938) (997 149) (17 046)Cash used in financing activities (34 856 311) (2 159 192) (31 412 469) (243 392)Inflation effect on cash 79 900 445 176 129 182 - -Net decrease in cash and cash equivalents 7 761 542 (13 941 579) 9 741 263 (23 863)Cash and cash equivalents at the beginning of the year 2 547 650 16 489 229 567 929 591 792Effects of exchange rate changes on cash and cash equivalents 1 503 622 - 1 503 622 -
Cash and cash equivalents at the end of the year 19 11 812 813 2 547 650 11 812 813 567 929

44
ZIMRE HOLDINGS LIMITED 2020 ANNUAL REPORT
NOTES TO THE FINANCIAL STATEMENTSFOR THE YEAR ENDED 31 DECEMBER 2020
1 GENERAL INFORMATIONThe principal activities of Zimre Holdings Limited (the “Company” or “ZHL”) and its subsidiaries and associates (together “the Group”) is the provision of life assurance, non life insurance (general insurance and reinsurance) healthcare, funeral assurances, property management and development services, asset management and micro-lending. The Group also has an associate in the agro-industrial sector.
Zimre Holdings Limited is a public company incorporated and domiciled in Zimbabwe whose shares are publicly traded on the Zimbabwe Stock Exchange (“ZSE”). The registered office is located at Block D, 2nd Floor, Smatsatsa Office Park, Stand Number 10667, Borrowdale, Harare, Zimbabwe.
The financial statements of the Group for the year ended 31 December 2020 were authorised for issue by a resolution of the Board of Directors on 29 June 2021.
1.1 Acquisition of Fidelity life Assurance of Zimbabwe LimitedOn 30 September 2020, the shareholders of Zimre Holdings Limited (“ZHL”) approved the acquisition by ZHL of 38 224 928 issued shares of Fidelity Life Assurance of Zimbabwe Limited (“FLA”) from NSSA. The shares constituted 35.09% of the entire shareholding in FLA, held by NSSA and was settled through the issuance of new ZHL ordinary shares on the basis of 1 ZHL ordinary share for every 0.59 FLA shares held by NSSA. The acquisition of FLA shares by ZHL, the company now has 66.95% shareholding in FLA. Prior to this, FLA was accounted for as an associate.
2 SUMMARY OF SIGNIFICANT ACCOUNTING POLICIESThe principal accounting policies applied in the preparation of these financial statements are set out below. These policies have been consistently applied to all the years presented, unless otherwise stated.
2.1
Basis of preparationThese financial statements for the year ended 31 December 2020 have been prepared in accordance with International Financial Reporting Standards (“IFRS”), except for non-compliance with International Accounting Standard 21, (“IAS 21”), ‘The effects of foreign exchange rates’ and IAS 29, ‘Financial reporting in hyper-inflationary economies’.
2.1.2 Compliance statementThese financial statements for the year ended 31 December 2020 have been prepared in accordance with International Financial Reporting Standards and in a manner required by the Zimbabwe Companies and Other Business Entities Act [Chapter 24:31], except for non-compliance with International Accounting Standard (“IAS”) 21, ‘The effects of foreign exchange rates’ which also led to non-compliance with IAS 29, ‘Financial reporting in hyper-inflationary economies’.
2.1.3 a) Hyperinflation accountingOn 9 July 2019, the Public Accountants and Auditors Board (“PAAB”) issued Pronouncement 01/2019, which advised that Zimbabwe had met all the conditions for the application of IAS 29 effective for financial reporting periods ending on or after 1 July 2019. These hyper-inflationary conditions persisted into the current reporting period, making the application of IAS 29 imperative. For purposes of fair presentation in accordance with IAS 29, the historical cost financial information has been restated for changes in the general purchasing power of the Zimbabwe dollar. Accordingly, the inflation adjusted financial statements represent the primary financial statements of the Group. In line with the provisions of IAS 29, the historical cost financial information has been provided by way of supplementary information only.
IAS 29 requires that the financial statements of an entity whose functional currency is the currency of a hyper-inflationary economy be stated in terms of the measuring unit current at the reporting date and that the corresponding figures for the comparative periods be stated in the same terms .These financial statements and the corresponding figures for the previous years have been restated to take account of the changes in the general purchasing power of the ZWL. The restatement is based on conversion factors derived from the Zimbabwe Consumer Price Index (“CPI”) compiled by the Zimbabwe National Statistics Agency from the figures published by the Reserve Bank of Zimbabwe. The indices and conversion factors used are as follows:
Dates IndexConversion
Factor
31 December 2020 2474.51 1.000
31 December 2019 551.63 4.49
31 December 2018 88.81 27.86
31 October 2018 74.6 33.17
31 December 2017 61.13 40.48
Averages
31 December 2020 1579.09 1.57
31 December 2019 240.27 10.30
31 December 2018 61.13 40.48
31 December 2017 67.63 36.59

45
ZIMRE HOLDINGS LIMITED 2020 ANNUAL REPORT
NOTES TO THE FINANCIAL STATEMENTSFOR THE YEAR ENDED 31 DECEMBER 2020 (continued)
2 SUMMARY OF SIGNIFICANT ACCOUNTING POLICIES (continued)Basis of preparation (continued)
b) Functional and presentation currencyThe financial statements are presented in Zimbabwe dollar (“ZWL”) which is both the functional and presentation currency of the Group. Zimbabwe witnessed significant monetary and exchange control policy changes from 2016 through to 2020. These changes resulted in the promulgation of S.I. 33 of 2019 on 22 February 2019 which introduced the Real Time Gross Settlement (“RTGS”) dollar and the use of the interbank market. In the current financial year up to 22 June 2020, the Group translated foreign currency denominated balances using the interbank rate in line with S.I. 33 of 2019. The rate was fixed at 1:25 for the greater part of that period of the year. However, following the introduction of the Foreign Currency Auction Trading System on 23 June 2020, foreign currency denominated balances were translated to ZWL using the auction rate.(c) Transactions and balancesForeign currency transactions are translated into the functional currency using the exchange rates prevailing at the dates of transactions or valuation where items are re-measured. Foreign exchange gains or losses resulting from the settlement of such transactions and from the translation of monetary assets and liabilities denominated in foreign currencies, are generally recognised in the statement of profit or loss.Foreign exchange gains and losses that relate to borrowings are presented in the statement of profit or loss, within finance costs. All other foreign exchange gains and losses are presented in the statement of profit or loss on a net basis within other gains/(losses).Non-monetary items that are measured at fair value in a foreign currency are translated using the exchange rates at the date when the fair value was determined. Translation differences on assets and liabilities carried at fair value are reported as part of the fair value gain or loss. For example, translation differences on non-monetary assets and liabilities such as equities held at fair value through profit or loss are recognised in profit or loss as part of the fair value gain or loss, and translation differences on non-monetary assets such as equities classified as at fair value through other comprehensive income are recognised in other comprehensive income. (d) Group companiesThe results and financial positions of all the Group’s subsidiaries and associates that have a functional currency different from theZWL (none of which is a currency of a hyper-inflationary economy) are translated into ZWL as follows:i. income and expenses for each statement of profit or loss and statement of comprehensive income are translated at average foreign
currency exchange rate;ii. assets and liabilities for each statement of financial position are translated at the closing foreign currency exchange rate at the date
of the statement of financial position; andiii. all resulting foreign currency exchange rate differences are recognised in other comprehensive income.
On consolidation, exchange differences arising from the translation of any net investment in foreign entities, and of borrowings and other financial instruments designated as hedges of such investments, are recognised in other comprehensive income. When a foreign operation is sold or any borrowings forming part of the net investment is repaid, the associated exchange differences are reclassified to profit or loss, as part of the gain or loss on sale.

46
ZIMRE HOLDINGS LIMITED 2020 ANNUAL REPORT
NOTES TO THE FINANCIAL STATEMENTSFOR THE YEAR ENDED 31 DECEMBER 2020 (continued)
2 SUMMARY OF SIGNIFICANT ACCOUNTING POLICIES (continued)2.1 Basis of preparation and presentation (continued)
2.1.4 New standards, amendments and interpretations, effective for the first time for 31 December 2020 year ends that are relevant to the Group
Number Effective date Executive summary
Amendment to IFRS 3, ‘Business combinations’ 1 January 2020
This amendment revises the definition of a business. According to feedback received by the International Accounting Standards Board (“IASB”), application of the current guidance is commonly thought to be too complex, and it results in too many transactions qualifying as business combinations. More acquisitions are likely to be accounted for as asset acquisitions.
Definition of a business 1 January 2020
To be considered a business, an acquisition would have to include an input and a substantive process that together significantly contribute to the ability to create outputs. The new guidance provides a framework to evaluate when an input and a substantive process are present (including for early stage companies that have not generated outputs). To be a business without outputs, there will now need to be an organised workforce.
Amendment to IAS 1, ‘Presentation of financial statements’ and IAS 8, ‘Accounting policies, changes in accounting estimates and errors’ on the definition of material.
1 January 2020 These amendments to IAS 1 and IAS 8 and consequential amendments to other IFRSs:
• use a consistent definition of materiality through IFRSs and the Conceptual Framework for Financial Reporting;
• clarify the explanation of the definition of material; and• incorporate some of the guidance in IAS 1 about immaterial information. The amended definition is:“Information is material if omitting, misstating or obscuring it could reasonably be expected to influence decisions that the primary users of general purpose financial statements make on the basis of those financial statements, which provide financial information about a specific reporting entity.”
Amendments to IFRS 9, ‘Financial instruments’,
1 January 2020 (early adoption is permitted)
These amendments provide certain reliefs in connection with interest rate benchmark reform (“IBOR”). The reliefs relate to hedge accounting and have the effect that IBOR should not generally cause hedge accounting to terminate. However, any hedge ineffectiveness should continue to be recorded in the income statement.
IAS 39, ‘Financial instruments: recognition and measurement’ and IFRS 7, ‘Financial instruments: disclosure’ – interest rate benchmark reform (Phase 1)
New standards, amendments and interpretations issued but not effective for 31 December 2020 year ends that are relevant to the Company and have not been early adopted.
Number Effective date Executive summary
IFRS 16, ‘Leases’ COVID-19-Related rent concessions amendment 1 June 2020
The IASB has provided lessees (but not lessors) with relief in the form of an optional exemption from assessing whether a rent concession related to COVID-19 is a lease modification, provided that the concession meets certain conditions. Lessees can elect to account for qualifying rent concessions in the same way as they would if they were not lease modifications. In many cases, this will result in accounting for the concession as a variable lease payment.

47
ZIMRE HOLDINGS LIMITED 2020 ANNUAL REPORT
NOTES TO THE FINANCIAL STATEMENTSFOR THE YEAR ENDED 31 DECEMBER 2020 (continued)
2 SUMMARY OF SIGNIFICANT ACCOUNTING POLICIES (continued)2.1 Basis of preparation and presentation (continued)
2.1.4 New standards, amendments and interpretations, effective for the first time for 31 December 2020 year ends that are relevant to the Group (continued)Number Effective date Executive summaryAmendments to IFRS 9 ‘Financial instruments’, IAS 39 ‘Financial instruments: recognition and measurement’, IFRS 7 ‘Financial instruments: disclosures’, IFRS 4 ‘Insurance contracts’ and IFRS 16 ‘Leases’ – interest rate benchmark (“IBOR”) reform (Phase 2)
1 January 2021The Phase 2 amendments address issues that arise from the implementation of the reform of an interest rate benchmark, including the replacement of one benchmark with an alternative one.
Amendment to IAS 1 ‘Presentation of financial statements’ on classification of liabilities as current or non-current
1 January 2022
The amendment clarifies that liabilities are classified as either current or non-current, depending on the rights that exist at the end of the reporting period. Classification is unaffected by expectations of the entity or events after the reporting date (for example, the receipt of a waiver or a breach of covenant).
Amendment to IFRS 3, ‘Business combinations’ 1 January 2022
The IASB has updated IFRS 3, ‘Business combinations’, to refer to the 2018 Conceptual Framework for Financial Reporting, in order to determine what constitutes an asset or a liability in a business combination. In addition, the Board added a new exception in IFRS 3 for liabilities and contingent liabilities. The exception specifies that, for some types of liabilities and contingent liabilities, an entity applying IFRS 3 should instead refer to IAS 37, ‘provisions, contingent liabilities and contingent cssets’, or IFRIC 21, ‘Levies’, rather than the 2018 Conceptual Framework.The IASB has also clarified that the acquirer should not recognise contingent assets, as defined in IAS 37, at the acquisition date.
Amendments to IAS 16 ‘Property, plant and equipment’ on proceeds before intended use
1 January 2022
The amendment to IAS 16 prohibits an entity from deducting from the cost of an item of property, plant and equipment any proceeds received from selling items produced while the entity is preparing the asset for its intended use (for example, the proceeds from selling samples produced when testing a machine to see if it is functioning properly). The proceeds from selling such items, together with the costs of producing them, are recognised in profit or loss.
Amendments to IAS 37 ‘Provisions, contingent liabilities and contingent assets’ on onerous contracts—cost of fulfilling a contract
1 January 2022
The amendment clarifies which costs an entity includes in assessing whether a contract will be loss-making. This assessment is made by considering unavoidable costs, which are the lower of the net cost of exiting the contract and the costs to fulfil the contract. The amendment clarifies the meaning of ‘costs to fulfil a contract’. Under the amendment, costs to fulfil a contract include incremental costs and the allocation of other costs that relate directly to fulfilling the contract.
Annual improvements cycle 2018 -2020 1 January 2022
These amendments include minor changes to: • IFRS 1, ‘First time adoption of IFRS’ has been amended for a subsidiary that
becomes a first-time adopter after its parent. The subsidiary may elect to measure cumulative translation differences for foreign operations using the amounts reported by the parent at the date of the parent’s transition to IFRS.
• IFRS 9, ‘Financial instruments’ has been amended to include only those costs or fees paid between the borrower and the lender in the calculation of “the 10% test” for derecognition of a financial liability. Fees paid to third parties are excluded from this calculation.
• IFRS 16, ‘Leases’, amendment to the illustrative example 13 that accompanies IFRS 16 to remove the illustration of payments from the lessor relating to leasehold improvements. The amendment intends to remove any potential confusion about the treatment of lease incentives.
• IAS 41, ‘Agriculture’ has been amended to align the requirements for measuring fair value with those of IFRS 13. The amendment removes the requirement for entities to exclude cash flows for taxation when measuring fair value.

48
ZIMRE HOLDINGS LIMITED 2020 ANNUAL REPORT
NOTES TO THE FINANCIAL STATEMENTSFOR THE YEAR ENDED 31 DECEMBER 2020 (continued)
2 SUMMARY OF SIGNIFICANT ACCOUNTING POLICIES (continued)2.1 Basis of preparation and presentation (continued)
2.1.4 New standards, amendments and interpretations, effective for the first time for 31 December 2020 year ends that are relevant to the Group (continued)Number Effective date Executive summary
IFRS 17, ‘Insurance contracts’
1 January 2023
Early application is permitted for entities that apply IFRS 9, ‘Financial i n s t r u m e n t s ’, and IFRS 15, ‘Revenue from contracts with customers’, at or before the date of initial application of IFRS 17.
The IASB issued IFRS 17, ‘Insurance contracts’, and thereby started a new epoch of accounting for insurers. Whereas the current standard, IFRS 4, allows insurers to use their local GAAP, IFRS 17 defines clear and consistent rules that will significantly increase the comparability of financial statements. For insurers, the transition to IFRS 17 will have an impact on financial statements and on key performance indicators.
Under IFRS 17, the general model requires entities to measure an insurance contract at initial recognition at the total of the fulfilment cash flows (comprising the estimated future cash flows, an adjustment to reflect the time value of money and an explicit risk adjustment for non-financial risk) and the contractual service margin. The fulfilment cash flows are remeasured on a current basis each reporting period. The unearned profit (contractual service margin) is recognised over the coverage period.
Aside from this general model, the standard provides, as a simplification, the premium allocation approach. This simplified approach is applicable for certain types of contract, including those with a coverage period of one year or less.
For insurance contracts with direct participation features, the variable fee approach applies. The variable fee approach is a variation on the general model. When applying the variable fee approach, the entity’s share of the fair value changes of the underlying items is included in the contractual service margin. Consequently, the fair value changes are not recognised in profit or loss in the period in which they occur but over the remaining life of the contract.
IFRS 17, ‘Insurance contracts’ Amendments 1 January 2023
In response to some of the concerns and challenges raised, the IASB developed targeted amendments and several proposed clarifications intended to ease implementation of IFRS 17, simplify some requirements of the standard and ease transition. The amendments are not intended to change the fundamental principles of the standard or unduly disrupt implementation already underway.
There are no other standards, amendments and interpretations that are not yet effective that are likely to have a material impact on the financial statements of the Group and Company.
2.2 Principles of consolidation and equity accounting
GroupThe consolidated financial statements comprise the financial statements of Zimre Holdings Limited (the “Company”) and its subsidiaries and associates.(a) SubsidiariesSubsidiaries are all entities (including structured entities) over which the Group has control. The Group controls an entity when the Group is exposed to, or has rights to, variable returns from its involvement with the entity and has the ability to affect those returns through its power over the entity. Subsidiaries are fully consolidated from the date on which control is transferred to the Group. They are deconsolidated from the date that control ceases.Specifically, the Group controls an investee if and only if the Group has:• power over the investee (i.e. existing rights that give it the current ability to direct the relevant activities of the investee)• exposure, or rights, to variable returns from its involvement with the investee, and• the ability to use its power over the investee to affect its returns.
When the Group has less than a majority of the voting or similar rights of an investee, the Group considers all relevant facts and circumstances in assessing whether it has power over an investee, including:• the contractual arrangement with the other vote holders of the investee;• rights arising from other contractual arrangements; or• the Group’s voting rights and potential voting rights.

49
ZIMRE HOLDINGS LIMITED 2020 ANNUAL REPORT
NOTES TO THE FINANCIAL STATEMENTSFOR THE YEAR ENDED 31 DECEMBER 2020 (continued)
2 SUMMARY OF SIGNIFICANT ACCOUNTING POLICIES (continued)2.2 Principles of consolidation and equity accounting (continued)
The Group re-assesses whether or not it controls an investee if facts and circumstances indicate that there are changes to one or more of the three elements of control. Consolidation of a subsidiary begins when the Group obtains control of the subsidiary and ceases when the Group loses control of the subsidiary. Assets, liabilities, income and expenses of a subsidiary acquired during the year are included in the statement of comprehensive income and statement of financial position from the date the Group gains control until the date the Group ceases to control the subsidiary.
The Group applies the acquisition method to account for business combinations. The consideration transferred for the acquisition of a subsidiary is the fair values of the assets transferred, the liabilities incurred to the former owners of the acquiree and the equity interests issued by the Group. The consideration transferred includes the fair value of any asset or liability resulting from a contingent consideration arrangement and fair value of any pre-existing equity interest in the subsidiary. Identifiable assets acquired and liabilities and contingent liabilities assumed in a business combination are measured initially at their fair values at the acquisition date. The Group recognises any non-controlling interest in the acquiree on an acquisition-by-acquisition basis, either at fair value or at the non-controlling interest’s proportionate share of the recognised amounts of acquiree’s identifiable net assets. If the business combination is achieved in stages, the acquisition date carrying value of the acquirer’s previously held equity interest in the acquiree is re-measured to fair value at the acquisition date. Any gains or losses arising from such re-measurement are recognised in profit or loss.
Any contingent consideration to be transferred by the Group is recognised at fair value at the acquisition date. Subsequent changes to the fair value of the contingent consideration that is deemed to be an asset or liability is recognised in accordance with IFRS 9, ‘Financial instruments’ either in statement of profit or loss or as a change to the comprehensive income. Contingent consideration that is classified as equity is not re-measured, and its subsequent settlement is accounted for within equity. Acquisition related costs are expensed as incurred. The excess of the consideration transferred, the amount of any non-controlling interest in the acquiree and the acquisition- date fair value of any previous equity interest in the acquiree over the fair value of the identifiable net assets acquired is recorded as goodwill. If the total of consideration transferred, non-controlling interest recognised and previously held interest is less than the fair value of the net identifiable assets of the business acquired, the difference is recognised directly in the profit or loss as a bargain purchase.Profit or loss and each component of other comprehensive income (“OCI”) are attributed to the equity holders of the parent of the Group and to the non-controlling interests, even if this results in the non-controlling interests having a deficit balance. Non controlling interests in the results and equity of subsidiaries are shown separately in the consolidated statement of profit or loss, statement of comprehensive income, statement of changes in equity and statement of financial position respectively. All intra-group assets and liabilities, equity, income, expenses and cash flows relating to transactions between Group entities are eliminated in full on consolidation. Unrealised losses are also eliminated unless the transaction provides evidence of impairment of the transferred asset.When necessary, adjustments are made to the financial statements of subsidiaries to bring their accounting policies in line with the Group’s accounting policies. All subsidiaries of the Company have 31 December year ends and are consolidated in the financial statements.
Loss of controlIf the Group loses control over a subsidiary, it;• derecognises the assets (including goodwill) and liabilities of the subsidiary;• derecognises the carrying amount of any non-controlling interest;• derecognises the cumulative transaction differences recorded in equity;• recognises the fair value of the consideration received;• recognises the fair value of any investment retained;• recognises any surplus or deficit in the statement of comprehensive income; and• reclassifies the parent’s share of components previously recognised in other comprehensive income to profit or loss or• retained earnings, as appropriate.Changes in ownership interests in subsidiaries without change of controlTransactions with non-controlling interests that do not result in loss of control are accounted for as equity transactions – that is, as transactions with the owners of the Group in their capacity as owners. A change in ownership interest results in an adjustment between the carrying amounts of the controlling and non-controlling interests to reflect their relative interests in the subsidiary. Any difference between the amount of the adjustment to non-controlling interests and any consideration paid or received is recognised in a separate reserve within equity. Gains or losses from disposal to non-controlling interests are also recorded in equity.Separate financial statementsIn the Company’s separate financial statements, investments in subsidiaries are accounted for at cost less accumulated allowance for impairment.Associate Associates are all entities over which the Group has significant influence but not control or joint control, generally accompanying a shareholding of between 20% and 50% of the voting rights. If the shareholding is less than 20%, the Group will be presumed not to have significant influence unless such influence can be clearly demonstrated. The existence of significant influence by the Group is usually evidenced in one or more of the following ways:
50
ZIMRE HOLDINGS LIMITED 2020 ANNUAL REPORT
NOTES TO THE FINANCIAL STATEMENTSFOR THE YEAR ENDED 31 DECEMBER 2020 (continued)
2 SUMMARY OF SIGNIFICANT ACCOUNTING POLICIES (continued)2.2 Principles of consolidation and equity accounting (continued)
• representation on the board of directors or equivalent governing body of the investee;• participation in the policy-making process;• material transactions between the investor and the investee;• interchange of managerial personnel; or• provision of essential technical information.Investments in associates are accounted for using the equity method of accounting and are initially recognised at cost and thereafter thecarrying amount is increased or decreased to recognise the investor’s share of post-acquisition profits or losses of the investee and the Group’s share of movements in other comprehensive income after the date of acquisition. The Group’s investment in associates includes goodwill identified on acquisition.When the investment, or portion of an investment, meets the criteria to be classified as held for sale, the portion so classified is accounted for in accordance with IFRS 5, ‘Non-current assets held for sale and discontinued operations’. Any remaining portion is accounted for using, the equity method until the time of disposal, at which time the retained investment is accounted under IFRS 9, ‘Financial instruments’, unless the retained interest continues to be an equity accounted entity in accordance with the provisions of the standard.If the ownership interest in an associate is reduced but significant influence is retained, only a proportionate share of the amounts previously recognised in other comprehensive income is reclassified to profit or loss where appropriate. When the Group’s share of losses in an equity - accounted investment equals or exceeds its interest in the entity, including any other unsecured long-term receivables, the Group does not recognise further losses, unless it has incurred legal or constructive obligations or made payments on behalf of the entity. The Group determines at each reporting date whether there is any objective evidence that the investment in the associate is impaired. If this is the case, the Group calculates the amount of impairment as the difference between the recoverable amount of the associate and its carrying value and recognises the amount adjacent to ‘share of profit/(loss) of an associate’ in the statement of profit or loss. Unrealised gains resulting from upstream and downstream transactions between the Group and its associate are eliminated in the Group’s financial statements to the extent of the investor’s interests in the entity. Unrealised losses are eliminated unless the transaction provides evidence of an impairment of the asset transferred. Accounting polices of equity accounted investees have been changed where necessary to ensure consistency with the polices adopted by the Group.The associates, except for CFI Holdings Limited which has a 30 September year end, have 31 December year-ends, and are included in the financial statements based on audited year end financial statements.
2.3 Earnings per share(i) Basic earnings per shareBasic earnings per share are calculated by dividing:• the profit attributable to owners of the Company, excluding any costs of servicing equity other than ordinary shares;• by the weighted average number of ordinary shares outstanding during the financial year, adjusted for bonus elements in ordinary
shares issued during the year and excluding treasury shares(ii) Diluted earnings per shareDiluted earnings per share adjusts the figures used in the determination of basic earnings per share to take into account:• the after income tax effect of interest and other financing costs associated with dilutive potential ordinary shares, and• the weighted average number of additional ordinary shares that would have been outstanding assuming the conversion of all dilutive
potential ordinary shares.2.4 Segment reporting
Operating segments are reported in a manner consistent with the internal reporting provided to the chief operating decision-maker. The chief operating decision maker, responsible for allocating resources and assessing performance of the operating segments, has been identified as the “Group Executive Committee” which comprises the Group Chief Executive Officer, Group Finance Executive and the Managing Directors of the subsidiaries.
2.5 Property and equipmentProperty and equipment is measured at historical cost less depreciation and impairment in the statutory records. Historical cost includes expenditure that is directly attributable to the acquisition of the items. Subsequent costs are included in the asset’s carrying amount or recognised as a separate asset, as appropriate, only when it is probable that future economic benefits associated with the item will flow to the Group and the cost of the items can be measured reliably. The carrying amount is any component accounted for as a separate asset is derecognised when replaced. Repairs and maintenance costs are recognised in profit or loss as incurred. Land and buildings are measured at fair value less accumulated depreciation and impairment loss recognised after the date of the revaluation. Valuations are performed annually to ensure that the fair value of a revalued asset does not differ materially from its carrying amount. Any revaluation surplus net of tax is credited in other comprehensive income to revaluation reserve included in shareholders’ equity.

51
ZIMRE HOLDINGS LIMITED 2020 ANNUAL REPORT
NOTES TO THE FINANCIAL STATEMENTSFOR THE YEAR ENDED 31 DECEMBER 2020 (continued)
2 SUMMARY OF SIGNIFICANT ACCOUNTING POLICIES (continued)2.5 Property and equipment (continued)
To the extent that the increase reverses a decrease previously recognised in profit or loss, the increase is first recognised in profit or loss. Decreases that reverse previous increases of the same asset are first recognised in other comprehensive income to the extent of the remaining surplus attributable to the asset; all other decreases are charged to profit or loss. Each year, the difference between depreciation based on the revalued carrying amount of the asset charged to profit or loss and depreciation based on the asset’s original cost, net of tax, is reclassified from the revaluation reserve to retained earnings.Depreciation is calculated on a straight-line basis over the useful life of the asset as follows:
• Freehold buildings 40 years• Vehicles 5 years• Computers and office equipment 5 years• Furniture and fittings 10 yearsAn item of property and equipment is derecognised upon disposal or when no future economic benefits are expected from its use. Any gain or loss arising on de-recognition is included in profit or loss in the year the asset is de-recognised.The asset’s residual values, useful lives and methods of depreciation are reviewed at each financial year-end, and adjusted prospectively if appropriate. Changes in the asset’s depreciation method, residual value or useful life are treated as a change in accounting estimate in accordance with IAS 8, ‘Accounting policies, changes in accounting estimates and errors. An asset’s carrying amount is written down immediately to its recoverable amount if the asset’s carrying amount is greater than its estimated recoverable amount.
2.6 Investment property
Investment property comprises completed property and property under construction or development that is held to earn rentals or for capital appreciation or both. Property held under a lease is classified as investment property when it is held to earn rentals or for capital appreciation or both, rather than for sale in the ordinary course of business or for use in production or administrative functions.Investment property is measured initially at cost, including transaction costs. Subsequent to initial recognition, investment property is stated at fair value, which reflects market conditions at the reporting date. Gains or losses arising from changes in the fair values of investment property is included in the statement of profit or loss in the period in which they arise. Fair values are evaluated annually by an accredited external independent valuer, applying valuation models recommended by the International Valuation Standards Committee.Subsequent expenditure is capitalised to the asset’s carrying amount only when it is probable that future economic benefits associated with the expenditure will flow to the Group and the cost of the item can be measured reliably. All other repairs and maintenance costs are expensed when incurred. When part of an investment property is replaced, the cost of the replacement is included in the carrying amount of the property and the fair value is re-assessed.Investment property is derecognised when either it has been disposed of or when the investment property is permanently withdrawn from use and no future economic benefit is expected from its disposal. The difference between the net disposal proceeds and the carrying amount of the asset is recognised in the statement of profit or loss in the period of derecognition.Transfers are made to or from investment property only when there is a change in use. For a transfer from investment property to owner-occupied property, the deemed cost for subsequent accounting is the fair value at the date of change in use. If owner-occupied property becomes an investment property, the Group accounts for such property in accordance with the policy stated under property and equipment up to the date of change in use. The difference between the cost-based measurement and fair value is treated as a revaluation adjustment.
2.7 Intangible assets Intangible assets acquired separately are measured on initial recognition at historical cost in the statutory records. The historical cost
of intangible assets acquired in a business combination is their fair value at the date of acquisition. Subsequently, intangible assets are carried at cost less any accumulated amortisation and accumulated impairment losses. The useful lives of intangible assets are assessed as either finite or indefinite. Intangible assets with finite lives are amortised over the useful economic life and assessed for impairment whenever there is an indication that the intangible asset may be impaired.The amortisation period and the amortisation method for an intangible asset with a finite useful life are reviewed at least at the end of each reporting period. Changes in the expected useful life or the expected pattern of consumption of future economic benefits embodied in the asset are considered to modify the amortisation period or method, as appropriate, and are treated as changes in accounting estimates. The amortisation expense on intangible assets with finite lives is recognised in statement of comprehensive income in the expense category that is consistent with the function of the intangible assets.

52
ZIMRE HOLDINGS LIMITED 2020 ANNUAL REPORT
NOTES TO THE FINANCIAL STATEMENTSFOR THE YEAR ENDED 31 DECEMBER 2020 (continued)
2 SUMMARY OF SIGNIFICANT ACCOUNTING POLICIES (continued)2.7 Intangible assets (continued)
Intangible assets with indefinite useful lives are not amortised, but are tested for impairment annually, either individually or at the cash-generating unit level. The assessment of indefinite life is reviewed annually to determine whether the indefinite life continues to be supportable. If not, the change in useful life from indefinite to finite is made on a prospective basis. Gains or losses arising from de-recognition of an intangible asset are measured as the difference between the net disposal proceeds and the carrying amount of the asset and are recognised in statement of comprehensive income when the asset is derecognised. The software licences have a finite life of up to 5 years and are amortised over that period. The amortisation costs for the year are included in operating and administrative expenses in the statement of profit or loss.
2.8 Inventory Inventory comprises property acquired or being constructed for sale in the ordinary course of business, consumables and other stocks.
Property classified as inventory is residential property that the Group is developing and intends to sell before or on completion of construction. Cost includes:• amounts paid to contractors for construction; and• borrowing costs, planning and design costs, costs of site preparation, professional fees for legal services, property• transfer taxes, construction overheads and other related costs.Net realisable value is the estimated selling price in the ordinary course of the business, based on market prices at the reporting date and less costs to completion and the estimated costs of sale. Net realisable value for completed inventory property is assessed with reference to market conditions and prices existing at the reporting date, and is determined by the Group in light of recent market transactions.Consumables and other stocks are valued on the basis of weighted average cost and at the lower of cost or estimated net realisable value, inventory is valued at the lower of cost or estimated net realisable value, but is based on the specific identification of the property.
2.9 Impairment of non-financial assets At each reporting date, the Group reviews the carrying amount of its tangible and intangible assets to determine whether there is any
indication that those assets have suffered an impairment loss. If any such indication exists, the recoverable amount of the assets is estimated in order to determine the extent of the impairment loss (if any). Where it is not possible to estimate the recoverable amount ofan individual asset, the Group estimates the recoverable amount of the cash-generating unit to which the asset belongs.If the recoverable amount of the asset (or cash generating unit) is estimated to be less than its carrying amount, the carrying amount ofthe asset (or cash generating unit) is reduced to its recoverable amount. An impairment loss is recognised immediately in statement ofcomprehensive income.An asset’s recoverable amount is the higher of an asset’s or cash-generating unit’s (“CGU”) fair value less costs of disposal and its value in use. Recoverable amount is determined for an individual asset, unless the asset does not generate cash inflows that are largely independent of those from other assets or groups of assets. When the carrying amount of an asset or CGU exceeds its recoverable amount, it is reduced to its recoverable amount.In assessing value in use, the estimated future cash flows are discounted to their present value using a pre-tax discount rate that reflects current market assessments of the time value of money and the risks specific to the asset. In determining fair value less costs of disposal, recent market transactions are taken into account. If no such transactions can be identified; an appropriate valuation model is used. These calculations are corroborated by valuation multiples, quoted share prices for publicly traded companies or other available fair value indicators.A previously recognised impairment loss is reversed only if there has been a change in the assumptions used to determine the asset’s recoverable amount since the last impairment loss was recognised. The reversal is limited so that the carrying amount of the asset does not exceed its recoverable amount, nor exceed the carrying amount that would have been determined, net of depreciation, had no impairment loss been recognised for the asset in prior years. Such reversal is recognised in statement of comprehensive income.
2.10 Trade and other receivables
Premiums receivables relate to insurance premiums outstanding from insurance companies, reinsurance brokers and insurance agents and are recognised when due and measured on initial recognition at the fair value of the consideration received or receivable. Subsequent to initial recognition, premiums receivable are measured at amortised cost, using the effective interest rate method. See note 2.12 for further information about the Group’s accounting for financial assets.Insurance contracts are issued at market rates even when credit terms are offered. Furthermore, short term insurance contracts are for periods not exceeding one year. Therefore there is no significant financing component in insurance premiums thus their carrying amount is considered to be the same as their fair value. Other receivables are amounts that generally arise from transactions outside the usual operating activities of the Group. If collection of the amount is due in one year or less, they are classified as current assets. If not, they are presented as non-current assets. Other receivables comprise loans to employees and prepayments.Other receivables are recognised initially at fair value and subsequently at amortised cost using the effective interest rate method less allowance for impairment. See note 2.12 for description of the Group’s impairment policy.

53
ZIMRE HOLDINGS LIMITED 2020 ANNUAL REPORT
NOTES TO THE FINANCIAL STATEMENTSFOR THE YEAR ENDED 31 DECEMBER 2020 (continued)
2 SUMMARY OF SIGNIFICANT ACCOUNTING POLICIES (continued)2.11 Deferred acquisition costs
Deferred acquisition costs relate to commission incurred to acquire insurance business, deferred over a period in which the related premiums are earned. The deferred portion is calculated by applying the actual commission rate on the unearned premium reserve balance.
2.12 Financial Instrumentsi) ClassificationA financial instrument is any contract that gives rise to a financial asset of one entity and a financial liability or equity instrument on another entity.The Group’s financial assets are classified as measured at:• fair value (either through other comprehensive income or through profit or loss), and• amortised cost.For assets measured at fair value, gains and losses will either be recorded in profit or loss or other comprehensive income. For investments in equity instruments that are not held for trading, this will depend on whether the Group has made an irrevocable election at the time of initial recognition to account for the equity investment at fair value through other comprehensive income (“FVOCI”).The Group reclassifies debt investments when and only when the business model for managing those assets changes. ii) Recognition and derecognitionRegular way purchases and sales of financial assets are recognised on trade-date, the date on which the Group commits to purchaseor sell the asset. Financial assets are derecognised when the rights to receive cash flows from the financial assets have expired orhave been transferred and the Group has transferred substantially all the risks and rewards of ownership.iii) MeasurementAt initial recognition, the Group measures a financial asset at its fair value plus, in the case of a financial asset not at fair value through profit or loss (“FVPL”), transaction costs that are directly attributable to the acquisition of the financial asset. Transaction costs of financial assets carried at FVPL are expensed in profit or loss.
Debt instrumentsSubsequent measurement of debt instruments depends on the Group’s business model for managing the asset and the cash flow characteristics of the asset. There are three measurement categories into which the Group classifies its debt instruments: • Amortised cost: Assets that are held for collection of contractual cash flows, where those cash flows represent solely payments of principal and interest, are measured at amortised cost. Interest income from these financial assets is included in finance income using the effective interest rate method. Effective interest rate is the rate that exactly discounts estimated future cash payments or receipts through the expected life of the financial instrument or, when appropriate, a shorter period to the net carrying amount of the financial asset or financial liability. Any gain or loss arising on derecognition is recognised directly in profit or loss and presented in other gains/(losses) together with foreign exchange gains and losses. Impairment losses are presented as a separate line item in the statement of profit or loss.• FVOCI: Assets that are held for collection of contractual cash flows and for selling the financial assets, where the assets’ cash flows represent solely payments of principal and interest, are measured at FVOCI. Movements in the carrying amount are taken through other comprehensive income (“OCI”), except for the recognition of impairment gains or losses, interest income and foreign exchange gains and losses, which are recognised in profit or loss. When the financial asset is derecognised, the cumulative gain or loss previously recognised in OCI is reclassified from equity to profit or loss and recognised in other gains/(losses). Interest income from these financial assets is included in finance income using the effective interest rate method. Foreign exchange gains and losses are presented in other gains/(losses), and impairment expenses are presented as a separate line item in the statement of profit or loss.• FVPL: Assets that do not meet the criteria for amortised cost are measured at FVPL. A gain or loss on a debt investment that is subsequently measured at FVPL is recognised in profit or loss and presented net within other gains/(losses) in the period in which it arises.
Equity instrumentsThe Group subsequently measures all equity investments at fair value. Where the Group’s management has elected to present fair value gains and losses on equity investments in OCI, there is no subsequent reclassification of fair value gains and losses to profit or loss following the derecognition of the investment. Dividends from such investments continue to be recognised in profit or loss as other income when the Group’s right to receive payments is established.Changes in the fair value of financial assets at FVPL are recognised in other gains/(losses) in the statement of profit or loss as applicable. Impairment losses (and reversal of impairment losses) on equity investments measured at FVOCI are not reported separately from other changes in fair value.The Group has classified investments in quoted equities as financial assets at FVPL because they are held for trading with expected disposal in the short-term. Unquoted equity investments are long-term strategic investments and not expected to be disposed in the short-term, as such have been classified as financial assets at FVOCI.
iv) ImpairmentThe Group assesses on a forward looking basis the expected credit losses associated with its debt instruments carried at amortised cost and FVOCI. The impairment methodology applied depends on whether there has been a significant increase in credit risk.
54
ZIMRE HOLDINGS LIMITED 2020 ANNUAL REPORT
NOTES TO THE FINANCIAL STATEMENTSFOR THE YEAR ENDED 31 DECEMBER 2020 (continued)
2 SUMMARY OF SIGNIFICANT ACCOUNTING POLICIES (continued)2.12 Financial Instruments (continued)
For trade receivables, the Group applies both the simplified approach and the general approach permitted by IFRS 9, which requires expected lifetime losses to be recognised from initial recognition of the receivables, see note 3.3 for further details.
De-recognition of financial assets
A financial asset is de-recognised when the right to receive cash flows from the asset has expired or the Group has transferred their rights to receive cash flows from the asset or have assumed an obligation to pay the received cash flows in full without material delay to a third party under a ‘pass-through’ arrangement; and have transferred substantially all the risks and rewards of the asset to another party, or the Group has neither transferred nor retained substantially all the risks and rewards of the asset, but have transferred control of the asset. When the Group has transferred their rights to receive cash flows from an asset or have entered into a pass-through arrangement, they evaluate if and to what extent they have retained the risks and rewards of ownership. When they have neither transferred nor retained substantially all of the risks and rewards of the asset, nor transferred control of the asset, the Group continues to recognise the transferred asset to the extent of the Group’s continuing involvement. In that case, the Group also recognises an associated liability.The transferred asset and the associated liability are measured on a basis that reflects the rights and obligations that the Group and Company have retained.
2.13 Financial liabilitiesThe Group’s financial liabilities include trade and other payables, bank borrowings, policyholder liabilities, and investment contracts.
MeasurementFinancial liabilities are recognised initially at fair value and, in the case of loans and borrowings, less directly attributable transaction costs. Financial liabilities within the scope of IFRS 9 are classified as financial liabilities at amortised cost. The Group determines the classification of its financial liabilities at initial recognition.Subsequent to initial recognition, financial liabilities are measured at amortised cost using the effective interest rate method. Gains and losses are recognised in statement of comprehensive income when the liabilities are derecognised.
De-recognition of financial liabilitiesA financial liability is de-recognised when the obligation under the liability is discharged or cancelled or has expired. When an existing financial liability is replaced by another from the same lender on substantially different terms, or the terms of an existing liability are substantially modified, such a modification is treated as the derecognition of the original liability and the recognition of a new liability. The difference in the respective carrying amounts is recognised in profit or loss.
2.14 Offsetting of financial instruments
Financial assets and liabilities are offset and the net amount reported, on the statement of financial position when there is a legally enforceable right to offset the recognised amounts and there is an intention to settle on a net basis or realise the asset and settle the liability simultaneously. The legally enforceable right must not be contingent on future events and must be enforceable in the normal course of business and in the event of default, insolvency or bankruptcy of the Company or the counter-party.
2.15 Cash and cash equivalents
For the purpose of presentation in the statement of cash flows, cash and cash equivalents includes cash on hand, deposits held at call with financial institutions, other short-term, highly liquid investments with original maturities of three months or less that are readily convertible to known amounts of cash and which are subject to an insignificant risk of changes in value and bank overdrafts.Bank overdrafts are shown within borrowings in the statement of financial position.
2.16 Share capitalOrdinary shares are classified as equity.
Incremental costs directly attributable to the issue of new shares or options are shown in equity as a deduction, net of income tax from the proceeds.Treasury shares (repurchase and reissue of ordinary shares)Where the Company purchases its own shares or a group company purchases the Company’s ordinary share capital (“treasury shares”), the consideration paid, including any directly attributable incremental costs (net of income taxes) is deducted from equity attributable to the Company’s equity holders until the shares are cancelled or reissued. Where such shares are subsequently reissued, any consideration received, net of any directly attributable incremental transaction costs and the related income tax effects, is included in equity attributable to the Company’s equity holders.
2.17 Reinsurance contract liabilitiesReinsurance contract liabilities relate to life reassurance and non-life reinsurance. At the end of the year, a liability adequacy test is carried out by a registered actuary to determine the sufficiency of the insurance contract liabilities.
2.17.1 Life reassurance policy holder liabilities
Life reassurance policy holder liabilities are policyholders’ liabilities computed by an independent actuary in accordance with the guidelines issued by the Actuarial Society of Zimbabwe and Actuarial Society of South Africa. Under this method, the policyholders’ liabilities are valued using realistic expectations of future experience with prescribed margins for prudence and deferral profit emergence.

55
ZIMRE HOLDINGS LIMITED 2020 ANNUAL REPORT
NOTES TO THE FINANCIAL STATEMENTSFOR THE YEAR ENDED 31 DECEMBER 2020 (continued)
2 SUMMARY OF SIGNIFICANT ACCOUNTING POLICIES (continued)2.17.2 Non-life reinsurance contract liabilities
These include the outstanding claims and the incurred but not reported reserve (“IBNR”) (disclosed as insurance payable) and the provision for unearned premium. Outstanding claims
The outstanding claims reserve is based on the estimated ultimate cost of all claims incurred but not settled at the reporting date, together with related claims handling costs and reduction for the expected salvage and other recoveries.Incurred but not reported - (“IBNR”)
The provision for incurred but not reported claims (“IBNR”) represents all claims incurred before the reporting date but only reported subsequent to year-end.
IBNR is estimated using a rate of 10% (2019 -10%) of net premium written and actuarially tested for adequacy as at reporting date.Delays can be experienced in the notification and settlement of certain types of claims, therefore the ultimate cost of these cannot be known with certainty at the reporting date. The liability is calculated at the reporting date using a range of standard actuarial claim project techniques, based on empirical data and current assumptions that include a margin for adverse variation. The liability is not discounted for the time value of money. The liabilities are derecognised when the obligation to pay a claim expires, is discharged or is cancelled.Unearned premium reserves - (“UPR”)
The unearned premium reserve represents that portion of premiums received or receivable that relates to risks that have not yet expired at the reporting date. The provision is recognised on contracts entered into with maturities beyond the financial year end of the Group and earned premiums is brought to account over the term of the contract in accordance with the pattern of insurance service provided under the contract. The subsidiaries within the Group use various methods to account for unearned premium reserve which include the 1/8 method, the 1/365 method and the 24th method.
2.18 Retrocession The Group cedes reinsurance risk in the normal course of business for its reinsurance businesses to retrocessionaires.
Retrocession receivables and payables are disclosed as part of insurance trade receivables and payables respectively. Retrocession income and expenses are disclosed in profit or loss.
2.19 Provisions Provisions are recognised when the Group has a present legal or constructive obligation as a result of past events, it is probable that an
outflow of resources embodying economic benefits will be required to settle the obligation and a reliable estimate of the amount of the obligation can be made.
When the Group expects some or all of a provision to be reimbursed, for example, under an insurance contract, the reimbursement is recognised as a separate asset, but only when the reimbursement is virtually certain. The expense relating to a provision is presented in profit or loss net of any reimbursement.Restructuring provisions are recognised only when the recognition criteria for provisions are fulfilled. The Group has a constructive obligation when a detailed formal plan identifies the business or part of the business concerned, the location and number of employees affected, a detailed estimate of the associated costs, an appropriate timeline, and furthermore, the employees affected have been notified of the plan’s main features.If the effect of the time value of money is material, provisions are discounted using a pre-tax rate that reflects, current market assessments of the time value of money, and the risks specific to the liability. The increase in the provision due to the passage of time is recognised as a finance cost.The Group and Company recognise obligations for retrenchments as a liability and expense when there is a demonstrable commitment to either terminate the employment of an employee or group of employees before normal retirement date as a result of an offer made in order to encourage voluntary redundancy.
2.20 Revenue recognitionThe Group recognises revenue when the following conditions have been met:• when contracts have been approved by all parties to the contract;• each party’s rights in relation to the goods or services to be transferred can be identified;• the payment terms for the goods or services to be transferred can be identified;• the contract has commercial substance; and• it is probable that the consideration to which the Group is entitled to in exchange for the goods or services will be collectedThe Group derives revenue from the transfer of goods and provision of services over time and at a point in time in the following major product lines:

56
ZIMRE HOLDINGS LIMITED 2020 ANNUAL REPORT
NOTES TO THE FINANCIAL STATEMENTSFOR THE YEAR ENDED 31 DECEMBER 2020 (continued)
2 SUMMARY OF SIGNIFICANT ACCOUNTING POLICIES (continued)
2.20.1 Premium incomeGross premiums comprise the premiums on contracts entered into during the year. Premiums written include adjustments to premiums written in prior periods. Premium income arising from pensions is recognized when due while that from individual life is recognized when paid. Premiums are recognised as revenue (earned premiums) proportionally over the period of coverage. The portion of premium received on in-force contracts that relates to unexpired risks at the reporting date is reported as the unearned premium liability. Premiums are shown before deduction of commission and are net of any taxes or duties levied on premiums.Premium income is accounted for gross of reinsurance and accounted for as follows:Pensions - when dueLife - when paidProperty and casualty insurance (short-term insurance) - when dueHealth insurance - when paidIn the short-term business, premium income is accounted for as and when the premiums are agreed and risks accepted.
2.20.2 Fund management and investment contracts fee incomeFees charged for investment management services are recognised as revenue as the services are provided. Initial fees which exceed the level of recurring fees and relate to the future provision of services are deferred and amortised over the anticipated period in which the services will be provided.
2.20.3 Rental incomeThe Group is the lessor on operating lease transactions. Rental income arising from operating leases on investment property is accounted for on a straight-line basis over the lease terms and is included in revenue in the statement of profit or loss due to its operating nature.
Services and management charges are recognised in the accounting period in which they are incurred.
Tenant lease incentives are recognised as a reduction of rental revenue on a straight-line basis over the term of the lease. The lease term is the non-cancellable period of the lease together with any further term for which the tenant has the option to continue the lease, where, at the inception of the lease, the Directors are reasonably certain that the tenant will exercise that option.Amounts received from tenants to terminate leases or to compensate for dilapidations are recognised in the statement of profit or loss when the right to receive them arises.
2.20.4 Property services incomeProperty services income comprises income received from property-related services to other parties. The income is recognised when the related services have been provided. Property services income will be generated, and revenue recognised as indicated, from the following services:• Project management - over time ;• Property management - over time;• Property purchases - at a point in time;• Property sales - at a point in time; and• Property valuations - at a point in time.
2.20.5 Sale of inventory property and stands The Group develops and sells residential properties. Revenue is recognised when control over the property has been transferred to the
customer. The properties have generally no alternative use for the Group due to contractual restrictions. However, an enforceable right to payment does not arise until legal title has passed to the customer. Therefore, revenue is recognised at a point in time when the legal title has passed to the customer.The revenue is measured at the transaction price agreed under the contract. The consideration is due upon signing the sale contract. Deferred payment terms may be agreed in some cases for periods up to 36 months. In such cases, the transaction price is adjusted for the effects of a significant financing component.The Group has contracts with customers where the period between signing of the sale contract and payment by the customer exceeds one year. As a consequence, the Group adjusts the transaction prices for the time value of money at the effective interest rate.
2.21 Deferred income
Where conditions precedent to the sale of completed stands have not been met, any related revenue is recognised as deferred income. Amounts recognised in deferred income will only be recognised as revenue after all conditions precedent have been met and significant risks and rewards have been transferred to the buyer, and the buyer has accepted the property.
2.22 Other income
2.22.1 Dividend income
Dividend income is recognised when the Group and Company’s rights to receive the payment is established, when the investee`s board of directors has declared the dividend.
57
ZIMRE HOLDINGS LIMITED 2020 ANNUAL REPORT
NOTES TO THE FINANCIAL STATEMENTSFOR THE YEAR ENDED 31 DECEMBER 2020 (continued)
2 SUMMARY OF SIGNIFICANT ACCOUNTING POLICIES (continued)
2.22.2 Interest income
Interest earned on cash invested with financial institutions is recognised on an accrual basis using the effective interest method, which is the rate that exactly discounts the estimated future cash payments or receipts through the expected life of the financial instruments or a shorter period, where appropriate, to the net carrying amount of the financial asset or liability. Interest income is included in the statement of comprehensive income.
2.22.3 Fee income
Insurance contract policyholders are charged for policy administration services, surrenders and other contract fees. These fees and charges are recognised as income over the period in which the related services are performed. Actuarial and consultancy fee income is recognised on an accrual basis, based on the values of the services provided and disclosed under other income.
2.22.4 Commission income
Commission income received or receivable under reinsurance contracts for non life insurance contracts is recognised as revenue proportionally over the period of the insurance contract.
2.22.5 Realised gains and losses
Realised gains and losses recorded in the statement of comprehensive income on investments include gains and losses on financial assets at FVPL and investment properties. Gains and losses on financial assets are from financial assets at FVPL. Gains from financial assets at FVOCI are recognised through other comprehensive income and are not recycled to profit or loss on disposal. Gains and losses on the sale of investments are calculated as the difference between net sales proceeds and the original or amortised cost and are recorded on occurrence of the sale transaction.
2.23 Insurance claims and benefits
2.23.1 Life and health reassuranceInsurance benefits and claims relating to life assurance contracts are recognised in profit or loss based on the estimated liability for compensation owed to the contract holder. Death, disability and severe illness and surrender claims are accounted for when notified. These claims include outstanding claims and claims incurred but not reported (“IBNR”). The IBNR estimate is determined taking into account the likelihood of the claim being valid and the expected severity of the claim. The proportion to be included is estimated separately for each benefit type. An estimate of the expected claim amount is charged to profit or loss and included in liabilities under insurance contracts. Maturity and income disability are recorded as incurred. Liabilities are held to reflect IBNR claims. The IBNR is modified to reflect actual current operating conditions. The liabilities are calculated gross of reinsurance. An asset is then raised to allow for the expected recoveries from reinsurers.Claims are accounted for as incurred and consist of claims paid, movement in the provision for outstanding claims and relates claims handling expenses. The provision for outstanding claims is based on estimates of the cost of settling all claims incurred but unpaid at the reporting date, whether reported or not.
2.23.2 Non-life insurance
Benefits payable under non-life insurance contracts are accounted for as incurred. Liabilities are held to reflect IBNR claims. The IBNR calculation is performed using the chain ladder approach. This allows for the historical patterns of claims payment in determining the likely future emergence of claims. The IBNR is further modified to reflect current operational conditions or known events.
2.23.3 Retrocession recoveries
Related retrocession recoveries are disclosed separately as assets in the statement of financial position and are included in recoveries from retrocessions in profit or loss.
2.24 Acquisition costs on reinsurance contracts Acquisition costs on reinsurance and insurance contracts comprises commission and other acquisition costs over the life of the
reinsurance and insurance contracts.Commission
Commission is recognised as an expense in statement of comprehensive income when the premium is received through an intermediary or agent. The period of the commission and the commission rate differ per product depending on the product design structure. Commission is deferred in deferred acquisition costs over the duration of the contract.Other acquisition costs
Other acquisition costs are expenses incurred to acquire reinsurance and insurance business including staff costs directly associated with obtaining business.
58
ZIMRE HOLDINGS LIMITED 2020 ANNUAL REPORT
NOTES TO THE FINANCIAL STATEMENTSFOR THE YEAR ENDED 31 DECEMBER 2020 (continued)
2 SUMMARY OF SIGNIFICANT ACCOUNTING POLICIES (continued)2.25 Employee benefits
Post-employment benefitsThe Group operates one defined contribution pension plan, which requires contributions to be made to the fund which is separately administered. The pension plan is funded by payments from employees and the Group. The Group’s contribution to the defined contribution pension plan is charged to the statement of profit or loss in the period to which the contributions relate. The Group has no legal or constructive obligation to pay further contributions if the fund does not hold sufficient assets to pay all employees the benefits relating to employee service in the current and prior periods. Retirement benefits are also provided for the Company’s employees through the National Social Security Authority (“NSSA”) Scheme. The cost of retirement benefits applicable to the scheme is determined by the systematic recognition of legislated contributions.
Termination benefitsThe Group recognises termination benefits when there is a demonstrable commitment to either terminate employment of an employee or group of employees before normal retirement date or provide termination benefits as a result of an offer made in order to encourage voluntary redundancy. The Group recognises termination benefits at the earlier of the following dates: (a) when the group can no longer withdraw the offer of those benefits; and (b) when the Group recognises costs for a restructuring that is within the scope of IAS 37, ’Provisions, contingent liabilities and contingent assets’, and involves the payment of terminations benefits. In the case of an offer made to encourage voluntary redundancy, the termination benefits are measured based on the number of employees expected to accept the offer. Benefits falling due more than 12 months after the end of the reporting period are discounted to present value.
Short term employee benefitsShort term employee benefits consist of salaries, accumulated leave payments, bonuses and any non-monetary benefits such as medical aid contributions.
Short term employee benefit obligations are measured on an undiscounted basis and are expensed as the related service is provided.A liability is recognised for the amount expected to be paid if the Group has a present legal or constructive obligation to pay this amount as a result of past service provided by the employee and the obligation can be estimated reliably.
Profit sharing and bonus plansThe Group recognises a liability and an expense for bonuses and profit-sharing based on a formula that takes into consideration the profit attributable to the Company’s shareholders after certain adjustments. The Group recognises a provision where contractually obliged or where there is a past practice that has created a constructive obligation.
2.26 BorrowingsBorrowings are initially recognised at fair value, net of transaction costs incurred. Borrowings are subsequently measured at amortised cost. Any difference between the proceeds (net of transaction costs) and the redemption amount is recognised in profit or loss over the period of the borrowings using the effective interest rate method. Fees paid on the establishment of loan facilities are recognised as transaction costs of the loan to the extent that it is probable that some or all of the facility will be drawn down. In this case, the fee is deferred until the draw down occurs. To the extent there is no evidence that it is probable that some or all of the facility will be drawn down, the fee is capitalised as a prepayment for liquidity services and amortised over the period of the facility to which it relates.Borrowings are derecognised from the statement of financial position when the obligation specified in the contract is discharged or cancelled or has expired. The difference between the carrying amount of a financial liability that has been extinguished or transferred to another party and the consideration paid, including any non-cash assets transferred or liabilities assumed, is recognised in profit or loss as other income or finance costs. Where the terms of a financial liability are renegotiated and the Company or a subsidiary issues equity instruments to a creditor to extinguish all or part of the liability (debt for equity swap), a gain or loss is recognised in profit or loss, which is measured as the difference between the carrying amount of the financial liability and the fair value of the equity instruments issued.Borrowings are classified as current liabilities unless the Group has an unconditional right to defer settlement of the liability for at least 12 months after the reporting period.
2.27 Borrowing costsGeneral and specific borrowing costs that are directly attributable to the acquisition, construction or production of a qualifying asset are capitalised during the period of time that is required to complete and prepare the asset for its intended use or sale. Qualifying assets are assets that necessarily take a substantial period of time to get ready for their intended use or sale.Investment income earned on the temporary investment of specific borrowings, pending their expenditure on qualifying assets, is deducted from the borrowing costs eligible for capitalisation. Other borrowing costs are expensed in the period in which they are incurred.
2.28 Current income and deferred taxesThe income tax expense or credit for the year is the tax payable on the current period’s taxable income, based on the applicable income tax rate for each jurisdiction, adjusted by changes in deferred tax assets and liabilities attributable to temporary differences and unused tax losses.Current income and deferred tax is recognised in profit or loss, except to the extent that it relates to items recognised in other comprehensive income or directly in equity. In this case, the tax is also recognised in other comprehensive income or directly in equity respectively.

59
ZIMRE HOLDINGS LIMITED 2020 ANNUAL REPORT
NOTES TO THE FINANCIAL STATEMENTSFOR THE YEAR ENDED 31 DECEMBER 2020 (continued)
2 SUMMARY OF SIGNIFICANT ACCOUNTING POLICIES (continued)
2.28.1 Current income tax
Current income tax assets and liabilities for the current and prior years are measured at the amount expected to be recovered from, or paid to the tax authorities. The tax rates and laws used to compute the amounts are those that are enacted or substantively enacted by the reporting date.The current income tax charge is calculated on the basis of the tax laws enacted or substantively enacted at the end of the reporting period in the countries where the Group and its subsidiaries and associates operate and generate taxable income. Management periodically evaluates positions taken in tax returns with respect to situations in which applicable tax regulation is subject to interpretation. It establishes provision, where appropriate on the basis of amounts expected to be paid to the tax authorities. Taxable income for the life reassurance subsidiary is calculated in accordance with the insurance formula as laid down in the Eighth Schedule to the Zimbabwe Income Tax Act (Chapter 23:06).
2.28.2 Deferred tax
Deferred tax is provided in full using the liability method on temporary differences at the reporting date between the tax bases of assetsand liabilities and their carrying amounts in the financial statements. Deferred tax liabilities are recognised for all taxable temporary differences, except:• when the deferred tax liability arises from the initial recognition of goodwill or an asset or liability in a transaction that is not a business
combination and, at the time of the transaction, affects neither the accounting profit nor taxable profit or loss; and• in respect of taxable temporary differences associated with investments in subsidiaries, associates and joint arrangements, except for
deferred tax liability where the timing of the reversal of the temporary difference is controlled by the Group and it is probable that the temporary difference will not reverse in the foreseeable future. Generally the Group is unable to control the reversal of the temporary difference for associates. Only where there is an agreement in place that gives the Group the ability to control the reversal of the temporary difference not recognised.
Deferred tax assets are recognised for all deductible temporary differences, carry forward of unused tax credits and unused tax losses, to the extent that it is probable that future taxable profit will be available against which the deductible temporary differences, and carry forward of unused tax credits and unused tax losses can be utilised except, when the deferred tax asset relating to deductible temporary differences arises from the initial recognition of an asset or liability in a transaction that is not a business combination and, at the time of the transaction, affects neither the accounting profit nor the taxable profit or loss; and in respect of deductible temporary differences associated with investments in subsidiaries, associates and interests in joint ventures, deferred tax assets are recognised only to the extent that it is probable that the temporary differences will reverse in the foreseeable future and taxable profit will be available against which the temporary differences can be utilised.The carrying amount of deferred tax assets is reviewed at each reporting date and reduced to the extent that it is no longer probable that sufficient taxable profit will be available to allow all or part of the deferred tax asset to be utilised. Unrecognised deferred tax assets are re-assessed at each reporting date and are recognised to the extent that it has become probable that future taxable profit will allow the deferred tax asset to be recovered.Deferred tax assets and liabilities are measured at the tax rates that are expected to apply to the year when the asset is realised or the liability is settled, based on tax rates (and tax laws) that have been enacted or substantively enacted at the reporting date. Deferred tax relating to items recognised in other comprehensive income or equity is also recognised in other comprehensive income or equity and not in statement of comprehensive income.Deferred tax assets and deferred tax liabilities are offset, if a legally enforceable right exists to set off current tax assets against current income tax liabilities and the deferred taxes relate to the same taxable entity and the same taxation authority.
2.28.3 Value added tax (“VAT”) Expenses and assets are recognised net of the amount of VAT, except, when the value added tax incurred on a purchase of assets or
services is not recoverable from the tax authority, in which case, the value added tax is recognised as part of the cost of acquisition of the asset or as part of the expense item, as applicable.
60
ZIMRE HOLDINGS LIMITED 2020 ANNUAL REPORT
NOTES TO THE FINANCIAL STATEMENTSFOR THE YEAR ENDED 31 DECEMBER 2020 (continued)
2 SUMMARY OF SIGNIFICANT ACCOUNTING POLICIES (continued)2.29 Leases
IFRS 16 introduced new or amended requirements with respect to lease accounting. It introduced significant changes to lessee accounting by removing the distinction between operating and finance leases and requiring the recognition of a right-of-use asset and a lease liability at the lease commencement for all leases, except for short-term leases and leases of low value assets. In contrast to lessee accounting, the requirements for lessor accounting have remained largely unchanged.The Group and Company assess whether a contract is or contains a lease, at inception of contract. The Group and Company recognise a right-of-use asset and a corresponding lease liability with respect to all lease agreements in which it is the lessee. The lease liability is initially measured at the present value of the lease payments that are not paid at the commencement date, discounted by using the rate implicit in the lease. If this this rate cannot be readily determined, the Group and Company use its incremental borrowing rate.The lease liability is presented as a separate line in the statement of financial position. The liability is subsequently measured by increasing the carrying amount to reflect interest on the lease liability using the effective interest method and reducing the carrying amount to reflect the lease payments made. The Group and Company remeasure the lease liability and makes a corresponding adjustment to the related right-of-use asset whenever the lease term has changed or the lease contract has been modified.Right-of-use assets are depreciated over the shorter period of lease term and useful life of the underlying asset. The depreciation starts at the commencement date of the lease. The right-of-use assets are presented as a separate line in the statement of financial position.The Group and Company apply IAS 36 Impairment of assets to determine whether a right-of-use asset is impaired and accounts for any identified impairment losses.The deferred tax implications of IFRS 16 are that lease payments are tax-deductible on a cash basis. However, the tax bases of the right-of-use asset and lease liability are zero. The result is a taxable temporary difference in relation to the right-of-use asset and a deductible temporary difference in relation to the lease liability.
2.30 Dividends
Provision is made for the amount of any dividend declared, being appropriately authorised and no longer at the discretion of the Company, on or before the end of the reporting period but not distributed at the end of the reporting period.
3 GROUP FINANCIAL RISK MANAGEMENTRisk Governance Framework
The Group has an Audit and Risk Committee that is part of the Board. Below the Audit and Risk Committee is a Financial Risk Management Committee that comprises senior management of the Group from the departments of Finance, Investments, Audit and Operations. The Financial Risk Management Committee reports to the Audit and Risk Committee on a quarterly basis on the risks identified, how they are being managed and the quantification and sensitivities around the risks. Both committees have clear terms of reference that feed into the overall group risk management strategy policy framework. The terms of reference are set, approved and regularly reviewed by the Board. The primary objective of the Group’s risk management framework is to protect the shareholders from events that hinder the sustainable achievement of financial performance objectives, including failing to exploit opportunities.
3.1 Financial risk factorsThe Group is exposed to financial risk through its financial assets and liabilities, insurance and reinsurance assets and liabilities. The significant components of financial risk are investment risk, market risk, foreign currency risk, interest rate risk and equity price risk, credit risk and liquidity risk.
3.2 Market riskMarket risk is the risk that the fair value or future cashflows of a financial instrument will fluctuate because of changes in the market prices. The Group’s market risk arise from open positions in (a) foreign currencies and (b) interest bearing assets and liabilities, to the extent that these are exposed to general and specific market movements. Market risk comprises three types of risks: foreign exchange risk, interest rate risk and equity price risk.
3.2.1 Foreign currency riskForeign currency risk is the risk arising from fluctuations in foreign exchange rates and their effect on future commercial transactions or recognised assets and liabilities.The Group is exposed to foreign currency risk arising from the holding of monetary assets and liabilities denominated in currencies other than functional currencies of the individual entities.The Group’s primary method of managing foreign currency risk is to match principal cash outflows to the currency in which the principal cash inflows are denominated. Generally, Group companies are required to maintain bank accounts in USD to reduce losses from fluctuations in foreign exchange rates. There were no hedging instruments during the year ended 31 December 2020 (2019 ZWLnil). The functional currency is ZWL, maintaining USD increase foreign currency risk.

61
ZIMRE HOLDINGS LIMITED 2020 ANNUAL REPORT
NOTES TO THE FINANCIAL STATEMENTSFOR THE YEAR ENDED 31 DECEMBER 2020 (continued)The table below shows the balances of monetary assets and liabilities denominated in foreign currency :
INFLATION ADJUSTED
As at 31 December 2020
BotswanaPula
ZWL
MalawianKwacha
ZWL
MozambicanMetical
ZWL
ZambianKwacha
ZWL
Assets
Trade and other receivables 74 542 686 447 456 548 186 379 049 64 510 009
Financial assets at amortised cost - 1 794 574 9 279 864 49 268 434
Cash and cash equivalents 183 337 642 211 120 737 19 915 242 22 026 635
257 880 328 660 371 859 215 574 155 135 805 078
Liabilities
Borrowings - - 36 025 620 2 862 851
Trade and other payables 62 217 325 368 002 993 153 973 312 44 040 501
62 217 325 368 002 993 189 998 932 46 903 352
Net foreign currency exposure 195 663 003 292 368 866 25 575 223 88 901 726
INFLATION ADJUSTED
As at 31 December 2019
BotswanaPula
ZWL
MalawianKwacha
ZWL
MozambicanMetical
ZWL
ZambianKwacha
ZWL
Assets
Trade and other receivables 103 661 219 323 734 648 163 609 696 91 836 841
Financial assets at amortised cost - 1 751 521 17 946 830 -
Cash and cash equivalents 126 890 476 151 551 326 19 056 937 9 636 353
230 551 695 477 037 495 200 613 463 101 473 194
Liabilities
Borrowings - - 38 410 999 -
Trade and other payables 167 962 669 239 015 451 204 402 194 63 592 179
167 962 669 239 015 451 242 813 193 63 592 179
Net foreign currency exposure 62 589 026 238 022 044 (42 199 730) 37 881 015
HISTORICAL COSTBotswana Malawian Mozambican Zambian
Pula Kwacha Metical Kwacha
As at 31 December 2020 ZWL ZWL ZWL ZWL
Assets
Trade and other receivables 74 542 686 447 456 548 186 379 049 64 510 009
Financial assets at amortised cost - 1 794 574 9 279 864 49 268 434
Cash and cash equivalents 183 337 642 211 120 738 19 915 242 22 026 635
257 880 328 660 371 860 215 574 155 135 805 078
Liabilities
Borrowings - - 36 025 620 2 862 851
Trade and other payables 62 217 325 368 002 993 153 973 312 44 040 501
62 217 325 368 002 993 189 998 932 46 903 353
Net foreign currency exposure 195 663 003 292 368 866 25 575 223 88 901 726
As at 31 December 2019
Assets
Trade and other receivables 23 108 461 72 167 871 36 472 350 20 472 536
Financial assets at amortised cost - 390 454 4 000 760 -Cash and cash equivalents 28 286 794 33 784 263 4 248 228 2 148 164
51 395 255 106 342 588 44 721 338 22 620 700

62
ZIMRE HOLDINGS LIMITED 2020 ANNUAL REPORT
NOTES TO THE FINANCIAL STATEMENTSFOR THE YEAR ENDED 31 DECEMBER 2020 (continued)
HISTORICAL COSTBotswana
PulaZWL
MalawianKwacha
ZWL
MozambicanMetical
ZWL
ZambianKwacha
ZWL
Liabilities
Borrowings - - 8 562 692 -
Trade and other payables 37 442 727 53 282 020 45 565 932 14 176 154
37 442 727 53 282 020 54 128 624 14 176 154
Net foreign currency exposure 13 952 528 53 060 568 (9 407 286) 8 444 546Foreign exchange risk sensitivity analysisThe following analysis is performed for reasonably possible movements in the foreign exchange rates to ZWL (assumption:+/- 10%) with all other variables held constant, showing the impact on profit/(loss) before income tax and equity due to changes in the fair value of currency sensitive monetary assets and liabilities including insurance contract claim liabilities. There are no changes from prior year on this assumption.
The sensitivity of 10% represents the directors’ assessment of a possible change:Botswana
PulaZWL
MalawianKwacha
ZWL
MozambicanMetical
ZWL
ZambianKwacha
ZWL
Effect on profit before income tax Change
31 December 2020 10% 19 566 300 29 236 887 2 557 522 8 890 173
31 December 2020 -10% (19 566 300) (29 236 887) (2 557 522) (8 890 173)
31 December 2019 10% 6 258 903 23 802 204 (4 219 973) 3 788 102
31 December 2019 -10% (6 258 903) (23 802 204) 4 219 973 (3 788 102)
Effect on equity
31 December 2020 10% 14 729 511 22 009 528 1 925 303 6 692 522
31 December 2020 -10% 14 729 511 22 009 528 1 925 303 6 692 522
31 December 2019 10% 4 647 235 17 673 137 (3 133 330) 2 812 665
31 December 2019 -10% (4 647 235) (17 673 137) 3 133 330 (2 812 665)
As shown in the table above, the Group is exposed to changes in exchange rates against other functional currencies used by the group companies in their respective jurisdictions. The functional currencies in which monetary assets and liabilities are denominated are shown in the sensitivity table above.
Exchange rates The exchange rates used by the Group to convert foreign denominated amounts to the functional and presentation currency are depicted below:
30 June 2020 31 December 2020 31 December 2019
Average Average As at Average As at
Botswana Pula 0.418 0.139 0.132 1.216 0.6356
Malawi Kwacha 30.679 9.273 9.447 36.175 43.9245
Mozambican Metical 2.698 0.892 0.912 3.071 3.6699
South African Rand 0.694 0.200 0.179 1.630 0.8334
Zambian Kwacha 0.700 0.248 0.248 0.641 0.8396
Due to flactuation of the exchange rates during the year the Group used 30 June and 31 December 2020 average rates to convert the statement of comprehensive income figures.
Amounts recognised in profit or loss and other comprehensive income
During the year, the following foreign-exchange related amounts were recognised in profit or loss and other comprehensive income:
Amounts recognised in profit or loss2020ZWL
2019ZWL
Net foreign exchange gain included in other income 137 312 464 26 143 253
Net gains/(losses) recognised in other comprehensive income
Translation of foreign operations 445 491 992 521 915 936

63
ZIMRE HOLDINGS LIMITED 2020 ANNUAL REPORT
NOTES TO THE FINANCIAL STATEMENTSFOR THE YEAR ENDED 31 DECEMBER 2020 (continued)
3.2.2 Equity price riskEquity price risk is the risk that the fair value or future cash flows of a financial instrument will fluctuate because of changes in market prices, other than those arising from interest rate and currency risk, whether those changes are caused by factors specific to the individual financial instruments to its issuer or factors affecting all financial instruments traded in the market.
The Group is exposed to equity securities price risk.Equity price risk is the potential loss arising from changes in the market price of equity instruments as a result of fluctuations in the market price. A substantial part of the equity portfolio comprises listed counters. Unquoted counters are subjected to periodic financial analysis and review. The Group’s equity price risk policy is to manage such risks by setting and monitoring objectives on investments, diversification of portfolios and setting limits on investment in each sector.At the reporting date, the total exposure to listed equity securities at fair value through profit or loss was ZWL737 256 769 (2019: ZWL108 901 367).
The following table demonstrates the sensitivity to a reasonably possible change in the market price of shares with all other variables held constant.
INFLATION ADJUSTED
Change inmarket price
%
Effect onprofit before
income taxZWL
Effect onprofit after income tax
ZWL
Effect onequity
ZWLAs at December 2020
Increase in market price 10% 73 725 677 55 500 690 55 500 690 Decrease in market price -10% (73 725 677) (55 500 690) (55 500 690)As at December 2019
Increase in market price 10% 10 890 038 8 140 303 8 140 303 Decrease in market price -10% (10 890 038) (8 140 303) (8 140 303)
HISTORICAL COST
Change inmarket price
%
Effect onprofit before
income taxZWL
Effect onprofit after income tax
ZWL
Effect onequity
ZWLAs at December 2020 10% 73 725 677 55 500 690 55 500 690 Increase in market price -10% (73 725 677) (55 500 690) (55 500 690)Decrease in market price
As at December 2019
Increase in market price 10% 2 427 661 1 814 677 1 814 677 Decrease in market price -10% (2 427 661) (1 814 677) (1 814 677)
3.2.3 Interest rate risk
Cash flow interest rate risk is the risk that the fair value or future cash flows of a financial instrument will fluctuate because of changes in the market interest rates. Fair value interest rate risk is the risk that the fair value of a financial instrument will fluctuate because of changes in market interest rates. The Group’s exposure to the risk of changes in market interest rates relates primarily to the Group’s long- term debt obligations.
The Group manages its cash flow interest rate risk by re-negotiating fixed interest rates whenever there are changes in the market. The Group analyses its interest rate exposure on a dynamic basis. Various scenarios are simulated taking into consideration refinancing, renewal of existing positions and alternative financing. Based on these scenarios, the Group calculates the impact on profit or loss of a defined interest rate shift. For each simulation, the same interest rate shift is used for all currencies. The scenarios are run for all interest-bearing positions. Currently, the Group does not undertake any hedging of its short-term loans due to the nature and terms of the loan facilities. On long-term loans, the Group assesses risks and considers hedging where necessary. As at 31 December 2020, there were no hedges in place (2019:ZWLnil).
SensitivityProfit or loss is sensitive to higher/lower interest income from cash and cash equivalents as a result of changes in interest rates. Thekey assumption to this sensitivity is that the interest rates will increase or decrease by 25%, holding all other variables constant.
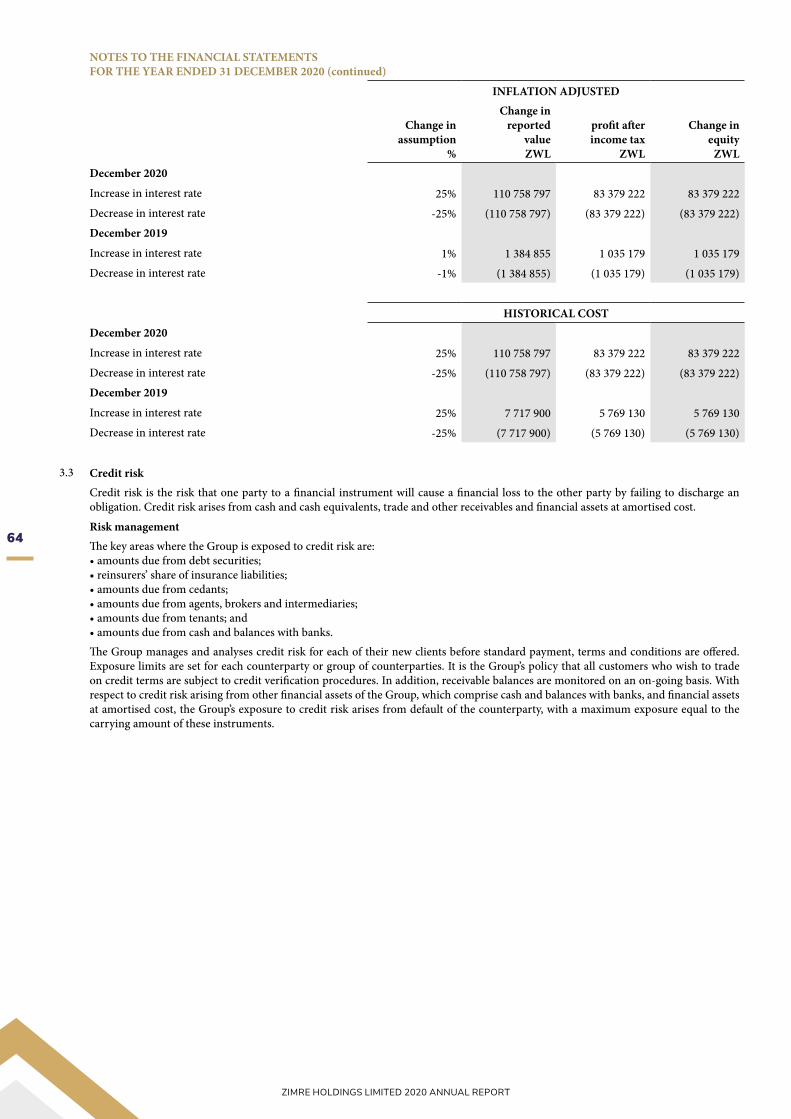
64
ZIMRE HOLDINGS LIMITED 2020 ANNUAL REPORT
NOTES TO THE FINANCIAL STATEMENTSFOR THE YEAR ENDED 31 DECEMBER 2020 (continued)
INFLATION ADJUSTED
Change inassumption
%
Change inreported
valueZWL
profit after income tax
ZWL
Change inequity
ZWLDecember 2020
Increase in interest rate 25% 110 758 797 83 379 222 83 379 222 Decrease in interest rate -25% (110 758 797) (83 379 222) (83 379 222)December 2019
Increase in interest rate 1% 1 384 855 1 035 179 1 035 179 Decrease in interest rate -1% (1 384 855) (1 035 179) (1 035 179)
HISTORICAL COSTDecember 2020
Increase in interest rate 25% 110 758 797 83 379 222 83 379 222 Decrease in interest rate -25% (110 758 797) (83 379 222) (83 379 222)December 2019
Increase in interest rate 25% 7 717 900 5 769 130 5 769 130 Decrease in interest rate -25% (7 717 900) (5 769 130) (5 769 130)
3.3 Credit riskCredit risk is the risk that one party to a financial instrument will cause a financial loss to the other party by failing to discharge an obligation. Credit risk arises from cash and cash equivalents, trade and other receivables and financial assets at amortised cost.
Risk managementThe key areas where the Group is exposed to credit risk are:• amounts due from debt securities;• reinsurers’ share of insurance liabilities;• amounts due from cedants;• amounts due from agents, brokers and intermediaries;• amounts due from tenants; and• amounts due from cash and balances with banks.The Group manages and analyses credit risk for each of their new clients before standard payment, terms and conditions are offered. Exposure limits are set for each counterparty or group of counterparties. It is the Group’s policy that all customers who wish to trade on credit terms are subject to credit verification procedures. In addition, receivable balances are monitored on an on-going basis. With respect to credit risk arising from other financial assets of the Group, which comprise cash and balances with banks, and financial assets at amortised cost, the Group’s exposure to credit risk arises from default of the counterparty, with a maximum exposure equal to the carrying amount of these instruments.
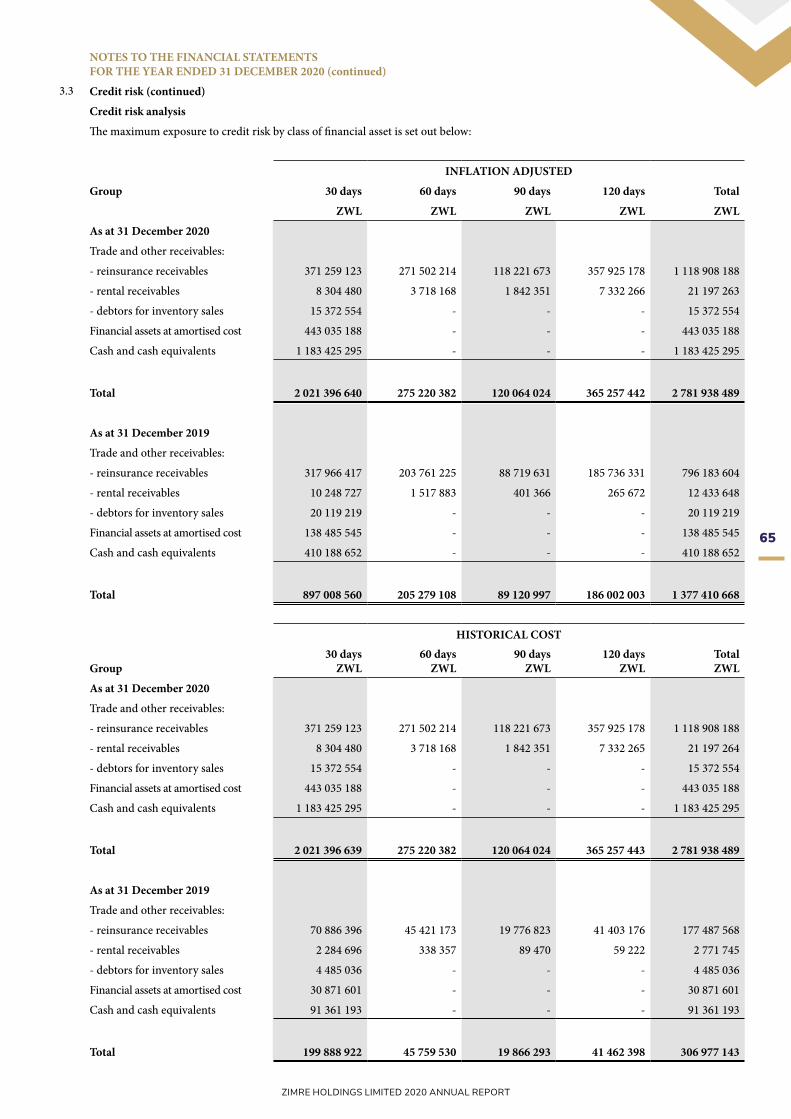
65
ZIMRE HOLDINGS LIMITED 2020 ANNUAL REPORT
NOTES TO THE FINANCIAL STATEMENTSFOR THE YEAR ENDED 31 DECEMBER 2020 (continued)
3.3 Credit risk (continued)
Credit risk analysis
The maximum exposure to credit risk by class of financial asset is set out below:
INFLATION ADJUSTED
Group 30 days 60 days 90 days 120 days Total
ZWL ZWL ZWL ZWL ZWL
As at 31 December 2020
Trade and other receivables:
- reinsurance receivables 371 259 123 271 502 214 118 221 673 357 925 178 1 118 908 188
- rental receivables 8 304 480 3 718 168 1 842 351 7 332 266 21 197 263
- debtors for inventory sales 15 372 554 - - - 15 372 554
Financial assets at amortised cost 443 035 188 - - - 443 035 188
Cash and cash equivalents 1 183 425 295 - - - 1 183 425 295
Total 2 021 396 640 275 220 382 120 064 024 365 257 442 2 781 938 489
As at 31 December 2019
Trade and other receivables:
- reinsurance receivables 317 966 417 203 761 225 88 719 631 185 736 331 796 183 604
- rental receivables 10 248 727 1 517 883 401 366 265 672 12 433 648
- debtors for inventory sales 20 119 219 - - - 20 119 219
Financial assets at amortised cost 138 485 545 - - - 138 485 545
Cash and cash equivalents 410 188 652 - - - 410 188 652
Total 897 008 560 205 279 108 89 120 997 186 002 003 1 377 410 668
HISTORICAL COST
Group30 days
ZWL60 days
ZWL90 days
ZWL120 days
ZWLTotalZWL
As at 31 December 2020
Trade and other receivables:
- reinsurance receivables 371 259 123 271 502 214 118 221 673 357 925 178 1 118 908 188
- rental receivables 8 304 480 3 718 168 1 842 351 7 332 265 21 197 264
- debtors for inventory sales 15 372 554 - - - 15 372 554
Financial assets at amortised cost 443 035 188 - - - 443 035 188
Cash and cash equivalents 1 183 425 295 - - - 1 183 425 295
Total 2 021 396 639 275 220 382 120 064 024 365 257 443 2 781 938 489
As at 31 December 2019
Trade and other receivables:
- reinsurance receivables 70 886 396 45 421 173 19 776 823 41 403 176 177 487 568
- rental receivables 2 284 696 338 357 89 470 59 222 2 771 745
- debtors for inventory sales 4 485 036 - - - 4 485 036
Financial assets at amortised cost 30 871 601 - - - 30 871 601
Cash and cash equivalents 91 361 193 - - - 91 361 193
Total 199 888 922 45 759 530 19 866 293 41 462 398 306 977 143

66
ZIMRE HOLDINGS LIMITED 2020 ANNUAL REPORT
NOTES TO THE FINANCIAL STATEMENTSFOR THE YEAR ENDED 31 DECEMBER 2020 (continued)
3.3 Credit risk (continued)
Credit risk analysis (continued)
INFLATION ADJUSTED
Company30 days
ZWL60 days
ZWL90 days
ZWL120 days
ZWLTotalZWL
As at 31 December 2020
Other receivables 3 334 557 - - - 3 334 557
Financial assets at amortised cost - - - 46 864 46 864
Cash and cash equivalents 11 581 106 - - - 11 581 106
Total 14 915 663 - - 46 864 14 962 527
As at 31 December 2019
Other receivables 2 998 157 - - - 2 998 157
Financial assets at amortised cost - - - 210 234 210 234
Cash and cash equivalents 1 951 132 - - - 1 951 132
Total 4 949 289 - - 210 234 5 159 523
HISTORICAL COST
Company30 days
ZWL60 days
ZWL90 days
ZWL120 days
ZWLTotalZWL
As at 31 December 2020
Other receivables 3 334 557 - - - 3 334 557
Financial assets at amortised cost - - - 46 864 46 864
Cash and cash equivalents 11 581 106 - - - 11 581 106
Total 14 915 663 - - 46 864 14 962 527
As at 31 December 2019
Other receivables 668 331 - - - 668 331
Financial assets at amortised cost - - - 46 864 46 864
Cash and cash equivalents 434 934 - - - 434 934
Total 1 103 265 - - 46 864 1 150 129
The following policies and procedures are in place to mitigate the Group’s exposure to credit risk:Cash and cash equivalentsThe Group has a credit policy that establishes counterparty trading limits for each banking institution that the Group trades with. These counter party limits are reviewed at least quarterly and submitted to the Group Finance and Investments Committee for approval. In thisprocess the financial results of the banking institutions which are published semi annually, are reviewed together with other qualitative factors that may be noted. The limits determined are proposed to the Group Finance and Investments Committee for approval.The Group only trades with and receives service from banking institutions that meet regulatory requirements. Key considerations in thereview of limits and security requirements include:• compliance with minimum capital requirements set by the central banks in the various jurisdiction in which the Group operates;• conformance with the minimum rating as set out in the periodic capital adequacy, asset quality, management, earnings liquidity and
sensitivity ratings;• total shareholders’ equity;• total assets;• ratios such as loan to deposit ratios and non-performing loans (“NPLs”);• overall profitability and cash generation;• historical performance and outlook; and• ability of the bank to provide collateral security.

67
ZIMRE HOLDINGS LIMITED 2020 ANNUAL REPORT
NOTES TO THE FINANCIAL STATEMENTSFOR THE YEAR ENDED 31 DECEMBER 2020 (continued)
3 GROUP FINANCIAL RISK MANAGEMENT (continued)3.3 Credit risk (continued)
Cash and cash equivalents (continued)
The Group further considers the following information in determining the trading limits:• other qualitative factors covered under the rating system;• qualitative factors include additional opinion formed through market intelligence on the financial institution, shareholder profile,
management and segment of market being served.Approved collateral security instruments are as follows:• treasury bills; or• bankers acceptances.The financial institutions holding the cash and cash equivalents of the Group have the following external credit ratings as published bythe Global Credit Rating Company:
INFLATION ADJUSTED HISTORICAL COST
Group2020ZWL
2019ZWL
2020ZWL
2019ZWL
Credit rating:
AA+ 135 862 551 209 637 887 135 862 551 46 733 088
AA- 5 790 292 2 717 984 5 790 292 605 901
AA 32 751 190 - 32 751 190 -
A+ 4 647 403 1 719 769 4 647 403 383 376
A 11 217 775 125 490 825 11 217 775 27 974 780
BBB+ 1 950 695 38 173 144 1 950 695 8 509 669
BBB- 31 651 573 3 480 629 31 651 573 775 912
BBB 1 174 194 - 1 174 194 -
BB+ 1 371 043 12 166 537 1 371 043 2 712 200
BB 6 440 221 - 6 440 221 -
BB- 4 271 734 - 4 271 734 -
B+ 5 157 209 - 5 157 209 -
Unrated 940 273 613 16 446 345 940 273 613 3 666 267
1 182 559 493 409 833 120 1 182 559 493 91 361 193
CompanyCredit rating:
BBB- 255 962 - 255 962 - BB+ - 2 547 650 - 214 002 Unrated* 11 556 852 - 11 556 852 353 927
11 812 814 2 547 650 11 812 814 567 929
*Cash held under insitutions which failed to provide important information pertaining to their credit portfolios and therefore Global Credit Ratings could not perform additional analysis.
Definition of ratings DescriptionAA+ Has very strong financial security characteristics.AA-
A+ Has strong financial security characteristics, but is somewhat more likely to be affected byA- adverse business conditions than banks with higher ratings.BBB+ Has good financial security characteristics, but is much more likely to be affected byBBB- adverse business conditions than banks with higher ratings.BB+ Has good financial security characteristics, but is much more likely to be affected byBB- adverse business conditions than banks with higher ratings.B+ Possessing substantial risk that obligations will not be paid when due.

68
ZIMRE HOLDINGS LIMITED 2020 ANNUAL REPORT
NOTES TO THE FINANCIAL STATEMENTSFOR THE YEAR ENDED 31 DECEMBER 2020 (continued)
3 GROUP FINANCIAL RISK MANAGEMENT (continued)3.3 Credit risk (continued)
Insurance receivablesThe following policies and procedures are in place to mitigate credit risk:• exposure limits are set for each counterparty or Group of counterparties;• the creditworthiness of cedants is considered on an annual basis by reviewing their financial strength prior to finalisation of any
contract;• the exposure to individual counterparties is also managed by other mechanisms, such as the right to offset where counterparties are
both debtors and creditors of the Group; and• management information reported to the board of directors includes details of allowance for credit losses on amounts due from cedants
and subsequent write-offs. Credit limits are monitored based on the financial position and history of the insured or cedant’s ability to pay. In the view of management, the credit quality of insurance receivables is considered sound. Management does not expect material losses from non-performance by counter parties. The credit risk in respect of customer balances incurred on non-payment of premium will only persist during the period specified in the policy document.Tenant receivablesTenants are assessed according to set criteria prior to entering into lease arrangements. Credit risk is managed by requiring tenants to pay rentals in advance in addition to an upfront good tenancy deposit. The credit quality of the tenant is assessed based on an extensive credit rating criteria at the time of entering into a lease agreement. At inception of the lease tenants are classified into good, acceptable and watch list categories.Outstanding tenants’ receivables are regularly monitored and all tenants that accrue arrears are classified in the watch list category as rental obligations are payable in advance. An impairment analysis is performed at each reporting date on an individual basis for major tenants. The maximum exposure to credit risk at the reporting date is the carrying value of each class of financial asset.
Impairment of financial assets The Group has three types of financial assets that are subject to the expected credit loss model:• trade receivables for insurance premiums, sales of inventory and from rentals;• other receivables; and• debt investments carried at amortised cost
While cash and cash equivalents are also subject to the impairment requirements of IFRS 9, the identified impairment loss was immaterial.Trade receivables for insurance premiums and sales of inventory
The Group applies the IFRS 9 simplified approach to measure expected credit losses which uses a lifetime expected loss allowance for trade receivables.
To measure the expected credit losses, trade receivable and contract assets have been grouped based on shared credit risk characteristics.The expected loss rates are based on the payment profiles of income over a period of 5 years and the corresponding historical credit losses experienced within this period. The historical loss rates are adjusted to reflect current and forward-looking information on macro-economic factors affecting the ability of the customers to settle the receivables. The Group identifies the inflation rate, interest rates, expected changes in legislation in countries in which it operates and expected changes in the Group policy and accordingly adjusts the historical loss rates based on expected changes in these factors.
On that basis, the loss allowance as at 31 December 2020 and 31 December 2019 was determined as follows for trade receivables.
Group INFLATION ADJUSTED
Receivables for insurance premiums:
As at 31 December 2020
Current ZWL
31 - 60 days ZWL
61 - 120 daysZWL
121 - 180 daysZWL
More than 180 days
ZWLTotalZWL
Default rate (%) 5% 7% 12% 11% 39%
Gross carrying amount 371 259 123 271 502 214 118 221 673 73 982 535 283 942 643 1 118 908 188
Credit loss allow-ance 18 299 859 19 153 100 14 715 565 8 138 078 110 354 566 170 399 901

69
ZIMRE HOLDINGS LIMITED 2020 ANNUAL REPORT
NOTES TO THE FINANCIAL STATEMENTSFOR THE YEAR ENDED 31 DECEMBER 2020 (continued)
3 GROUP FINANCIAL RISK MANAGEMENT (continued)3.3 Credit risk (continued)
Receivables for insurance premiums: (continued)
INFLATION ADJUSTEDGroupAs at 31 Decem-ber 2019
CurrentZWL
31 - 60 daysZWL
61 - 120 daysZWL
121 - 180 daysZWL
More than180 days
ZWLTotalZWL
Default rate (%) 3% 5% 24% 37% 67%Gross carrying amount 317 986 137 203 752 823 88 715 973 80 529 961 105 198 711 796 183 605 Credit loss allowance 9 904 845 9 421 825 20 887 612 30 110 150 69 976 095 140 300 527
HISTORICAL COST
As at 31 Decem-ber 2020
CurrentZWL
31 - 60 daysZWL
61 - 120 daysZWL
121 - 180 daysZWL
More than 180 days
ZWLTotalZWL
Default rate (%) 5% 7% 12% 11% 39%Gross carrying amount 371 259 123 271 502 214 118 221 673 73 982 535 283 942 643 1 118 908 188 Credit loss allowance 18 299 859 19 153 100 14 715 565 7 876 811 110 354 566 170 399 901
As at 31 December 2019
Default rate (%) 3% 5% 24% 37% 67%Gross carrying amount 70 886 396 45 421 173 19 776 823 17 951 973 23 451 203 177 487 568 Credit loss allowance 2 208 017 2 100 341 4 656 327 6 712 242 15 599 275 31 276 202
68 678 379 43 320 832 15 120 496 11 239 731 7 851 928 146 211 366
70 886 396 45 421 173 19 776 823 41 403 176 177 487 568
INFLATION ADJUSTEDReceivables from rentals:As at 31 Decem-ber 2020
CurrentZWL
31 - 60 daysZWL
61 - 120 daysZWL
121 - 180 daysZWL
More than180 days
ZWLTotalZWL
Default rate (%) 7% 14% 14% 35% 42%Gross carrying amount 8 304 479 3 718 168 1 842 351 644 151 6 688 115 21 197 264 Credit loss allowance 555 072 507 925 249 978 223 088 2 811 953 4 348 016
As at 31 December 2019
Default rate (%) 7% 14% 14% 35% 96%Gross carrying amount 4 871 146 2 180 960 1 080 665 377 839 3 923 038 12 433 648 Credit loss allowance 325 588 297 933 146 629 130 857 3 759 555 4 660 562

70
ZIMRE HOLDINGS LIMITED 2020 ANNUAL REPORT
NOTES TO THE FINANCIAL STATEMENTSFOR THE YEAR ENDED 31 DECEMBER 2020 (continued)
3 GROUP FINANCIAL RISK MANAGEMENT (continued)3.3 Credit risk (continued)
Receivables for insurance premiums: (continued)
HISTORICAL COST
As at 31 December 2020
CurrentZWL
31 - 60 daysZWL
61 - 120 daysZWL
121 - 180 daysZWL
More than180 days
ZWLTotalZWL
Default rate (%) 7% 14% 14% 35% 42%Gross carrying amount (ZWL) 8 304 479 3 718 168 1 842 351 644 151 6 688 115 21 197 264 Credit loss al-lowance (ZWL) 555 072 507 925 249 978 223 088 2 811 953 4 348 016
As at 31 December 2019Current
ZWL31 - 60 days
ZWL61 - 120 days
ZWL121 - 180 days
ZWL180 days
ZWLTotalZWL
Default rate (%) 8% 19% 36% 62% 95%Gross carrying amount (ZWL) 1 085 890 486 186 240 905 84 229 874 535 2 771 745 Credit loss al-lowance (ZWL) 72 581 66 416 32 687 29 171 838 091 1 038 946
Trade receivables for sales of inventoryNo impairment allowance has been recognised on property sales receivables because the debtors pay a significant deposit upfront, therefore monthly repayments are affordable and title does not pass until the full amount has been settled. There has been no history of default.Trade receivables and contract assets are written off where there is no reasonable expectation of recovery. Indicators that there is no reasonable expectation of recovery include, amongst others, the failure of a debtor to engage in a repayment plan with the Group, and a failure to make contractual payments for a period of greater than 90 days. Impairment losses on trade receivables and contract assets are presented as net impairment losses within operating profit. Subsequent recoveries of amounts previously written off are credited against the same line item. All of the Group’s trade receivables and contract assets at amortised cost have not shown signs of deterioration of credit quality, and the loss allowance recognised during the period was therefore limited to 12 months expected losses. The credit risk of the investments is considered to have increased significantly if there have been missed contractual payments for a period of greater than 30 days.
Other receivablesOther receivables comprise receivables from disposal of investments in equity instruments, staff loans and sundry receivables. No impairment allowance has been recognised on equity instruments and sundry receivables as the identified credit loss allowance was immaterial.The Group uses the simplified approach to determine expected credit loss allowance for staff loans that are short term and the general approach for staff loans exceeding twelve months. For further details on allowance for credit loss on other receivables refer to note 16.

71
ZIMRE HOLDINGS LIMITED 2020 ANNUAL REPORT
NOTES TO THE FINANCIAL STATEMENTSFOR THE YEAR ENDED 31 DECEMBER 202 (continued)
3 GROUP FINANCIAL RISK MANAGEMENT (continued)3.3 Credit risk (continued)
Debt investments at amortised costAll of the Group’s debt investments at amortised cost are considered to have low credit risk, and the loss allowance was therefore limited to 12 months’ expected losses.These are investments in prescribed assets with a long tenure, issued by both government and private entities. The assets pay fixed interest coupons at half yearly or quarterly intervals. The principal amount is settled on maturity of the investment. There has been no indication of a lack of capacity by the counterparties to settle the coupons and principal amounts as they fall due, particularly because of their prescribed asset status. As such, probability of default is estimated to approximate zero. No impairment allowance has been recognised on these instruments.
The financial assets as at 31 December 2020 were held as follows:
INFLATION ADJUSTED HISTORICAL COST
Group2020ZWL
2019ZWL
2020ZWL
2019ZWL
Issued by the Government:
-Bonds 330 687 363 27 727 648 330 687 363 6 181 128
-Treasury bills 4 587 457 15 726 477 4 587 457 3 505 792
-Debentures 46 864 210 225 46 864 46 864
Issued by other financial institutions:
Deposits with financial institutions 96 880 240 81 531 776 96 880 240 18 175 301
Mortgage loan 10 833 264 13 289 419 10 833 264 2 962 516 443 035 188 138 485 545 443 035 188 30 871 601
CompanyIssued by other financial institutions, rated:
Unrated 46 864 210 225 46 864 46 864
3.4 Liquidity risk Liquidity risk is the risk that the Group may fail to meet its payment obligations when they fall due, the consequences of which may be
the failure to meet the obligations to creditors.
It is the Group’s policy to ensure that cash resources are available at all times to meet commitments as they arise. Cash outflows arise from the payment of intimated claims falling due, purchase of investments and other operating commitments. Such outflows are adequately matched by inflows from premium income, maturing investments and investment income. Management monitors daily the Group’s cumulative liquidity gap and cash and cash equivalents on the basis of actual and expected cash flows. Where gaps appear, action is taken in advance to close or minimise the gaps.
The table below summarises the maturity profile of the Group’s financial assets and financial liabilities based on contractual and undiscounted payments on a worst case scenario. The assets and liabilities disclosed are on a contractual undiscounted basis. Balances due within twelve months equal their carrying balances as the impact of discounting is not significant.

72
ZIMRE HOLDINGS LIMITED 2020 ANNUAL REPORT
NOTES TO THE FINANCIAL STATEMENTSFOR THE YEAR ENDED 31 DECEMBER 2020 (continued)
3 GROUP FINANCIAL RISK MANAGEMENT (continued)3.4 Liquidity risk (continued)
Liquidity gap analysis
Group
As at 31 December 2020 INFLATION ADJUSTED
Assets
On demand to3 months
ZWL
3 months to 1year
ZWL
Greater than1 yearZWL
Total contractual
cash flowsZWL
Financial assets:
- at fair value through profit or loss - 736 794 728 - 736 794 728
- at amortised cost - 443 035 188 - 443 035 188
- at fair value through other comprehensive income - - 361 667 728 361 667 728Trade and other receivables (excluding prepayments and statutory receivables) 523 417 992 721 796 255 - 1 245 214 247
Cash and cash equivalents 1 183 425 295 - - 1 183 425 295
Total assets 1 706 843 287 1 901 626 171 361 667 728 3 970 137 186
Liabilities
Outstanding claims 26 183 337 51 055 532 98 662 139 175 901 008
Lease liabilities 183 597 1 580 987 3 516 925 5 281 509
Borrowings 19 219 482 18 465 777 36 779 431 74 464 690
Trade and other payables (excluding statutory liabilities) 1 415 818 773 - - 1 415 818 773
Total liabilities 1 461 405 189 71 102 296 138 958 495 1 671 465 980
Liquidity gap 245 438 098 1 830 523 875 222 709 233 2 298 671 206
Cumulative liquidity gap 245 438 098 2 075 961 973 2 298 671 206 -

73
ZIMRE HOLDINGS LIMITED 2020 ANNUAL REPORT
NOTES TO THE FINANCIAL STATEMENTSFOR THE YEAR ENDED 31 DECEMBER 2020 (continued)
3 GROUP FINANCIAL RISK MANAGEMENT (continued)3.4 Liquidity risk (continued)
Liquidity gap analysis (continued)
INFLATION ADJUSTED
As at 31 December 2019Assets
On demand to3 months
ZWL
3 months to 1year
ZWL
Greater than1 yearZWL
Total contractual
cash flowsZWL
Financial assets:
- at fair value through profit or loss - 108 901 367 - 108 901 367
- at amortised cost - 138 485 545 - 138 485 545 Trade and other receivables (excluding prepayments and statutory receivables) 348 354 174 453 029 830 - 801 384 004
Cash and cash equivalents 410 188 652 - - 410 188 652
Total assets 758 542 826 700 416 742 - 1 458 959 568
Liabilities
Outstanding claims 23 948 430 46 697 632 90 240 725 160 886 787
Lease liabilities 823 590 7 092 079 15 776 418 23 692 087
Borrowings 7 005 565 6 623 505 51 213 448 64 842 518 Trade and other payables (excluding statutory liabilities) 832 900 791 - - 832 900 791
Total liabilities 864 678 376 60 413 216 157 230 591 1 082 322 183
Liquidity gap (106 135 550) 640 003 526 (157 230 591) 376 637 384
Cumulative liquidity gap (106 135 550) 533 867 976 376 637 384 -
Company INFLATION ADJUSTED
As at 31 December 2020
On demand to3 months
ZWL
3 months to 1year
ZWL
Greater than1 yearZWL
Total contractual
cash flowsZWL
Assets
Financial assets:
- at fair value through profit or loss - 6 390 221 - 6 390 221
- at amortised cost - 46 864 - 46 864
- at fair value through other comprehensive income - - 25 667 737 25 667 737
Trade and other receivables (excluding prepayments and
statutory receivables) 3 334 557 - - 3 334 557
Cash and cash equivalents 11 848 786 - - 11 848 786
Total assets 15 183 343 6 437 085 25 667 737 47 288 165
Liabilities
Lease liabilities 701 753 1 403 507 - 2 105 260
Trade and other payables (excluding statutory liabilities) 59 520 762 - - 59 520 762
Total liabilities 60 222 515 1 403 507 - 61 626 022
Liquidity gap (45 039 172) 5 033 578 25 667 737 (14 337 857)
Cumulative liquidity gap (45 039 172) (40 005 594) (14 337 857) -

74
ZIMRE HOLDINGS LIMITED 2020 ANNUAL REPORT
NOTES TO THE FINANCIAL STATEMENTSFOR THE YEAR ENDED 31 DECEMBER 2020 (continued)
3 GROUP FINANCIAL RISK MANAGEMENT (continued)3.4 Liquidity risk (continued)
Liquidity gap analysis (continued)
INFLATION ADJUSTED
As at 31 December 2019
On demand to3 months
ZWL
3 months to 1year
ZWL
Greater than1 yearZWL
Total contractual
cash flowsZWL
Assets
Financial assets:
- at fair value through profit or loss - 20 950 580 - 20 950 580
- at amortised cost - 210 225 - 210 225
- at fair value through other comprehensive income - - 56 927 150 56 927 150
Trade and other receivables (excluding prepayments and
statutory receivables) 2 998 035 - - 2 998 035
Cash and cash equivalents 2 547 650 - - 2 547 650
Total assets 5 545 685 21 160 805 56 927 150 83 633 640
Liabilities
Lease liabilities 232 347 2 091 124 2 649 541 4 973 012
Trade and other payables (excluding statutory liabilities) 9 809 835 - - 9 809 835
Total liabilities 10 042 182 2 091 124 2 649 541 14 782 847
Liquidity gap (4 496 497) 19 069 681 54 277 609 68 850 793
Cumulative liquidity gap (4 496 497) 14 573 184 68 850 793 -
Group
HISTORICAL COST
As at 31 December 2020
On demand to3 months
ZWL
3 months to 1year
ZWL
Greater than1 yearZWL
Total contractual
cash flowsZWL
Assets
Financial assets:
- at fair value through profit or loss - 736 794 728 - 736 794 728
- at amortised cost - 443 035 188 - 443 035 188 - at fair value through other comprehensive income - - 361 667 728 361 667 728
Trade and other receivables (excluding prepayments and
statutory receivables) 523 417 992 721 796 255 - 1 245 214 247
Cash and cash equivalents 1 183 425 295 - - 1 183 425 295
Total assets 1 706 843 287 1 901 626 171 361 667 728 3 970 137 186 Liabilities
Outstanding claims 26 183 337 51 055 532 98 662 139 175 901 008
Lease liabilities 183 597 1 580 987 3 516 925 5 281 509
Borrowings 19 219 482 18 465 777 36 779 431 74 464 690
Trade and other payables (excluding statutory liabilities) 1 415 818 773 - - 1 415 818 773
Total liabilities 1 461 405 189 71 102 296 138 958 495 1 671 465 980
Liquidity gap 245 438 098 1 830 523 875 222 709 233 2 298 671 206
Cumulative liquidity gap 245 438 098 2 075 961 973 2 298 671 206 -

75
ZIMRE HOLDINGS LIMITED 2020 ANNUAL REPORT
NOTES TO THE FINANCIAL STATEMENTSFOR THE YEAR ENDED 31 DECEMBER 2020 (continued)
3 GROUP FINANCIAL RISK MANAGEMENT (continued)3.4 Liquidity risk (continued)
Liquidity gap analysis (continued)
INFLATION ADJUSTED
As at 31 December 2019
On demand to3 months
ZWL3 months to 1
yearZWL
Greater than1 yearZWL
Total contractual
cash flowsZWL
Assets
Financial assets:
- at fair value through profit or loss - 24 276 610 - 24 276 610
- at amortised cost - 30 871 601 - 30 871 601
- at fair value through other comprehensive income - - 78 046 090 78 046 090 Trade and other receivables (excluding prepayments and statutory receivables) 77 656 127 107 088 221 - 184 744 348
Cash and cash equivalents 91 440 449 - - 91 440 449
Total assets 169 096 576 162 236 432 78 046 090 409 379 098
Liabilities
Outstanding claims 5 338 654 10 409 972 20 116 725 35 865 351
Lease liabilities 183 597 1 580 987 3 516 925 5 281 509
Borrowings 1 561 701 1 476 531 11 416 651 14 454 883 Trade and other payables (excluding statutory liabilities) 186 175 756 - - 186 175 756
Total liabilities 193 259 708 13 467 490 35 050 301 241 777 499
Liquidity gap (24 163 132) 148 768 942 42 995 789 167 601 599
Cumulative liquidity gap (24 163 132) 124 605 810 167 601 598 -
Company HISTORICAL COST
As at 31 December 2020
On demand to3 months
ZWL
3 months to 1year
ZWL
Greater than1 yearZWL
Total contractual
cash flowsZWL
Assets
Financial assets:
- at fair value through profit or loss - 6 390 221 - 6 390 221
- at amortised cost - 46 864 - 46 864
- at fair value through other comprehensive income - - 25 667 737 25 667 737 Other receivables (excluding prepayments and statutory receivables) 3 334 559 - - 3 334 557
Cash and cash equivalents 11 848 786 - - 11 848 786
Total assets 15 183 345 6 437 085 25 667 737 47 288 167
Liabilities
Lease liability 701 753 1 403 507 - 2 105 260
Trade and other payables (excluding statutory liabilities) 59 520 762 - - 59 520 762
Total liabilities 60 222 515 1 403 507 - 61 626 022
Liquidity gap (45 039 172) 5 033 578 25 667 737 (14 337 855)
Cumulative liquidity gap (45 039 172) (40 005 592) (14 337 855) -

76
ZIMRE HOLDINGS LIMITED 2020 ANNUAL REPORT
NOTES TO THE FINANCIAL STATEMENTSFOR THE YEAR ENDED 31 DECEMBER 2020 (continued)
3 GROUP FINANCIAL RISK MANAGEMENT (continued)3.4 Liquidity risk (continued)
Liquidity gap analysis (continued)
HISTORICAL COST
Company As at 31 December 2019
On demand to3 months
ZWL3 months to 1
yearZWL
Greater than1 yearZWL
Total contractual
cash flowsZWL
Assets
Financial assets:
- at fair value through profit or loss - 4 670 364 - 4 670 364 - at amortised cost - 46 864 - 46 864 - at fair value through other comprehensive income - - 25 667 737 25 667 737 Other receivables (excluding prepayments and statutory receivables) 668 331 - - 668 331 Cash and cash equivalents 567 929 - - 567 929 Total assets 1 236 260 4 717 228 25 667 737 31 621 225 LiabilitiesLease liability 51 796 466 160 485 997 1 003 953 Trade and other payables (excluding statutory liabilities) 12 170 872 - - 12 170 872 Total liabilities 12 222 668 466 160 485 997 13 174 825 Liquidity gap (10 986 408) 4 251 068 25 181 740 18 446 401
Cumulative liquidity gap (10 986 408) (6 735 340) 18 446 400 -
3.5 Investment riskThe Group’s investment risk management system operates through a hierarchy of investment limit approvals. Investments in excess of the specified limits require the approval of the Group Finance and Investment Committee. In addition, the Group Finance and Investment Committee makes all decisions regarding property investments and unquoted company share transactions.
3.6 Fair valueThe Group measures financial assets such as quoted and unquoted investments and non-financial assets such as investment property at fair value at reporting date.Fair value is the price that would be received to sell an asset or paid to transfer a liability in an orderly transaction between market participants at the measurement date. The fair value measurement is based on the presumption that the transaction to sell the asset or transfer the liability takes place either:• in the principal market for the asset or liability, or• in the absence of a principal market, in the most advantageous market for the asset or liabilityThe principal or the most advantageous market must be accessible to the Group.The fair value of an asset or a liability is measured using the assumptions that market participants would use when pricing the asset orliability, assuming that market participants act in their economic best interest.For assets and liabilities that are recognised in the financial statements on a recurring basis, the Group determines whether transfers have occurred between levels in the hierarchy by re-assessing the categorisation (based on the lowest level input that is significant to the fair value measurement as a whole) at the end of each reporting period.A fair value measurement of a non-financial asset takes into account a market participant’s ability to generate economic benefits by using the asset in its highest and best use or by selling it to another market participant that would use the asset in its highest and best use.The Group uses valuation techniques that are appropriate in the circumstances and for which sufficient data is available to measure fair value, maximising the use of relevant observable inputs and minimising the use of unobservable inputs.Determination of fair value and fair value hierarchyObservable inputs reflect market data obtained from independent sources and unobservable inputs reflect the Group’s marketassumptions. These two types of inputs have created the following fair value hierarchy:• Level 1: quoted (unadjusted) prices in active markets for identical assets and liabilities. The level includes listed equity securities traded
on active markets.• Level 2: other techniques for which all inputs which have a significant effect on the recorded fair value are observable, directly (that is,
as prices) or indirectly (that is derived from prices).• Level 3: techniques which use inputs which have a significant effect on the recorded fair value that are not based on observable market
data.

77
ZIMRE HOLDINGS LIMITED 2020 ANNUAL REPORT
NOTES TO THE FINANCIAL STATEMENTSFOR THE YEAR ENDED 31 DECEMBER 2020 (continued)
3 GROUP FINANCIAL RISK MANAGEMENT (continued)3.6 Fair value (continued)
Liquidity gap analysis (continued)The following table shows an analysis of financial instruments recorded at fair value of the fair value hierarchy:
Level 1ZWL
Level 2ZWL
Level 3ZWL
TotalZWL
As at 31 December 2020Financial assets at fair value through profit or loss 736 794 728 - - 736 794 728Financial assets at fair value through other comprehen-sive income - - 361 667 728 361 667 728
Total 736 794 728 - 361 667 728 1 098 462 456
As at 31 December 2019Financial assets at fair value through profit or loss 108 901 367 - 108 901 367Financial assets at fair value through other comprehen-sive income - - 350 103 492 350 103 492
Total 108 901 367 - 350 103 492 459 004 859
Listed equity investments valuation
Level 1 is made up of the Group’s investments in equity securities listed on the Zimbabwe Stock Exchange and other regional bourses.
Unlisted equity investments valuation
Valuation techniqueLevel 3 comprises the Group’s investments in unlisted equities. The Group used the relative valuation technique to value unlisted equities. Under this model, various value indicators of publicly traded stocks are used as comparatives for companies in the same industry. The relative valuation approach considers discounted cash flow valuation too intricate to establish, arguing that medium and long-range earnings projections are too intricate to make accurately and that the discount rates used are subjective. Instead, various valuation parameters of publicly traded stocks such as price to book ratios (“PBV”), relative market capitalisation can be used as comparatives for companies in the same industry.The PBV so obtained is then applied to the book value of equity to arrive at an implied value.Valuation processThe Group engaged an independent consultant to assist management to determine the fair values of the unlisted equities at each reporting date. Management provides the independent consultant with prior periods’ audited financials statements, approved future projected cash flows and other non financial strategic information and they perform the following:• determine return on equity using the earnings and equity;• normalise return on equity for forecast periods;• calculate the predicted price/book value based on a regression model, by considering other publicly tradable reinsurance ‘businesses
within the region’s PBV ratios.; and • apply the regressed price to book ratio to the firm’s equity to determine the price. As part of the engagement, the independent consultant provides the determined valuations for discussions.
Comparison of carrying amounts and fair values for assets and liabilities not held at fair valueThe fair value is an estimate of the price that would be received to sell an asset or paid to transfer a liability in an orderly transaction between market participants at the measurement date. The following table summarises the fair value of assets and liabilities not measured at fair value on the Group’s statement of financial position.

78
ZIMRE HOLDINGS LIMITED 2020 ANNUAL REPORT
Balanced risk taking for strength and stability.
Through industry leading expertise and innovative approaches, we transform your risks into opportunities for your business to grow.
Block D, 2nd Floor, Smatsatsa O�ce ParkStand Number 10667, Borrowdale, Harare, ZimbabweTel: +263 24 2870 762-8 | Website: www.emeritus.com

79
ZIMRE HOLDINGS LIMITED 2020 ANNUAL REPORT
NOTES TO THE FINANCIAL STATEMENTSFOR THE YEAR ENDED 31 DECEMBER 2020 (continued)
4 CAPITAL MANAGEMENT POLICIESThe Group’s objective when managing capital is to safeguard the Group’s ability to continue as a going concern, so that it can continueto provide returns for shareholders and benefits to other stakeholders.The Group’s capital comprises ordinary share capital, share premium, reserves and retained earnings. It is the Group’s objective to retain a capital position that supports the development of the business. The Group manages its capital structure and makes adjustments to it, in light of changes in the economic conditions. Where necessary, capital is redeployed to subsidiaries from the holding company.The subsidiaries with minimum capital requirements imposed by their regulators were capitalised as follows:
INFLATION ADJUSTED2020 2019
Shareholders’equity
Minimumregulatory
capitalShareholders’
equity
Minimumregulatory
capitalEmeritus Reinsurance Zimbabwe (Private) Limited 1 136 206 659 112 500 000 1 079 189 687 504 658 758 Emeritus Reinsurance Zambia Limited ** 66 409 780 77 279 753 64 323 145 106 861 877 Emeritus Reinsurance Company Limited Malawi 272 220 142 158 773 843 248 768 552 153 189 820 Emeritus Resegguros SA Mozambique 165 100 516 106 318 847 123 358 575 118 565 948 Emeritus Reinsurance Company Limited Botswana 116 370 469 75 737 500 229 843 651 70 577 193 Credit Insurance Zimbabwe Limited 122 764 486 37 500 000 144 902 085 168 219 586 Fidelity Life Assurance of Zimbabwe Limited 257 766 272 75 000 000 157 050 590 75 000 000
HISTORICAL COSTEmeritus Reinsurance Zimbabwe (Private) Limited 212 974 465 112 500 000 104 103 984 112 500 000 Emeritus Reinsurance Zambia Limited ** 66 409 780 77 279 753 14 339 103 23 821 961 Emeritus Reinsurance Company Limited Malawi 272 220 142 158 773 843 55 456 210 34 149 521 Emeritus Resegguros SA Mozambique 165 100 516 106 318 847 27 499 453 26 431 066 Emeritus Reinsurance Company Limited Botswana 116 370 469 75 737 500 20 942 856 15 733 273 Credit Insurance Zimbabwe Limited 125 665 681 37 500 000 31 656 867 37 500 000 Fidelity Life Assurance of Zimbabwe Limited 174 228 270 75 000 000 139 620 883 75 000 000
The subsidiary meets the minimum solvency requirements** The Group will inject more capital to ensure the company is adequately capitalised through a capital reorganisation at holding company level.
5 INSURANCE RISK MANAGEMENT5.1 Definition of insurance risk
Insurance risk is the risk that actual future underwriting policyholder behaviour and expense experience will differ from that assumed in measuring policyholder liabilities and assets and pricing products. Insurance risk arises due to uncertainty regarding the timing andamount of future cash flows from insurance contracts. This could be due to variations in mortality, morbidity, policyholder behaviour or expense experience in the case of life products, claims incidence, claim severity or expense experience in the case of short-term insurance products. These could have adverse impacts on the Group’s earnings and capital if different from those assumed.The insurance risks that the Group is exposed to that have the greatest impact on the financial position and comprehensive income are covered in more detail in section 5.8.
5.2 General management of insurance riskThe management and staff of all subsidiaries accepting insurance risk are responsible for the day-to-day identification monitoring and treatment of insurance risk. It is also management’s responsibility to report any material insurance risks, risk events and issues identified to senior management through certain pre-defined escalation procedures. In addition to the management of risk by the subsidiary companies, the Group has the following insurance risk management controls:The Group Internal Audit and Risk DepartmentThis provides independent oversight on compliance with the Group’s risk management policies and procedures and the effectiveness of the Group’s insurance risk management processes.
Balanced risk taking for strength and stability.
Through industry leading expertise and innovative approaches, we transform your risks into opportunities for your business to grow.
Block D, 2nd Floor, Smatsatsa O�ce ParkStand Number 10667, Borrowdale, Harare, ZimbabweTel: +263 24 2870 762-8 | Website: www.emeritus.com

80
ZIMRE HOLDINGS LIMITED 2020 ANNUAL REPORT
NOTES TO THE FINANCIAL STATEMENTSFOR THE YEAR ENDED 31 DECEMBER 2020 (continued)5.2 General Management of Insurance risk (continued)
The Risk CommitteeThe Risk Committee is responsible for managing all aspects of insurance risk in the Group.This Committee reports directly or indirectly to board committees (Audit, Risk and Compliance Committee)
The functions of the Committee include:• recommending insurance risk related policies to the Audit, Risk and Compliance Committee for approval and ensure compliance
therewith.• ensuring that insurance risk is appropriately controlled by monitoring insurance risk triggers against agreed limits and/or procedures.• gaining assurance that material insurance risks are being monitored and that the level of risk taken is in line with the risk appetitestatement
at all times.• considering any new insurance risks introduced through new product development or strategic development and how these risksshould
be managed.• monitoring, ratifying and/or escalating to Audit, Risk and Compliance Committee and Reinsurance Board all material insurance risk-
related breaches. Excesses highlighting the corrective action undertaken to resolve the issue.• monitoring insurance risk capital requirements as they apply to the management of the Group and its subsidiaries’ statements offinancial
position; and• approving the reinsurance, underwriting and claim management strategies and oversee the implementation of those strategies.Statutory actuaryThe statutory actuaries provide oversight on the long-term insurance risks undertaken by the Group in that they are required to:• report at least annually on the financial soundness of the reassurance division within the Group.• oversee the setting of assumptions used to provide best estimate liabilities plus compulsory and discretionary margins (as described in
the accounting policies) in accordance with the assumption setting policy; and• report on the actuarial soundness of premium rates in use for new business and on the profitability of the business taking into
consideration the reasonable benefit expectations of policyholders and the associated insurance and market risks.

81
ZIMRE HOLDINGS LIMITED 2020 ANNUAL REPORT
NOTES TO THE FINANCIAL STATEMENTSFOR THE YEAR ENDED 31 DECEMBER 2020 (continued)
5 INSURANCE RISK MANAGEMENT (continued)5.2 General Management of Insurance risk (continued)
Capital adequacy requirementsA minimum level of solvency is required to be held within each insurance subsidiary to meet the minimum regulatory capital requirements (“CAR”) For the long term insurance subsidiaries the CAR is calculated to determine whether the excess of assets over liabilities is sufficient to provide for the possibility of actual future experience departing from assumptions made in calculating the policy holder liabilities and against fluctuations in the value of assets. The CAR is actuarially determined taking into account forward looking information.
PricingPricing risk is managed by carefully establishing criteria by which each potential customer is allocated to the appropriate risk category, applying the underwriting rules, and by establishishing prices appropriate to each category. Underwriting performance is measured by monitoring the claims loss ratio which is the ratio of claims to premiums.ReservingFor claims that have been reported by the financial position date, expert assessors estimate the expected cost of final settlement. For expected claims that have not been reported by the financial position date an incurred but not reported (“IBNR”) provision is calculated using appropriate techniques. Consideration is also given to any stipulated minimum IBNR prescribed by regulations. These provisions for claims are not discounted for the time value of money due to the expected short duration of settlement. Using the experience of a range of specialist claims assessors, provisions are reviewed regularly to ensure they are sufficient.CatastrophicCatastrophic risk has the potential to cause significant loss or impact on current year earnings and capital through a single event or a number of correlated events. Reinsurance and the diversification of types of short-term insurance offered are used to reduce risks from single catasrophic events or accumulations of risk. Various reinsurance arrangements are in place, with retention levels and catastrophe cover levels varying by line of business.
5.3 Risk identification, assessment, measurement and managementRisk management takes place prior to the acceptance of risks through the product development, underwriting, pricing and claims assessment process and at the point of sale. Risks continue to be managed through the measurement, monitoring and treatment of risks once the risks are contracted.
5.3.1 Risk management through product development, pricing and at the point of saleThe product development and pricing process defines the terms and conditions on which the Group is willing to accept risks. Once a policy has been sold, the Group takes on risk for the duration of the contract and the Group cannot unilaterally change the terms and conditions of the policy except where the policy allows for rate reviews. It is for these reasons that risks need to be carefully assessed and appropriately mitigated before a product is launched and before new policies are accepted onto the Group’s statement of financial position. In order to manage these risks, new products need to comply with the Group’s minimum risk acceptance criteria.The product development and approval process ensures that:• risks inherent in new products are identified and quantified;• sensitivity tests are performed to enhance understanding of the risks and appropriateness of mitigating actions;• pricing is adequate for the risk undertaken;• product design takes account of various factors including size and timing of fees and charges, appropriate levels of minimum premiums,
commission structures and policy terms and conditions;• the Group makes use of reinsurance or retrocession to reduce its exposures to some insurance risks;• customer needs and expectations will be met by the product; and• post implementation reviews are performed to ensure that intended outcomes are realised and to determine if any further action is
required.5.3.2 Risk management post-implementation of products and of in-force policies
The ongoing management of insurance risk, once the risk has been contracted, includes the management of costs, premium adjustments where permitted and appropriate, management strategies and training of cedants to encourage customers to retain their policies, and careful follow up on disability claims, default claim and early death claims.Further, experience investigations are conducted at least annually on all significant insurance risks to ascertain the extent of deviations from assumptions and their financial impacts. If the investigations indicate that these deviations are likely to persist in future, the assumptions will be adjusted accordingly for the subsequent measurement of policyholder liabilities and assets. Furthermore, any deviations that are likely to persist are also used to inform the product development and pricing of new existing products.Insurance risks are assessed and reviewed against the Group’s risk appetite and risk target. Mitigating action are developed for any risks that fall outside of management’s assessment of risk appetite in order to reduce the level of risk to within the approved tolerance limits.Embedded value sensitivities for insurance risks are also prepared for internal use and reporting to analysts.

82
ZIMRE HOLDINGS LIMITED 2020 ANNUAL REPORT
NOTES TO THE FINANCIAL STATEMENTSFOR THE YEAR ENDED 31 DECEMBER 2020 (continued)
5 INSURANCE RISK MANAGEMENT (continued)5.4 Reporting
Each relevant customer facing unit prepares monthly and quarterly reports that include information on insurance risk. The reports are presented to the relevant customer facing unit executive committees and relevant risk committees for review and discussion. Major insurance risks are incorporated into a report of the internal audit on the Group’s overall risk which is submitted to the Group Audit, Risk and Compliance Committee. Where it is deemed necessary, material insurance risk exposures are escalated to the board.In respect of insurance risks, the reports contain the results of experience investigations conducted along with other indicators of actual experience. These reports also raise any issues identified and track the effectiveness of any mitigation plans put in place.
5.5 Policyholder behaviour riskThis is the risk of adverse financial impact caused by actual policyholders’ behaviour deviating from expected policyholders’ behaviour,mainly due to:• regulatory and legislative changes (including taxation);• changes in economic conditions;• sales practices;• competitor behaviour;• policy conditions and practices; and• policyholders’ perceptions.The primary policyholder behaviour risk is persistency risk. This generally arises when policyholders discontinue or reduce contributions, or terminate their policies at a rate that is not in line with expectations. This behaviour results in a loss of future premiums that are designed to recoup expenses and commission incurred early in the life of the contract and to provide a profit margin or return on capital. A decrease in persistency generally gives rise to a loss, as the loss of these future charges generally exceeds the charges that the Group applies to the policyholder benefits in these events. However with certain products the general principle does not always apply. In the measurement of policyholder liabilities and assets, margins as described in the accounting policies are added to the best estimate withdrawal rates. In addition, an allowance is made for the withdrawal risk in the Technical Capital Adequacy Requirement (“TCAR”) and Ordinary Capital Adequacy Requirement (“OCAR”) calculations, with the TCAR providing a capital requirement underpin of meeting the surrender benefits on all policies where this is onerous.In the calculation of economic capital requirements, allowance is made for the following risks in respect of policyholder behaviour:• The risk that the actual level of withdrawals is different from expected; and• The risk of withdrawal catastrophe to capture a run-on-a-bank type of scenario.
5.6 Underwriting risksThe primary purpose of underwriting is to ensure that an appropriate premium is charged for each risk and that cover is not offered to uninsurable risks. Underwriting risks are the risks that future demographic or claims incidence experience will exceed the allowance for expected demographic or claims incidence experience, as determined through provisions, pricing, risk measures and value measures.Underwriting risks include, amongst others, mortality and morbidity risks, longevity risks and non-life (short-term insurance) risks.The main risks that the Group is exposed to are as follows:• mortality risk – risk of loss arising due to policyholder death experience being different than expected• longevity risk – risk of loss arising due to the annuitant living longer than expected• investment return risk – risk of loss arising from actual returns being different than expected• expense risk – risk of loss arising from expense experience being different than expected• policyholder decision risk – risk of loss arising due to policyholder experiences (lapses and surrenders) being different than expected
These risks do not vary significantly in relation to the location of the risk insured by the Group, type of risk insured or by industry.

83
ZIMRE HOLDINGS LIMITED 2020 ANNUAL REPORT
NOTES TO THE FINANCIAL STATEMENTSFOR THE YEAR ENDED 31 DECEMBER 2020 (continued)
5 INSURANCE RISK MANAGEMENT (continued)5.6 Underwriting risks (continued)
5.6.1 Mortality and morbidity riskMortality risk is the risk of adverse financial impact due to actual mortality (death) claims being higher than anticipated.Morbidity risk is the risk of adverse financial impact due to policyholder health related (disablement and dread disease) claims being higher than expected. The Group has the following processes and procedures in place to manage mortality and morbidity risk.
(a) Underwriting strategyThe underwriting strategy seeks diversity to ensure a balanced portfolio and is based on a large portfolio of similar risks over a number of years and as such, it is believed that this reduces the variability of the outcome. The Group manages its assurance risk through underwriting limits, approval procedures for transactions that involve new products or that exceed set limits, pricing guidelines, centralized management of reassurance and monitoring of emerging issues. The Group uses several methods to assess and monitor assurance risk exposures both for individual types of risks insured and overall risks. These methods include internal risk measurement models, sensitivity and scenario analyses.Underwriting guidelines concerning authority limits and procedures to be followed are in place.All individual business applications for risk cover are underwritten except for some policies with smaller sums assured where specific allowance for no underwriting has been made in the product design and pricing. For other smaller sums assured, the underwriting process is largely automated. For individual and institutional business, larger sums assured in excess of specified limits are reviewed by experienced underwriters and evaluated against established processes. For institutional risk business, these specified limits are scheme specific based on the size of the scheme , membership, average age, gender distribution , industry and distribution of sums assured. Since applications on institutional business below the specified limits are not medically underwritten, very few lives are medically tested . However, the annually reviewable terms on institutional business enable premiums to keep pace with emerging claims experience.Specific testing for HIV and other medicals is carried out based on the assessment of the risk.Part of the underwriting process involves assessing the current health conditions and family medical history of applicants. Terms and conditions are varied accordingly.Non-standard risk, such as hazardous pursuits and medical conditions, are assessed at underwriting stage.Financial underwriting is used where necessary to determine insurable interest.The non-life insurance risks are sensitive to certain assumptions. The table below shows the qualitative sensitivity of certain triggers related to insurance business:Risk triggers General effect on insurance market Effect on the Group
1. Many cedants andcompetition in the domiciled market
Undercutting premium ratesUnderwriting bad business
Lower premiums, increase in claimsration, lower profitsIncrease in claims, increase in bad debts,lower profits
2. Weakening local currency Underinsurance of cedants Increase in claim ratios on partial claims,lower profit
3. Lack of foreign currencyand strict exchange controlsin local markets.
Inability to discharge external claimsand retrocessionsSubstandard construction and riskmanagement practices
Lower premiums and risk spread,increase in claims ratios, lower profitsIncreased fire and engineering risk, increase in claims, lower profits
4. Weak risk practices ofcedants and underlying clients
Having insurance as the onlyeffective risk management item Increase in claims, lower profit
(b) Pricing strategyThe theory of probability is applied to the pricing and provisioning for a portfolio of assurance contracts. The principal risk is that the frequency and severity of claims is greater than expected. Assurance events are, by their nature, random, and the actual number and size of events during any one year may vary from those estimated using established statistical techniques.
84
ZIMRE HOLDINGS LIMITED 2020 ANNUAL REPORT
NOTES TO THE FINANCIAL STATEMENTSFOR THE YEAR ENDED 31 DECEMBER 2020 (continued)
5 INSURANCE RISK MANAGEMENT (continued)5.6.1 Mortality and morbidity risk (continued)
Premium rates are differentiated by factors which historical experience has shown are significant determinants of mortality and morbidity claims experience.Prior to taking on individual risk policies, appropriate underwriting processes are conducted, such as medical tests, which influence pricing on the policy prior to acceptance.The actual claims experience is monitored on a monthly basis so that deteriorating experience can be timeously identified. Product pricing and the measurement of the liabilities are changed if the deteriorating experience is expected to continue and cannot be mitigated. Detailed mortality and morbidity investigations are conducted on a bi-annual basis for key products.Allowance for HIV related deaths is made in product pricing and in the measurement of policyholder liabilities and assets.Key assumptions Material judgement is required in determining the liabilities and in the choice of assumptions. Assumptions in use are based on past experience, current internal data, external market indices and benchmarks which reflect current observable market prices and other published information. Assumptions and prudent estimates are determined at the date of valuation and no credit is taken for possible beneficial effects of voluntary withdrawals. Assumptions are further evaluated on a continuous basis in order to ensure realistic and reasonable valuations.The key assumptions to which the estimation is particularly sensitive are as follows:Mortality rates Assumptions are based on standard tables, according to the type of contract written. An investigation into the actual mortality experience of the Group is used to compare the experience to the standard table. Adjustment to the standard table may be made where justified by the experience. An appropriate, but not excessive, prudent allowance is made for expected future improvements. Assumptions are differentiated by sex, underwriting class and contract type.An increase in rates will lead to a larger number of claims (and claims could occur sooner than anticipated) which will increase the expenditure and reduce profits for the shareholders.LongevityAssumptions are based on standard industry and national tables, adjusted when appropriate to reflect the Group’s own risk experience. An appropriate, but not excessive, prudent allowance is made for expected future improvements. Assumptions are differentiated by sex, underwriting class and contract type.An increase in longevity rates will lead to an increase in the number on annuity payments to be made, which will increase the expenditure and reduce profits for the shareholders.Investment return and inflationEconomic assumptions are based on the existing investment portfolio, and take account of the expected future medium to long-term economic environment. These estimates are based on current market returns as well as expectations about future economic and finan-cial developments.An increase in investment return would lead to an increase in profits for the shareholders.ExpensesOperating expenses assumptions reflect the projected costs of maintaining and servicing in-force policies and associated overhead expenses. The current level of expenses is taken as an appropriate expense base, adjusted for expected expense inflation if appropriate.An increase in the level of expenses would result in an increase in expenditure, thereby reducing profits for the shareholders.Lapse and surrender ratesLapse relates rates to the termination of policies on premiums not paid up. Surrenders relate to the voluntary termination of policies by policyholders. Policy termination assumptions are determined using statistical measures based on the Group’s experience and vary by product type, policy duration and sales trends. For lapses, the Group’s actual lapse experience is investigated. The lapse assumption is set based on this assumption but at a level that is expected to be consistent from year to year.An increase in lapse rates early in the life of the policy would tend to reduce profits for shareholders, but later increases are broadly neutral in effect.Discount rateLife insurance liabilities are determined as the sum of the discounted value of the expected benefits and future administration expenses directly linked to the contract, less the discounted value of the theoretical premiums that would be required to meet these future cash outflows. Discount rates are based on current industry risk rates, adjusted for the Group’s own risk exposure.
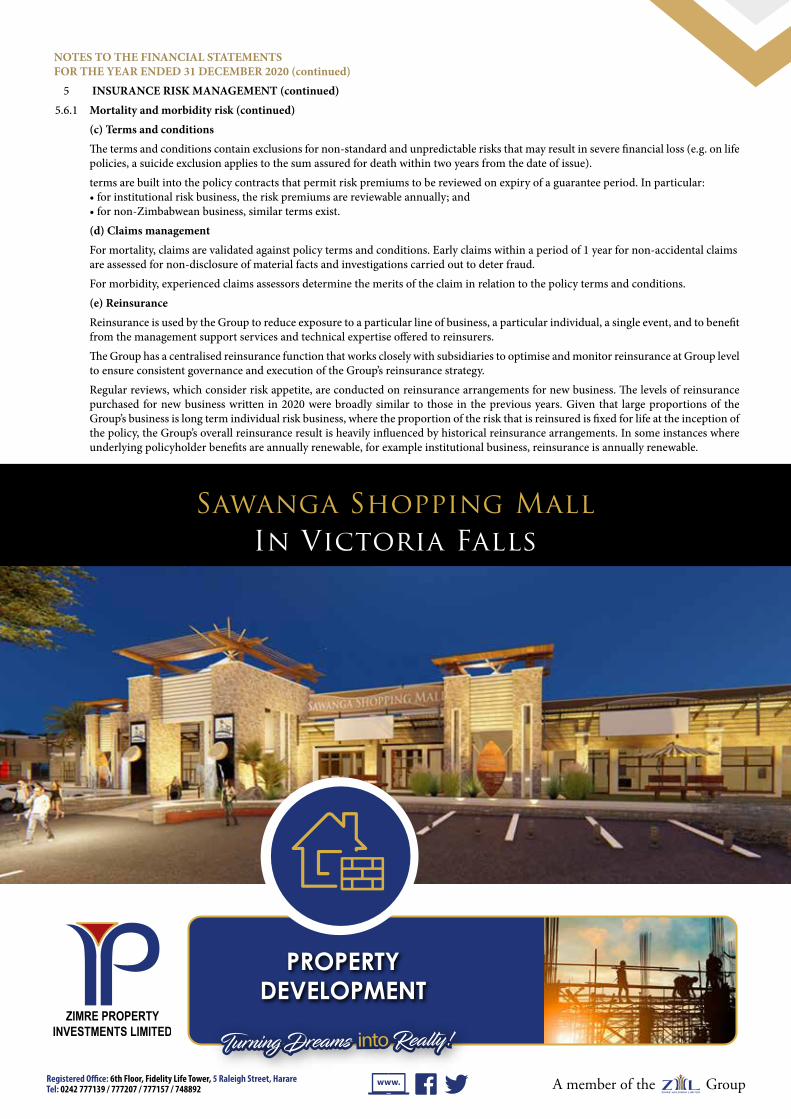
85
ZIMRE HOLDINGS LIMITED 2020 ANNUAL REPORT
NOTES TO THE FINANCIAL STATEMENTSFOR THE YEAR ENDED 31 DECEMBER 2020 (continued)
5 INSURANCE RISK MANAGEMENT (continued)5.6.1 Mortality and morbidity risk (continued)
(c) Terms and conditionsThe terms and conditions contain exclusions for non-standard and unpredictable risks that may result in severe financial loss (e.g. on life policies, a suicide exclusion applies to the sum assured for death within two years from the date of issue).terms are built into the policy contracts that permit risk premiums to be reviewed on expiry of a guarantee period. In particular:• for institutional risk business, the risk premiums are reviewable annually; and• for non-Zimbabwean business, similar terms exist.(d) Claims managementFor mortality, claims are validated against policy terms and conditions. Early claims within a period of 1 year for non-accidental claimsare assessed for non-disclosure of material facts and investigations carried out to deter fraud.For morbidity, experienced claims assessors determine the merits of the claim in relation to the policy terms and conditions. (e) ReinsuranceReinsurance is used by the Group to reduce exposure to a particular line of business, a particular individual, a single event, and to benefit from the management support services and technical expertise offered to reinsurers.The Group has a centralised reinsurance function that works closely with subsidiaries to optimise and monitor reinsurance at Group level to ensure consistent governance and execution of the Group’s reinsurance strategy.Regular reviews, which consider risk appetite, are conducted on reinsurance arrangements for new business. The levels of reinsurance purchased for new business written in 2020 were broadly similar to those in the previous years. Given that large proportions of the Group’s business is long term individual risk business, where the proportion of the risk that is reinsured is fixed for life at the inception of the policy, the Group’s overall reinsurance result is heavily influenced by historical reinsurance arrangements. In some instances where underlying policyholder benefits are annually renewable, for example institutional business, reinsurance is annually renewable.
Sawanga Shopping MallIn Victoria Falls
86
ZIMRE HOLDINGS LIMITED 2020 ANNUAL REPORT
NOTES TO THE FINANCIAL STATEMENTSFOR THE YEAR ENDED 31 DECEMBER 2020 (continued)
5 INSURANCE RISK MANAGEMENT (continued)5.6 Underwriting risks (continued)
5.6.1 Mortality and morbidity risk (continued)(e) Reinsurance (continued)Existing reinsurance arrangements include proportional reinsurance (quota share and surplus type arrangements) on both a treaty and facultative basis and catastrophe reinsurance which is renewed annually.Catastrophe reinsurance is consolidated across subsidiaries and is in place to reduce the risk of many claims arising from the same event. Various events are excluded from the catastrophe reinsurance (e.g. epidemics and radioactive contamination).
5.7 Non-life reinsurance riskThe principal risk the Group faces under insurance contracts is that the actual claims and payments or the timing thereof, differ fromexpectations. This is influenced by the frequency of claims, severity of claims and actual payments made. Therefore, the objective of the Group is to ensure that sufficient reserves are available to cover these liabilities. The risk exposure is mitigated by diversification across a large portfolio of insurance contracts. The variability of risks is also improved by careful selection and implementation of underwriting guidelines, as well as the use of reinsurance arrangements. The Group purchases reinsurance as part of its risks transfer programme. Reinsurance ceded is placed on both a proportional and non–proportional basis. Amounts recoverable from reinsurers are estimated in a manner consistent with the outstanding claims provision and are in accordance with the reinsurance contracts. The Group’s placement of reinsurance is diversified such that it is neither dependent on a single reinsurer nor are the operations of the Group substantially dependent upon any single reinsurance contract.The variability of risks is improved by careful selection and implementation of underwriting strategies, which are designed to ensure that risks are diversified in terms of type of risk and level of insured benefits. This is largely achieved through diversification across industry sectors and geography. Risk management is very vital starting from pre-risk acceptance where some large risks or business perceived risky is surveyed and improvement recommendations passed before cover commences. Selected running risks are also surveyed for risk improvement and mitigating chances and severity of losses. Risk management is thus filtered into the whole underwriting process to manage the portfolio. Furthermore, firm claim management policies to assess all new and on-going claims, regular detailed review of claims handling procedures and frequent investigation of possible fraudulent claims are all policies and procedures put in place to reduce the risk exposure of the Group. The Group further enforces a policy of actively managing and promptly pursuing claims, in order to reduce its exposure to unpredictable future developments that can negatively impact the business. The Group has also limited its exposure by imposing maximum claim amounts on certain contracts as well as the use of reinsurance arrangements in order to limit exposure to catastrophic events. The purpose of these underwriting and reinsurance strategies is to limit exposure to catastrophes based on the Group’s risk appetite as decided by management.Underwriting strategyConcentration of insurance risk and policies mitigating the concentrations within the insurance process, concentrations of risk may arise where a particular event or series of events could impact heavily upon the Group’s resources. The Group monitors the concentration risk by class of business and geographical spread.
Types of contractsFire: provide indemnity for loss or damage to property caused by perils such as fire, lightning,
explosion, earthquakes, floods and malicious damage.
Accident: provide indemnity for third party bodily injury, property damage, professional indemnity, group personal accident and legal expenses.
Motor: provide indemnity for loss or damage to the insured motor vehicle.Engineering: provide indemnity for losses sustained through use of machinery and equipment or erection
of buildings or structures.Marine: provide indemnity for cargo, hull and third party bodily injury or property damage classes
of business.Agriculture: provide indemnity for loss of income or crop damage due to damage due hail, floods, pests
and fire. Aviation: provide indemnity for cargo, hull and third party bodily injury or property damage classes
of business.
The concentration of insurance risk before and after reinsurance by territory arising from non-life insurance contracts accepted is summarised overleaf:

87
ZIMRE HOLDINGS LIMITED 2020 ANNUAL REPORT
We believe in you and the future you see in your mind’s eye.That is why we have designed our unique products and services to make sure you realise your dreams and achieve your goals.
Take the first step towards your future today and let us get you there.
SEE YOUR FUTURE TODAY!
www.fidelitylife.co.zw
SEEINGIS BELIEVING
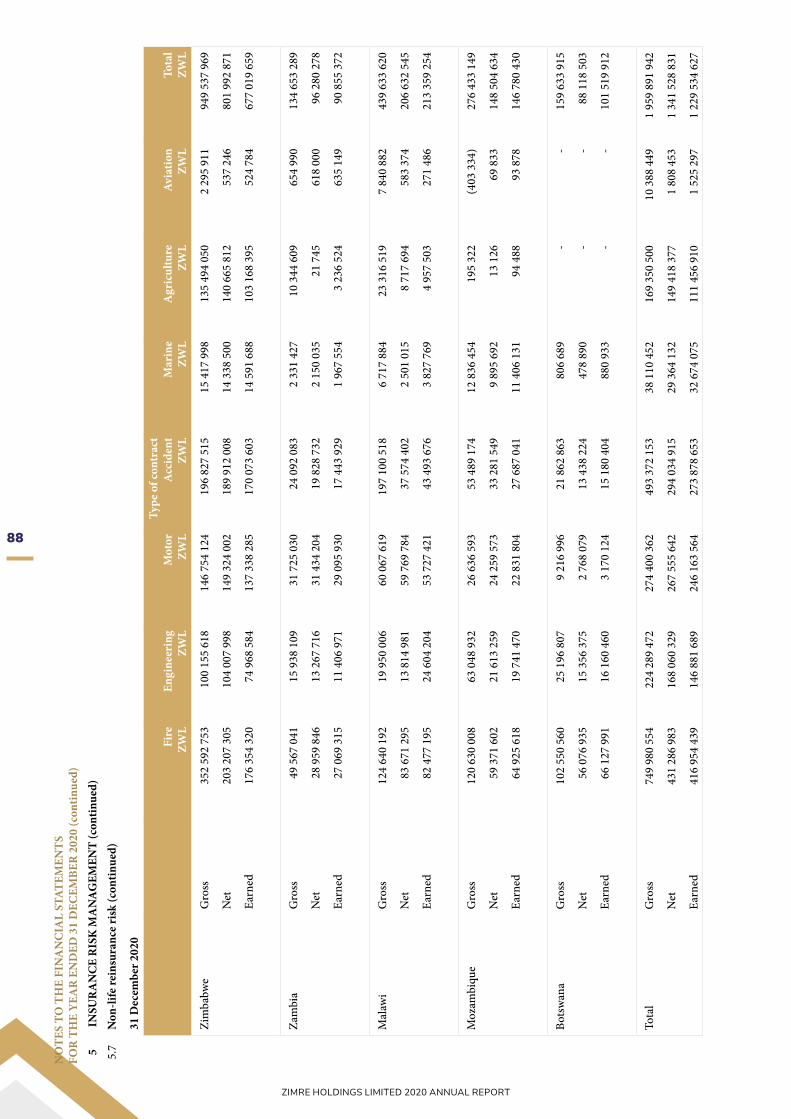
88
ZIMRE HOLDINGS LIMITED 2020 ANNUAL REPORT
NO
TES
TO T
HE
FIN
AN
CIA
L ST
ATEM
ENTS
FOR
TH
E Y
EAR
EN
DED
31
DEC
EMBE
R 2
020
(con
tinue
d)5
INSU
RA
NC
E R
ISK
MA
NA
GEM
ENT
(con
tinue
d)5.
7N
on-li
fe re
insu
ranc
e ri
sk (c
ontin
ued)
31 D
ecem
ber 2
020
Fire
ZWL
Engi
neer
ing
ZWL
Mot
orZW
L
Type
of c
ontr
act
Acc
iden
tZW
LM
arin
eZW
LA
gric
ultu
reZW
LAv
iatio
nZW
LTo
tal
ZWL
Zim
babw
eG
ross
352
592
753
100
155
618
146
754
124
196
827
515
15
417
998
135
494
050
2 2
95 9
11 9
49 5
37 9
69
Net
203
207
305
104
007
998
149
324
002
189
912
008
14
338
500
140
665
812
537
246
801
992
871
Earn
ed 1
76 3
54 3
20 7
4 96
8 58
4 1
37 3
38 2
85 1
70 0
73 6
03 1
4 59
1 68
8 1
03 1
68 3
95 5
24 7
84 6
77 0
19 6
59
Zam
bia
Gro
ss 4
9 56
7 04
1 1
5 93
8 10
9 3
1 72
5 03
0 2
4 09
2 08
3 2
331
427
10
344
609
654
990
134
653
289
Net
28
959
846
13
267
716
31
434
204
19
828
732
2 1
50 0
35 2
1 74
5 6
18 0
00 9
6 28
0 27
8
Earn
ed 2
7 06
9 31
5 1
1 40
6 97
1 2
9 09
5 93
0 1
7 44
3 92
9 1
967
554
3 2
36 5
24 6
35 1
49 9
0 85
5 37
2
Mal
awi
Gro
ss 1
24 6
40 1
92 1
9 95
0 00
6 6
0 06
7 61
9 1
97 1
00 5
18 6
717
884
23
316
519
7 8
40 8
82 4
39 6
33 6
20
Net
83
671
295
13
814
981
59
769
784
37
574
402
2 5
01 0
15 8
717
694
583
374
206
632
545
Earn
ed 8
2 47
7 19
5 2
4 60
4 20
4 5
3 72
7 42
1 4
3 49
3 67
6 3
827
769
4 9
57 5
03 2
71 4
86 2
13 3
59 2
54
Moz
ambi
que
Gro
ss 1
20 6
30 0
08 6
3 04
8 93
2 2
6 63
6 59
3 5
3 48
9 17
4 1
2 83
6 45
4 1
95 3
22 (4
03 3
34)
276
433
149
Net
59
371
602
21
613
259
24
259
573
33
281
549
9 8
95 6
92 1
3 12
6 6
9 83
3 1
48 5
04 6
34
Earn
ed 6
4 92
5 61
8 1
9 74
1 47
0 2
2 83
1 80
4 2
7 68
7 04
1 1
1 40
6 13
1 9
4 48
8 9
3 87
8 1
46 7
80 4
30
Bots
wan
aG
ross
102
550
560
25
196
807
9 2
16 9
96 2
1 86
2 86
3 8
06 6
89-
- 1
59 6
33 9
15
Net
56
076
935
15
356
375
2 7
68 0
79 1
3 43
8 22
4 4
78 8
90-
- 8
8 11
8 50
3
Earn
ed 6
6 12
7 99
1 1
6 16
0 46
0 3
170
124
15
180
404
880
933
--
101
519
912
Tota
lG
ross
749
980
554
224
289
472
274
400
362
493
372
153
38
110
452
169
350
500
10
388
449
1 9
59 8
91 9
42
Net
431
286
983
168
060
329
267
555
642
294
034
915
29
364
132
149
418
377
1 8
08 4
53 1
341
528
831
Earn
ed 4
16 9
54 4
39 1
46 8
81 6
89 2
46 1
63 5
64 2
73 8
78 6
53 3
2 67
4 07
5 1
11 4
56 9
10 1
525
297
1 2
29 5
34 6
27

89
ZIMRE HOLDINGS LIMITED 2020 ANNUAL REPORT
NO
TES
TO T
HE
FIN
AN
CIA
L ST
ATEM
ENTS
FOR
TH
E Y
EAR
EN
DED
31
DEC
EMBE
R 2
020
(con
tinue
d)5
INSU
RA
NC
E R
ISK
MA
NA
GEM
ENT
(con
tinue
d)5.
7N
on-li
fe re
insu
ranc
e ri
sk (c
ontin
ued)
31 D
ecem
ber 2
019
Fire
ZWL
Engi
neer
ing
ZWL
Mot
orZW
L
Type
of c
ontr
act
Acc
iden
tZW
LM
arin
eZW
LA
gric
ultu
reZW
LAv
iatio
nZW
LTo
tal
ZWL
Zim
babw
eG
ross
257
581
943
4
1 54
7 67
7 1
86 5
01 9
28
159
243
109
9
943
568
2
9 67
6 03
1 1
090
310
6
85 5
84 5
66
Net
207
831
225
3
5 53
4 06
7 1
78 4
29 9
69
128
177
036
8
840
267
2
9 67
6 03
1 1
090
310
5
89 5
78 9
05
Earn
ed 1
92 8
85 6
52
24
794
303
166
040
636
1
11 3
30 2
03
10
823
053
25
842
386
993
145
5
32 7
09 3
78
Zam
bia
Gro
ss 7
5 66
5 37
2 2
1 85
9 67
0 2
3 81
1 13
8 6
7 11
0 88
6 2
371
172
1
8 41
9 20
0 1
277
162
2
10 5
14 6
00
Net
32
314
613
20
610
738
22
509
837
44
200
501
2 0
51 9
58
4 2
04 5
18
1 1
80 0
59
127
072
224
Earn
ed 3
0 65
1 56
3 2
1 00
2 28
0 2
6 22
2 29
2 4
3 48
2 93
7 1
961
830
6
706
937
1
136
078
1
31 1
63 9
17
Mal
awi
Gro
ss 2
24 7
91 5
37
42
929
696
78
409
876
220
157
244
9
608
170
2
9 14
0 41
3 7
94 5
32
605
831
468
Net
107
689
562
2
9 62
2 77
2 7
7 90
9 02
3 1
06 6
40 5
94
4 7
46 0
31
16
700
902
350
184
3
43 6
59 0
68
Earn
ed 1
05 8
73 8
90
24
558
359
75
180
661
111
715
525
5
719
210
1
6 00
2 60
8 2
89 3
58
339
339
611
Moz
ambi
que
Gro
ss 2
14 7
65 1
46
85
902
388
41
120
385
80
697
438
44
841
822
4 4
62 1
20
7 4
82 7
28
479
272
027
Net
101
079
150
3
4 89
0 81
5 2
8 72
2 99
9 3
9 49
6 51
7 1
6 03
3 39
7 4
462
120
1
138
121
2
25 8
23 1
19
Earn
ed 9
7 76
8 21
7 3
4 85
6 10
0 3
3 40
9 42
5 4
1 68
1 07
1 1
6 38
4 90
7 4
202
194
1
273
009
2
29 5
74 9
23
Bots
wan
aG
ross
65
292
292
46
198
796
2 7
13 1
48
20
912
604
898
781
-
- 1
36 0
15 6
21
Net
44
673
931
11
311
683
1 2
48 8
52
18
573
264
604
402
-
- 7
6 41
2 13
2
Earn
ed 4
0 63
8 60
7 1
0 88
1 25
0 1
087
437
1
7 87
3 80
8 5
50 5
94
- -
71
031
696
Tota
lG
ross
838
096
290
2
38 4
38 2
26
332
556
475
5
48 1
21 2
81
67
663
513
81
697
764
10
644
733
2 11
7 21
8 28
2
Net
493
588
481
1
31 9
70 0
75
308
820
680
3
37 0
87 9
12
32
276
055
55
043
571
3 7
58 6
74
1 36
2 54
5 44
8
Earn
ed 4
67 8
17 9
29
116
092
292
3
01 9
40 4
51
326
083
544
3
5 43
9 59
4 5
2 75
4 12
5 3
691
590
1
303
819
525
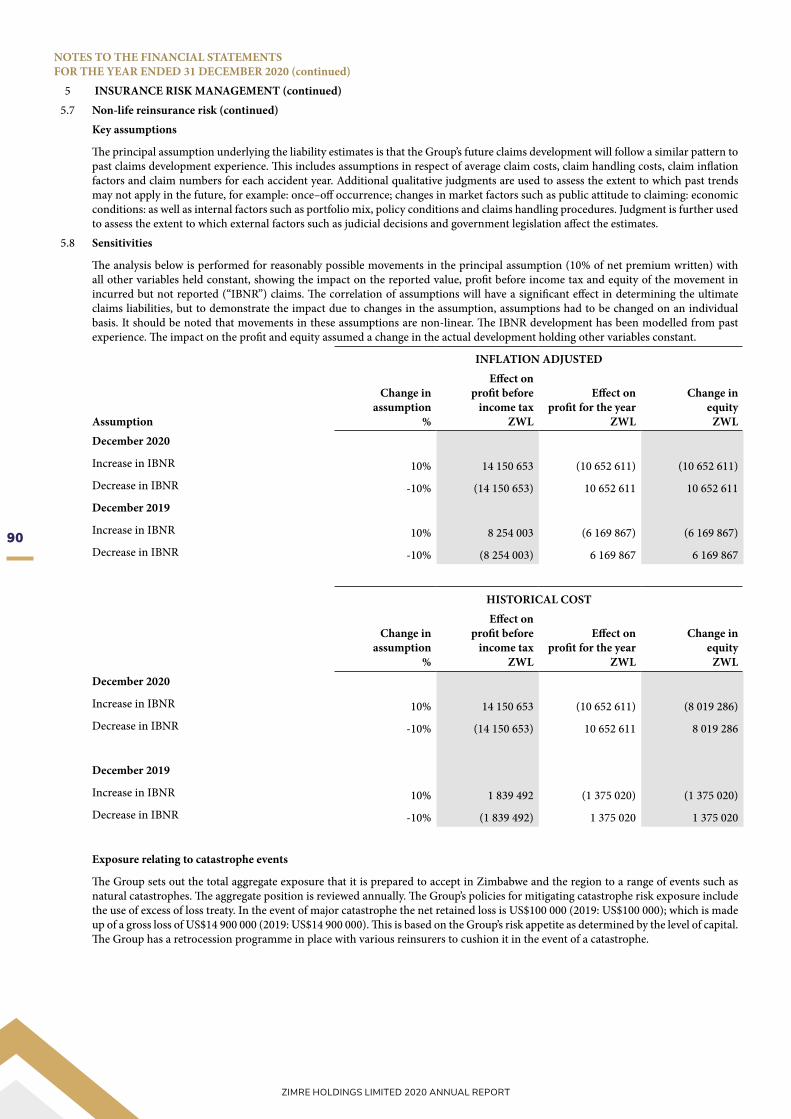
90
ZIMRE HOLDINGS LIMITED 2020 ANNUAL REPORT
NOTES TO THE FINANCIAL STATEMENTSFOR THE YEAR ENDED 31 DECEMBER 2020 (continued)
5 INSURANCE RISK MANAGEMENT (continued)5.7 Non-life reinsurance risk (continued)
Key assumptions
The principal assumption underlying the liability estimates is that the Group’s future claims development will follow a similar pattern to past claims development experience. This includes assumptions in respect of average claim costs, claim handling costs, claim inflation factors and claim numbers for each accident year. Additional qualitative judgments are used to assess the extent to which past trends may not apply in the future, for example: once–off occurrence; changes in market factors such as public attitude to claiming: economic conditions: as well as internal factors such as portfolio mix, policy conditions and claims handling procedures. Judgment is further used to assess the extent to which external factors such as judicial decisions and government legislation affect the estimates.
5.8 Sensitivities
The analysis below is performed for reasonably possible movements in the principal assumption (10% of net premium written) with all other variables held constant, showing the impact on the reported value, profit before income tax and equity of the movement in incurred but not reported (“IBNR”) claims. The correlation of assumptions will have a significant effect in determining the ultimate claims liabilities, but to demonstrate the impact due to changes in the assumption, assumptions had to be changed on an individual basis. It should be noted that movements in these assumptions are non-linear. The IBNR development has been modelled from past experience. The impact on the profit and equity assumed a change in the actual development holding other variables constant.
INFLATION ADJUSTED
Assumption
Change inassumption
%
Effect onprofit before
income taxZWL
Effect onprofit for the year
ZWL
Change inequity
ZWLDecember 2020
Increase in IBNR 10% 14 150 653 (10 652 611) (10 652 611)Decrease in IBNR -10% (14 150 653) 10 652 611 10 652 611 December 2019
Increase in IBNR 10% 8 254 003 (6 169 867) (6 169 867)Decrease in IBNR -10% (8 254 003) 6 169 867 6 169 867
HISTORICAL COST
Change inassumption
%
Effect onprofit before
income taxZWL
Effect onprofit for the year
ZWL
Change inequity
ZWLDecember 2020
Increase in IBNR 10% 14 150 653 (10 652 611) (8 019 286)Decrease in IBNR -10% (14 150 653) 10 652 611 8 019 286
December 2019
Increase in IBNR 10% 1 839 492 (1 375 020) (1 375 020)Decrease in IBNR -10% (1 839 492) 1 375 020 1 375 020
Exposure relating to catastrophe events
The Group sets out the total aggregate exposure that it is prepared to accept in Zimbabwe and the region to a range of events such as natural catastrophes. The aggregate position is reviewed annually. The Group’s policies for mitigating catastrophe risk exposure include the use of excess of loss treaty. In the event of major catastrophe the net retained loss is US$100 000 (2019: US$100 000); which is made up of a gross loss of US$14 900 000 (2019: US$14 900 000). This is based on the Group’s risk appetite as determined by the level of capital. The Group has a retrocession programme in place with various reinsurers to cushion it in the event of a catastrophe.

91
ZIMRE HOLDINGS LIMITED 2020 ANNUAL REPORT
NOTES TO THE FINANCIAL STATEMENTSFOR THE YEAR ENDED 31 DECEMBER 2020 (continued)
5 INSURANCE RISK MANAGEMENT (continued)5.8 Sensitivities (continued)
5.8.1 Life insurance contract liability sensitivity analysisThe following analysis is performed for reasonably possible movements in key assumptions with all other assumptions constant, showing the impact on gross and net liabilities, profit before income tax and equity. The correlation of assumptions will have a significant effect in determining the ultimate claims liabilities, but to demonstrate the impact due to changes in assumptions, assumptions had to be changed on an individual basis.It should be noted that movements in these assumptions are non-linear. Sensitivity information will also vary according to the current economic assumptions, mainly due to the impact of changes to both the intrinsic cost and time value of options and guarantees. When options and guarantees exist, they are the main reason for the asymmetry of sensitivities. The method used for deriving sensitivity information and significant assumptions made did not change from the previous period.Below is the impact on profit of changes in the life insurance contract liability as a result of changes in key inputs used to calculate the liability
INFLATION ADJUSTED
Base
Change in assumptions (+, increase) (-, decrease) Impact on liabilities
Impact on profit before income tax
Impact on profit or the year
2020
Mortality +10% 2 168 935 (2 168 935) (140 682)
Mortality -10% 839 229 (839 229) (54 434)
Lapse -10% (1 101 938) 1 101 938 71 474
Expense +10% 9 817 708 (9 817 708) (636 799)
Discount rate +1% (6 037 729) 6 037 729 391 621
Investment return +1% 416 944 (416 944) (27 044)
2019
Mortality +10% 9 729 443 (9 729 443) (202 974)
Mortality -10% 3 764 627 (3 764 627) (78 538)
Lapse -10% (4 943 091) 4 943 091 103 120
Expense +10% 44 040 431 (44 040 431) (918 762)
Discount rate +1% (27 084 141) 27 084 141 565 024
Investment return +1% 439 812 (439 812) (9 173)
HISTORICAL COST
Base
Change in assumptions (+, increase) (-, decrease) Impact on liabilities
Impact on profit before income tax
Impact on profit or the year
2020
Mortality +10% 2 168 935 (2 168 935) (311 689)
Mortality -10% 839 229 (839 229) (120 602)
Lapse -10% (1 101 938) 1 101 938 158 355
Expense +10% 9 817 708 (9 817 708) (1 410 863)
Discount rate +1% (6 037 729) 6 037 729 867 658
Investment return +1% 98 045 (98 045) (14 090)

92
ZIMRE HOLDINGS LIMITED 2020 ANNUAL REPORT
NOTES TO THE FINANCIAL STATEMENTSFOR THE YEAR ENDED 31 DECEMBER 2020 (continued)
5 INSURANCE RISK MANAGEMENT (continued)5.9 Claims development
The Group is liable for all insured events that occur during the term of the contract, even if the loss is discovered after the end of the contract term, subject to predetermined time scales depending on the nature of the insurance contract. The Group is therefore exposed to the risk that claims reserves will not be adequate to fund the historical claims (“run off risk”). To manage run off risk the Group takes all reasonable steps to ensure that it has appropriate information regarding its claims exposures and adopts sound reserving practices. The reserves created over time proved to be sufficient to fund the actual claims paid. Further, the Group does not participate in any policies with unlimited liability. The Group is liable for all insured events in terms of the contract. All underlying policies have reporting conditions that restrict the timeline within which a claim should reasonably be made. Delays however sometimes occur between the time insurers process claims and recover from reinsurers.Reserves are maintained for this contingency and this forms part of the annual actuarial reviews to assess the adequacy of claim reserves. In terms of IFRS 4, ‘Insurance contracts’, an insurer need only disclose claims run off information where uncertainty exists about the amount and timing of claim payments not resolved within one year.
The tables overleaf indicate the claims development of the Group for the period of 5 years.
dmp.credsure.co.zw.
_039
0
For those who can’t keep their distance... To buy all your motor insurance, download the Autosure App on google playor visit dmp.credsure.co.zw and avoid any stress.

93
ZIMRE HOLDINGS LIMITED 2020 ANNUAL REPORT
NO
TES
TO T
HE
FIN
AN
CIA
L ST
ATEM
ENTS
FOR
TH
E Y
EAR
EN
DED
31
DEC
EMBE
R 2
020
(con
tinue
d)5
INSU
RA
NC
E R
ISK
MA
NA
GEM
ENT
(con
tinue
d)5.
9C
laim
s dev
elop
men
tC
laim
s dev
elop
men
t tab
lePa
id cl
aim
sA
ccid
ent y
ear
2013
2014
2015
2016
2017
2018
2019
2020
Tota
lA
t end
of
acci
dent
yea
r 2
448
004
1
416
243
1
186
378
1
420
589
6
197
027
1
904
114
4
0 57
2 27
4 1
2 64
5 25
8 O
ne y
ear l
ater
2 7
64 2
17
1 9
98 7
91
1 3
43 4
93
1 8
03 0
94
6 5
31 7
70
3 2
46 6
54
43
881
430
- Tw
o ye
ars l
ater
3 0
09 7
74
2 0
37 5
54
1 3
66 0
27
1 8
17 1
58
8 6
57 4
71
3 6
70 1
29
- -
Thre
e ye
ars l
ater
3 0
17 2
66
2 0
44 2
09
1 3
70 9
57
1 9
59 2
19
9 4
51 3
61
- -
- Fo
ur y
ears
late
r 3
020
978
2
048
418
1
373
908
3
244
535
-
- -
- Fi
ve y
ears
late
r 3
026
204
2
123
143
3
341
952
-
- -
- -
Six
year
s lat
er 3
058
794
2
123
143
-
- -
- -
- Se
ven
year
s lat
er 3
058
794
-
- -
- -
- -
Cum
ulat
ive
clai
ms p
aid
to d
ate
3 0
58 7
94
2 1
23 1
43
3 3
41 9
52
3 2
44 5
35
9 4
51 3
61
3 6
70 1
29
43
881
430
12
645
258
81
416
602
Incu
rred
clai
ms
Acc
iden
t yea
r20
1320
1420
1520
1620
1720
1820
1920
20To
tal
At e
nd o
fac
cide
nt y
ear
2 5
70 9
16
1 4
16 2
63
1 1
86 9
94
1 5
02 7
86
2 2
00 4
60
2 3
81 4
81
31
869
293
18
485
521
One
yea
r lat
er 2
887
123
1
998
810
1
344
108
1
885
290
2
634
486
4
040
486
3
6 59
7 95
9 -
-Tw
o ye
ars l
ater
3 1
32 6
81
2 0
38 5
11
1 3
66 6
43
1 8
99 3
54
3 8
85 5
29
4 4
63 9
61
--
-Th
ree
year
s lat
er 3
140
175
2
045
166
1
371
573
2
041
415
4
679
419
-
--
-Fo
ur y
ears
late
r 3
143
887
2
049
374
1
374
524
3
326
731
-
--
--
Five
yea
rs la
ter
3 1
51 2
92
2 1
24 0
98
3 3
42 5
68
--
--
--
Six
year
s lat
er 3
208
340
2
124
098
-
--
--
--
Seve
n ye
ars l
ater
3 2
08 3
40
--
--
--
--
Estim
ate
of cu
mul
ativ
ecl
aim
s inc
urre
d to
dat
e 3
208
340
2
124
098
3
342
568
3
326
731
4
679
419
4
463
961
3
6 59
7 95
9 1
8 48
5 52
1 7
6 22
8 59
7
Cas
e es
timat
esA
ccid
ent y
ear
2013
2014
2015
2016
2017
2018
2019
2020
Tota
lO
ne y
ear l
ater
122
912
2
0 6
16
82
197
(3 9
96 5
67)
477
367
(8
702
981
)Tw
o ye
ars l
ater
122
906
1
9 6
15
82
196
(3 8
97 2
84)
793
832
-
--
Thre
e ye
ars l
ater
122
907
9
57
616
8
2 19
6 (4
771
942
)-
--
-Fo
ur y
ears
late
r 1
22 9
09
957
6
16
82
196
--
--
-Fi
ve y
ears
late
r 1
22 9
09
956
6
16
--
--
--
Six
year
s lat
er 1
25 0
88
955
-
--
--
--
Seve
n ye
ars l
ater
149
546
-
--
--
--
-

94
ZIMRE HOLDINGS LIMITED 2020 ANNUAL REPORT
NOTES TO THE FINANCIAL STATEMENTSFOR THE YEAR ENDED 31 DECEMBER 2020 (continued)
5 INSURANCE RISK MANAGEMENT (continued)5.9 Claims development (continued)
IBNR reserves
Accident year 2013 2014 2015 2016 2017 2018 2019 2020 Total
One year later 810 803 650 111 351 365 443 920 687 554 455 647 5 457 400 - -
Two years later 993 051 1 901 232 637 462 552 718 318 463 313 524 - - -
Three years later 1 205 047 1 321 469 688 248 49 750 45 504 - - - -
Four years later 1 242 304 1 326 814 18 754 4 837 - - - - -
Five years later 1 242 304 45 855 - - - - - - -
Six years later 23 601 - - - - - - - -
Seven years later - - - - - - - - -
Cumulative pay-ments to date 23 601 45 855 18 754 4 837 45 504 313 524 5 457 400 5 909 475
Cumulative in-curred claims less payments to date 3 184 739 2 078 243 3 323 814 3 321 894 4 633 915 4 150 437 31 140 559 18 485 521 70 319 122
The analysis is part of the periodic independent actuarial assessments. Therefore no additional work was done because of this and the insignificant contribution of individual life business to overall gross premium written.
6 SIGNIFICANT ACCOUNTING JUDGEMENTS AND ESTIMATESThe preparation of financial statements requires the use of accounting estimates and judgements which, by definition will seldom equal the actual results. Management also needs to exercise judgement in applying the Group’s accounting policies. The uncertainty about the judgements and estimates could result in outcomes that could require a material adjustment to the carrying amount of the asset or liability affected in future periods.
6.1 Judgements other than estimates In the process of applying the Group’s accounting policies, management has made the following judgements, which have the most
significant effect on the amounts recognised in the financial statements.6.1.1 Inflation indices and adjustments
On 11 October 2019, the Public Accountants and Auditors Board (“PAAB”) issued pronouncement 01/2019, which advised that Zimbabwe has met conditions for application of IAS 29 for financial periods ending on or after 1 July 2019. IAS 29 requires that the financial statements of the Group whose functional currency is the currency of a hyper-inflationary economy be stated in terms of the measuring unit current at the reporting date and that the corresponding figures for the comparative periods be stated in the same terms. The financial statements and the corresponding figures for the previous years have been restated to take account of the changes in the general purchasing power of the Zimbabwe dollar. The restatement is based on conversion factors derived from the Zimbabwe Consumer Price Index (“CPI”) compiled by the Zimbabwe National Statistics Agency from the figures provided by the Reserve Bank of Zimbabwe.
6.1.2 Taxes
The Group is subject to taxes in Botswana, Malawi, Mozambique, Zambia and Zimbabwe. Significant judgement is required in determining the liabilities for taxes. There are many transactions and calculations for which the ultimate tax determination and timing of payment is uncertain. In particular, when calculating deferred tax, the effective tax rate applicable on the temporary differences on investment property depends on the method by which the carrying amount of investment property will be realised. Management has rebutted the presumption that the investment property measured at fair value will be recovered through sale. Management has rebutted the presumption as the objective of its business model is to consume substantially all of the economic benefits embodied in the investment property over time rather than through sale. As a result the Group continues to apply the income tax rate of 24.72% (2019: 25.75%) for the purpose of recognising deferred tax for its investment property with the exception of land. The Group will recover the carrying amount of land recognised as investment property through sale and in that respect, the capital gains tax rate is used to determine deferred tax.The Group recognises liabilities for anticipated tax issues based on estimates of whether additional taxes will be due. Where the final tax outcome of these matters is different from the amounts that were initially recorded, such differences will impact the income tax and deferred tax assets and liabilities in the period in which such determination is made.
6.1.3 Going concern The Directors have assessed the ability of the Group and Company to continue operating as going concerns and believe that the prepa-ration of these financial statements on a going concern basis is appropriate.

95
ZIMRE HOLDINGS LIMITED 2020 ANNUAL REPORT
NOTES TO THE FINANCIAL STATEMENTSFOR THE YEAR ENDED 31 DECEMBER 2020 (continued)
6 SIGNIFICANT ACCOUNTING JUDGEMENTS AND ESTIMATES (continued)6.1 Judgements other than estimates (continued)
Coronavirus disease (COVID-19)
IntroductionFollowing the outbreak of the Coronavirus (COVID-19) in China in December 2019 and its rapid spread across the world, the World Health Organisation (“WHO”) declared it a global pandemic on 11 March 2020. The outbreak presented unprecedented health challenges and disruptions to economic activity which resulted in a global economic down turn in 2020. In response to the challenges, and in line with the WHO guidelines, the Government of Zimbabwe through Statutory Instrument (“SI”) 76 of 2020, declared COVID-19 a national disaster. The Government has introduced a number of directives to mitigate the widespread transmission of the virus including a series of lockdowns spanning over 2020 into 2021. The impact of the COVID-19 pandemic on the Group’s businesses to date has been insignificant mainly due to the exclusion of COVD-19 related covers in most insurance policies accepted by the Group. While the lockdown restrictions have been introduced, relaxed then reintroduced, the COVID-19 situation is still evolving, thus making it difficult to estimate the full economic costs of the pandemic and attendant lockdowns.
Response measuresIn response to the outbreak of the pandemic and in compliance with various regional and domestic government directives on the control of the spread of COVID-19, the Group has introduced a raft of measures to protect its staff, clients and ultimately the general public. These measures recommended standards of hygiene, social distancing and working from home to ensure business continuity. In addition, insurance measures include the like business interruption emanating from circumsances triggered by COVID-19.
Impact assessment Since COVID-19 is still evolving as evidenced by the increasing number of its variants, its impact on the economies where the Group operates can not be fully assessed. Consequently, its implications on Group operations cannot be estimated with any degree of accuracy.
6.2 Estimates
The key assumptions concerning the future and other key sources of estimation uncertainty at the reporting date, that have a significant risk of causing a material adjustment to the carrying amounts of assets and liabilities within the next financial year, are described below. The Group based their assumptions and estimates on parameters available when the financial statements were prepared. Existing circumstances and assumptions about future developments, however, may change due to market changes or circumstances arising beyond the control of the Group. Such changes are reflected in the assumptions when they occur.
6.2.1 Insurance contract liabilitiesThe estimation of the ultimate liability arising from claims made under insurance contracts is the Group’s most critical accounting estimate. There are several sources of uncertainty that are considered in the estimate of the liability that the Group will ultimately pay for such claims.
(i) Unearned premiumsUnearned premiums represent the proportion of premiums written in the current year, which relate to risks that have not expired by the end of the financial year. The Group raises provisions for unearned premiums on a basis that reflects the underlying risk profile of its insurance contracts. An unearned premium provision is created at the commencement of each insurance contract and is released as the risk covered by the contract expires. Most of the Group’s insurance contracts have an even risk profile. Therefore, the unearned premiums are released evenly over the period of insurance using a time proportion basis. The unearned premiums are first determined on a gross level and thereafter the reinsurance impact is separately recognised based on the relevant reinsurance contract. Deferred acquisition costs and commission revenue is recognised on a basis that is consistent with the related provision for unearned premiums. At each reporting date an assessment is made of whether the unearned premiums are adequate. A separate provision can be made, based on information available at the reporting date, for any estimated future underwriting losses relating to unexpired risks.
(ii) Outstanding claimsOutstanding claims represent the Group’s estimate of the cost of settlement of claims that have occurred and were reported by the reporting date (net of salvage recoveries), but that have not yet been fully settled.Claims provisions are determined based on previous claims experience, knowledge of events, the terms and conditions of the relevant policies and on the interpretation of circumstances. Each notified claim is assessed on a separate case-by-case basis with due regard for the specific circumstances, information available from the insured and/or loss adjuster, past experience with similar cases and historical claims payment trends. The approach also includes the consideration of the development of loss payment trends, the levels of unpaid claims, legislative changes, judicial decisions and economic conditions. The Group employs personnel experienced in claims handling and rigorously applies standardised policies and procedures to claims assessment.The ultimate cost of reported claims may vary as a result of future developments or better information becoming available about the current circumstances. Therefore, case estimates are reviewed regularly and updated when new information becomes available. The provision for outstanding claims is initially estimated at a gross level. A separate calculation is performed to estimate reinsurance recoveries. The calculation of reinsurance recoveries considers the type of risk underwritten, the year in which the loss claim occurred, under which reinsurance programme the recovery will be made, the size of the claim and whether the claim was an isolated incident or formed part of a catastrophe reinsurance claim.

96
ZIMRE HOLDINGS LIMITED 2020 ANNUAL REPORT
NOTES TO THE FINANCIAL STATEMENTSFOR THE YEAR ENDED 31 DECEMBER 2020 (continued)
6 SIGNIFICANT ACCOUNTING JUDGEMENTS AND ESTIMATES (continued)6.2 Estimates (continued)
6.2.1 Insurance contract liabilities (continued)(iii) Claims incurred but not reported (“IBNR”) There is also considerable uncertainty concerning the eventual outcome of claims that have occurred but had not yet been reported to the insurer by the reporting date. The ‘IBNR’ liability relates to these events. In calculating the estimated cost of unpaid claims (both reported and not reported), the Group’s estimation techniques are based on statistical methods including the basic chain-ladder. The basic chain-ladder method assumes that payments for an accident year will develop in the same way as claims have for prior years and an estimate based upon actual accident years claims experience using predetermined formulae where greater weight is given to actual claims experience as time passes.The estimation of IBNR is generally subject to a greater degree of uncertainty than the estimation of the cost of settling claims already notified to the Group, where information about the claim event is available. IBNR claims may not be apparent to the insured until many years after the event that gave rise to the claims. In estimating the liability for the cost of reported claims not yet paid, the Group considers any information available on the cost of settling claims with similar characteristics in previous periods. Large claims are assessed on a case-by-case basis or projected separately in order to allow for the possible distortive effect of their development and incidence on the rest of the portfolio.Where possible, the Group adopts multiple techniques to estimate the required level of provisions. This provides a greater understanding of the trends inherent in the experience being projected. The projections given by the various methodologies also assist in estimating the range of possible outcomes. The most appropriate estimation technique is selected taking into account the characteristics of the business class and the extent of the development of each accident year.Note 5 presents the development of the estimate of ultimate claim cost for claims notified in a given year. This gives an indication of the accuracy of the Group estimation technique for claims payments.
iv) Insurance contract liabilities (policyholders’ funds) and actuarial assumptions
The life policyholder funds, under un-matured policies, are computed at the reporting date by the Group’s independent actuary, in accordance with prevailing legislation, guidelines issued by the Actuarial Society of South Africa (“SAP”) 104. Under this method, the insurance contract liabilities are valued using realistic expectations of future experience with prescribed margins for prudence. The insurance contract liabilities reflected in the statement of financial position represent the increase or decrease in actuarial liabilities.The main assumptions used relate to mortality, longevity, investment returns, expenses, lapses, surrender rates and discount rates. Estimates are also made as to future investment income arising from the assets backing the life insurance contracts. These estimates are based on current market returns as well as expectations about future economic and financial developments. Assumptions on future expenses are based on current expense levels adjusted for expected expense inflation if necessary. Lapse and surrender rates depend on product features, policy duration and external circumstances such as sales trends. Discount rates are based on current expense levels adjusted for expected inflation adjustments if appropriate.
6.2.2 Fair value of investment propertyThe Group carries its investment property at fair value, with changes in fair value being recognised in the profit or loss The approach mostly used on commercial and industrial properties is the comparative approach. This method seeks to ascribe the subject property a value similar to that achieved for comparable properties. Another method is the yield method which converts anticipated future cash flow benefits in the form of rental income into present value. This approach requires careful estimation of future benefits and the application of investor yield or return requirements. The determined fair value of the investment properties is most sensitive to the estimated yield as well as the long-term void rate.
Valuation approach
The valuations have been undertaken in an environment of poor liquidity conditions and limited transaction evidence. Limited transaction evidence affects all properties whose fair values are arrived at based on comparable transactions obtained from the market. With regards to commercial and industrial properties, yields obtained from USD transaction evidence were utilised.In undertaking the valuations for commercial, industrial and retail properties, reliance has been placed on rental market evidence, void rates and arrears currently applying to the individual properties in the portfolio. The achieved rentals for the property portfolio are generally in line, and in some instances, higher than the rental rates being achieved in the market.With regards to the residential properties, various properties were identified that were sold or which are on sale and situated in comparable low density residential suburbs. In analysing the comparable properties, the Main Space Equivalent (“MSE”) principle was applied. The total MSE of the comparable was then used to determine the value per square meter of MSE. The objective is to arrive at a common basis of comparison. After adjustments for quality, location and size, the rates per MSE reflected by the comparable were then applied to the subject residential properties.The yields have been obtained from the limited concluded transactions and have also been assessed taking into account asking prices and offers that may have been received for properties currently on the market, formally or otherwise, although the transactions may not have been concluded. Refer to note 10 for the carrying amount of investment property and the estimates and assumptions used to value investment property.
97
ZIMRE HOLDINGS LIMITED 2020 ANNUAL REPORT
NOTES TO THE FINANCIAL STATEMENTSFOR THE YEAR ENDED 31 DECEMBER 2020 (continued)
6 SIGNIFICANT ACCOUNTING JUDGEMENTS AND ESTIMATES (continued)6.2 Estimates (continued)
6.2.3 Useful lives and residual values of property and equipment The Group assesses the useful lives and residual values of property and equipment each year taking into consideration past experience,
technology changes and the local operating environment. No changes to the useful lives and residual values have been considered necessary during the year. Refer to note 8 for the carrying amount of property, vehicles and computer equipment and accounting policy note 2.5 for the useful lives of property, vehicles and equipment.
6.2.4 Allowances for credit losses on financial assets measured at amortised costThe Group assesses its financial assets at amortised cost for impairment on a monthly basis and recognises credit loss allowances using the expected credit loss model. Key assumptions applied in this calculation are the estimated debt recovery rates within the Group’s debtors’ book, as well as an estimation or view on current and future market conditions that could affect the debt recovery rates. Refer to note 16 for further details on the allowance and the carrying amount of trade and other receivables.
7 SEGMENT INFORMATION
Description of segments and principal activitiesThe Group’s Executive Committee, consisting of the Group Chief Executive Officer, Group Finance Executive and Managing Directors of subsidiaries, examines the Group’s performance both from a product and geographical perspective and has identified reportable segments of its business as detailed below. Management evaluates segment performance based on operating profit/(loss) consistent with the consolidated financial statements.
Reinsurance
The segment offers short-term reinsurance products and services to general insurance companies locally, regionally and internationally. These products offer protection of policyholder’s assets and indemnification of other parties that have suffered damage as a result of the policyholder’s accident. Revenue in this segment is derived primarily from insurance premiums, investment income and fair value gains and losses on financial assets.
Life reassurance
The life reassurance segment offers its services to life assurance companies and medical aid societies locally and regionally. The products are savings, protection products and other long-term contracts (both with and without insurance risk and with and without discretionary participating features. It comprises a wide range of whole life, term assurance, unitised pensions, guaranteed pensions, pure endowment pensions and mortgage endowment products. Revenue from this segment is derived primarily from reassurance premium, fees and commission income, investment income and fair value gains and losses on investments.General insurance
The segment offers short-term insurance products and services directly to policy holders locally. These products offer protection ofpolicyholder’s assets and indemnification of other parties that have suffered damage as a result of the policyholder’s accident e.g. motor accident, domestic credit insurance, export credit. Revenue in this segment is derived primarily from insurance premiums, investment income and fair value gains and losses on financial assets.
Life and pensionsThe segment offers life assurance, funeral assurance, asset management, actuarial consultancy and micro-financng services. The products offered are life assurance and pensions and also is involved in consumer loans, business loans and loans to farmers.
Property
This segment is engaged in leasing, developing, managing, selling and buying properties. It also offers consultancy services related to property development. It derives its revenue primarily from rentals, sales of properties, investment income and estate agency.
Other and eliminations
This segment comprises the holding company and consolidation eliminations.

98
ZIMRE HOLDINGS LIMITED 2020 ANNUAL REPORT
NO
TES
TO
TH
E FI
NA
NC
IAL
STAT
EMEN
TS
FOR
TH
E Y
EAR
EN
DED
31
DEC
EMBE
R 2
020
(con
tinue
d)
7SE
GM
ENT
INFO
RM
ATIO
N (c
ontin
-ue
d)
7.1
Info
rmat
ion
abou
t pro
duct
s and
se
rvic
es
INFL
ATIO
N A
DJU
STED
Year
end
ed 3
1 D
ecem
ber 2
020
Non
-life
rein
sura
nce
ZWL
Life
reas
sura
nce
ZWL
Life
and
Pens
ions
ZWL
Gen
eral
insu
ranc
eZW
LPr
oper
tyZW
L
Oth
er a
nd
elim
inat
ions
ZWL
Tota
lZW
L
Gro
ss w
ritte
n pr
emiu
m1
959
891
942
135
587
564
3
3 85
6 61
6 1
75 2
76 2
22
- (1
74 9
79 1
24)
2 12
9 63
3 22
0
Retr
oces
sion
pre
miu
m(6
18 3
63 1
11)
(33
191
528)
(2 1
39 4
21)
(124
658
387
)-
174
979
124
(6
03 3
73 3
23)
Net
pre
miu
m w
ritte
n1
341
528
831
102
396
036
3
1 71
7 19
5 5
0 61
7 83
5 -
- 1
526
259
897
Cha
nge
in u
near
ned
prem
ium
rese
rve
(111
994
204
)-
- (8
383
078
)-
- (1
20 3
77 2
82)
Net
pre
miu
m e
arne
d1
229
534
627
102
396
036
3
1 71
7 19
5 4
2 23
4 75
7 -
- 1
405
882
615
Brok
erag
e co
mm
issio
n an
d fe
es 1
36 8
81 0
74
14
222
489
3 6
56 0
74
26
253
602
(53
274
676)
127
738
563
Tota
l ins
uran
ce in
com
e1
366
415
701
116
618
525
3
5 37
3 26
9 6
8 48
8 35
9 -
(53
274
676)
1 53
3 62
1 17
8
Rent
al in
com
e fr
om in
vest
men
t pro
pert
y an
d in
com
e fr
om sa
le o
f inv
ento
ry
prop
erty
3 0
01 4
14
- 3
53 8
05
959
421
1
14 6
30 5
83
- 1
18 9
45 2
23
Inve
stm
ent i
ncom
e 2
0 37
8 22
0 2
827
379
3
474
532
1
715
574
6
33 8
40
(194
355
) 2
8 83
5 19
0 O
ther
loss
es 1
31 8
53 7
42
71
464
733
24
094
848
32
011
346
27
146
353
(7 4
45 9
87)
279
125
035
Tota
l inc
ome
1 52
1 64
9 07
7 1
90 9
10 6
37
63
296
454
103
174
700
1
42 4
10 7
76
(60
915
018)
1 96
0 52
6 62
6
Cla
ims a
nd e
xpen
ses
(1 3
45 9
72 8
61)
(122
956
807
)(3
7 66
6 48
8)(9
2 47
4 13
1)(8
1 85
1 37
9) 3
41 8
27 1
71
(1 3
39 0
94 4
95)
Insu
ranc
e be
nefit
s and
cla
ims
(472
041
743
)(5
3 52
2 38
6)(8
442
682
)(1
1 42
4 29
9)-
- (5
45 4
31 1
10)
Com
miss
ion
and
acqu
isiti
on e
xpen
ses
(440
800
830
)(3
4 13
6 30
8)(1
427
729
)(3
3 31
2 07
1)-
53
274
676
(456
402
262
)
Net
pro
pert
y op
erat
ing
cost
s 8
418
410
-
(6 6
45 6
16)
(11
941
251)
(10
168
457)
Ope
ratin
g an
d ad
min
istra
tive
expe
nses
(441
548
698
)(3
5 29
8 11
3)(2
1 15
0 46
1)(4
7 73
7 76
1)(6
9 91
0 12
8) 2
88 5
52 4
95
(327
092
666
)G
ross
cha
nge
in in
sura
nce
and
inve
st-
men
t con
trac
t lia
bilit
ies
- -
(48
888
100)
- -
- (4
8 88
8 10
0)
Ope
ratin
g pr
ofit/
(loss
) 1
75 6
76 2
16
67
953
830
(23
258
134)
10
700
569
60
559
397
280
912
153
5
72 5
44 0
31

99
ZIMRE HOLDINGS LIMITED 2020 ANNUAL REPORT
NO
TES
TO T
HE
FIN
AN
CIA
L ST
ATEM
ENTS
FOR
TH
E Y
EAR
EN
DED
31
DEC
EMBE
R 2
020
(con
tinue
d)
7SE
GM
ENT
INFO
RM
ATIO
N (c
ontin
ued)
7.1
Info
rmat
ion
abou
t pro
duct
s and
serv
ices
(con
tinue
d)
INFL
ATIO
N A
DJU
STED
Year
end
ed 3
1 D
ecem
ber 2
020
Non
-life
rein
sura
nce
ZWL
Life
reas
sura
nce
ZWL
Life
and
Pens
ions
ZWL
Gen
eral
insu
ranc
eZW
LPr
oper
tyZW
L
Oth
er a
nd
elim
inat
ions
ZWL
Tota
lZW
L
Fina
nce
cost
s(5
526
500
)-
(1 5
23 0
94)
- (3
177
905
)(1
761
959
)(1
1 98
9 45
8)
Fair
valu
e ad
just
men
t on
inve
stm
ent p
rope
rtie
s 6
446
761
-
33
405
468
- 7
73 2
85 4
42
- 8
13 1
37 6
71
Gai
n/(lo
ss) o
n ne
t mon
etar
y po
sitio
n 2
0 98
3 67
7 (7
695
551
)(2
854
936
)(1
3 18
5 75
7) 2
0 25
7 95
7 (4
40 9
16 7
35)
(423
411
345
)
Shar
e of
pro
fit o
f ass
ocia
tes
- -
--
- 9
8 05
1 83
4 9
8 05
1 83
4
Profi
t/(lo
ss) b
efor
e in
com
e ta
x 1
97 5
80 1
54
60
258
279
5 7
69 3
05
(2 4
85 1
88)
850
924
891
(6
3 71
4 70
7)1
048
332
733
Inco
me
tax
(exp
ense
)/cr
edit
(8 8
51 5
46)
81
758
(1 2
53 8
88)
(5 4
70 5
40)
(41
848
314)
(7 8
35 2
53)
(65
177
783)
Tota
l ass
ets
3 55
7 85
5 46
0 3
96 7
51 5
51
5 4
73 6
03 7
67 2
07 0
91 0
39
3 17
7 71
3 04
7 (3
37 9
38 3
16)
12 4
75 0
76 5
48
Tota
l lia
bilit
ies
1 80
1 54
7 78
2 4
6 14
0 18
4 4
746
525
610
84
326
553
185
251
986
(1
40 3
65 5
20)
6 72
3 42
6 59
5
HIS
TOR
ICA
L C
OST
Non
-life
rein
sura
nce
ZWL
Life
reas
sura
nce
ZWL
Life
and
Pens
ions
ZWL
Gen
eral
insu
ranc
eZW
LPr
oper
tyZW
L
Oth
er a
nd
elim
inat
ions
ZWL
Tota
lZW
L
Gro
ss w
ritte
n pr
emiu
m1
654
843
389
94
544
597
29
924
490
99
422
121
- (1
11 6
62 7
74)
1 76
7 07
1 82
3
Retr
oces
sion
prem
ium
(590
976
316
)(2
6 82
7 12
5)(1
720
536
)(7
0 37
0 59
2)-
111
662
774
(5
78 2
31 7
95)
Net
pre
miu
m w
ritte
n1
063
867
073
67
717
472
28
203
954
29
051
529
- -
1 18
8 84
0 02
8
Cha
nge
in u
near
ned
prem
ium
rese
rve
(68
726
636)
- -
(5 9
92 2
81)
- -
(74
718
917)
Net
pre
miu
m e
arne
d 9
95 1
40 4
37
67
717
472
28
203
954
23
059
248
- -
1 11
4 12
1 11
1
Brok
erag
e co
mm
issio
n an
d fe
es 1
32 8
90 9
13
12
667
968
2 3
80 9
68 1
5 56
2 57
9 -
(33
997
187)
129
505
241
Tota
l ins
uran
ce in
com
e1
128
031
350
80
385
440
30
584
922
38
621
827
- (3
3 99
7 18
7)1
243
626
352
Rent
al in
com
e fr
om in
vest
men
t pro
pert
y an
d
inco
me
from
sale
of i
nven
tory
pro
pert
y 3
001
413
-
360
448
653
818
1
06 0
50 7
29
- 1
10 0
66 4
08
Inve
stm
ent a
nd o
ther
inco
me
18
869
913
1 8
62 2
66
3 4
09 7
07 6
00 4
78
465
944
1
452
467
2
6 66
0 77
5
Oth
er g
ains
141
756
474
8
6 30
9 12
1 3
0 08
1 44
2 2
9 41
1 99
4 1
8 64
2 32
0 7
664
205
3
13 8
65 5
56
Tota
l inc
ome
1 29
1 65
9 15
0 1
68 5
56 8
27
64
436
519
69
288
117
125
158
993
(2
4 88
0 51
5)1
694
219
091
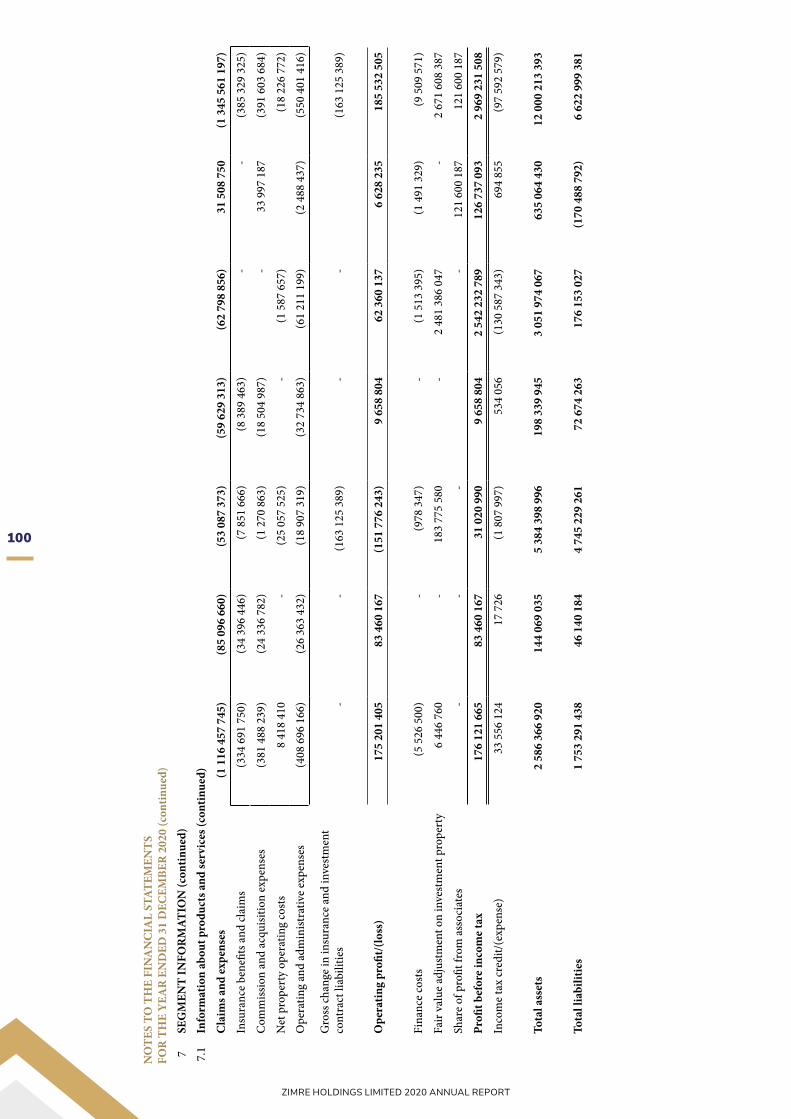
100
ZIMRE HOLDINGS LIMITED 2020 ANNUAL REPORT
NO
TES
TO T
HE
FIN
AN
CIA
L ST
ATEM
ENTS
FOR
TH
E Y
EAR
EN
DED
31
DEC
EMBE
R 2
020
(con
tinue
d)7
SEG
MEN
T IN
FOR
MAT
ION
(con
tinue
d)7.
1In
form
atio
n ab
out p
rodu
cts a
nd se
rvic
es (c
ontin
ued)
Cla
ims a
nd ex
pens
es(1
116
457
745
)(8
5 09
6 66
0)(5
3 08
7 37
3)(5
9 62
9 31
3)(6
2 79
8 85
6) 3
1 50
8 75
0 (1
345
561
197
)
Insu
ranc
e be
nefit
s and
clai
ms
(334
691
750
)(3
4 39
6 44
6)(7
851
666
)(8
389
463
)-
- (3
85 3
29 3
25)
Com
miss
ion
and
acqu
isitio
n ex
pens
es(3
81 4
88 2
39)
(24
336
782)
(1 2
70 8
63)
(18
504
987)
- 3
3 99
7 18
7 (3
91 6
03 6
84)
Net
pro
pert
y op
erat
ing
cost
s 8
418
410
-
(25
057
525)
- (1
587
657
)(1
8 22
6 77
2)O
pera
ting
and
adm
inist
rativ
e ex
pens
es(4
08 6
96 1
66)
(26
363
432)
(18
907
319)
(32
734
863)
(61
211
199)
(2 4
88 4
37)
(550
401
416
)
Gro
ss ch
ange
in in
sura
nce
and
inve
stm
ent
cont
ract
liab
ilitie
s -
- (1
63 1
25 3
89)
- -
(163
125
389
)
Ope
ratin
g pr
ofit/
(loss
) 1
75 2
01 4
05
83
460
167
(151
776
243
) 9
658
804
6
2 36
0 13
7 6
628
235
1
85 5
32 5
05
Fina
nce
cost
s(5
526
500
)-
(978
347
)-
(1 5
13 3
95)
(1 4
91 3
29)
(9 5
09 5
71)
Fair
valu
e ad
just
men
t on
inve
stm
ent p
rope
rty
6 4
46 7
60
- 1
83 7
75 5
80-
2 48
1 38
6 04
7 -
2 67
1 60
8 38
7
Shar
e of
pro
fit fr
om a
ssoc
iate
s-
- -
- 1
21 6
00 1
87
121
600
187
Profi
t bef
ore
inco
me
tax
176
121
665
8
3 46
0 16
7 3
1 02
0 99
0 9
658
804
2
542
232
789
126
737
093
2
969
231
508
Inco
me
tax
cred
it/(e
xpen
se)
33
556
124
17
726
(1 8
07 9
97)
534
056
(1
30 5
87 3
43)
694
855
(9
7 59
2 57
9)
Tota
l ass
ets
2 58
6 36
6 92
0 1
44 0
69 0
35
5 3
84 3
98 9
96 1
98 3
39 9
45
3 05
1 97
4 06
7 6
35 0
64 4
30
12 0
00 2
13 3
93
Tota
l lia
bilit
ies
1 75
3 29
1 43
8 4
6 14
0 18
4 4
745
229
261
72
674
263
176
153
027
(1
70 4
88 7
92)
6 62
2 99
9 38
1

101
ZIMRE HOLDINGS LIMITED 2020 ANNUAL REPORT
NO
TES
TO T
HE
FIN
AN
CIA
L ST
ATEM
ENTS
FOR
TH
E Y
EAR
EN
DED
31
DEC
EMBE
R 2
020
(con
tinue
d)
7SE
GM
ENT
INFO
RM
ATIO
N (c
ontin
ued)
7.1
Info
rmat
ion
abou
t pro
duct
s and
serv
ices
(con
tinue
d)
INFL
ATIO
N A
DJU
STED
Non
-life
Life
Gen
eral
Oth
er a
nd
rein
sura
nce
reas
sura
nce
insu
ranc
ePr
oper
tyel
imin
atio
nsTo
tal
Year
ende
d 31
Dec
embe
r 201
9ZW
LZW
LZW
LZW
LZW
LZW
L
Gro
ss w
ritte
n pr
emiu
m2
117
218
281
125
298
903
134
008
467
-
(149
262
214
)2
227
263
437
Retr
oces
sion
prem
ium
(754
672
835
)(2
9 40
0 34
9)(9
7 50
6 60
2)-
149
262
214
(7
32 3
17 5
72)
Net
pre
miu
m w
ritte
n1
362
545
446
95 8
98 5
5436
501
865
--
1 49
4 94
5 86
5
Cha
nge
in u
near
ned
prem
ium
rese
rve
(58
725
924)
-(2
850
227
)-
- (6
1 57
6 15
1)N
et p
rem
ium
ear
ned
1 30
3 81
9 52
2 9
5 89
8 55
4 3
3 65
1 63
8 -
- 1
433
369
714
Brok
erag
e co
mm
issio
n an
d fe
es 1
81 8
29 3
97
22
662
864
25
506
004
- (4
5 26
6 78
4) 1
84 7
31 4
81
Tota
l ins
uran
ce in
com
e1
485
648
919
118
561
418
59
157
642
- (4
5 26
6 78
4)1
618
101
195
Rent
al in
com
e fr
om in
vest
men
t pro
pert
y an
d
inco
me
from
sale
of i
nven
tory
pro
pert
y 5
424
013
-
554
256
1
18 5
03 7
27
- 1
24 4
81 9
96
Inve
stm
ent i
ncom
e 3
9 14
4 63
9 2
815
271
978
339
2
857
149
2
940
243
4
8 73
5 64
1
Oth
er (l
osse
s)/g
ains
(77
426
398)
20
486
243
13
918
288
51
704
951
(77
802
682)
(69
119
598)
Tota
l inc
ome
1 45
2 79
1 17
3 1
41 8
62 9
32 7
4 60
8 52
5 1
73 0
65 8
27
(120
129
223
)1
722
199
234
Cla
ims a
nd ex
pens
es(1
583
307
590
)(1
19 5
64 7
30)
(68
963
002)
(93
520
970)
(27
449
762)
(1 8
92 8
06 0
54)
Insu
ranc
e be
nefit
s and
clai
ms
(525
168
262
)(5
9 65
7 92
4)(8
624
690
)-
- (5
93 4
50 8
76)
Com
miss
ion
and
acqu
isitio
n ex
pens
es(5
39 4
67 1
34)
(28
022
797)
(29
712
818)
- 4
5 26
6 78
3 (5
51 9
35 9
66)
Net
pro
pert
y op
erat
ing
cost
s-
--
(21
634
447)
- (2
1 63
4 44
7)
Ope
ratin
g an
d ad
min
istra
tive
expe
nses
(518
672
194
)(3
1 88
4 00
9)(3
0 62
5 49
4)(7
1 88
6 52
3)(7
2 71
6 54
5)(7
25 7
84 7
65)
Ope
ratin
g (lo
ss)/
profi
t(1
30 5
16 4
17)
22
298
202
5 6
45 5
23
79
544
857
(147
578
985
)(1
70 6
06 8
20)

102
ZIMRE HOLDINGS LIMITED 2020 ANNUAL REPORT
NO
TES
TO T
HE
FIN
AN
CIA
L ST
ATEM
ENTS
FOR
TH
E Y
EAR
EN
DED
31
DEC
EMBE
R 2
020
(con
tinue
d)
7SE
GM
ENT
INFO
RM
ATIO
N (c
ontin
ued)
7.1
Info
rmat
ion
abou
t pro
duct
s and
serv
ices
(con
tinue
d)
INFL
ATIO
N A
DJU
STED
Year
ende
d 31
Dec
embe
r 201
9
Non
-life
rein
sura
nce
ZWL
Life
reas
sura
nce
ZWL
Gen
eral
insu
ranc
eZW
LPr
oper
tyZW
L
Oth
er a
nd
elim
inat
ions
ZWL
Tota
lZW
L
Fina
nce
cost
s(1
2 86
7 26
0)-
- (8
594
733
)(1
080
400
)(2
2 54
2 39
3)
Fair
valu
e adj
ustm
ent o
n in
vest
men
t pro
pert
ies
2 7
52 0
86
- -
771
757
551
-
774
509
637
Loss
on
net m
onet
ary
posit
ion
--
--
(71
436)
(71
436)
Shar
e of
pro
fit o
f ass
ocia
tes
- -
- -
20
384
899
20
384
899
(Los
s)/p
rofit
bef
ore
inco
me
tax
(140
631
591
) 2
2 29
8 20
2 5
645
523
8
42 7
07 6
75
(128
274
486
) 6
01 6
73 8
87
Inco
me
tax
expe
nse
(10
712
748)
- (1
7 44
3 83
7)(9
1 93
1 97
7)(5
626
591
)(1
25 7
15 1
53)
Tota
l ass
ets
3 73
1 82
1 56
7 3
40 9
26 5
27
205
496
930
2
358
074
583
(1 7
17 9
44 9
16)
4 91
8 37
4 69
1
Tota
l lia
bilit
ies
1 47
5 57
6 39
3 5
0 70
8 95
1 6
0 37
1 83
4 1
64 3
48 9
65
(127
738
472
)1
623
267
671
HIS
TOR
ICA
L C
OST
Year
ende
d 31
Dec
embe
r 201
9
Non
-life
rein
sura
nce
ZWL
Life
reas
sura
nce
ZWL
Gen
eral
insu
ranc
eZW
LPr
oper
tyZW
L
Oth
er a
nd
elim
inat
ions
ZWL
Tota
lZW
L
Gro
ss w
ritte
n pr
emiu
m 2
29 8
10 4
73
13
381
669
15
892
634
- (1
6 12
0 93
1) 2
42 9
63 8
45
Retr
oces
sion
prem
ium
(80
463
474)
(4 5
74 5
42)
(12
299
010)
- 1
6 12
0 93
1 (8
1 21
6 09
5)
Net
pre
miu
m w
ritte
n 1
49 3
46 9
99
8 8
07 1
27
3 5
93 6
24
- -
161
747
750
Cha
nge
in u
near
ned
prem
ium
rese
rve
(7 0
96 6
86)
- (2
80 6
05)
- -
(7 3
77 2
91)
Net
pre
miu
m e
arne
d 1
42 2
50 3
13
8 8
07 1
27
3 3
13 0
18
- -
154
370
459
Brok
erag
e co
mm
issio
n an
d fe
es 2
0 15
9 28
6 4
524
301
2
926
870
-
(3 8
54 2
43)
23
756
214
Tota
l ins
uran
ce in
com
e 1
62 4
09 5
99
13
331
428
6 2
39 8
89
- (3
854
243
) 1
78 1
26 6
73
Rent
al in
com
e fr
om in
vest
men
t pro
pert
y an
d
Inco
me
from
sale
of i
nven
tory
pro
pert
y 5
26 6
18
- 4
2 07
5 1
2 73
6 43
5 -
13
305
128
Inve
stm
ent a
nd o
ther
inco
me
3 8
99 6
27
250
182
1
28 1
24
206
093
2
91 0
23
4 7
75 0
49
Oth
er (l
osse
s)/g
ains
(4 7
89 7
60)
2 2
73 9
96
2 3
18 7
33
8 1
28 1
10
776
788
8
707
867
Tota
l inc
ome
162
046
085
1
5 85
5 60
6 8
728
820
2
1 07
0 63
8 (2
786
432
) 2
04 9
14 7
17

103
ZIMRE HOLDINGS LIMITED 2020 ANNUAL REPORT
NO
TES
TO T
HE
FIN
AN
CIA
L ST
ATEM
ENTS
FOR
TH
E Y
EAR
EN
DED
31
DEC
EMBE
R 2
020
(con
tinue
d)
7SE
GM
ENT
INFO
RM
ATIO
N (c
ontin
ued)
7.1
Info
rmat
ion
abou
t pro
duct
s and
serv
ices
(con
tinue
d)
INFL
ATIO
N A
DJU
STED
2019
Non
-life
rein
sura
nce
ZWL
Life
reas
sura
nce
ZWL
Gen
eral
insu
ranc
eZW
LPr
oper
tyZW
L
Oth
er a
nd
elim
inat
ions
ZWL
Tota
lZW
L
Cla
ims a
nd ex
pens
es(1
71 9
88 1
58)
(12
094
624)
(7 4
25 3
83)
(9 3
84 3
56)
(2 0
34 2
97)
(202
926
818
)
Insu
ranc
e be
nefit
s and
clai
ms
(55
939
808)
(5 7
13 6
26)
(650
428
)-
- (6
2 30
3 86
2)
Com
miss
ion
and
acqu
isitio
n ex
pens
es(5
9 12
5 22
3)(2
946
290
)(3
386
593
)-
3 8
54 2
44
(61
603
862)
Net
pro
pert
y op
erat
ing
cost
s-
- -
(1 8
58 5
66)
(1 8
58 5
66)
Ope
ratin
g an
d ad
min
istra
tive
expe
nses
(56
923
127)
(3 4
34 7
08)
(3 3
88 3
62)
(7 5
25 7
90)
(5 8
88 5
41)
(77
160
528)
Ope
ratin
g (lo
ss)/
profi
t(9
942
074
) 3
760
983
1
303
437
1
1 68
6 28
2 (4
820
728
) 1
987
899
Fina
nce
cost
s(1
249
288
)-
- -
(106
472
)(1
355
760
)
Fair
valu
e ad
just
men
t on
Inve
stm
ent p
rope
rty
267
201
-
- 4
33 0
36 9
01
- 4
33 3
04 1
02
Shar
e of
pro
fit fr
om a
ssoc
iate
s(6
35 7
00)
- -
- 4
283
864
3
648
164
(Los
s)/p
rofit
bef
ore
tax
(11
559
861)
3 7
60 9
83
1 3
03 4
37
444
723
183
(6
43 3
36)
437
584
405
Inco
me
tax
cred
it/(e
xpen
se)
8 2
46 7
08
290
(7
8 17
6)(2
6 75
6 00
0) 1
0 67
3 (1
8 57
6 50
5)
Tota
l ass
ets
672
833
519
2
8 75
5 14
4 4
4 75
0 02
4 5
03 2
09 0
83
(198
303
957
)1
051
243
813
Tota
l lia
bilit
ies
349
285
095
1
1 30
4 18
5 1
3 09
3 15
7 3
6 63
7 15
0 (6
5 87
9 07
4) 3
44 4
40 5
12
7.2
Geo
grap
hica
l inf
orm
atio
n
Info
rmat
ion
belo
w sh
ows o
pera
ting
resu
lts in
the
coun
trie
s in
whi
ch th
e G
roup
ope
rate
s
INFL
ATIO
N A
DJU
STED
Year
ende
d 31
Dec
embe
r 202
0Bo
tsw
ana
ZWL
Mal
awi
ZWL
Moz
ambi
que
ZWL
Zam
bia
ZWL
Zim
babw
eZW
LEl
imin
atio
nsZW
LTo
tal
ZWL
Gro
ss p
rem
ium
159
633
915
439
633
620
2
76 4
33 1
49
134
653
289
1
294
258
371
(174
979
124
)2
129
633
220
Retr
oces
sion
prem
ium
(71
515
412)
(233
001
075
)(1
27 9
28 5
15)
(38
373
011)
(307
534
434
) 1
74 9
79 1
24
(603
373
323
)
Net
pre
miu
m w
ritte
n 8
8 11
8 50
3 2
06 6
32 5
45
148
504
634
9
6 28
0 27
8 9
86 7
23 9
37
- 1
526
259
897
Cha
nge
in u
near
ned
prem
ium
pro
visio
n 1
3 40
1 40
9 6
726
709
(1
724
204
)(5
424
906
)(1
33 3
56 2
90)
- (1
20 3
77 2
82)
Net
pre
miu
m e
arne
d 1
01 5
19 9
12
213
359
254
1
46 7
80 4
30
90
855
372
853
367
647
-
1 40
5 88
2 61
5
Brok
erag
e fe
es a
nd co
mm
issio
n 2
3 62
0 39
4 3
0 54
6 84
2 5
0 50
8 61
4 8
878
619
6
7 45
8 77
0 (5
3 27
4 67
6) 1
27 7
38 5
63
Tota
l ins
uran
ce re
venu
e 1
25 1
40 3
06
243
906
096
1
97 2
89 0
44
99
733
991
920
826
417
(5
3 27
4 67
6)1
533
621
178

104
ZIMRE HOLDINGS LIMITED 2020 ANNUAL REPORT
NO
TES
TO T
HE
FIN
AN
CIA
L ST
ATEM
ENTS
FOR
TH
E Y
EAR
EN
DED
31
DEC
EMBE
R 2
020
(con
tinue
d)
7SE
GM
ENT
INFO
RM
ATIO
N (c
ontin
ued)
7.2
Geo
grap
hica
l inf
orm
atio
n (c
ontin
ued)
INFL
ATIO
N A
DJU
STED
2020
Bots
wan
aZW
LM
alaw
iZW
LM
ozam
biqu
eZW
LZa
mbi
aZW
LZi
mba
bwe
ZWL
Elim
inat
ions
ZWL
Tota
lZW
L
Rent
al re
venu
e an
d in
com
e
from
sale
of i
nven
tory
pro
pert
y-
2 1
61 7
49
839
665
-
115
943
809
-
118
945
223
Inve
stm
ent a
nd o
ther
reve
nue
2 1
23 2
68
7 3
26 7
32
2 9
84 9
01
4 3
35 7
40
12
258
902
(194
353
) 2
8 83
5 19
0
Oth
er (l
oss)
/inco
me
(448
912
)(7
265
416
) 6
5 61
5 79
1 1
0 81
1 81
9 2
17 8
57 7
40
(7 4
45 9
87)
279
125
036
Tota
l inc
ome
126
814
662
2
46 1
29 1
61
266
729
401
1
14 8
81 5
50
1 26
6 88
6 86
8 (6
0 91
5 01
8)1
960
526
627
Tota
l cla
ims a
nd ex
pens
es(1
11 3
10 0
13)
(228
580
518
)(2
01 5
62 3
38)
(97
901
012)
(683
402
026
)(1
6 33
8 58
8)(1
339
094
495
)
Net
ben
efits
and
clai
ms
(30
421
043)
(58
392
892)
(46
086
703)
(13
610
820)
(396
919
652
)-
(545
431
110
)
Com
miss
ion
and
acqu
isitio
n ex
pens
es(4
5 70
2 06
6)(7
9 89
9 85
0)(8
1 98
6 65
1)(3
6 11
7 10
0)(2
65 9
71 2
71)
53
274
676
(456
402
262
)
Net
pro
pert
y op
erat
ing
cost
s-
8 4
18 4
10
- -
(18
586
867)
(10
168
457)
Ope
ratin
g an
d ad
min
istra
tive
expe
nses
(35
186
904)
(98
706
186)
(73
488
984)
(48
173
092)
(1 9
24 2
36)
(69
613
264)
(327
092
666
)
Gro
ss ch
ange
in in
sura
nce
and
inve
stm
ent c
ontr
act l
iabi
litie
s -
- -
- (4
8 88
8 10
0)(4
8 88
8 10
0)
Ope
ratin
g pr
ofit/
(los
s) 1
5 50
4 64
9 1
7 54
8 64
3 6
5 16
7 06
3 1
6 98
0 53
8 5
34 5
96 7
42
(77
253
606)
572
544
032
Fina
nce
cost
s-
- (4
191
802
)(1
334
698
)(4
700
999
)(1
761
959
)(1
1 98
9 45
8)
Fair
valu
e ad
just
men
t on
-
Inve
stm
ent p
rope
rty
- 6
470
305
(2
3 54
5)-
806
690
911
-
813
137
671
Mon
etar
y ga
in/lo
ss-
- -
- 1
8 67
8 25
2 (4
42 0
89 5
97)
(423
411
345
)
Shar
e of
pro
fit fr
om a
ssoc
iate
s-
- 8
9 60
8 04
6 9
8 05
1 83
4 1
87 6
59 8
80
Profi
t bef
ore
inco
me
tax
15
504
649
24
018
948
60
951
716
15
645
840
1 44
4 87
2 95
2 (4
23 0
53 3
28)
1 13
7 94
0 78
0
Inco
me
tax
(exp
ense
)/cr
edit
(4 1
61 2
80)
(10
790
134)
(2 1
19 7
33)
2 2
19 9
64
(42
491
347)
(7 8
35 2
53)
(65
177
783)
Tota
l ass
ets
1 25
1 87
4 55
7 8
39 1
64 5
03
516
206
643
1
90 2
39 1
50
14 1
39 7
69 8
02
(4 4
62 1
78 1
07)
12 4
75 0
76 5
48
Tota
l lia
bilit
ies
270
318
162
5
66 9
44 2
50
351
106
135
1
23 8
29 3
70
5 73
7 22
5 12
8 (3
25 9
96 4
50)
6 72
3 42
6 59
5
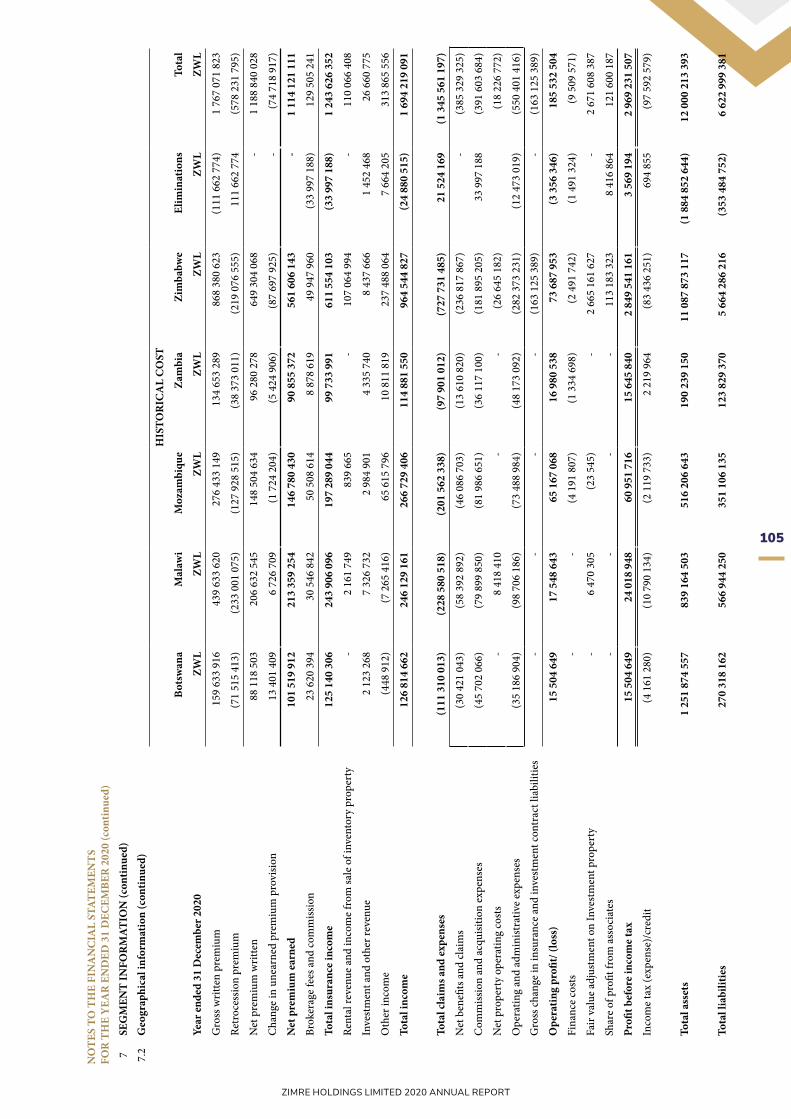
105
ZIMRE HOLDINGS LIMITED 2020 ANNUAL REPORT
NO
TES
TO T
HE
FIN
AN
CIA
L ST
ATEM
ENTS
FOR
TH
E Y
EAR
EN
DED
31
DEC
EMBE
R 2
020
(con
tinue
d)7
SEG
MEN
T IN
FOR
MAT
ION
(con
tinue
d)7.
2G
eogr
aphi
cal i
nfor
mat
ion
(con
tinue
d)H
ISTO
RIC
AL
CO
ST
Bots
wan
aM
alaw
iM
ozam
biqu
eZa
mbi
aZi
mba
bwe
Elim
inat
ions
Tota
l
Year
ende
d 31
Dec
embe
r 202
0ZW
LZW
LZW
LZW
LZW
LZW
LZW
L
Gro
ss w
ritte
n pr
emiu
m 1
59 6
33 9
16
439
633
620
2
76 4
33 1
49
134
653
289
8
68 3
80 6
23
(111
662
774
)1
767
071
823
Retr
oces
sion
prem
ium
(71
515
413)
(233
001
075
)(1
27 9
28 5
15)
(38
373
011)
(219
076
555
) 1
11 6
62 7
74
(578
231
795
)
Net
pre
miu
m w
ritte
n 8
8 11
8 50
3 2
06 6
32 5
45
148
504
634
9
6 28
0 27
8 6
49 3
04 0
68
- 1
188
840
028
Cha
nge
in u
near
ned
prem
ium
pro
visio
n 1
3 40
1 40
9 6
726
709
(1
724
204
)(5
424
906
)(8
7 69
7 92
5)-
(74
718
917)
Net
pre
miu
m e
arne
d 1
01 5
19 9
12
213
359
254
1
46 7
80 4
30
90
855
372
561
606
143
-
1 11
4 12
1 11
1
Brok
erag
e fe
es a
nd co
mm
issio
n 2
3 62
0 39
4 3
0 54
6 84
2 5
0 50
8 61
4 8
878
619
4
9 94
7 96
0 (3
3 99
7 18
8) 1
29 5
05 2
41
Tota
l ins
uran
ce in
com
e 1
25 1
40 3
06
243
906
096
1
97 2
89 0
44
99
733
991
611
554
103
(3
3 99
7 18
8)1
243
626
352
Rent
al re
venu
e an
d in
com
e fr
om sa
le o
f inv
ento
ry p
rope
rty
- 2
161
749
8
39 6
65
- 1
07 0
64 9
94
- 1
10 0
66 4
08
Inve
stm
ent a
nd o
ther
reve
nue
2 1
23 2
68
7 3
26 7
32
2 9
84 9
01
4 3
35 7
40
8 4
37 6
66
1 4
52 4
68
26
660
775
Oth
er in
com
e(4
48 9
12)
(7 2
65 4
16)
65
615
796
10
811
819
237
488
064
7
664
205
3
13 8
65 5
56
Tota
l inc
ome
126
814
662
2
46 1
29 1
61
266
729
406
1
14 8
81 5
50
964
544
827
(2
4 88
0 51
5)1
694
219
091
Tota
l cla
ims a
nd ex
pens
es(1
11 3
10 0
13)
(228
580
518
)(2
01 5
62 3
38)
(97
901
012)
(727
731
485
) 2
1 52
4 16
9 (1
345
561
197
)
Net
ben
efits
and
clai
ms
(30
421
043)
(58
392
892)
(46
086
703)
(13
610
820)
(236
817
867
)-
(385
329
325
)
Com
miss
ion
and
acqu
isitio
n ex
pens
es(4
5 70
2 06
6)(7
9 89
9 85
0)(8
1 98
6 65
1)(3
6 11
7 10
0)(1
81 8
95 2
05)
33
997
188
(391
603
684
)
Net
pro
pert
y op
erat
ing
cost
s-
8 4
18 4
10
- -
(26
645
182)
(18
226
772)
Ope
ratin
g an
d ad
min
istra
tive
expe
nses
(35
186
904)
(98
706
186)
(73
488
984)
(48
173
092)
(282
373
231
)(1
2 47
3 01
9)(5
50 4
01 4
16)
Gro
ss ch
ange
in in
sura
nce
and
inve
stm
ent c
ontr
act l
iabi
litie
s -
- -
- (1
63 1
25 3
89)
- (1
63 1
25 3
89)
Ope
ratin
g pr
ofit/
(los
s) 1
5 50
4 64
9 1
7 54
8 64
3 6
5 16
7 06
8 1
6 98
0 53
8 7
3 68
7 95
3 (3
356
346
) 1
85 5
32 5
04
Fina
nce
cost
s-
- (4
191
807
)(1
334
698
)(2
491
742
)(1
491
324
)(9
509
571
)
Fair
valu
e ad
just
men
t on
Inve
stm
ent p
rope
rty
- 6
470
305
(2
3 54
5)-
2 66
5 16
1 62
7 -
2 67
1 60
8 38
7
Shar
e of
pro
fit fr
om a
ssoc
iate
s-
- -
- 1
13 1
83 3
23
8 4
16 8
64
121
600
187
Profi
t bef
ore
inco
me
tax
15
504
649
24
018
948
60
951
716
15
645
840
2 84
9 54
1 16
1 3
569
194
2
969
231
507
Inco
me
tax
(exp
ense
)/cr
edit
(4 1
61 2
80)
(10
790
134)
(2 1
19 7
33)
2 2
19 9
64
(83
436
251)
694
855
(9
7 59
2 57
9)
Tota
l ass
ets
1 25
1 87
4 55
7 8
39 1
64 5
03
516
206
643
1
90 2
39 1
50
11 0
87 8
73 1
17
(1 8
84 8
52 6
44)
12 0
00 2
13 3
93
Tota
l lia
bilit
ies
270
318
162
5
66 9
44 2
50
351
106
135
1
23 8
29 3
70
5 66
4 28
6 21
6 (3
53 4
84 7
52)
6 62
2 99
9 38
1
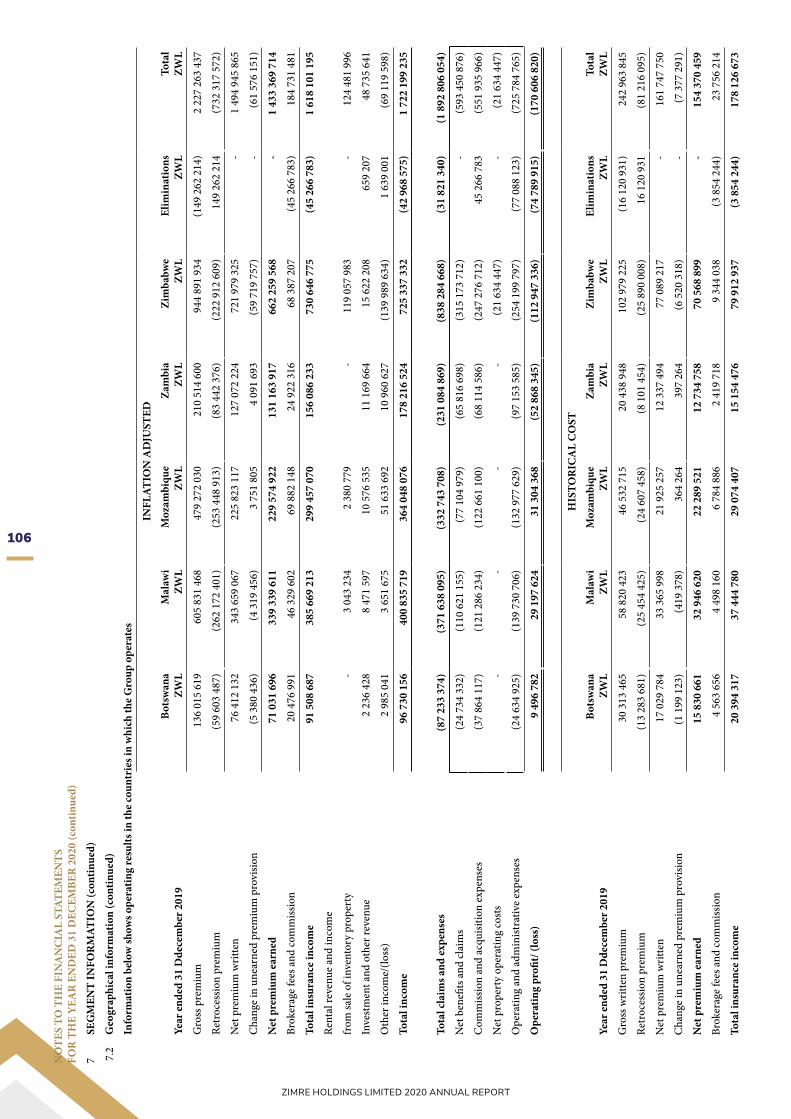
106
ZIMRE HOLDINGS LIMITED 2020 ANNUAL REPORT
NO
TES
TO T
HE
FIN
AN
CIA
L ST
ATEM
ENTS
FOR
TH
E Y
EAR
EN
DED
31
DEC
EMBE
R 2
020
(con
tinue
d)
7SE
GM
ENT
INFO
RM
ATIO
N (c
ontin
ued)
7.2
Geo
grap
hica
l inf
orm
atio
n (c
ontin
ued)
Info
rmat
ion
belo
w sh
ows o
pera
ting
resu
lts in
the
coun
trie
s in
whi
ch th
e G
roup
ope
rate
s
Year
ende
d 31
Dde
cem
ber 2
019
INFL
ATIO
N A
DJU
STED
Bots
wan
aZW
LM
alaw
iZW
LM
ozam
biqu
eZW
LZa
mbi
aZW
LZi
mba
bwe
ZWL
Elim
inat
ions
ZWL
Tota
lZW
L
Gro
ss p
rem
ium
136
015
619
605
831
468
4
79 2
72 0
30
210
514
600
9
44 8
91 9
34
(149
262
214
)2
227
263
437
Retr
oces
sion
prem
ium
(59
603
487)
(262
172
401
)(2
53 4
48 9
13)
(83
442
376)
(222
912
609
) 1
49 2
62 2
14
(732
317
572
)
Net
pre
miu
m w
ritte
n 7
6 41
2 13
2 3
43 6
59 0
67
225
823
117
1
27 0
72 2
24
721
979
325
-
1 49
4 94
5 86
5
Cha
nge
in u
near
ned
prem
ium
pro
visio
n(5
380
436
)(4
319
456
) 3
751
805
4
091
693
(5
9 71
9 75
7)-
(61
576
151)
Net
pre
miu
m e
arne
d 7
1 03
1 69
6 3
39 3
39 6
11
229
574
922
1
31 1
63 9
17
662
259
568
-
1 43
3 36
9 71
4
Brok
erag
e fe
es a
nd co
mm
issio
n 2
0 47
6 99
1 4
6 32
9 60
2 6
9 88
2 14
8 2
4 92
2 31
6 6
8 38
7 20
7 (4
5 26
6 78
3) 1
84 7
31 4
81
Tota
l ins
uran
ce in
com
e 9
1 50
8 68
7 3
85 6
69 2
13
299
457
070
1
56 0
86 2
33
730
646
775
(4
5 26
6 78
3)1
618
101
195
Rent
al re
venu
e an
d in
com
e
from
sale
of i
nven
tory
pro
pert
y-
3 0
43 2
34
2 3
80 7
79
- 1
19 0
57 9
83
- 1
24 4
81 9
96
Inve
stm
ent a
nd o
ther
reve
nue
2 2
36 4
28 8
471
597
1
0 57
6 53
5 1
1 16
9 66
4 1
5 62
2 20
8 6
59 2
07
48
735
641
Oth
er in
com
e/(lo
ss)
2 9
85 0
41 3
651
675
5
1 63
3 69
2 1
0 96
0 62
7 (1
39 9
89 6
34)
1 6
39 0
01
(69
119
598)
Tota
l inc
ome
96
730
156
400
835
719
3
64 0
48 0
76
178
216
524
7
25 3
37 3
32
(42
968
575)
1 72
2 19
9 23
5
Tota
l cla
ims a
nd ex
pens
es(8
7 23
3 37
4)(3
71 6
38 0
95)
(332
743
708
)(2
31 0
84 8
69)
(838
284
668
)(3
1 82
1 34
0)(1
892
806
054
)
Net
ben
efits
and
clai
ms
(24
734
332)
(110
621
155
)(7
7 10
4 97
9)(6
5 81
6 69
8)(3
15 1
73 7
12)
-(5
93 4
50 8
76)
Com
miss
ion
and
acqu
isitio
n ex
pens
es(3
7 86
4 11
7)(1
21 2
86 2
34)
(122
661
100
)(6
8 11
4 58
6)(2
47 2
76 7
12)
45
266
783
(551
935
966
)
Net
pro
pert
y op
erat
ing
cost
s-
--
-(2
1 63
4 44
7)-
(21
634
447)
Ope
ratin
g an
d ad
min
istra
tive
expe
nses
(24
634
925)
(139
730
706
)(1
32 9
77 6
29)
(97
153
585)
(254
199
797
)(7
7 08
8 12
3)(7
25 7
84 7
65)
Ope
ratin
g pr
ofit/
(los
s) 9
496
782
2
9 19
7 62
4 3
1 30
4 36
8 (5
2 86
8 34
5)(1
12 9
47 3
36)
(74
789
915)
(170
606
820
)
HIS
TOR
ICA
L C
OST
Year
ende
d 31
Dde
cem
ber 2
019
Bots
wan
aZW
LM
alaw
iZW
LM
ozam
biqu
eZW
LZa
mbi
aZW
LZi
mba
bwe
ZWL
Elim
inat
ions
ZWL
Tota
lZW
L
Gro
ss w
ritte
n pr
emiu
m 3
0 31
3 46
5 5
8 82
0 42
3 4
6 53
2 71
5 2
0 43
8 94
8 1
02 9
79 2
25
(16
120
931)
242
963
845
Retr
oces
sion
prem
ium
(13
283
681)
(25
454
425)
(24
607
458)
(8 1
01 4
54)
(25
890
008)
16
120
931
(81
216
095)
Net
pre
miu
m w
ritte
n 1
7 02
9 78
4 3
3 36
5 99
8 2
1 92
5 25
7 1
2 33
7 49
4 7
7 08
9 21
7 -
161
747
750
Cha
nge
in u
near
ned
prem
ium
pro
visio
n(1
199
123
)(4
19 3
78)
364
264
3
97 2
64
(6 5
20 3
18)
- (7
377
291
)
Net
pre
miu
m e
arne
d 1
5 83
0 66
1 3
2 94
6 62
0 2
2 28
9 52
1 1
2 73
4 75
8 7
0 56
8 89
9 -
154
370
459
Brok
erag
e fe
es a
nd co
mm
issio
n 4
563
656
4
498
160
6
784
886
2
419
718
9
344
038
(3
854
244
) 2
3 75
6 21
4
Tota
l ins
uran
ce in
com
e 2
0 39
4 31
7 3
7 44
4 78
0 2
9 07
4 40
7 1
5 15
4 47
6 7
9 91
2 93
7 (3
854
244
) 1
78 1
26 6
73

107
ZIMRE HOLDINGS LIMITED 2020 ANNUAL REPORT
NO
TES
TO T
HE
FIN
AN
CIA
L ST
ATEM
ENTS
FOR
TH
E Y
EAR
EN
DED
31
DEC
EMBE
R 2
020
(con
tinue
d)
7SE
GM
ENT
INFO
RM
ATIO
N (c
ontin
ued)
7.2
Geo
grap
hica
l inf
orm
atio
n (c
ontin
ued)
Year
ende
d 31
Dec
embe
r 201
9
INFL
ATIO
N A
DJU
STED
Bots
wan
aZW
LM
alaw
iZW
LM
ozam
biqu
eZW
LZa
mbi
aZW
LZi
mba
bwe
ZWL
Elim
inat
ions
ZWL
Tota
lZW
L
Rent
al re
venu
e an
d in
com
e
from
sale
of i
nven
tory
pro
pert
y-
295
469
2
31 1
51
- 1
2 77
8 50
8 -
13
305
128
Inve
stm
ent a
nd o
ther
reve
nue
498
428
8
22 5
11
1 0
26 8
80
1 0
84 4
67
1 1
95 8
48
146
915
4
775
049
Oth
er (l
oss)
/inco
me
(118
020
) 3
54 5
43
5 0
13 1
36
1 0
64 1
72
2 6
88 9
68
(294
932
) 8
707
867
Tota
l inc
ome
20
774
725
38
917
303
35
345
574
17
303
115
96
576
261
(4 0
02 2
61)
204
914
717
Tota
l cla
ims a
nd e
xpen
ses
(19
441
486)
(36
082
494)
(32
306
222)
(22
436
124)
(89
603
364)
(3 0
57 1
28)
(202
926
818
)
Net
ben
efits
and
clai
ms
(5 5
12 4
80)
(10
740
253)
(7 4
86 1
54)
(6 3
90 1
70)
(32
174
805)
- (6
2 30
3 86
2)
Com
miss
ion
and
acqu
isitio
n ex
pens
es(8
438
682
)(1
1 77
5 73
0)(1
1 90
9 21
6)(6
613
273
)(2
6 72
1 20
5) 3
854
244
(6
1 60
3 86
2)
Net
pro
pert
y op
erat
ing
cost
s-
--
-(1
858
566
)-
(1 8
58 5
66)
Ope
ratin
g an
d ad
min
istra
tive
expe
nses
(5 4
90 3
24)
(13
566
511)
(12
910
852)
(9 4
32 6
81)
(28
848
788)
(6 9
11 3
72)
(77
160
528)
Ope
ratin
g pr
ofit/
(los
s) 1
333
239
2
834
809
3
039
352
(5
133
009
) 6
972
897
(7
059
389
) 1
987
899

108
ZIMRE HOLDINGS LIMITED 2020 ANNUAL REPORT
NOTES TO THE FINANCIAL STATEMENTSFOR THE YEAR ENDED 31 DECEMBER 2020 (continued)
INFLATION ADJUSTED8 PROPERTY AND EQUIPMENT
GROUP
Freehold land and buildings
ZWL
Motor vehicles
ZWL
Equipment andcomputers
ZWL
Furniture and fittings
ZWLTotalZWL
Year ended 31 December 2019
Cost or valuation
As at 1 January 2019 122 607 978 42 466 492 32 245 738 23 800 156 221 120 364
Additions 10 413 197 10 239 176 14 956 658 4 639 554 40 248 585
Revaluation surplus 104 867 740 - - - 104 867 740Disposals (8 616 807) (983 001) (1 283 690) (320 613) (11 204 111)
Foreign exchange movements 77 252 346 30 424 459 8 671 367 4 288 599 120 636 771
As at 31 December 2019 306 524 454 82 147 126 54 590 073 32 407 696 475 669 349
Accumulated depreciation and impairment
As at 1 January 2019 (16 454 774) (18 443 633) (20 883 461) (4 182 755) (59 964 623)
Depreciation (9 657 552) (13 611 207) (7 640 471) (5 538 444) (36 447 674)
Disposals 817 999 1 294 479 1 008 923 209 239 3 330 640
Foreign exchange movements 6 338 938 (13 833 460) (5 915 134) (2 030 271) (15 439 927)
As at 31 December 2019 (18 955 389) (44 593 821) (33 430 143) (11 542 231) (108 521 584)
Net book amount 287 569 065 37 553 305 21 159 930 20 865 465 367 147 765
Carrying amount
As at 31 December 2019
Cost 306 524 454 82 147 126 54 590 073 32 407 696 475 669 349
Accumulated depreciation (18 955 389) (44 593 821) (33 430 143) (11 542 231) (108 521 584)
287 569 065 37 553 305 21 159 930 20 865 465 367 147 765
Year ended 31 December 2020
Cost or valuation
As at 1 January 2020 306 524 454 82 147 126 54 590 073 32 407 696 475 669 349
Additions 1 055 240 32 247 488 21 238 195 3 046 439 57 587 362Acquisitions through business combinations 351 759 394 74 508 812 36 609 685 15 380 248 478 258 139
Revaluation surplus (7 444 669) 1 146 141 - - (6 298 528)Disposals - (7 414 106) (2 213 459) (171 326) (9 798 891)Reclassification to investment property (20 111 353) - - - (20 111 353)
Foreign exchange movements (23 278 582) 34 194 055 12 162 655 4 911 106 27 989 234
As at 31 December 2020 608 504 484 216 829 516 122 387 149 55 574 163 1 003 295 312

109
ZIMRE HOLDINGS LIMITED 2020 ANNUAL REPORT
NOTES TO THE FINANCIAL STATEMENTSFOR THE YEAR ENDED 31 DECEMBER 2020 (continued)
INFLATION ADJUSTED
8 PROPERTY AND EQUIPMENT
GROUP
Freehold land and buildings
ZWL
Motor vehicles
ZWL
Equipment andcomputers
ZWL
Furniture and fittings
ZWLTotalZWL
Accumulated depreciation and impairment
As at 1 January 2020 (18 955 389) (44 593 821) (33 430 143) (11 542 231) (108 521 584)
Depreciation (5 921 897) (7 794 260) (10 292 904) (4 741 707) (28 750 768)
Disposals (178 620) 7 265 908 1 395 645 158 471 8 641 404
Revaluation surplus 3 299 760 - - - 3 299 760
Acquisitions through business combinations (3 739 694) (63 047 831) (29 261 385) (7 825 024) (103 873 934)
Accumulated depreciation on disposals 1 208 666 387 413 - - 1 596 079
Foreign exchange movements (2 031 065) (23 189 224) (8 879 973) (163 364) (34 263 626)
As at 31 December 2020 (26 318 239) (130 971 815) (80 468 760) (24 113 855) (261 872 669)
Net book amount 582 186 244 85 857 701 41 918 389 31 460 308 741 422 643
Carrying amount
As at 31 December 2020
Cost 608 504 483 216 829 516 122 387 149 55 574 163 1 003 295 312
Accumulated depreciation (26 318 239) (130 971 815) (80 468 760) (24 113 855) (261 872 669)
582 186 244 85 857 701 41 918 389 31 460 308 741 422 643
GROUP HISTORICAL COST
Year ended 31 December 2019
Freehold land and buildings
ZWL
Motor vehicles
ZWL
Equipment andcomputers
ZWL
Furniture and fittings
ZWLTotalZWL
Cost or valuation
As at 1 January 2019 4 156 194 1 402 915 766 539 743 277 7 068 925
Additions 946 792 848 384 1 633 639 842 261 4 271 076
Revaluation surplus 33 785 861 - - - 33 785 861Disposals (1 920 884) (219 133) (284 872) (56 471) (2 481 360)
Foreign exchange movements 26 567 217 10 315 415 2 909 394 1 424 691 41 216 716
As at 31 December 2019 63 535 180 12 347 581 5 024 700 2 953 758 83 861 219Accumulated depreciation and impairment
As at 1 January 2019 (364 432) (627 904) (526 441) (270 161) (1 788 938)
Depreciation (616 383) (1 132 254) (383 293) (242 922) (2 374 852)
Disposals 116 916 185 019 24 675 20 675 347 285
Foreign exchange movements 120 638 (5 704 997) (2 122 441) (749 550) (8 456 350)
As at 31 December 2019 (743 261) (7 280 136) (3 007 500) (1 241 958) (12 272 855)
Net book amount 62 791 919 5 067 445 2 017 200 1 711 800 71 588 364
Carrying amount
As at 31 December 2019
Cost 63 535 180 12 347 581 5 024 700 2 953 758 83 861 219
Accumulated depreciation (743 261) (7 280 136) (3 007 500) (1 241 958) (12 272 855)
62 791 919 5 067 445 2 017 200 1 711 800 71 588 364

110
ZIMRE HOLDINGS LIMITED 2020 ANNUAL REPORT
NOTES TO THE FINANCIAL STATEMENTSFOR THE YEAR ENDED 31 DECEMBER 2020 (continued)
8 PROPERTY AND EQUIPMENT (continued)
GROUP HISTORICAL COST Freehold land and buildings
ZWL
Motor vehicles
ZWL
Equipment andcomputers
ZWL
Furniture and fittings
ZWLTotalZWL
Year ended 31 December 2020
Cost or valuation
As at 1 January 2020 63 535 180 12 347 581 5 024 700 2 953 758 83 861 219
Additions 515 716 26 011 023 16 110 592 2 469 406 45 106 737Acquisitions through business combinations 311 722 662 2 906 314 3 482 420 1 105 130 319 216 526
Revaluation surplus 113 580 293 2 335 148 115 915 441Disposals (927 381) (7 154 906) (803 655) (98 420) (8 984 362)
Reclassification to investment property (20 111 353) - - (20 111 353)
Foreign exchange movements 122 216 078 36 641 594 18 982 906 6 658 839 184 499 417
As at 31 December 2020 590 531 195 73 086 754 42 796 963 13 088 713 719 503 625
Accumulated depreciation and impairment
As at 1 January 2020 (743 261) (7 280 136) (3 007 500) (1 241 958) (12 272 855)
Depreciation (3 659 879) (6 141 146) (3 023 441) (763 521) (13 587 987)Acquisitions through business combinations 601 957 (2 571 659) (3 360 444) (843 031) (6 173 177)
Revaluation surplus (595 402) - - - (595 402)
Disposals (178 620) 7 107 830 745 367 83 439 7 758 016
Accumulated depreciation on disposals 592 626 55 310 647 936
Foreign exchange movements 1 689 132 (23 189 224) (8 879 972) (163 364) (30 543 428)
As at 31 December 2020 (2 293 447) (32 019 025) (17 525 990) (2 928 435) (54 766 897)
Net book amount 588 237 748 41 067 729 25 270 973 10 160 278 664 736 728
Carrying amount
As at 31 December 2020
Cost 590 531 195 73 086 755 42 796 963 13 088 713 719 503 625
Accumulated depreciation (2 293 447) (32 019 025) (17 525 990) (2 928 435) (54 766 897)
588 237 748 41 067 729 25 270 973 10 160 278 664 736 728
Land and buildings are carried at fair value determined on an open market value basis by independent professional valuers. The latest fair value was estimated as at 31 December 2020. Land and buildings with a carrying amount of ZWL278 052 000 (2019 : ZWL259 932 714) were pledged as collateral in respect of a borrowing facility with NMB Bank Zimbabwe Limited, which is disclosed in note 23.
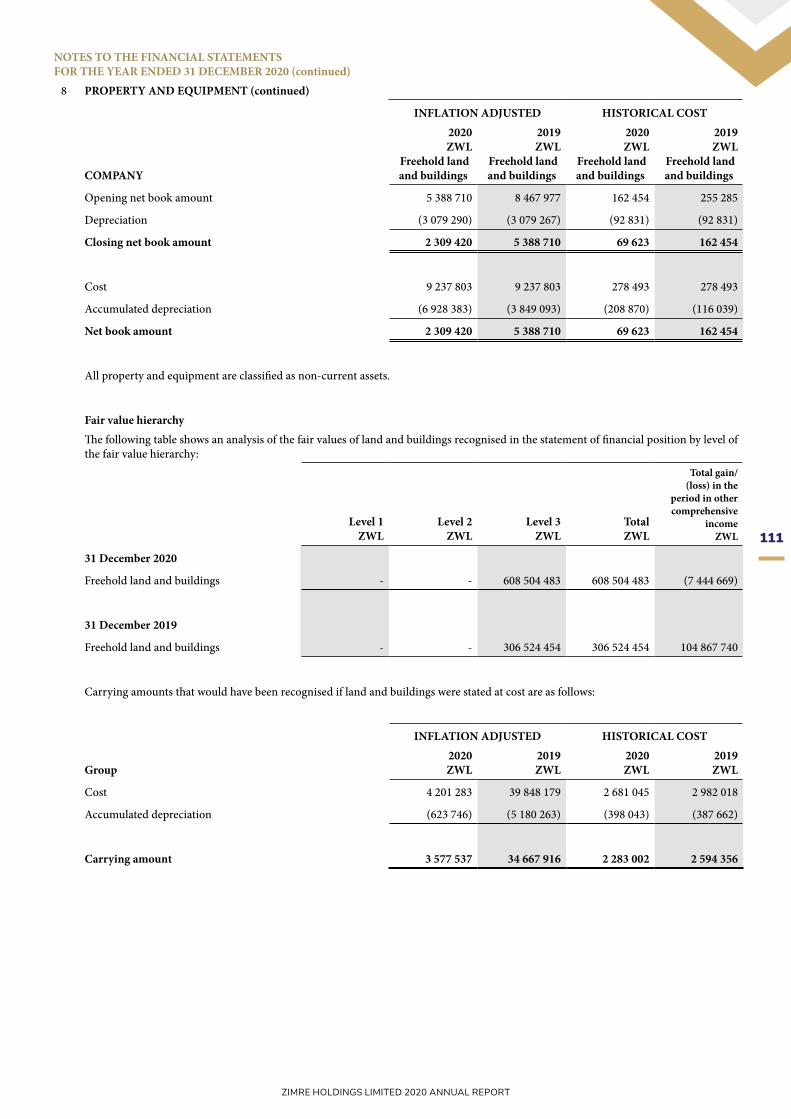
111
ZIMRE HOLDINGS LIMITED 2020 ANNUAL REPORT
NOTES TO THE FINANCIAL STATEMENTSFOR THE YEAR ENDED 31 DECEMBER 2020 (continued)
8 PROPERTY AND EQUIPMENT (continued)
INFLATION ADJUSTED HISTORICAL COST
COMPANY
2020ZWL
Freehold land and buildings
2019ZWL
Freehold land and buildings
2020ZWL
Freehold land and buildings
2019ZWL
Freehold land and buildings
Opening net book amount 5 388 710 8 467 977 162 454 255 285
Depreciation (3 079 290) (3 079 267) (92 831) (92 831)
Closing net book amount 2 309 420 5 388 710 69 623 162 454
Cost 9 237 803 9 237 803 278 493 278 493
Accumulated depreciation (6 928 383) (3 849 093) (208 870) (116 039)
Net book amount 2 309 420 5 388 710 69 623 162 454
All property and equipment are classified as non-current assets.
Fair value hierarchyThe following table shows an analysis of the fair values of land and buildings recognised in the statement of financial position by level of the fair value hierarchy:
Level 1ZWL
Level 2ZWL
Level 3ZWL
TotalZWL
Total gain/(loss) in the
period in other comprehensive
incomeZWL
31 December 2020
Freehold land and buildings - - 608 504 483 608 504 483 (7 444 669)
31 December 2019
Freehold land and buildings - - 306 524 454 306 524 454 104 867 740
Carrying amounts that would have been recognised if land and buildings were stated at cost are as follows:
INFLATION ADJUSTED HISTORICAL COST
Group2020ZWL
2019ZWL
2020ZWL
2019ZWL
Cost 4 201 283 39 848 179 2 681 045 2 982 018
Accumulated depreciation (623 746) (5 180 263) (398 043) (387 662)
Carrying amount 3 577 537 34 667 916 2 283 002 2 594 356
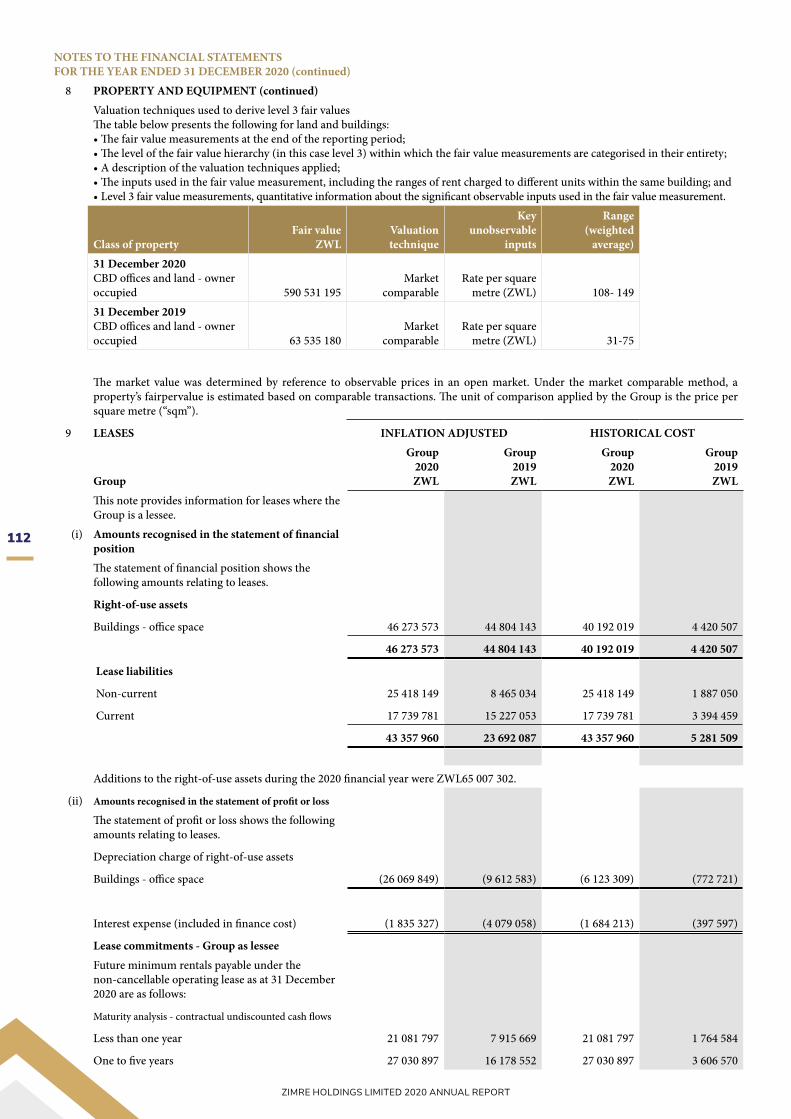
112
ZIMRE HOLDINGS LIMITED 2020 ANNUAL REPORT
NOTES TO THE FINANCIAL STATEMENTSFOR THE YEAR ENDED 31 DECEMBER 2020 (continued)
8 PROPERTY AND EQUIPMENT (continued)Valuation techniques used to derive level 3 fair valuesThe table below presents the following for land and buildings:• The fair value measurements at the end of the reporting period;• The level of the fair value hierarchy (in this case level 3) within which the fair value measurements are categorised in their entirety;• A description of the valuation techniques applied;• The inputs used in the fair value measurement, including the ranges of rent charged to different units within the same building; and• Level 3 fair value measurements, quantitative information about the significant observable inputs used in the fair value measurement.
Class of propertyFair value
ZWL Valuationtechnique
Key unobservable
inputs
Range(weighted
average)31 December 2020CBD offices and land - owner occupied 590 531 195
Marketcomparable
Rate per square metre (ZWL) 108- 149
31 December 2019CBD offices and land - owner occupied 63 535 180
Marketcomparable
Rate per square metre (ZWL) 31-75
The market value was determined by reference to observable prices in an open market. Under the market comparable method, a property’s fairpervalue is estimated based on comparable transactions. The unit of comparison applied by the Group is the price per square metre (“sqm”).
9 LEASES INFLATION ADJUSTED HISTORICAL COST
Group
Group2020 ZWL
Group 2019ZWL
Group2020 ZWL
Group2019ZWL
This note provides information for leases where the Group is a lessee.
(i) Amounts recognised in the statement of financial positionThe statement of financial position shows the following amounts relating to leases.
Right-of-use assets
Buildings - office space 46 273 573 44 804 143 40 192 019 4 420 507
46 273 573 44 804 143 40 192 019 4 420 507
Lease liabilities
Non-current 25 418 149 8 465 034 25 418 149 1 887 050
Current 17 739 781 15 227 053 17 739 781 3 394 459
43 357 960 23 692 087 43 357 960 5 281 509
Additions to the right-of-use assets during the 2020 financial year were ZWL65 007 302.
(ii) Amounts recognised in the statement of profit or loss
The statement of profit or loss shows the following amounts relating to leases.
Depreciation charge of right-of-use assets
Buildings - office space (26 069 849) (9 612 583) (6 123 309) (772 721)
Interest expense (included in finance cost) (1 835 327) (4 079 058) (1 684 213) (397 597)
Lease commitments - Group as lesseeFuture minimum rentals payable under the non-cancellable operating lease as at 31 December 2020 are as follows:
Maturity analysis - contractual undiscounted cash flows
Less than one year 21 081 797 7 915 669 21 081 797 1 764 584
One to five years 27 030 897 16 178 552 27 030 897 3 606 570

113
ZIMRE HOLDINGS LIMITED 2020 ANNUAL REPORT
NOTES TO THE FINANCIAL STATEMENTSFOR THE YEAR ENDED 31 DECEMBER 2020 (continued)
9 LEASES (continued)(ii) Amounts recognised in the statement of profit or loss (continued)
The Group has tested its right of use assets for impairment and has concluded that there is no indication that the right of use assets are impaired.No amounts were included in administrative expenses for low value or short term leases and variable lease payments not included inlease liabilities.The total cash outflow for leases in 2020 was ZWL8 749 289 (2019: ZWL11 364 680) being principal payments of ZWL6 730 267 (2019: ZWL7 285 622) and interest payments of ZWL2 019 022 (2019: ZWL4 079 058.)
Company
This note provides information for leases where company is lessee.
Company 2020ZWL
Company2019ZWL
Company2020ZWL
Company2019ZWL
(i) Amounts recognised in the statement of financial positionThe statement of financial position shows the following amounts relating to leases.
Right-of-use assets
Buildings - office space 8 218 290 29 766 693 2 136 735 1 068 315
Lease liabilities
Non-current - 1 449 548 - 323 138
Current 2 105 260 3 523 465 2 105 260 785 461
2 105 260 4 973 013 2 105 260 1 108 599
(ii) Amounts recognised in the statement of profit or loss The statement of profit or loss shows the following amounts relating to leases.
Depreciation charge of right-of-use assets
Buildings - office space (1 633 057) (7 325 658) (1 601 867) (262 915)
Interest expense (Included in finance cost) (361 294) (1 080 445) (210 180) (106 473)
Lease commitments - Group as lesseeFuture minimum rentals payable under the non-cancellableoperating lease as at 31 December 2020 are as follows:
Maturity analysis - contractual undiscounted cash flows
Less than one year 2 244 200 2 788 166 2 244 200 621 546
One to five years - 2 180 112 - 485 997
The Company has tested its right of use assets for impairment and has concluded that there is no indication that the right of use assets are impaired.No amounts were included in administrative expenses for low value or short term leases and variable lease payments not included in lease liabilities.The total cash outflow for leases in 2020 was ZWL3 229 047 (2019: ZWL3 159 654 being principal payments of ZWL2 867 753 (2019: ZWL2 079 254) and interest payments of ZWL361 294 (2019: ZWL1 080 400.)

114
ZIMRE HOLDINGS LIMITED 2020 ANNUAL REPORT
NOTES TO THE FINANCIAL STATEMENTSFOR THE YEAR ENDED 31 DECEMBER 2020 (continued)
9 LEASES (continued)The group’s leasing activities and how these are accounted for The Group leases office space. Rental contracts are typically made for varying fixed periods ranging from 5 to 10 years. For leases of real estate for which the Group is a lessee, it has elected not to separate lease and non-lease components and instead accounts for these as a single lease component. Lease terms are negotiated on an individual basis and contain a wide range of different terms and conditions. The lease agreements do not impose any covenants other than the security interests in the leased assets that are held by the lessor. Leased assets may not be used as security for borrowing purposes. Assets and liabilities arising from a lease are initially measured on a present value basis. Lease liabilities include the net present value of the following lease payments:• fixed payments (including in-substance fixed payments), less any lease incentives receivable;• variable lease payment that are based on an index or a rate, initially measured using the index or rate as at the commencement date;• amounts expected to be payable by the Group under residual value guarantees;• the exercise price of a purchase option if the Group is reasonably certain to exercise that option, and• payments of penalties for terminating the lease, if the lease term reflects the group exercising that option.Lease payments to be made under reasonably certain extension options are also included in the measurement of the liability. The lease payments are discounted using the interest rate implicit in the lease. If that rate cannot be readily determined, which is generally the case for leases in the Group, the lessee’s incremental borrowing rate is used, being the rate that the individual lessee would have to pay to borrow the funds necessary to obtain an asset of similar value to the right-of-use asset in a similar economic environment with similar terms, security and conditions.To determine the incremental borrowing rate, the Group:• where possible, the Group uses recent third-party financing received by the individual lessee as a starting point, adjusted to reflect
changes in financing conditions since third party financing was received and• makes adjustments specific to the lease, e.g. term, country, currency and security.Lease payments are allocated between principal and finance cost. The finance cost is charged to profit or loss over the lease periodso as to produce a constant periodic rate of interest on the remaining balance of the liability for each period. Right-of-use assets are measured at cost comprising the following:• the amount of the initial measurement of lease liability;• any lease payments made at or before the commencement date less any lease incentives received; and• any initial direct costs.
The Group carries right of use assets at cost. Refer to note 2.28.
The Group had no low value or short term leases as at reporting date.Right-of-use assets are generally depreciated over the shorter of the asset’s useful life and the lease term on a straight-line basis. If the Group is reasonably certain to exercise a purchase option, the right-of-use asset is depreciated over the underlying asset’s useful life. While the Group revalues its land and buildings that are presented within property, plant and equipment, it has chosen not to do so for the right-of-use buildings held by the Group.
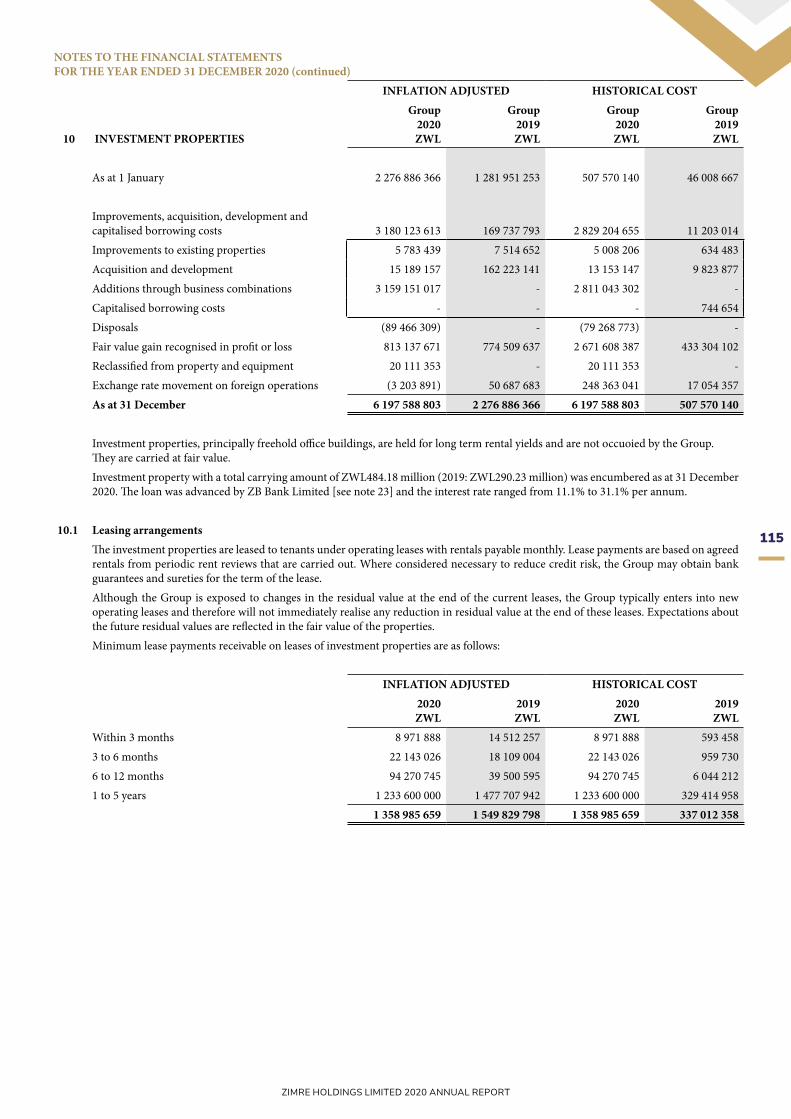
115
ZIMRE HOLDINGS LIMITED 2020 ANNUAL REPORT
NOTES TO THE FINANCIAL STATEMENTSFOR THE YEAR ENDED 31 DECEMBER 2020 (continued)
INFLATION ADJUSTED HISTORICAL COST
10 INVESTMENT PROPERTIES
Group2020ZWL
Group2019ZWL
Group2020ZWL
Group2019ZWL
As at 1 January 2 276 886 366 1 281 951 253 507 570 140 46 008 667
Improvements, acquisition, development and capitalised borrowing costs 3 180 123 613 169 737 793 2 829 204 655 11 203 014Improvements to existing properties 5 783 439 7 514 652 5 008 206 634 483Acquisition and development 15 189 157 162 223 141 13 153 147 9 823 877Additions through business combinations 3 159 151 017 - 2 811 043 302 - Capitalised borrowing costs - - - 744 654Disposals (89 466 309) - (79 268 773) - Fair value gain recognised in profit or loss 813 137 671 774 509 637 2 671 608 387 433 304 102Reclassified from property and equipment 20 111 353 - 20 111 353 - Exchange rate movement on foreign operations (3 203 891) 50 687 683 248 363 041 17 054 357As at 31 December 6 197 588 803 2 276 886 366 6 197 588 803 507 570 140
Investment properties, principally freehold office buildings, are held for long term rental yields and are not occuoied by the Group.They are carried at fair value.Investment property with a total carrying amount of ZWL484.18 million (2019: ZWL290.23 million) was encumbered as at 31 December 2020. The loan was advanced by ZB Bank Limited [see note 23] and the interest rate ranged from 11.1% to 31.1% per annum.
10.1 Leasing arrangementsThe investment properties are leased to tenants under operating leases with rentals payable monthly. Lease payments are based on agreed rentals from periodic rent reviews that are carried out. Where considered necessary to reduce credit risk, the Group may obtain bank guarantees and sureties for the term of the lease.Although the Group is exposed to changes in the residual value at the end of the current leases, the Group typically enters into new operating leases and therefore will not immediately realise any reduction in residual value at the end of these leases. Expectations about the future residual values are reflected in the fair value of the properties.Minimum lease payments receivable on leases of investment properties are as follows:
INFLATION ADJUSTED HISTORICAL COST2020ZWL
2019ZWL
2020ZWL
2019ZWL
Within 3 months 8 971 888 14 512 257 8 971 888 593 4583 to 6 months 22 143 026 18 109 004 22 143 026 959 7306 to 12 months 94 270 745 39 500 595 94 270 745 6 044 2121 to 5 years 1 233 600 000 1 477 707 942 1 233 600 000 329 414 958
1 358 985 659 1 549 829 798 1 358 985 659 337 012 358

116
ZIMRE HOLDINGS LIMITED 2020 ANNUAL REPORT
NOTES TO THE FINANCIAL STATEMENTSFOR THE YEAR ENDED 31 DECEMBER 2020 (continued)
10 INVESTMENT PROPERTIES (continued)10.2 Valuation of investment properties
Investment properties are stated at fair value, which is determined based on valuations performed by accredited independent propertyvaluers, as at 31 December 2020. In Zimbabwe, properties were valued by Knight Frank Zimbabwe and Bard Real Estate, industry specialists in valuing these types of investment properties. In Malawi and Mozambique the valuations were performed by SMN Property Professionals and Zambujo and Associados Consultores respectively. The fair values of the property have been determined using the income approach for developed commercial and industrial properties, and the market approach for residential properties and undeveloped land. Valuation models in accordance with those recommended by the International Valuation Standards Committee have been applied.The table below shows the geographical distribution of investment properties held by the Group:
Country in whichproperty is situated Class of property Valuation technique Carrying amount ZWL
2020 2019Zimbabwe CBD offices, retail, resi-
dential and landIncome capitalisation and market comparable 6 106 510 096 2 194 529 018
Malawi Residential property Market comparable 79 386 921 51 063 271Mozambique Residential property Market comparable 11 691 786 31 294 077
6 197 588 803 2 276 886 366
Valuation processThe market value was determined by reference to observable prices in an open market. Where there were no comparable prices, the market value was determined by capitalising achieved rentals using appropriate yield levels. The fair value of investment property is categorised as level 3 because of the significant unobservable inputs which were used.i) Income approachUnder the income capitalisation method, a property’s fair value is estimated based on the annualised net operating income generated bythe property, which is divided by the capitalisation rate (discounted by the investor’s rate of return). Under the income capitalisation method, over (above market rent) and under-rent situations are separately capitalised (discounted).ii) Market approach
.Under the market comparable method, a property’s fair value is estimated based on comparable transactions. The unit of comparisonapplied by the Group is the price per square metre.iii) Rent per square metreThe rent at which space could be let in the market conditions prevailing at the date of valuation. The unit of comparison is the rental rate per square metre.iv) Vacancy rateThe Group determines the vacancy rate which can be based on the percentage of estimated vacant space divided by the total lettable area.v) Prime yieldThe prime yield is defined as the internal rate of return of the cash flows from the property, assuming a rise to Estimated Rental Value (“ERV”) at the next review, but with no further rental growth.The rental rate yield represents the net income expected in year zero divided by the current property values (historical or trailing income yield). The risk arises when void levels in the portfolio increase. This increase will consequently result in a reduction in net incomes. Where net incomes remain constant, a reduction in the yield rates will result in increased property values.
10.3 Fair value hierarchyChanges recorded in the statement of profit or loss for recurring fair value measurements categorised within level 3 of the fair value hierarchy amount to ZWL814 790 817 (2019:ZWL774 509 637) and are presented in the statement of profit or loss line item “fair value adjustments on investment property”.All gains and losses recorded in statement of profit or loss for recurring fair value measurements categorised within level 3 of the fair value hierarchy are attributable to changes in unrealised gains or losses relating to investment properties held at the end of the reporting period.Valuation techniques used to derive level 3 fair valuesThe table below presents the following for each class of the investment properties:• The fair value measurements at the end of the reporting period;• A description of the valuation techniques applied;• The inputs used in the fair value measurement, including the ranges of rent charged to different units within the same building; and• Level 3 fair value measurements, quantitative information about the significant observable inputs used in the fair value measurement.
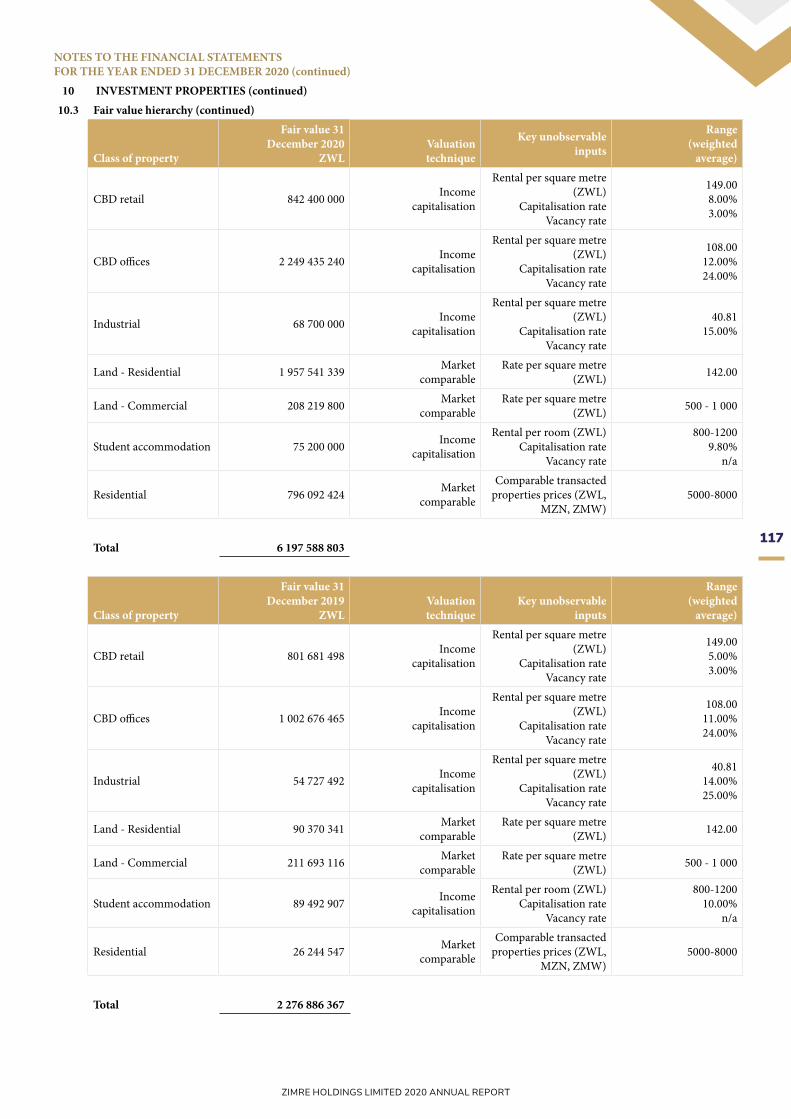
117
ZIMRE HOLDINGS LIMITED 2020 ANNUAL REPORT
NOTES TO THE FINANCIAL STATEMENTSFOR THE YEAR ENDED 31 DECEMBER 2020 (continued)
10 INVESTMENT PROPERTIES (continued)10.3 Fair value hierarchy (continued)
Class of property
Fair value 31December 2020
ZWL Valuationtechnique
Key unobservable inputs
Range(weighted
average)
CBD retail 842 400 000 Incomecapitalisation
Rental per square metre (ZWL)
Capitalisation rateVacancy rate
149.00 8.00%3.00%
CBD offices 2 249 435 240 Incomecapitalisation
Rental per square metre (ZWL)
Capitalisation rateVacancy rate
108.00 12.00%24.00%
Industrial 68 700 000 Incomecapitalisation
Rental per square metre (ZWL)
Capitalisation rateVacancy rate
40.81 15.00%
Land - Residential 1 957 541 339 Marketcomparable
Rate per square metre (ZWL) 142.00
Land - Commercial 208 219 800 Marketcomparable
Rate per square metre (ZWL) 500 - 1 000
Student accommodation 75 200 000 Incomecapitalisation
Rental per room (ZWL)Capitalisation rate
Vacancy rate
800-12009.80%
n/a
Residential 796 092 424 Marketcomparable
Comparable transactedproperties prices (ZWL,
MZN, ZMW)5000-8000
Total 6 197 588 803
Class of property
Fair value 31December 2019
ZWL Valuationtechnique
Key unobservable inputs
Range(weighted
average)
CBD retail 801 681 498 Incomecapitalisation
Rental per square metre (ZWL)
Capitalisation rateVacancy rate
149.00 5.00%3.00%
CBD offices 1 002 676 465 Incomecapitalisation
Rental per square metre (ZWL)
Capitalisation rateVacancy rate
108.00 11.00%24.00%
Industrial 54 727 492 Incomecapitalisation
Rental per square metre (ZWL)
Capitalisation rateVacancy rate
40.81 14.00%25.00%
Land - Residential 90 370 341 Marketcomparable
Rate per square metre (ZWL) 142.00
Land - Commercial 211 693 116 Marketcomparable
Rate per square metre (ZWL) 500 - 1 000
Student accommodation 89 492 907 Incomecapitalisation
Rental per room (ZWL)Capitalisation rate
Vacancy rate
800-120010.00%
n/a
Residential 26 244 547 Marketcomparable
Comparable transactedproperties prices (ZWL,
MZN, ZMW)5000-8000
Total 2 276 886 367
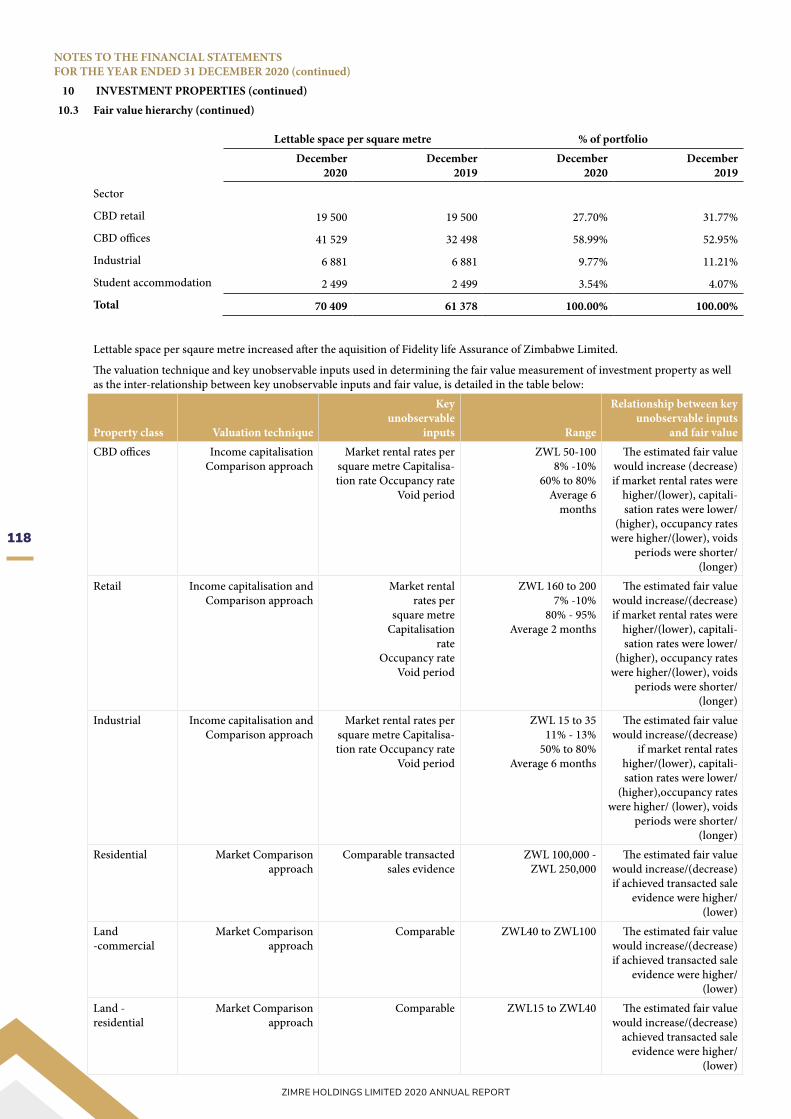
118
ZIMRE HOLDINGS LIMITED 2020 ANNUAL REPORT
NOTES TO THE FINANCIAL STATEMENTSFOR THE YEAR ENDED 31 DECEMBER 2020 (continued)
10 INVESTMENT PROPERTIES (continued)10.3 Fair value hierarchy (continued)
Lettable space per square metre % of portfolioDecember
2020December
2019December
2020December
2019
Sector
CBD retail 19 500 19 500 27.70% 31.77%
CBD offices 41 529 32 498 58.99% 52.95%
Industrial 6 881 6 881 9.77% 11.21%
Student accommodation 2 499 2 499 3.54% 4.07%
Total 70 409 61 378 100.00% 100.00%
Lettable space per sqaure metre increased after the aquisition of Fidelity life Assurance of Zimbabwe Limited.
The valuation technique and key unobservable inputs used in determining the fair value measurement of investment property as well as the inter-relationship between key unobservable inputs and fair value, is detailed in the table below:
Property class Valuation technique
Keyunobservable
inputs Range
Relationship between key unobservable inputs
and fair valueCBD offices Income capitalisation
Comparison approachMarket rental rates per
square metre Capitalisa-tion rate Occupancy rate
Void period
ZWL 50-1008% -10%
60% to 80%Average 6
months
The estimated fair value would increase (decrease) if market rental rates were
higher/(lower), capitali-sation rates were lower/
(higher), occupancy rates were higher/(lower), voids
periods were shorter/(longer)
Retail Income capitalisation andComparison approach
Market rentalrates per
square metreCapitalisation
rateOccupancy rate
Void period
ZWL 160 to 2007% -10%
80% - 95%Average 2 months
The estimated fair value would increase/(decrease) if market rental rates were
higher/(lower), capitali-sation rates were lower/
(higher), occupancy rates were higher/(lower), voids
periods were shorter/(longer)
Industrial Income capitalisation andComparison approach
Market rental rates persquare metre Capitalisa-tion rate Occupancy rate
Void period
ZWL 15 to 3511% - 13%
50% to 80%Average 6 months
The estimated fair value would increase/(decrease)
if market rental rates higher/(lower), capitali-sation rates were lower/
(higher),occupancy rates were higher/ (lower), voids
periods were shorter/(longer)
Residential Market Comparison approach
Comparable transactedsales evidence
ZWL 100,000 -ZWL 250,000
The estimated fair value would increase/(decrease) if achieved transacted sale
evidence were higher/(lower)
Land-commercial
Market Comparison approach
Comparable ZWL40 to ZWL100 The estimated fair value would increase/(decrease) if achieved transacted sale
evidence were higher/(lower)
Land -residential
Market Comparison approach
Comparable ZWL15 to ZWL40 The estimated fair value would increase/(decrease)
achieved transacted sale evidence were higher/
(lower)

119
ZIMRE HOLDINGS LIMITED 2020 ANNUAL REPORT
NOTES TO THE FINANCIAL STATEMENTSFOR THE YEAR ENDED 31 DECEMBER 2020 (continued)
10 INVESTMENT PROPERTIES (continued)10.3 Fair value hierarchy (continued)
Sensitivity analysis to significant changes in unobservable inputs within level 3 of the hierarchy.Significant increases/(decreases) in the comparable transacted properties and rental per square metre in isolation would result in asignificant higher/(lower) fair value measurement. Significant increases/(decreases) in the long-term vacancy rate and prime yield inisolation would result in a significant lower/(higher) fair value measurement.The annual rental income used in the valuation of the Zimbabwe properties, comprising 48% (2019:96%) of the entire portfolio was ZWL36 606 629 and the overall capitalisation rate was 7.6%. Increasing the capitalisation rate by 10% would decrease the fair value toZWL437 880 942. Reducing the capitalisation rate by 10% would increase the fair value to ZWL535 184 573.
Market prime yields
Sector Prime yield
Retail 7% - 8%
Office 8% - 10%
Industrial 10% - 12%
The impact of the factors listed below on fair value was as follows:
Void periods 2 - 5 years
Total occupancy rate 87%
Total vacancy rate 12.83%
INFLATION ADJUSTED HISTORICAL COST
11 INTANGIBLE ASSETS
Group2020ZWL
Group2019ZWL
Group2020ZWL
Group2019ZWL
Software (note 11.1) 64 529 844 3 982 428 55 626 081 339 892
Goodwill (note 11.2) 70 496 470 9 079 316 145 280 960 325 803
135 026 314 13 061 744 200 907 041 665 695
11.1 Software
Cost
As at 1 January 16 134 174 15 642 721 674 525 564 969
Additions 25 991 585 491 453 25 308 651 109 556
Acquisitions through business combinations 45 074 398 - 6 157 589 -
Revaluation - - 24 598 826 -
Foreign exchange movements 11 073 775 - 11 016 557 -
As at 31 December 98 273 932 16 134 174 67 756 148 674 525

120
ZIMRE HOLDINGS LIMITED 2020 ANNUAL REPORT
NOTES TO THE FINANCIAL STATEMENTSFOR THE YEAR ENDED 31 DECEMBER 2020 (continued)
INFLATION ADJUSTED HISTORICAL COST
11 INTANGIBLE ASSETS (continued)
Group2020ZWL
Group2019ZWL
Group2020ZWL
Group2019ZWL
11.1 Software (continued) Accumulated amortisation As at 1 January (12 151 746) (11 131 105) (334 633) (425 582) Charge for the year (1 978 409) (2 078 677) (819 336) (105 617)Acquisitions through business combinations (15 552 743) 0 (704 589) - Foreign exchange movements (4 061 190) 1 058 036 (10 271 509) 196 566
Balance as at 31 December (33 744 088) (12 151 746) (12 130 067) (334 633)
Carrying amount as at 31 December 64 529 844 3 982 428 55 626 081 339 892
All intangible assets are classified as non-current assets.
Sotware comprises computer software purchased from various vendors.
No impairment loss was recognised in respect of these assets (2019:ZWLnil)
11.2 Goodwill As at 1 January 9 079 316 9 079 316 325 803 325 803 Additions (note 36.5.2) 61 417 154 - 144 955 157 - As at 31 December 70 496 470 9 079 316 145 280 960 325 803
Goodwill is classified as a non-current asset.
An analysis of goodwill by principal cash generating unit (“CGU”) is as shown below:-Credit Insurance Company of Zimbabwe Limited 9 079 316 9 079 316 325 803 325 803Fidelity life Assurance of Zimbabwe Limited 61 417 154 - 144 955 157 -
70 496 470 9 079 316 145 280 960 325 803
The goodwill arose from the acquisition of control in Credit Insurance Zimbabwe Limited in 2017 and Fidelity life Assurance of Zimbabwe Limited (“FLA”) on 1 Decemember 2020. Due to the proximity of the acquisition date of the subsidiary to the year end, the difference between the book value of the acquired net assets and consideration payable has been provisionally recognised as goodwill. During 2021 the Group will determine the fair values of the identifiable assets acquired and liabilities assumed and make the necessary adjustments to the goodwill that has been recognised in these financial statements. IFRS 3 requires fair values of assets and liabilities acquired in a business combination to be finalised within 12 months of the acquisition date.
The Group tests whether goodwill has suffered any impairment on an annual basis. No impairment charge was required for the year (2019:ZWLnil). The recoverable amount of a cash generating unit (“CGU”) is determined based on value in use calculations. There were no value in use calculation for FLA due to the proximity of its acquisition date to the balance sheet date.
With regards to Credit Insurance of Zimbabwe Limited, the directors and management have considered and assessed reasonably possible changes for other key assumptions and have not identified any instances that could cause the carrying amount to exceed its recoverable amount.

121
ZIMRE HOLDINGS LIMITED 2020 ANNUAL REPORT
NOTES TO THE FINANCIAL STATEMENTSFOR THE YEAR ENDED 31 DECEMBER 2020 (continued)
INFLATION ADJUSTED HISTORICAL COST
12 INVESTMENT IN SUBSIDIARIES
Company2020ZWL
Company2019ZWL
Company2020ZWL
Company2019ZWL
As at 1 January 1 391 445 988 1 368 205 138 43 963 360 41 247 428Additions 818 212 294 23 240 850 812 512 631 2 715 932
2 209 658 282 1 391 445 988 856 475 991 43 963 360
Investments are all classified as non-current assets.The reporting date of all subsidiaries is 31 December.Financial information of subsidiaries that have material non-controlling interests is provided below.
12.1 Summary of non-controlling interest portion
Name of companyCountry of incorporation Nature of business 2020 2019 2020 2019
Zimre Property Investments Limited Zimbabwe Property 0% 36% 0% 36%Emeritus Resegguros, S.A. Mozambique Reinsurance 30% 30% 30% 30%Credit Insurance Zimbabwe Limited Zimbabwe General Insurance 9% 9% 9% 9%Fidelity Life Assurance of Zimbabwe Zimbabwe Life Assurance 33% - 33% -
2020ZWL
2019ZWL
2020ZWL
2019ZWL
Accumulated non-controlling interest balances
Zimre Property Investments Limited - 779 849 387 - 166 332 894
Emeritus Resegguros, S.A. 49 530 152 37 007 572 49 530 152 8 249 836
Credit Insurance of Zimbabwe Limited 14 105 660 13 569 196 11 749 741 2 959 917
Fidelity Life Assurance Zimbabwe 1 567 309 002 - 1 571 331 452 -
1 630 944 814 830 426 155 1 632 611 345 177 542 647
Profit/ (loss) allocated to material non-controlling interests
Zimre Property Investments Limited - 289 991 453 - 149 005 300
Emeritus Resegguros, S.A. 17 649 595 1 212 404 17 649 597 117 713
Credit Insurance Zimbabwe Limited (743 861) (4 951 861) 953 032 114 562
Fidelity Life Assurance Zimbabwe 1 492 346 - 9 654 894 -
18 398 080 286 251 996 28 257 523 149 237 575
Set out below is summarised financial information for each subsidiary that has non-controlling interests that are material to the Group.The amounts disclosed for each subsidiary are before inter-company eliminations.

122
ZIMRE HOLDINGS LIMITED 2020 ANNUAL REPORT
NO
TES
TO T
HE
FIN
AN
CIA
L ST
ATEM
ENTS
FOR
TH
E Y
EAR
EN
DED
31
DEC
EMBE
R 2
020
(con
tinue
d)12
INV
ESTM
ENT
IN S
UBS
IDIA
RIE
S (c
ontin
ued)
12.2
Sum
mar
ised
stat
emen
ts o
f pro
fit o
r los
s12
.2.1
Su
mm
aris
ed st
atem
ent o
f pro
fit o
r los
s for
202
0
INFL
ATIO
N A
DJU
STED
HIS
TOR
ICA
L C
OST
Fide
lity
Life
Ass
uran
ce o
fZi
mba
bwe
Lim
ited
ZWL
Emer
itus
Res
eggu
ros,
S.A
.ZW
L
Cre
dit
Insu
ranc
e of
Zim
babw
eLi
mite
dZW
LTo
tal
ZWL
Fide
lity
Life
Ass
uran
ce o
fZi
mba
bwe
Lim
ited
ZWL
Emer
itus
Res
eggu
ros,
S.A
.ZW
L
Cre
dit
Insu
ranc
e of
Zim
babw
eLi
mite
dZW
LTo
tal
ZWL
Gro
ss w
ritte
n pr
emiu
m 3
3 85
6 61
6 2
76 4
33 1
49 1
75 2
76 2
23 4
85 5
65 9
88 2
9 92
4 49
0 2
76 4
33 1
49 9
9 42
2 12
1 4
05 7
79 7
60
Tota
l inc
ome
45
900
500
201
113
611
79
538
905
326
553
016
38
684
072
201
113
611
45
693
374
285
491
057
Net
ben
efits
and
clai
ms
(8 4
42 6
82)
(46
086
703)
(11
424
299)
(65
953
684)
(7 8
51 6
66)
(46
086
703)
(8 3
89 4
62)
(62
327
831)
Com
miss
ion
and
acqu
isitio
n ex
pens
es(1
427
729
)(8
1 98
6 65
1)(3
3 31
2 07
3)(1
16 7
26 4
53)
(1 2
70 8
63)
(81
986
651)
(18
504
987)
(101
762
501
)
Ope
ratin
g an
d ad
min
istra
tion
expe
nses
(27
814
150)
(73
488
984)
(47
737
761)
(149
040
895
)(4
3 97
6 27
5)(7
3 48
8 98
4)(3
2 73
4 86
3)(1
50 2
00 1
22)
Tota
l cla
ims a
nd e
xpen
ses
(37
684
561)
(201
562
338
)(9
2 47
4 13
3)(3
31 7
21 0
32)
(53
098
805)
(201
562
338
)(5
9 62
9 31
3)(3
14 2
90 4
56)
Gro
ss ch
ange
in in
sura
nce
and
inve
stm
ent c
ontr
act
liabi
litie
s (4
8 88
8 10
0)-
-(4
8 88
8 10
0)(1
63 1
25 3
89)
--
(163
125
389
)
Ope
ratin
g lo
ss(4
0 67
2 16
1)(4
48 7
27)
(12
935
228)
(54
056
116)
(177
540
121
)(4
48 7
27)
(13
935
939)
(191
924
787
)
Oth
er g
ains
46
441
467
61
400
444
10
450
039
118
291
950
208
561
110
61
400
448
23
594
742
293
556
300
Profi
t/(lo
ss) b
efor
e in
com
e ta
x 5
769
306
60
951
717
(2 4
85 1
89)
64
235
834
31
020
989
60
951
722
9 6
58 8
04 1
01 6
31 5
15
Inco
me
tax
(exp
ense
)/cr
edit
(1 2
53 8
88)
(2 1
19 7
33)
(5 4
70 5
40)
(8 8
44 1
61)
(1 8
07 9
97)
(2 1
19 7
33)
534
056
(3 3
93 6
74)
Profi
t/(L
oss)
for t
he y
ear
4 5
15 4
18 5
8 83
1 98
4(7
955
729
) 5
5 39
1 67
3 2
9 21
2 99
2 5
8 83
1 98
8 1
0 19
2 85
9 9
8 23
7 83
9
12.2
.2
Sum
mar
ised
stat
emen
t of p
rofit
or l
oss f
or 2
019
INFL
ATIO
N A
DJU
STED
HIS
TOR
ICA
L C
OST
Zim
re P
rope
rty
Inve
stm
ents
Lim
ited
ZWL
Emer
itus
Res
eggu
ros,
S.A
.ZW
L
Cre
dit
Insu
ranc
eZi
mba
bwe
Lim
ited
ZWL
Tota
lZW
L
Zim
re P
rope
rty
Inve
stm
ents
Lim
ited
ZWL
Emer
itus
Res
eggu
ros,
S.A
.ZW
L
Cre
dit
Insu
ranc
eZi
mba
bwe
Lim
ited
ZWL
Tota
lZW
L
Gro
ss w
ritte
n pr
emiu
m-
479
272
030
134
008
467
613
280
497
- 4
6 53
2 71
5 1
5 89
2 63
4 6
2 42
5 34
9
Tota
l inc
ome
187
759
600
312
414
384
69
045
584
569
219
568
16
565
777
30
332
439
7 4
88 7
13 5
4 38
6 92
9
Net
ben
efits
and
clai
ms
-(7
7 10
4 97
9)(8
624
690
)(8
5 72
9 66
9)-
(7 4
86 1
54)
(650
428
)(8
136
582
)
Com
miss
ion
and
acqu
isitio
n ex
pens
es-
(122
661
100
)(2
9 71
2 81
8)(1
52 3
73 9
18)
-(1
1 90
9 21
6)(3
386
593
)(1
5 29
5 80
9)
Ope
ratin
g an
d ad
min
istra
tion
expe
nses
(155
099
692
)(1
32 9
77 6
29)
(30
625
493)
(318
702
814
)(1
2 22
0 39
3)(1
2 91
0 85
2)(3
388
362
)(2
8 51
9 60
7)
Tota
l cla
ims a
nd e
xpen
ses
(155
099
692
)(3
32 7
43 7
08)
(68
963
001)
(556
806
401
)(1
2 22
0 39
3)(3
2 30
6 22
1)(7
425
383
)(5
1 95
1 99
7)
Ope
ratin
g pr
ofit/(
loss
) 3
2 65
9 90
8(2
0 32
9 32
4) 8
2 58
3 1
2 41
3 16
7 4
345
384
(1 9
73 7
82)
63
330
2 4
34 9
32
Oth
er g
ains
/(lo
sses
) 8
72 7
12 3
30 3
7 07
6 69
0(3
5 59
9 82
3) 8
74 1
89 1
97 4
40 3
77 7
99 3
599
791
1 2
40 1
07 4
45 2
17 6
97
Profi
t/(lo
ss) b
efor
e in
com
e ta
x 9
05 3
72 2
38 1
6 74
7 36
6(3
5 51
7 24
0) 8
86 6
02 3
64 4
44 7
23 1
83 1
626
009
1 3
03 4
37 4
47 6
52 6
27
Inco
me
tax
expe
nse
(91
931
978)
(12
706
019)
(17
443
837)
(122
081
834
)(2
6 75
6 00
0)(1
233
633
)(7
8 17
6)(2
8 06
7 80
8)
Profi
t/(L
oss)
for t
he y
ear
813
440
260
4 0
41 3
47(5
2 96
1 07
7) 7
64 5
20 5
30 4
17 9
67 1
83 3
92 3
76 1
225
261
419
584
819

123
ZIMRE HOLDINGS LIMITED 2020 ANNUAL REPORT
NO
TES
TO T
HE
FIN
AN
CIA
L ST
ATEM
ENTS
FOR
TH
E Y
EAR
EN
DED
31
DEC
EMBE
R 2
020
(con
tinue
d)12
INV
ESTM
ENT
IN S
UBS
IDIA
RIE
S (c
ontin
ued)
INFL
ATIO
N A
DJU
STED
HIS
TOR
ICA
L C
OST
12.3
Sum
mar
ised
stat
emen
ts o
ffin
anci
al p
ositi
on
31 D
ecem
ber 2
020
Fide
lity
Life
Ass
uran
ceZi
mba
bwe
ZWL
Emer
itus
Res
eggu
ros S
AZW
L
Cre
dit
Insu
ranc
eZi
mba
bwe
Lim
ited
ZWL
Tota
lZW
L
Fide
lity
Life
Ass
uran
ceZi
mba
bwe
ZWL
Emer
itus
Res
eggu
ros S
AZW
L
Cre
dit
Insu
ranc
eZi
mba
bwe
Lim
ited
ZWL
Tota
lZW
L
Ass
ets
Prop
erty
and
equ
ipm
ent
382
062
711
96
978
508
128
492
348
607
533
567
358
855
767
96
978
508
120
739
272
576
573
547
Inve
stm
ent p
rope
rtie
s 3
117
751
896
11
691
785
- 3
129
443
680
3 1
17 7
51 8
96 1
1 69
1 78
5-
3 1
29 4
43 6
81
Inta
ngib
le a
sset
s 5
9 53
8 42
8 2
32 5
85 1
822
459
61
593
472
52
865
344
232
585
948
740
54
046
669
Fina
ncia
l ass
ets:
-
- at a
mor
tised
cost
316
923
519
9 2
79 8
64 1
109
404
327
312
788
316
923
519
9 2
79 8
64 1
109
404
327
312
787
- at f
air v
alue
thro
ugh
profi
t-
or lo
ss 6
62 7
45 8
99 3
6 51
2 42
9 5
674
468
704
932
796
662
745
899
36
512
429
5 6
74 4
67 7
04 9
32 7
95
- at f
air v
alue
thro
ugh
othe
r-
com
preh
ensiv
e in
com
e-
93
057
487
- 9
3 05
7 48
7-
93
057
487
- 9
3 05
7 48
7
Trad
e an
d ot
her r
ecei
vabl
es 2
94 1
19 2
68 1
86 3
79 0
49 4
8 06
6 68
8 5
28 5
65 0
04 2
93 0
17 7
45 1
86 3
79 0
49 4
8 01
7 49
0 5
27 4
14 2
84
Inve
ntor
ies
60
345
478
--
60
345
478
2 1
22 2
57-
- 2
122
257
Cur
rent
tax
rece
ivab
le-
47
171
446
161
493
47
332
939
- 4
7 17
1 44
6 1
61 4
93 4
7 33
2 93
9
Def
erre
d ac
quisi
tion
cost
s-
14
988
248
1 7
56 7
85 1
6 74
5 03
3-
14
988
248
1 6
81 6
85 1
6 66
9 93
3
Cas
h an
d ca
sh e
quiv
alen
ts 5
50 5
57 2
40 1
9 91
5 24
2 2
6 35
8 23
7 5
96 8
30 7
19 5
50 5
57 2
40 1
9 91
5 24
2 2
0 16
8 88
7 5
90 6
41 3
69
Tota
l ass
ets
5 4
44 0
44 4
39 5
16 2
06 6
43 2
13 4
41 8
82 6
173
692
963
5 3
54 8
39 6
67 5
16 2
06 6
43 1
98 5
01 4
38 6
069
547
748
Tota
l equ
ity 4
742
236
012
165
100
508
150
862
675
5 0
58 1
99 1
95 4
754
406
815
165
100
508
125
665
682
5 0
45 1
73 0
05
Liab
ilitie
s
Def
erre
d ta
x lia
bilit
ies
155
911
903
5 9
69 4
86 1
1 01
9 75
6 1
72 9
01 1
45 4
5 10
5 40
5 5
969
486
4 5
91 3
67 5
5 66
6 25
8
Trad
e an
d ot
her p
ayab
les
513
432
233
153
973
312
47
110
053
714
515
598
522
863
155
153
973
312
47
110
053
723
946
520
Borr
owin
gs 3
2 46
4 29
1 3
6 02
5 62
0-
68
489
911
32
464
291
36
025
620
- 6
8 48
9 91
1
Insu
ranc
e an
d ot
her p
rovi
sions
- 1
55 1
37 7
17 4
449
398
159
587
115
- 1
55 1
37 7
17 2
1 13
4 33
6 1
76 2
72 0
53
Tota
l lia
bilit
ies
701
808
427
351
106
135
62
579
207
1 1
15 4
93 7
69 6
00 4
32 8
51 3
51 1
06 1
35 7
2 83
5 75
6 1
024
374
742
Tota
l equ
ity a
nd li
abili
ties
5 4
44 0
44 4
39 5
16 2
06 6
43 2
13 4
41 8
82 6
173
692
964
5 3
54 8
39 6
66 5
16 2
06 6
43 1
98 5
01 4
38 6
069
547
748

124
ZIMRE HOLDINGS LIMITED 2020 ANNUAL REPORT
NO
TES
TO T
HE
FIN
AN
CIA
L ST
ATEM
ENTS
FOR
TH
E Y
EAR
EN
DED
31
DEC
EMBE
R 2
020
(con
tinue
d)
12IN
VES
TMEN
T IN
SU
BSID
IAR
IES
(con
tinue
d)
INFL
ATIO
N A
DJU
STED
HIS
TOR
ICA
L C
OST
12.3
Sum
mar
ised
stat
emen
ts o
ffin
anci
al p
ositi
onFi
delit
y Li
feA
ssur
ance
Zim
babw
eZW
L
Emer
itus
Res
eggu
ros S
AZW
L
Cre
dit
Insu
ranc
eZi
mba
bwe
Lim
ited
ZWL
Tota
lZW
L
Fide
lity
Life
Ass
uran
ceZi
mba
bwe
ZWL
Emer
itus
Res
eggu
ros S
AZW
L
Cre
dit
Insu
ranc
eZi
mba
bwe
Lim
ited
ZWL
Tota
lZW
L
31 D
ecem
ber 2
019
Ass
ets
Prop
erty
and
equ
ipm
ent
35
274
619
85
557
363
140
100
036
260
932
018
1 8
56 8
79 1
9 07
2 69
7 3
0 12
2 46
2 5
1 05
2 03
8
Inve
stm
ent p
rope
rtie
s 2
194
529
018
31
294
076
- 2
225
823
094
489
210
800
6 9
76 1
67-
496
186
967
Inta
ngib
le a
sset
s-
423
196
89
929
513
125
- 9
4 34
0 3
139
97
479
Def
erre
d ta
x as
sets
- 9
31 4
91-
931
491
- 2
07 6
51-
207
651
Fina
ncia
l ass
ets:
- at a
mor
tised
cost
3 3
69 7
03 1
7 94
6 83
0 3
062
579
24
379
112
751
184
4 0
00 7
60 6
82 7
19 5
434
663
- at f
air v
alue
thro
ugh
profi
t
or lo
ss 1
253
716
51
906
339
11
683
649
64
843
704
279
482
11
571
112
2 6
04 5
53 1
4 45
5 14
7
- at f
air v
alue
thro
ugh
othe
r
com
preh
ensiv
e in
com
e-
63
192
307
- 6
3 19
2 30
7-
14
087
013
- 1
4 08
7 01
3
Cur
rent
inco
me
tax
37
114
852
163
609
696
38
315
483
239
040
031
7 6
94 5
52 3
6 47
2 35
0 8
527
980
52
694
882
Trad
e an
d ot
her r
ecei
vabl
es 8
2 34
9 41
8-
- 8
2 34
9 41
8 2
483
642
--
2 4
83 6
42
Inve
ntor
ies
- 5
1 72
2 34
9 7
24 4
34 5
2 44
6 78
3-
11
530
097
161
493
11
691
590
Def
erre
d ac
quisi
tion
cost
s-
7 7
58 5
44 8
96 9
96 8
655
540
- 1
729
557
117
892
1 8
47 4
49
Cas
h an
d ca
sh e
quiv
alen
ts 4
183
258
19
056
937
11
348
252
34
588
447
932
544
4 2
48 2
28 2
529
785
7 7
10 5
57
Tota
l ass
ets
2 3
58 0
74 5
84 4
93 3
99 1
28 2
06 2
21 3
58 3
057
695
070
503
209
083
109
989
972
44
750
023
657
949
078
Tota
l equ
ity 2
187
515
813
123
358
533
145
125
090
2 4
55 9
99 4
36 4
66 5
71 9
33 2
7 49
9 44
5 3
1 65
6 86
6 5
25 7
28 2
44
Liab
ilitie
s
Def
erre
d ta
x lia
bilit
ies
124
125
796
- 4
791
064
128
916
860
26
286
176
- 8
39 8
70 2
7 12
6 04
6
Trad
e an
d ot
her p
ayab
les
19
767
309
204
402
194
36
345
847
260
515
350
4 4
06 5
86 4
5 56
5 93
2 8
102
322
58
074
840
Borr
owin
gs 2
6 43
1 51
8 3
8 41
0 99
9-
64
842
517
5 8
92 1
91 8
562
692
- 1
4 45
4 88
3
Insu
ranc
e an
d ot
her p
rovi
sions
234
148
127
227
402
19
959
357
147
420
907
52
197
28
361
903
4 1
50 9
65 3
2 56
5 06
5
Tota
l lia
bilit
ies
170
558
771
370
040
595
61
096
268
601
695
634
36
637
150
82
490
527
13
093
157
132
220
834
Tota
l equ
ity a
nd li
abili
ties
2 3
58 0
74 5
84 4
93 3
99 1
28 2
06 2
21 3
58 3
057
695
070
503
209
083
109
989
972
44
750
023
657
949
078

125
ZIMRE HOLDINGS LIMITED 2020 ANNUAL REPORT
NO
TES
TO T
HE
FIN
AN
CIA
L ST
ATEM
ENTS
FOR
TH
E Y
EAR
EN
DED
31
DEC
EMBE
R 2
020
(con
tinue
d)12
INV
ESTM
ENT
IN S
UBS
IDIA
RIES
(con
tinue
d)
INFL
ATIO
N A
DJU
STED
HIS
TOR
ICA
L C
OST
12.4
12.4
.1
Sum
mar
ised
stat
emen
ts o
f cas
h flo
ws
For t
he y
ear e
nded
31
Dec
embe
r 202
0
Fide
lity
Life
Ass
uran
ceZi
mba
bwe
ZWL
Emer
itus
Res
eggu
ros,
S.A
.ZW
L
Cre
dit
Insu
ranc
eZi
mba
bwe
Lim
ited
ZWL
Tota
lZW
L
Fide
lity
Life
Ass
uran
ceZi
mba
bwe
ZWL
Emer
itus
Res
eggu
ros,
S.A
.ZW
L
Cre
dit
Insu
ranc
eZi
mba
bwe
Lim
ited
ZWL
Tota
lZW
L
Cas
h flo
ws f
rom
ope
ratin
g ac
tiviti
es 1
22 9
08 9
40 7
78 7
88 8
439
799
132
127
527
38
489
570
778
788
2 7
31 1
01 4
1 99
9 45
9
Cas
h flo
ws f
rom
inve
stin
g ac
tiviti
es 1
19 0
44 8
04(1
650
450
)(8
696
362
) 1
08 6
97 9
92 1
54 0
45 0
81(1
650
450
)(2
414
913
) 1
49 9
79 7
18
Cas
h flo
ws f
rom
fina
ncin
g ac
tiviti
es(2
3 92
9 51
9)(6
10 6
43)
407
516
(24
132
646)
(16
294
860)
(610
643
) 2
97 6
71(1
6 60
7 83
2)
Net
incr
ease
/(de
crea
se) i
n ca
sh a
nd c
ash
equi
vale
nts
218
024
225
(1 4
82 3
05)
150
953
216
692
873
176
239
791
(1 4
82 3
05)
613
859
175
371
345
12.4
.2
For t
he y
ear e
nded
31
Dec
embe
r 201
9
Cas
h flo
ws f
rom
ope
ratin
g ac
tiviti
es(1
12 9
25 9
08)
3 4
93 5
32 3
7 85
9 71
9(7
1 57
2 65
7) 3
901
635
778
788
2 7
31 1
01 7
411
524
Cas
h flo
ws f
rom
inve
stin
g ac
tiviti
es 1
19 0
44 8
04(7
403
679
)(3
9 01
0 62
7) 7
2 63
0 49
8(2
6 08
5 84
1)(1
650
450
)(2
414
913
)(3
0 15
1 20
4)
Cas
h flo
ws f
rom
fina
ncin
g ac
tiviti
es(2
3 92
9 51
9)(2
739
257
) 1
828
059
(24
840
717)
(6 9
23 4
76)
(610
643
) 2
97 6
71(7
236
448
)
Net
incr
ease
/(de
crea
se) i
n ca
sh a
nd c
ash
equi
vale
nts
(17
810
623)
(6 6
49 4
04)
677
151
(23
782
876)
(29
107
682)
(1 4
82 3
05)
613
859
(29
976
128)

126
ZIMRE HOLDINGS LIMITED 2020 ANNUAL REPORT
NOTES TO THE FINANCIAL STATEMENTSFOR THE YEAR ENDED 31 DECEMBER 2020 (continued)
13 INVESTMENTS IN ASSOCIATESFollowing an assessment carried out on 30 June 2020, the investment in CFI Holdings Limited, which was fully impaired in 2016, was re-recognised as an associate. Furthermore, following the purchase of a contolling stake in FLA by ZHL, the investment in FLA was reclassified to investment in subsidiary. As a result, the carrying amount of the investment in associates changed as follows :
INFLATION ADJUSTED HISTORICAL COSTGroup 2 020ZWL
Group 2 019ZWL
Group 2 020ZWL
Group 2 019ZWL
As at 1 January 155 538 660 63 126 952 26 042 624 5 352 764
Write back of investment in CFI 766 549 180 - 59 853 361 -
Share of profit for the year 98 051 834 20 384 899 121 600 187 3 648 161
Share of other comprehensive income of associates 3 693 418 72 026 809 482 915 734 17 041 699
Additions 7 576 528 - 7 576 528 -
Fair value on remeasurement of associate 51 113 672 - 19 177 952 -
Other equity changes 42 186 972 - 42 988 306 -
Reclassification to investment subsidiaries (146 889 468) - (66 178 546) -
As at 31 December 977 820 796 155 538 660 693 976 146 26 042 624
Company 2 020ZWL
Company 2 019ZWL
Company 2 020ZWL
Company 2 019ZWL
Investments in associates at cost:
CFI Holdings Limited 19 558 694 19 558 694 589 639 589 639
Fidelity Life Assurance Limited - 4 993 183 - 150 530
United General Insurance Limited 3 051 701 3 051 701 92 398 92 398Special Automobile Underwriters Association ofZimbabwe (“SAUZ”) 1 047 559 1 047 559 31 182 31 182
As at 31 December 23 657 957 28 651 137 713 219 863 749
Investments in associates are all classified as non-current assets.
13.1 Details of the Group’s associates are as follows:Set out below are the associates of the Group as at 31 December. The entities listed below have share capital consisting solely of ordinary shares, which are held directly by the Group. The country of incorporation or registration is also their principal place of business, and the proportion of owership interest is the same as the proportion of voting rights held.
Name of entity Published activity
Country ofincorporation
principal placeof business
Proportion ofownership
interest heldas at 31
December2020
Proportion ofownership
interest heldas at 31
December2019
CFI Holdings Limited* * Agro-retail Zimbabwe 41.08% 41.08%
Fidelity Life Assurance Limited* Life insurance Zimbabwe 0.00% 20.57%
United General Insurance Limited General insurance Malawi 20.00% 20.00%
Special Automobile Underwriters Association of
Zimbabwe (“SAUZ”) General insurance Zimbabwe 20.00% 20.00%
* Fidelity Life Assurance Limited changed to subsidiary following the acquisition of additional interest of 35.09%.* *The associate is listed on the Zimbabwe Stock Exchange but is suspended from trading.

127
ZIMRE HOLDINGS LIMITED 2020 ANNUAL REPORT
NOTES TO THE FINANCIAL STATEMENTSFOR THE YEAR ENDED 31 DECEMBER 2020 (continued)
13 INVESTMENTS IN ASSOCIATES (continued)13.1 Details of the Group’s associates are as follows (continued)
The reporting dates of the associates is 31 December, except for CFI Holdings Limited whose reporting date is 30 September. The financial statements taken into account for that associate are for the year ended 30 September 2020.
The difference between the associate and the Holding Company’s year end is within the maximum three months period allowed by IFR10, “consolidated financial statements”.
Management has determined that there were no significant transactions to take into account for the period 1 October 2020 to 31 December 2020 in respect of the associate.
INFLATION ADJUSTED HISTORICAL COSTThe quoted values of the listed associates were as followsas at 31 December
2020ZWL
2019ZWL
2020ZWL
2019ZWL
Fidelity Life Assurance Limited - 8 563 570 - 1 909 016
*CFI Holdings Limited was suspended from trading on the Zimbabwe Stock Exchange (“ZSE”) in January 2018 due to non-compliance with the ZSE Listing Requirements.
13.2 Summarised financial information of associates
INFLATION ADJUSTED
As at 31 December 2020
CFI HoldingsLimited
ZWL
UnitedGeneral
InsuranceLimited
ZWL
SpecialAutomobile
UnderwritersAssociation of
ZimbabweZWL
TotalZWL
Statements of financial position
Current assets 1 819 083 226 974 814 965 32 173 889 2 826 072 080
Non-current assets 1 572 337 690 294 452 971 35 713 176 1 902 503 837
Current liabilities (982 111 263) (644 159 449) (27 294 070) (1 653 564 782)
Non-current liabilities (339 397 634) (39 693 461) 11 496 671 (367 594 424)
Net assets 2 069 912 019 585 415 026 52 089 666 2 707 416 712
Statements of comprehensive income
Revenue 3 435 193 971 126 289 732 3 740 043 3 565 223 745
Profit for the year 218 130 588 (3 654 135) 39 566 155 254 042 608
Other comprehensive income for the year 4 547 457 337 739 - 4 885 196
Total comprehensive income for the year 222 678 045 (3 316 396) 39 566 155 258 927 804
Reconciliation of carrying amounts
Net assets
As at 1 January 1 102 217 069 151 849 829 6 925 074 1 965 498 248
Profit for the year 218 130 588 (3 654 135) 39 566 155 254 042 608
Other comprehensive income for the year 4 547 457 337 739 - 4 885 196
Other equity changes 745 016 905 436 881 594 5 598 437 482 990 660
As at 31 December 2 069 912 019 585 415 027 52 089 666 2 707 416 712
Group’s share in % 41.08% 20.00% 20.00%
Group’s effective share in ZWL 850 319 857 117 083 005 10 417 933 977 820 796

128
ZIMRE HOLDINGS LIMITED 2020 ANNUAL REPORT
NOTES TO THE FINANCIAL STATEMENTSFOR THE YEAR ENDED 31 DECEMBER 2020 (continued)
13 INVESTMENTS IN ASSOCIATES (continued)13.2 Summarised financial information of associates (continued)
INFLATION ADJUSTED
As at 31 December 2019
CFI HoldingsLimited
ZWL
Fidelity LifeAssurance
LimitedZWL
UnitedGeneral
InsuranceLimited
ZWL
SpecialAutomobile
UnderwritersAssociation of
ZimbabweZWL
TotalZWL
Statements of financial position
Current assets 1 094 890 935 1 024 208 694 320 289 280 43 292 394 2 482 681 303
Non-current assets 775 865 550 3 602 629 323 95 348 844 2 394 451 4 476 238 168
Current liabilities (424 460 698) (3 821 240 414) (263 788 295) (38 752 372) (4 548 241 779)
Non-current liabilities (344 078 718) (101 091 327) - (9 399) (445 179 444)
Net assets 1 102 217 069 704 506 276 151 849 829 6 925 074 1 965 498 248
Statements of comprehensive income
Revenue 1 557 419 017 2 259 284 860 778 066 889 55 832 696 4 650 603 462
Profit for the year 139 329 106 332 428 776 19 306 360 5 555 377 496 619 619
Other comprehensive income for the year 8 382 965 123 324 273 1 693 600 - 133 400 838Total comprehensive income/(loss) for the year 147 712 071 455 753 049 20 999 960 5 555 377 630 020 457
Reconciliation of carrying amounts
Net assets
As at 1 January 604 071 776 245 425 862 72 315 674 9 806 601 931 619 913
Profit for the year 139 329 106 332 428 776 19 306 360 5 555 377 496 619 619Other comprehensive income for the year 8 382 965 123 324 273 1 693 600 - 133 400 838
As at 31 December 751 783 847 701 178 911 93 315 634 15 361 978 1 561 640 370
Group’s share in % 41.08% 20.57% 20.00% 20.00%
Group’s effective share in ZWL - 133 803 139 18 663 127 3 072 395 155 538 660

129
ZIMRE HOLDINGS LIMITED 2020 ANNUAL REPORT
NOTES TO THE FINANCIAL STATEMENTSFOR THE YEAR ENDED 31 DECEMBER 2020 (continued)
13 INVESTMENTS IN ASSOCIATES (continued)13.2 Summarised financial information of associates (continued)
HISTORICAL COST
CFI HoldingsLimited
ZWL
Fidelity LifeAssurance
LimitedZWL
GeneralInsurance
LimitedZWL
SpecialAutomobile
UnderwritersAssociation of
ZimbabweZWL
TotalZWL
As at 31 December 2019
Statements of financial position
Current assets 134 980 271 216 361 616 71 399 819 4 196 029 426 937 735
Non-current assets 173 414 362 797 129 972 21 255 442 232 077 992 031 853
Current liabilities (94 624 041) (851 831 857) (58 804 454) (3 755 996) (1 009 016 348)
Non-current liabilities (68 071 076) (22 038 849) - (911) (90 110 836)
Net assets 145 699 516 139 620 882 33 850 807 671 199 319 842 404
HISTORICAL COST
As at 31 December 2020
CFI HoldingsLimited
ZWL
GeneralInsurance
LimitedZWL
SpecialAutomobile
UnderwritersAssociation of
ZimbabweZWL
TotalZWL
Statements of financial position
Current assets 1 216 896 378 675 060 546 20 531 739 1 912 488 663
Non-current assets 1 571 893 311 294 452 971 22 790 332 1 889 136 614
Current liabilities (982 111 263) (644 159 449) (17 417 687) (1 643 688 399)
Non-current liabilities (269 036 435) (39 693 461) (911) (308 730 807)
1 537 641 991 285 660 607 25 903 473 1 849 206 071
Statements of comprehensive income
Revenue 1 920 324 644 126 289 732 2 386 705 2 049 001 081
(Loss)/profit for the year 275 519 286 (3 654 135) 25 249 107 297 114 258
Other comprehensive income for the year 1 125 320 691 337 739 - 1 125 658 430
Total comprehensive (loss)/income for the year 1 400 839 977 (3 316 396) 25 249 107 1 422 772 688
Reconciliation of carrying amount
Net Assets
As at 1 January 2020 145 699 516 33 850 807 671 199 180 221 522
(Loss)/profit for the year 275 519 286 (3 654 135) 25 249 107 297 114 258
Other comprehensive income for the year 1 125 320 691 337 739 - 1 125 658 430
Other equity changes (8 897 502) 255 126 196 (16 833) 246 211 861
As at 31 December 2020 1 537 641 991 285 660 607 25 903 473 1 849 206 071
Group’s share in % 41.08% 20.00% 20.00%
Group’s effective share in ZWL 631 663 330 57 132 121 5 180 695 693 976 146

130
ZIMRE HOLDINGS LIMITED 2020 ANNUAL REPORT
NOTES TO THE FINANCIAL STATEMENTSFOR THE YEAR ENDED 31 DECEMBER 2020 (continued)
13 INVESTMENTS IN ASSOCIATES (continued)13.2 Summarised financial information of associates (continued)
HISTORICAL COST
As at 31 December 2019
CFI HoldingsLimited
ZWL
Fidelity LifeAssurance
LimitedZWL
GeneralInsurance
LimitedZWL
SpecialAutomobile
UnderwritersAssociation of
ZimbabweZWL
TotalZWL
Statements of comprehensive income
Revenue 176 822 323 675 314 644 75 538 721 5 482 727 933 158 415
Profit/(loss) for the year (12 170 040) 94 249 127 1 459 900 420 084 83 959 071Other comprehensive income for the year - 36 444 172 128 067 - 36 572 239Total comprehensive income/(loss) for the year (12 170 040) 130 693 299 1 587 967 420 084 120 531 310
Reconciliation of carrying amounts
Net Assets
As at 1 January 2019 46 937 338 8 927 585 15 197 222 1 347 484 72 409 629
Profit/(loss) for the year (12 170 040) 94 249 129 1 459 900 420 084 83 959 073Other comprehensive income for the year - 36 444 169 128 066 - 36 572 235
As at 31 December 2019 34 767 298 139 620 883 16 785 188 1 767 568 192 940 937
Group’s share in % 28.13% 20.57% 20.00% 20.00%
Group’s share in ZWL - 21 828 517 3 860 593 353 514 26 042 624

131
ZIMRE HOLDINGS LIMITED 2020 ANNUAL REPORT
NOTES TO THE FINANCIAL STATEMENTSFOR THE YEAR ENDED 31 DECEMBER 2020 (continued)
INFLATION ADJUSTED HISTORICAL COST
14 TAXES
Group2020ZWL
Group2019ZWL
Group2020ZWL
Group2019ZWL
14.1 Deferred taxThe analysis of deferred tax assets and deferred tax liabilities is as follows:Deferred tax asset:Deferred tax assets to be recovered after more than 12 months - - - - Deferred tax assets to be recovered within 12 months 86 264 671 71 405 123 79 871 904 14 382 180
86 264 671 71 405 123 79 871 904 14 382 180
Deferred tax liabilities:Deferred tax liabilities to be settled after more than 12 months (239 594 597) (57 410 765) (192 647 632) (5 393 357)Deferred tax liabilities to be recovered within 12 months - - - -
(239 594 597) (57 410 765) (192 647 632) (5 393 357)
Deferred tax (liabilities)/assets (153 329 926) 13 994 358 (112 775 728) 8 988 823
The movement on the deferred tax account is as shown below:As at 1 January 13 994 358 20 806 412 8 988 824 1 066 338(Charged)/credited in profit or loss (29 620 774) (60 965 416) (67 429 319) 13 014 776Credited/(charged) in other comprehensive income 1 146 308 (20 404 305) (7 173 418) (5 878 277)Foreign exchange movements (138 849 818) 74 557 667 (47 161 815) 785 987As at 31 December (153 329 926) 13 994 358 (112 775 728) 8 988 824
14.1.2 Sources of deferred taxProperty, plant and equipment (75 028 247) (37 211 154) (80 974 292) (7 435 736)Investment properties (157 817 189) (126 533 736) (148 718 231) (26 825 681)Intangible assets (345 963) (709 359) (69 468) (20 787)Financial assets at fair value through other compre-hensive income 137 322 (21 022 345) 1 081 241 (3 054 928)Trade and other receivables (44 621 825) (26 483 697) - (5 667 670)Trade and other payables 66 926 907 55 073 278 66 926 907 11 786 012Short term investments in equity (99 113) (127 180) (99 113) (75 055)Other receivables and prepayments (370 767) (281 400) (370 767) (76 007)Provisions 61 528 986 45 795 728 49 600 018 4 586 478Assessed tax losses (3 640 037) 125 494 217 (152 023) 35 772 198Deferred tax (liabilities)/assets (153 329 926) 13 994 358 (112 775 728) 8 988 824
14.2 Income tax expenseCurrent income tax (35 557 009) (64 749 737) (30 163 260) (31 591 281)Deferred tax (29 620 774) (60 965 416) (67 429 319) 13 014 776Income tax (expense)/credit (65 177 783) (125 715 153) (97 592 579) (18 576 505)

132
ZIMRE HOLDINGS LIMITED 2020 ANNUAL REPORT
NOTES TO THE FINANCIAL STATEMENTSFOR THE YEAR ENDED 31 DECEMBER 2020 (continued)
INFLATION ADJUSTED HISTORICAL COST
14 TAXES (continued)
Group2020ZWL
Group2019ZWL
Group2020ZWL
Group2019ZWL
14.2.1 Tax rate reconciliationGains/(loss) before income tax 1 048 332 733 601 673 891 2 969 231 508 437 584 403Tax at Zimre Holdings Limited statutory income tax rate of 24.72% (2019: 25.75%) 259 147 852 154 931 027 733 994 029 112 677 984Tax effect on amounts which are not deductible/(tax-able) in calculating taxable income:Effects of lower tax rate on fair vale adjustment(Gains)/losses taxed at different rate (201 007 632) (199 436 233) (660 421 593) (111 575 806)Effect of gains on fair value of financial assets through profit or loss taxed at different rate 7 107 349 39 430 527 (14 132 711) (849 971)Share of profits from associates (24 238 413) (5 249 111) (30 059 566) (939 401)Effect of life reassurance entity taxed differently (14 895 847) 12 738 592 (20 631 353) (968 452)Income exempt from tax - dividends (1 432 069) (2 720 120) 950 263 (296 231)Income exempt from tax - interest 5 695 990 (9 041 345) 5 640 281 (933 344)Non-taxable income (700 232) (73 958) (390 172) (12 042)Movements in insurance provisions 77 755 585 (56 681 863) 53 222 759 (6 134 201)Monetary adjustment 104 667 284 18 393 - -Permanent differences on adoption of IAS 29 - (11 483 581) - -Effect on change in tax rate - (832 256) - (42 654)Effect of different tax rate on foreign operations (277 277 649) (47 315 225) (165 764 516) (9 502 387)
(65 177 783) (125 715 153) (97 592 579) (18 576 505)

133
ZIMRE HOLDINGS LIMITED 2020 ANNUAL REPORT
NOTES TO THE FINANCIAL STATEMENTSFOR THE YEAR ENDED 31 DECEMBER 2020 (continued)
INFLATION ADJUSTED HISTORICAL COST
14 TAXES (continued)
Company 2020ZWL
Company 2019ZWL
Company 2020ZWL
Company 2019ZWL
14.3 Deferred taxThe analysis of deferred tax assets and deferred tax liabilities is as follows:Deferred tax assets:Deferred tax assets to be utilised within 12 months - 293 555 - 65 440Deferred tax assets to be utilised after more than 12 months 1 297 633 1 174 218 448 851 261 760
1 297 633 1 467 773 448 851 327 200Deferred tax liabilities:Deferred tax liabilities to be settled within 12 months - (2 818 306) - (25 453)Deferred tax liabilities to be settled after more than 12 months (3 932 528) (8 459 302) - (404 088)
(3 932 528) (11 277 608) - (429 541)
Deferred tax (liabilities)/assets (2 634 896) (9 809 835) 448 851 (102 341)
Deferred taxReflected in the statement of financialposition as follows:Deferred tax asset - - 448 851 -Deferred tax liabilities (2 634 896) (9 809 835) - (102 341)Deferred tax liabilities, net (2 634 896) (9 809 835) 448 851 (102 341)
The movement on the deferred tax account is as shown below:As at 1 January (9 809 835) (4 158 119) (102 341) (49 631)Charged/(credited) in profit or loss 6 828 886 (5 577 462) 694 856 10 672Charged/(credited) in other comprehensive income 346 053 (74 254) (143 664) (63 382)As at 31 December (2 634 896) (9 809 835) 448 851 (102 341)
14.3.1 Sources of deferred tax Property, plant and equipment 553 678 (1 177 678) - (5 737)Right of use of assets (2 031 561) (7 358 327) (528 201) (264 087)Financial assets at fair value through other compre-hensive income (1 283 387) (2 532 099) (256 677) (113 013)Investments in listed equity (63 902) (209 506) (63 902) (46 704)Lease liabilities (520 420) 1 229 329 520 420 274 046Provisions (777 211) 238 446 777 211 53 154Assessed tax losses - - - -Deferred tax assets/(liabilities) (2 634 896) (9 809 835) 448 851 (102 341)
14.4 Income tax Current - -Deferred 6 828 886 (5 577 462) 694 856 10 672Income tax (expense)/credit 6 828 886 (5 577 462) 694 856 10 672

134
ZIMRE HOLDINGS LIMITED 2020 ANNUAL REPORT
NOTES TO THE FINANCIAL STATEMENTSFOR THE YEAR ENDED 31 DECEMBER 2020 (continued)
INFLATION ADJUSTED HISTORICAL COST
14 TAXES (continued)
Company 2020ZWL
Company 2019ZWL
Company 2020ZWL
Company 2019ZWL
14.4.1 Tax rate reconciliationProfit/(loss) before income tax 25 144 071 49 571 981 3 547 685 (3 395 690)
Tax at Zimre Holdings Limited statutory income tax rate of 24.72% (2019: 25.75%) 6 215 614 12 764 785 876 988 (874 390)Tax effect of amounts which are not deductible/(tax-able) in calculating taxable income:Effect of gains on fair value of financial assets through profit or loss taxed at different rate 7 107 349 (17 953 702) 5 292 888 (2 335 310)Unrealised exchange losses/(gains) - 10 230 814 (371 695) 2 286 595Effect of losses on fair value of financial assets through profit or loss - 41 023 683 - 884 313Non-taxable income (898 029) (661 325) (256 371) (49 150)Non-deductible expenses 329 227 842 821 418 929 96 630Gain on disposal of financial assets (485 212) - 5 319 892 -Monetary adjustment (20 104 201) (47 537 799) - -Permanent differences on adoption of IAS 29 - (4 459 004) - -Effect of change in tax rate - 172 265 - 1 984
Income tax (expense)/credit for the year (7 835 252) (5 577 462) 694 856 10 672
INFLATION ADJUSTED HISTORICAL COST
15 INVENTORIES
Group2020ZWL
Group2019ZWL
Group2020ZWL
Group2019ZWL
Property and stands developed for sale 148 437 997 82 349 418 4 345 381 2 483 641Consumables 3 359 980 2 196 521 2 362 154 431 319
151 797 977 84 545 939 6 707 535 2 914 960
All inventory items are classified as current assets.
There was no write off of inventories during the year ended 31 December 2020 (2019: ZWLnil).

135
ZIMRE HOLDINGS LIMITED 2020 ANNUAL REPORT
NOTES TO THE FINANCIAL STATEMENTSFOR THE YEAR ENDED 31 DECEMBER 2020 (continued)
INFLATION ADJUSTED HISTORICAL COST
16 TRADE AND OTHER RECEIVABLES
Group2020ZWL
Group2019ZWL
Group2020ZWL
Group2019ZWL
Insurance receivables 940 111 347 796 183 605 940 111 347 177 487 568 Due from policyholders under life assurance 178 796 841 - 178 796 841 - Less: allowance for credit losses (170 399 901) (140 300 527) (170 399 901) (31 276 202) Insurance receivables - net 948 508 287 655 883 078 948 508 287 146 211 366 Non insurance receivables Rental receivables 21 197 264 12 433 648 21 197 264 2 771 745 Inventory sales receivables 15 372 554 20 119 219 15 372 554 4 485 036 Less: allowance for credit losses (4 348 016) (4 660 562) (4 348 016) (1 038 946) Non reinsurance trade receivables - net 32 221 802 27 892 305 32 221 802 6 217 835 Total trade receivables-net 980 730 089 683 775 383 980 730 089 152 429 201 Other receivables and prepayments* 272 964 878 117 753 765 268 487 553 26 250 011 Less: allowance for credit losses (4 003 395) (145 145) (4 003 395) (32 357) Total trade and other receivables 1 249 691 572 801 384 003 1 245 214 247 178 646 855
The reconciliation of the allowance for credit loss-es for trade and other receivables is as follows:As at 1 January 145 106 243 113 184 787 32 347 505 4 722 144Charge for the year 126 053 819 287 732 604 146 541 931 27 908 132Amounts written off (160 058) (2 911 729) (138 124) (282 771)Effects of IAS 29 (92 248 692) (252 899 419) - -As at 31 December 178 751 312 145 106 243 178 751 312 32 347 505Analysed as follows:Insurance receivables 170 399 901 140 300 527 170 399 901 31 276 202Rental receivables 4 348 016 4 660 562 4 348 016 1 038 946Other receivables 4 003 395 145 154 4 003 395 32 357Total 178 751 312 145 106 243 178 751 312 32 347 505
Company2020ZWL
Company2019ZWL
Company2020ZWL
Company2019ZWL
Other receivables and prepayments* 3 334 559 2 998 035 3 334 559 668 331
All receivables are classified as current assets.*Other receivables and prepayments comprise receivables from disposal of investment in equity instruments, staff loans, prepaidlicence fees and sundry receivables.Due to the short-term nature of the trade and other receivables, their carrying amount is considered to be the same as their fair value.Based on credit history of these other receivables, it is expected that these amounts will be received when due.
17 DEFERRED ACQUISITION COSTS INFLATION ADJUSTED HISTORICAL COSTGroup
2020ZWL
Group2019ZWL
Group2020ZWL
Group2019ZWL
As at 1 January 56 004 436 61 424 897 11 479 221 2 002 809Movement for the year 48 094 350 (5 420 461) 74 448 336 9 476 412As at 31 December 104 098 786 56 004 436 85 927 557 11 479 221
All deferred acquisition costs are classified as current assets.
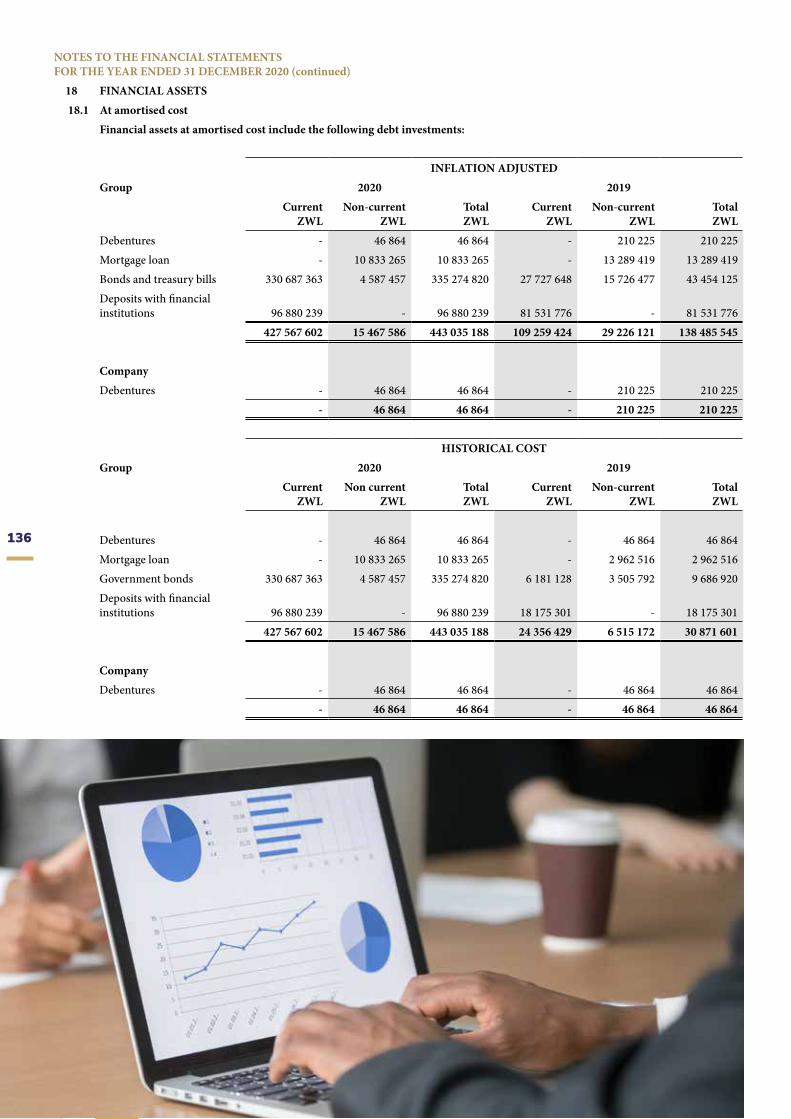
136
ZIMRE HOLDINGS LIMITED 2020 ANNUAL REPORT
NOTES TO THE FINANCIAL STATEMENTSFOR THE YEAR ENDED 31 DECEMBER 2020 (continued)
18 FINANCIAL ASSETS18.1 At amortised cost
Financial assets at amortised cost include the following debt investments:
INFLATION ADJUSTEDGroup 2020 2019
CurrentZWL
Non-currentZWL
TotalZWL
CurrentZWL
Non-currentZWL
TotalZWL
Debentures - 46 864 46 864 - 210 225 210 225Mortgage loan - 10 833 265 10 833 265 - 13 289 419 13 289 419Bonds and treasury bills 330 687 363 4 587 457 335 274 820 27 727 648 15 726 477 43 454 125Deposits with financial institutions 96 880 239 - 96 880 239 81 531 776 - 81 531 776
427 567 602 15 467 586 443 035 188 109 259 424 29 226 121 138 485 545
CompanyDebentures - 46 864 46 864 - 210 225 210 225
- 46 864 46 864 - 210 225 210 225
HISTORICAL COSTGroup 2020 2019
CurrentZWL
Non currentZWL
TotalZWL
CurrentZWL
Non-currentZWL
TotalZWL
Debentures - 46 864 46 864 - 46 864 46 864Mortgage loan - 10 833 265 10 833 265 - 2 962 516 2 962 516Government bonds 330 687 363 4 587 457 335 274 820 6 181 128 3 505 792 9 686 920Deposits with financial institutions 96 880 239 - 96 880 239 18 175 301 - 18 175 301
427 567 602 15 467 586 443 035 188 24 356 429 6 515 172 30 871 601
CompanyDebentures - 46 864 46 864 - 46 864 46 864
- 46 864 46 864 - 46 864 46 864
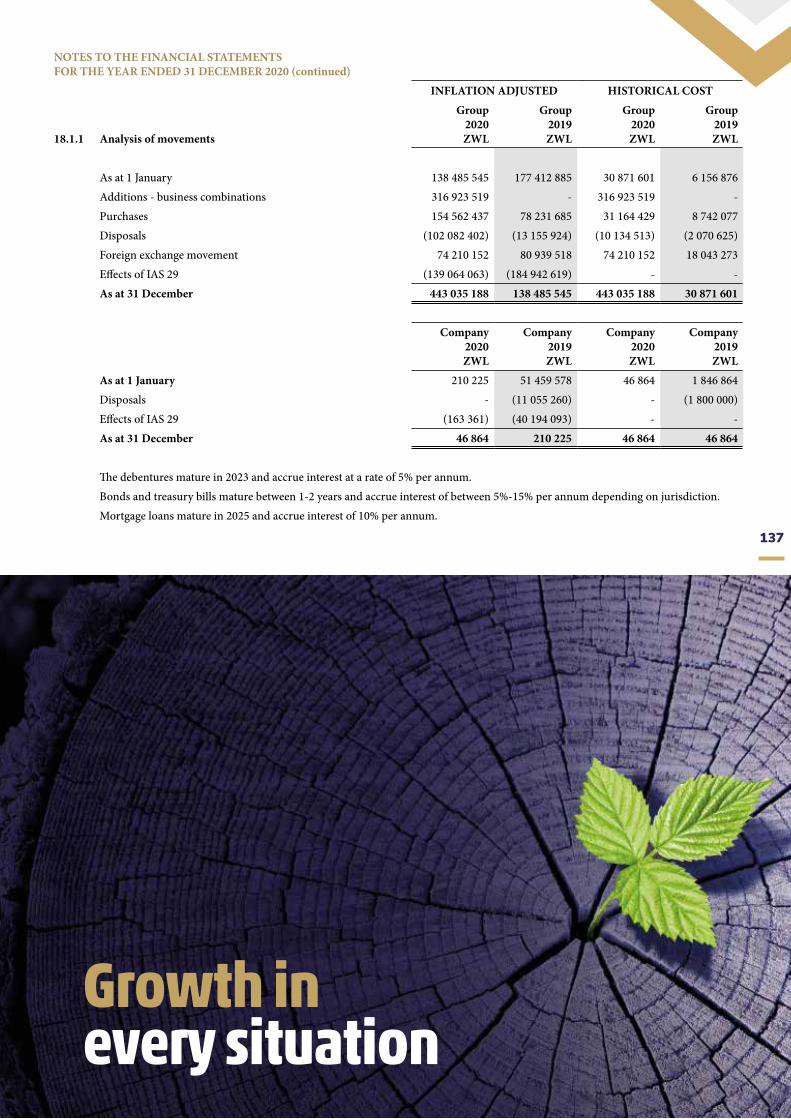
137
ZIMRE HOLDINGS LIMITED 2020 ANNUAL REPORT
NOTES TO THE FINANCIAL STATEMENTSFOR THE YEAR ENDED 31 DECEMBER 2020 (continued)
INFLATION ADJUSTED HISTORICAL COST
18.1.1 Analysis of movements
Group2020ZWL
Group2019ZWL
Group2020ZWL
Group2019ZWL
As at 1 January 138 485 545 177 412 885 30 871 601 6 156 876Additions - business combinations 316 923 519 - 316 923 519 -Purchases 154 562 437 78 231 685 31 164 429 8 742 077Disposals (102 082 402) (13 155 924) (10 134 513) (2 070 625)Foreign exchange movement 74 210 152 80 939 518 74 210 152 18 043 273Effects of IAS 29 (139 064 063) (184 942 619) - -As at 31 December 443 035 188 138 485 545 443 035 188 30 871 601
Company2020ZWL
Company2019ZWL
Company2020ZWL
Company2019ZWL
As at 1 January 210 225 51 459 578 46 864 1 846 864Disposals - (11 055 260) - (1 800 000)Effects of IAS 29 (163 361) (40 194 093) - -As at 31 December 46 864 210 225 46 864 46 864
The debentures mature in 2023 and accrue interest at a rate of 5% per annum.Bonds and treasury bills mature between 1-2 years and accrue interest of between 5%-15% per annum depending on jurisdiction.Mortgage loans mature in 2025 and accrue interest of 10% per annum.

138
ZIMRE HOLDINGS LIMITED 2020 ANNUAL REPORT
NOTES TO THE FINANCIAL STATEMENTSFOR THE YEAR ENDED 31 DECEMBER 2020 (continued)
INFLATION ADJUSTED HISTORICAL COST
1818.2
FINANCIAL ASSETS (continued)At fair value through profit or loss
Group2020ZWL
Group2019ZWL
Group2020ZWL
Group2019ZWL
As at 1 January 108 901 367 175 945 297 24 276 611 6 314 770
Additions - business combinations 829 080 888 - 795 485 574 -
Purchases 519 045 674 71 330 851 592 487 627 2 785 652
Disposals (367 035 255) (34 817 138) (176 700 496) (231 728)
Fair value(loss)/gain (note 33) (28 751 411) (159 315 275) 57 171 162 3 434 226
Effects of IAS 29 231 479 215 2 045 385 - -
Foreign exchange movement (555 925 750) 53 712 247 (555 925 750) 11 973 691
As at 31 December 736 794 728 108 901 367 736 794 728 24 276 611
Company2020ZWL
Company2019ZWL
Company2020ZWL
Company2019ZWL
As at 1 January 20 950 580 79 326 364 4 670 364 2 846 992
Purchases 7 812 025 21 454 106 3 061 429 641 506
Disposals (9 760 000) (23 148 379) (22 752 931) (128 244)
Fair value (loss)/gain 12 612 383 (72 540 211) 21 411 359 1 310 110
Effects of IAS 29 (25 224 767) 15 858 700 - -
As at 31 December 6 390 221 20 950 580 6 390 221 4 670 364
All financial assets at fair value through profit or loss are classified as current assets.At fair value through profit or loss financial assets are equity securities listed either on the Zimbabwe Stock Exchange or on Stock Exchanges for regional countries.
INFLATION ADJUSTED HISTORICAL COST
18.3 At fair value through other comprehensive income
Group2020ZWL
Group2019ZWL
Group2020ZWL
Group2019ZWL
As at 1 January 350 103 492 144 379 084 78 046 090 5 181 669
Additions - business combinations 704 693 434 676 138 443
Additions - 25 944 452 - 2 518 957
Disposals (336 351) - (336 351) -
Fair value gains (63 303 279) 153 404 635 36 659 604 57 658 115
Effects of IAS 29 (200 649 510) (30 538 296) - -
Foreign exchange movement (428 840 058) 56 913 617 (428 840 058) 12 687 349
As at 31 December 361 667 728 350 103 492 361 667 728 78 046 090
Equity investments at FVOCI comprise the following individual investments:
Unlisted securities
Cell Insurance Company (Private) Limited 20 565 765 50 641 982 20 565 765 11 289 258
Guardian Reinsurance Brokers Limited 5 101 972 6 255 862 5 101 972 1 394 575
PTA Reinsurance Company 239 313 579 220 300 123 239 313 579 49 109 945
Lidwala Insurance Company 93 057 487 63 192 306 93 057 487 14 087 013
Vanguard Life Assurance Company Limited 3 628 925 9 713 219 3 628 925 2 165 299
361 667 728 350 103 492 361 667 728 78 046 090

139
ZIMRE HOLDINGS LIMITED 2020 ANNUAL REPORT
NOTES TO THE FINANCIAL STATEMENTSFOR THE YEAR ENDED 31 DECEMBER 2020 (continued)
INFLATION ADJUSTED HISTORICAL COST
Company2020ZWL
Company2019ZWL
Company2020ZWL
Company2019ZWL
As at 1 January 56 927 150 43 906 164 12 690 366 1 575 775
Fair value gain (31 259 413) 13 020 986 12 977 371 11 114 591
As at 31 December 25 667 737 56 927 150 25 667 737 12 690 366
Equity investments at FVOCI comprise the following individual investments:
Unlisted securities
Cell Insurance Company (Private) Limited 20 565 764 50 641 982 20 565 764 11 289 258
Guardian Reinsurance Brokers Limited 5 101 973 6 285 168 5 101 973 1 401 108
25 667 737 56 927 150 25 667 737 12 690 366
19 CASH AND CASH EQUIVALENTS
Cash on hand 549 741 355 532 549 741 79 256
Cash at bank 957 451 151 255 596 738 957 451 151 56 978 369
Bank overdraft (291 933) (291 933)
Term deposits maturing under 3 months 225 680 364 154 236 382 225 680 364 34 382 824
1 183 389 323 410 188 652 1 183 389 323 91 440 449
Company2020ZWL
Company2019ZWL
Company2020ZWL
Company2019ZWL
Bank overdraft (291 933) 596 598 (291 933) 132 995
Term deposits maturing under 3 months 12 104 747 1 951 052 12 104 747 434 934
11 812 814 2 547 650 11 812 814 567 929
Term deposits are presented as cash equivalents if they have a maturity of 3 months or less from the date of placement with a financialinstitution and are repayable within 24 hours notice. Term deposits accrue interest at a rate of between 5% to 10% p.a.
20 SHARE CAPITAL
20.1 Authorised share capital
Authorised share capital as at 31 December 2020 was 2 000 000 000 (2019 : 2 000 000 000) ordinary shares with a nominal value ofZWL0.01 each, ZWL20 000 000 (2019 : ZWL20 000 000).
20.2 Issued share capital and treasury shares
INFLATION ADJUSTED HISTORICAL COST
Year ended 31 December 2019
Number of shares
Share capitalZWL
Sharepremium
ZWL
Treasury Shares
ZWLShare capital
ZWL
Sharepremium
ZWL
Treasury Shares
ZWL
As at 1 January 2019 1 533 338 937 508 539 756 379 042 460 (439 188) 15 326 649 11 427 034 (8 886)
Share buy-back - - - (79 938) - - (17 046)
As at 31 December 2019 1 533 338 937 508 539 756 379 042 460 (519 126) 15 326 649 11 427 034 (25 932)
Year ended 31 December 2020
As at 1 January 2020 1 533 338 937 508 539 756 379 042 460 (519 126) 15 326 649 11 427 034 (25 932)
Share issue 284 879 849 2 848 798 776 295 078 - 2 848 798 776 295 079 -
Share buy-back - - - (1 039 000) - - (997 149)
As at 31 December 2020 1 818 218 786 511 388 554 1 155 337 538 (1 558 126) 18 175 447 787 722 113 (1 023 081)
During the year ended 31 December 2020, the Company purchased 526 100 (2019:379 600) ordinary shares amounting to ZWL 1 039 000 (2019:17 046).
Group2020ZWL
Group2019ZWL
Group2020ZWL
Group2019ZWL
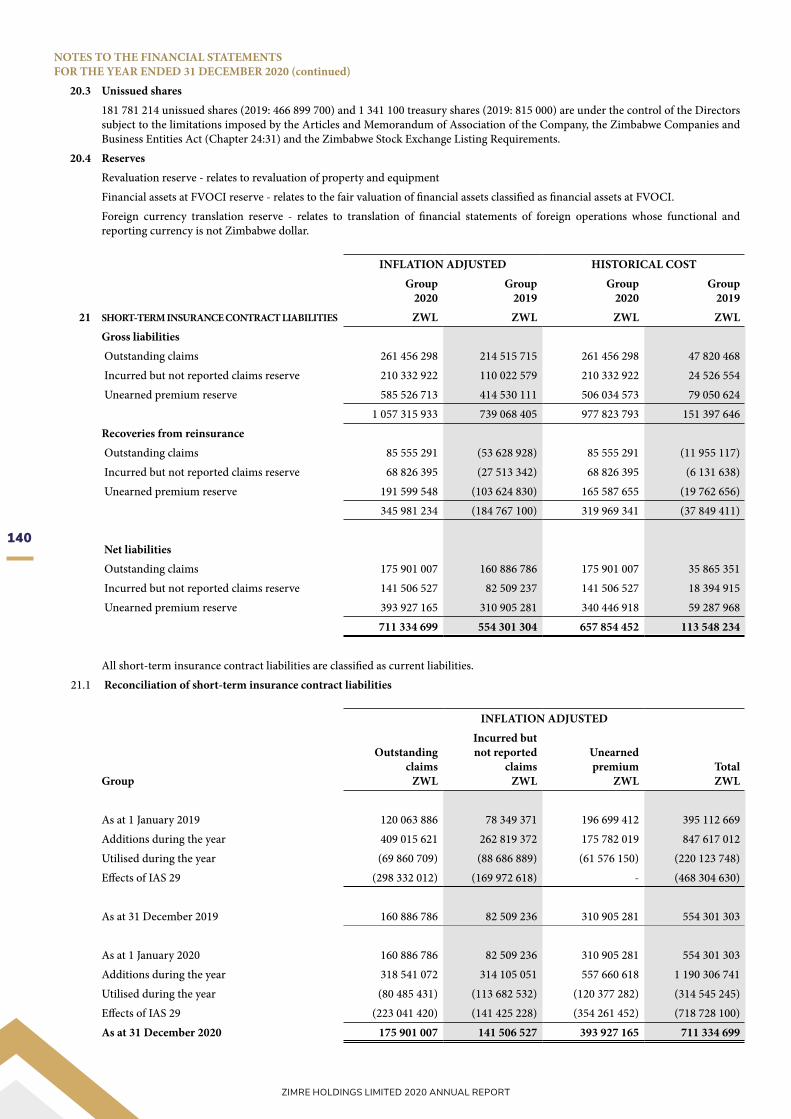
140
ZIMRE HOLDINGS LIMITED 2020 ANNUAL REPORT
NOTES TO THE FINANCIAL STATEMENTSFOR THE YEAR ENDED 31 DECEMBER 2020 (continued)
20.3 Unissued shares181 781 214 unissued shares (2019: 466 899 700) and 1 341 100 treasury shares (2019: 815 000) are under the control of the Directors subject to the limitations imposed by the Articles and Memorandum of Association of the Company, the Zimbabwe Companies and Business Entities Act (Chapter 24:31) and the Zimbabwe Stock Exchange Listing Requirements.
20.4 ReservesRevaluation reserve - relates to revaluation of property and equipmentFinancial assets at FVOCI reserve - relates to the fair valuation of financial assets classified as financial assets at FVOCI.Foreign currency translation reserve - relates to translation of financial statements of foreign operations whose functional and reporting currency is not Zimbabwe dollar.
INFLATION ADJUSTED HISTORICAL COSTGroup
2020Group
2019Group
2020Group
201921 SHORT-TERM INSURANCE CONTRACT LIABILITIES ZWL ZWL ZWL ZWL
Gross liabilities Outstanding claims 261 456 298 214 515 715 261 456 298 47 820 468 Incurred but not reported claims reserve 210 332 922 110 022 579 210 332 922 24 526 554 Unearned premium reserve 585 526 713 414 530 111 506 034 573 79 050 624
1 057 315 933 739 068 405 977 823 793 151 397 646Recoveries from reinsurance Outstanding claims 85 555 291 (53 628 928) 85 555 291 (11 955 117) Incurred but not reported claims reserve 68 826 395 (27 513 342) 68 826 395 (6 131 638) Unearned premium reserve 191 599 548 (103 624 830) 165 587 655 (19 762 656)
345 981 234 (184 767 100) 319 969 341 (37 849 411)
Net liabilities Outstanding claims 175 901 007 160 886 786 175 901 007 35 865 351 Incurred but not reported claims reserve 141 506 527 82 509 237 141 506 527 18 394 915 Unearned premium reserve 393 927 165 310 905 281 340 446 918 59 287 968
711 334 699 554 301 304 657 854 452 113 548 234
All short-term insurance contract liabilities are classified as current liabilities.21.1 Reconciliation of short-term insurance contract liabilities
INFLATION ADJUSTED
Group
Outstandingclaims
ZWL
Incurred butnot reported
claimsZWL
Unearnedpremium
ZWLTotalZWL
As at 1 January 2019 120 063 886 78 349 371 196 699 412 395 112 669Additions during the year 409 015 621 262 819 372 175 782 019 847 617 012Utilised during the year (69 860 709) (88 686 889) (61 576 150) (220 123 748)Effects of IAS 29 (298 332 012) (169 972 618) - (468 304 630)
As at 31 December 2019 160 886 786 82 509 236 310 905 281 554 301 303
As at 1 January 2020 160 886 786 82 509 236 310 905 281 554 301 303Additions during the year 318 541 072 314 105 051 557 660 618 1 190 306 741Utilised during the year (80 485 431) (113 682 532) (120 377 282) (314 545 245)Effects of IAS 29 (223 041 420) (141 425 228) (354 261 452) (718 728 100)As at 31 December 2020 175 901 007 141 506 527 393 927 165 711 334 699

141
ZIMRE HOLDINGS LIMITED 2020 ANNUAL REPORT
NOTES TO THE FINANCIAL STATEMENTSFOR THE YEAR ENDED 31 DECEMBER 2020 (continued)
HISTORICAL COST
Group
Outstandingclaims
ZWL
Incurred butnot reported
claimsZWL
Unearnedpremium
ZWLTotalZWL
As at acquisition date (6 131 638) (19 762 656) 6 514 406 (25 894 294)Additions during the year 49 428 836 47 170 573 60 150 853 163 264 668Utilised during the year (7 431 847) (9 013 001) (7 377 291) (23 822 140)
As at 31 December 2019 35 865 351 18 394 916 59 287 968 113 548 234
As at 1 January 2020 35 865 351 18 394 916 59 287 968 113 548 234Additions during the year 203 280 837 200 449 937 355 877 867 759 608 641Utilised during the year (63 245 181) (77 338 325) (74 718 917) (215 302 423)As at 31 December 2020 175 901 007 141 506 527 340 446 918 657 854 452
INFLATION ADJUSTED HISTORICAL COST21.2 Insurance contract liabilities and investment contract Group Group Group Group
liabilities with discretionary participation features 2020 2019 2020 2019ZWL ZWL ZWL ZWL
As at acquisition date 3,137,923,700 - 699,521,286 - Split out of investment contract liabilities with-out DPF (223,625,887) - (49,851,776) - Change in life assurance policyholder liabilities for the year 807,972,142 - 3,072,600,445 - Movement through profit or loss 586,657,204 - 1,957,504,664 - Movement through other comprehensive income 40,070,771 - 249,424,335 - Exchange rate movement on foreign operations 181,244,167 - 865,671,446 -
Balance at the end of the year 3,722,269,955 - 3,722,269,955 -
21.3 Investment contracts without discretionary participation featuresAs at acquisition date 39,411,707 - 39,411,707 - Split out from insurance contract liabilities 49,851,776 - 49,851,776 - Fair value gains from equities 174,920,029 - 174,920,029 - Fair value gains from investment properties 139,104,749 - 139,104,749 - Other investment income 40,914 - 40,914 - Net cash flow (5,860,193) - (5,860,193) - Gross premium income 1,115,601 - 1,115,601 - Gross benefits and claims paid (652,815) - (652,815) - Investment expenses (6,322,979) - (6,322,979) -
Balance at the end of the year 397,468,982 - 397,468,9823 -

142
ZIMRE HOLDINGS LIMITED 2020 ANNUAL REPORT
NOTES TO THE FINANCIAL STATEMENTSFOR THE YEAR ENDED 31 DECEMBER 2020 (continued)
INFLATION ADJUSTED HISTORICAL COST
22 LIFE REASSURANCE CONTRACT ASSETS AND LIABILITIES
Group2020ZWL
Group2019ZWL
Group2020ZWL
Group2019ZWL
22.1 Life reassurance contract assetsAs at 1 January 6 431 820 4 349 450 1 433 800 156 100Movement for the year 18 176 504 13 157 347 11 599 200 1 277 700Effects of IAS 29 (11 575 324) (11 074 977) - -As at 31 December 13 033 000 6 431 820 13 033 000 1 433 800
22.2 Life reassurance contract liabilitiesAs at 1 January 29 097 502 56 551 190 6 486 500 2 029 600Movement for the year 46 216 136 45 895 731 29 492 500 4 456 900Effects of IAS 29 (39 334 638) (73 349 419) - -As at 31 December 35 979 000 29 097 502 35 979 000 6 486 500
Net movement for the year (22.1 and 22.2) 28 039 632 32 738 384 17 893 300 3 179 200Analysed as follows :Non-current 35 979 000 29 097 502 35 979 000 6 486 500
35 979 000 29 097 502 35 979 000 6 486 500

143
ZIMRE HOLDINGS LIMITED 2020 ANNUAL REPORT
NOTES TO THE FINANCIAL STATEMENTSFOR THE YEAR ENDED 31 DECEMBER 2020 (continued)
INFLATION ADJUSTED HISTORICAL COST
23 BORROWINGS
Group2020ZWL
Group2019ZWL
Group2020ZWL
Group2019ZWL
As at 1 January 64 842 518 110 404 807 14 454 883 3 962 351Drawn downs during the year 9 150 288 42 653 902 9 150 288 3 940 000Assumed borrowings through business combinations 33 987 385 - 33 442 638 -Interest for the year 8 627 463 8 594 733 7 507 700 744 654Capital repayments (10 022 140) (25 339 898) (7 112 332) (2 248 072)Interest repayment (9 053 311) (8 594 733) (7 388 801) (744 654)Effects of IAS 29 (47 477 827) (102 354 533) - -Foreign exchange movement 24 410 314 39 478 240 24 410 314 8 800 604
Balance as at 31 December 74 464 690 64 842 518 74 464 690 14 454 883
Non-current 36 779 432 51 213 447 36 779 432 11 416 651Current 37 685 258 13 629 071 37 685 258 3 038 232
74 464 690 64 842 518 74 464 690 14 454 883
Maturity analysis:1 month to 6 months 19 219 482 7 005 565 19 219 482 1 561 701 6 month to 1 year 18 465 777 6 623 505 18 465 777 1 476 531 1 year to 5 years 36 779 431 51 213 448 36 779 431 11 416 651
74 464 690 64 842 518 74 464 690 14 454 883
Bank borrowings comprise loans from institutions listed below :-Central Africa Building Society The loan was ZWL2 355 522 and bore interest at 10% (2019: 10%) per annum and was secured by a first mortgage bond on Stand 16591, Harare Township. The loan was paid up during the year. ZB Bank Limited - The loan of ZWL2 853 959 bears interest at 31.11% (2019: 31.11%) per annum and is secured by first mortgage bonds over stands 353 Bulawayo Township, 771 Salisbury Township and 326 Fort Victoria Township. The loan is repayable over 3 years.- The overdraft facility with ZB Bank Limited was acquired as a line-of-credit for the micro-finance business to increase the unit’s lend-ing capacity. The loan accrues interest at 49% (2019: 49%) per annum on a one year tenure. The loan is available for one year, expiring on 28 February 2021.FBC Bank Limited, Infrastructure Development Bank of Zimbabwe, Standard Chartered Bank of Zimbabwe Limited and Agrib-ank LimitedThe Group assumed CFI Holdings Limited’s loans, issued by these banks amounting to ZWL16 million, when it acquired Langford Estates (1962) (Private) Limited through a land-for-debt swap arrangement in 2015. The borrowings accrue interest at 10% (2019: 10%) per annum and have a tenor of 7 years ending 30 June 2022. The debt assumption came with a 2-year principal repayment grace period which ended on 30 June 2018. The loans were secured through a mortgage bond over investment property and was fully settled during the current year. This came about as part of the aquisition of Fiedelity Life Assurance of Zimbabwe Limited.NMB Bank LimitedThe loan with NMB Bank was acquired to enable settlement of the Redeemable Bonds that were settled in 2018. The loan accrues interest at 10% (2019: 10%) per annum and has fixed monthly repayments to 31 January 2023. The facility is secured through a first mortgage bond over property valued at ZWL57.1 million and cession of residential stand sales receivables worth ZWL12 million.Ecobank Zimbabwe Limited The micro-finance business acquired a ZWL7.9 million loan facility with Ecobank Zimbabwe Limited to increase its lending capacity. The facility amount is drawn down in tranches in line with the business’ needs. Drawdowns on the facility accrue interest at varying interest rates depending on the prevailing interest rate on each drawdown date. Currently, ZWL7,969,604 of the outstanding amount accrues interest at 45% (2019: 35%) per annum. The facility is available for one year, expiring on 31 July 2021.

144
ZIMRE HOLDINGS LIMITED 2020 ANNUAL REPORT
NOTES TO THE FINANCIAL STATEMENTSFOR THE YEAR ENDED 31 DECEMBER 2020 (continued)
23 BORROWINGS (continued)African Banking Corporation (Mozambique) SAThe loan of ZWL8 562 692 bears interest at 20.75% per annum and is secured by acquired asset building 141/8 Marginal Avenue, Maputo, Mozambique. The loan is repayable over 7 years.First Capital Bank Malawi LimitedThe loan with First Capital Bank Malawi Limited was used to refinance Vanguard Life Assurance Company Limited through a rights issue. The loan is denominated in Malawi Kwacha and accrued interest at 23% (2019: 23%)per annum. The interest rate was revised to 18.9% as at 31 December 2020 and is subject to variation at the bank’s discretion as influenced by bank rates advised by the Reserve Bank of Malawi from time to time. The facility is repayable in equal monthly instalments to 31 December 2021. The terms of the loan require security of 110% of the facility amount to be kept in deposit with First Capital Bank Zimbabwe Limited for the duration of the facility, which would amount to US$377,750. The loan is currently secured by a lien over cash amounting to ZWL377,750 after the deposit previously placed with the bank was converted to ZWL when SI33 became effective. The Group is engaged in discussions with First Capital Bank Malawi limited to render additional security to meet the US$377,750 requirement.For the long-term borrowings, their fair values are not materially different to carrying amounts as the interest rates on these borrowings approximate market rates.
This section sets out an analysis of net debt and the movements in net debt for each of the years presented.
INFLATION ADJUSTED HISTORICAL COST
Net debt reconciliation
Group2020ZWL
Group2019ZWL
Group2020ZWL
Group2019ZWL
Cash and cash equivalents (1 183 425 295) (410 188 652) (1 183 425 295) (91 440 449)Short-term portion of long term loans 37 685 258 13 629 071 37 685 258 3 038 232Long term portion 36 779 432 51 213 447 36 779 432 11 416 651
Net cash and cash equivalents (1 108 960 605) (345 346 134) (1 108 960 605) (76 985 566)
INFLATION ADJUSTEDCash and cash
equivalentsZWL
Borrowings due within one year
ZWL
Borrowings due after one year
ZWLTotalZWL
Year ended 31 December 2019Net debt as at 1 January 2019 (180 542 429) 9 200 392 4 104 266 (167 237 770)Cashflows 774 373 760 (25 339 898) 42 653 902 791 687 764Foreign exchange movement (190 178 844) - (590 215) (190 769 059)Reclassification to current liabilities - 10 883 201 (10 883 201) -Effects of IAS 29 (813 841 139) 18 885 376 15 928 695 (779 027 068)
Net debt as at 31 December 2019 (410 188 652) 13 629 071 51 213 447 (345 346 133)
Year ended 31 December 2020Net debt as at 1 January 2020 (410 188 652) 13 629 071 51 213 447 (345 346 134)Cashflows 1 276 848 647 (10 022 140) 9 150 288 1 275 976 795Foreign exchange movement (136 975 180) - 10 494 024 (126 481 156)Reclassification to current to liabilities - 34 078 327 (34 078 327) -Effects of IAS 29 (1 913 110 111) - - (1 913 110 111)
Net debt as at 31 December 2020 (1 183 425 296) 37 685 258 36 779 432 (1 108 960 605)

145
ZIMRE HOLDINGS LIMITED 2020 ANNUAL REPORT
NOTES TO THE FINANCIAL STATEMENTSFOR THE YEAR ENDED 31 DECEMBER 2020 (continued)
23 BORROWINGS (continued)
HISTORICAL COST
Cash and cashequivalents
ZWL
Borrowings due within one year
ZWL
Borrowings due after one year
ZWLTotalZWL
Year ended 31 December 2019Net debt as at 1 January 2019 (9 792 554) 1 312 134 2 650 217 (5 830 203)Cashflows (17 331 897) (2 248 072) 3 940 000 (15 639 969)Foreign exchange movement (64 315 998) - 8 800 604 (55 515 394)Reclassification to current liabilities - 3 974 170 (3 974 170) -
Net debt as at 31 December 2019 (91 440 449) 3 038 232 11 416 651 (76 985 566)
Year ended 31 December 2020Net debt as at 1 January 2020 (91 440 449) 3 038 232 11 416 651 (76 985 566)Cashflows 1 228 924 054 (7 112 332) 9 150 288 1 230 962 010Foreign exchange movement (136 975 180) - 16 212 493 (120 762 687)
Net debt as at 31 December 2020 1 000 508 425 (4 074 100) 36 779 432 1 033 213 757

146
ZIMRE HOLDINGS LIMITED 2020 ANNUAL REPORT
NOTES TO THE FINANCIAL STATEMENTSFOR THE YEAR ENDED 31 DECEMBER 2020 (continued)
24 OTHER PROVISIONSINFLATION ADJUSTED HISTORICAL COST
GroupLeave pay
ZWL
Terminationbenefits
ZWLTotalZWL
Leave payZWL
Terminationbenefits
ZWLTotalZWL
As at 1 January 2019 8 122 091 15 007 444 23 129 535 307 117 567 470 874 587Movement 18 969 184 97 789 571 116 758 755 1 839 808 9 484 541 11 324 349Effects of IAS 29 (17 460 082) (67 705 542) (85 165 624) - - -
As at 31 December 2019 9 631 193 45 091 473 54 722 666 2 146 925 10 052 011 12 198 936
As at 1 January 2020 9 631 193 45 091 473 54 722 666 2 146 925 10 052 011 12 198 936Movement 27 140 409 34 787 735 61 928 144 17 318 875 22 198 797 39 517 672Effects of IAS 29 (17 305 802) (47 628 400) (64 934 202) - - -
As at 31 December 2020 19 465 800 32 250 808 51 716 608 19 465 800 32 250 808 51 716 608
Analysed as followsNon-current - 32 250 808 32 250 808 - 32 250 808 32 250 808Current 19 465 800 - 19 465 800 19 465 800 - 19 465 800
19 465 800 32 250 808 51 716 608 19 465 800 32 250 808 51 716 608
INFLATION HISTORICAL
Company
ADJUSTEDLeave pay
ZWL
COSTLeave pay
ZWLAs at 1 January 2019 1 980 599 71 083Movement 1 510 966 143 944Effects of IAS 29 (2 526 984) -As at 31 December 2019 964 581 215 027
As at 1 January 2020 964 581 215 027Movement 4 589 885 2 929 031Effects of IAS 29 (2 410 408)
As at 31 December 2020 3 144 058 3 144 058
Analysed as followsCurrent 3 144 058 3 144 058
- Leave pay provision relates to amounts for contractual days employees are entitled to be absent from work on paid leave that were not utilised as at year-end.
- Termination benefits provision relates to contractual amounts payable to management on termination of employment.

147
ZIMRE HOLDINGS LIMITED 2020 ANNUAL REPORT
NOTES TO THE FINANCIAL STATEMENTSFOR THE YEAR ENDED 31 DECEMBER 2020 (continued)
INFLATION ADJUSTED HISTORICAL COST
25 TRADE AND OTHER PAYABLES
Group2020ZWL
Group2019ZWL
Group2020ZWL
Group2019ZWL
Due to retrocessionaires 1 150 746 111 595 393 184 1 150 746 111 132 726 783Pensions and other employee long-term benefits - 4 043 272 - 901 338Other payables* 212 921 840 161 568 360 212 921 840 36 017 289Accruals** 52 150 822 78 196 013 52 150 822 17 431 683
Total trade and other payables 1 415 818 773 839 200 829 1 415 818 773 187 077 093
Company2020ZWL
Company2019ZWL
Company2020ZWL
Company2019ZWL
Other payables* 58 619 423 54 596 778 58 619 423 12 170 872Accruals** 901 340 4 043 272 901 340 901 338
Total trade and other payables 59 520 763 58 640 050 59 520 763 13 072 210
All trade and other payables are classified as current liabilities* Other payables are constituted of non-insurance payables from the holding company and property business.**Included in the accruals are actuarial fees and any other accrued expenses not included in other payables.
26 GROSS PREMIUM WRITTEN
Group2020ZWL
Group2019ZWL
Group2020ZWL
Group2019ZWL
Life assurance contracts 33 856 616 - 29 924 490 -Life reassurance contracts 135 587 564 125 298 901 94 544 597 13 381 669Non-life reinsurance contracts 1 960 189 040 2 101 964 536 1 642 602 736 229 582 176
2 129 633 220 2 227 263 437 1 767 071 823 242 963 845
27 RETROCESSION PREMIUMLife assurance contracts (2 139 421) - (1 720 536) -Life reassurance contracts (33 191 528) (29 400 348) (26 827 125) (4 574 542)Non-life reinsurance contracts (568 042 374) (702 917 224) (549 684 134) (76 641 553)
(603 373 323) (732 317 572) (578 231 795) (81 216 095)
28 UNEARNED PREMIUM PROVISIONUnearned gross premium (298 021 729) (140 180 615) (208 452 852) (16 988 523)Less related retrocession premiums 177 644 447 78 604 464 133 733 935 9 611 231
(120 377 282) (61 576 151) (74 718 917) (7 377 292)
29 BROKERAGE, COMMISSION AND FEESRetrocession commission income 148 821 701 198 983 189 147 443 714 24 759 484Less charges on retrocession contracts (21 083 138) (14 251 708) (17 938 473) (1 003 270)
127 738 563 184 731 481 129 505 241 23 756 214

148
ZIMRE HOLDINGS LIMITED 2020 ANNUAL REPORT
NOTES TO THE FINANCIAL STATEMENTSFOR THE YEAR ENDED 31 DECEMBER 2020 (continued)
INFLATION ADJUSTED HISTORICAL COST
30 NET PROPERTY INCOME
Group2020ZWL
Group2019ZWL
Group2020ZWL
Group2019ZWL
Revenue from contracts with customers: Sale of property and stands 35 260 175 58 163 990 36 283 649 5 526 698Cost of sales of property and stands (5 951 690) (11 782 118) (194 651) (387 663)
29 308 485 46 381 872 36 088 998 5 139 035
31 NET PROPERTY OPERATING COSTSOperating costs recoveries - 49 796 604 - 2 448 374Property operating costs (10 168 457) (71 431 051) (18 226 772) (4 306 940)
(10 168 457) (21 634 447) (18 226 772) (1 858 566)
32 INVESTMENTS INCOMEDividend income 5 793 159 13 623 626 3 844 106 1 150 412Interest income 23 042 031 35 112 015 22 816 669 3 624 637
28 835 190 48 735 641 26 660 775 4 775 049
Company2020ZWL
Company2019ZWL
Company2020ZWL
Company2019ZWL
Dividend income 686 675 2 232 601 415 579 139 765Interest income 645 149 48 439 621 521 4 343
1 331 824 2 281 040 1 037 100 144 108

149
ZIMRE HOLDINGS LIMITED 2020 ANNUAL REPORT
NOTES TO THE FINANCIAL STATEMENTSFOR THE YEAR ENDED 31 DECEMBER 2020 (continued)
INFLATION ADJUSTED HISTORICAL COST
33 OTHER (LOSSES)/GAINS
Group2020ZWL
Group2019ZWL
Group2020ZWL
Group2019ZWL
Profit from disposal of property and equipment 950 659 1 231 141 1 099 159 117 279Gains from disposal of investment property 1 047 759 - 160 379 -Gains from disposal of financial assets at fair valuethrough profit or loss (note 18.2) - 1 926 146 - 361 782Amounts received in share split 17 028 257 - 17 028 257 -Realised exchange differences * 38 876 807 65 873 966 24 698 238 7 997 254Recoveries from debtors previously written off 11 159 501 985 151 10 808 197 95 649Fair value adjustments on FVPL (28 751 411) (159 315 275) 57 171 162 3 434 226Unrealised exchange gains/(losses) 98 435 657 (39 731 318) 98 435 657 (8 879 980)Fair value on remeasurement of associate (note 13) 51 113 672 - 19 177 952 -Interest income from micro-lending 2 832 655 - 1 578 365 -Other gains 86 431 739 59 910 592 83 708 190 5 581 657
279 125 034 (69 119 597) 313 865 556 8 707 867
* The greater value of the realised gains arose from sales of stands.
Company2020ZWL
Company2019ZWL
Company2020ZWL
Company2019ZWL
Gains from disposal of financial assets at fair value throughprofit or loss - 1 774 420 - 129 375Realised exchange differences losses - (8 748 489) - (366 688)Unrealised exchange gains/(losses) 1 503 622 - 1 503 622 -Fair value (losses)/gains on financial assets through profit or loss 12 612 383 (72 540 211) 21 411 359 1 310 110Other (losses)/ gains 2 300 979 72 599 2 683 647 (1 077)
16 416 984 (79 441 681) 25 598 628 1 071 720
34 OPERATING AND ADMINISTRATION EXPENSES
Group2020ZWL
Group2019ZWL
Group2020ZWL
Group2019ZWL
Independent auditors’ remuneration (23 775 447) (16 894 337) (21 943 779) (1 407 383)Directors’ fees (non-executive) (23 444 352) (33 934 358) (18 577 200) (3 402 957)Employee benefit expenses (note 34.1) (256 531 574) (192 302 875) (228 407 422) (26 174 704)Depreciation of property and equipment (note 8) (28 750 768) (36 447 674) (13 587 986) (2 374 852)Depreciation of right-of-use-assets (note 9) (26 069 849) (9 612 581) (6 123 309) (772 721)Write-off of receivables (160 058) (2 911 729) (138 124) (282 771)Amortisation of intangible assets (note 11 ) (1 978 409) (2 078 677) (819 337) (105 617)Consultation fees (33 821 249) (21 721 683) (25 244 254) (2 571 809)Legal fees (3 430 380) (5 541 046) (3 504 230) (580 297)Fines (192 708) - (112 549) -Rent, premises costs and utilities (16 540 774) (15 336 278) (13 364 628) (1 657 917)Travel and representation (6 188 653) (22 478 265) (4 814 135) (2 130 972)Marketing, advertising and promotion (20 557 757) (37 551 403) (15 931 262) (3 768 913)Other operating expenses 240 403 131 (41 241 255) (51 291 270) (4 021 483)
(201 038 847) (438 052 161) (403 859 485) (49 252 396)

150
ZIMRE HOLDINGS LIMITED 2020 ANNUAL REPORT
NOTES TO THE FINANCIAL STATEMENTSFOR THE YEAR ENDED 31 DECEMBER 2020 (continued)
34 OPERATING AND ADMINISTRATION EXPENSES
Company2020ZWL
Company2019ZWL
Company2020ZWL
Company2019ZWL
Independent auditors’ remuneration (3 247 501) (1 081 351) (2 234 595) (50 360)Directors’ fees (non-executive) (7 054 986) (9 516 204) (4 787 086) (893 358)Employee benefit expenses (note 34.1) (46 257 221) (27 299 315) (32 611 412) (2 212 332)Depreciation of property and equipment (note 8) (3 079 290) (3 079 267) (92 831) (92 831)Depreciation of right-of-use-assets (note 9) (21 548 406) (7 325 658) (1 601 867) (262 915)Consultation fees (6 104 022) (3 283 503) (3 098 178) (239 362)Legal fees (179 954) - (146 086) -Rent, premises costs and utilities (713 725) - (345 550) -Travel and representation (296 485) (416 583) (168 934) (41 375)Marketing, advertising and promotion (834 208) (535 051) (742 160) (40 193)Other operating expenses 27 895 902 (4 262 859) 22 950 836 (672 320)
(61 419 896) (56 799 791) (22 877 863) (4 505 046)
Group2020ZWL
Group2019ZWL
Group2020ZWL
Group2019ZWL
34.1 Employee benefit expensesDirectors’ remuneration (executive directors) (54 974 052) (72 538 466) (57 294 574) (11 475 791)Wages and salaries (excluding executive directors) (142 475 045) (69 461 673) (114 693 020) (9 083 633)Other staff costs (46 116 499) (35 969 034) (44 194 302) (3 431 777)Pension costs (note 34.2) (10 523 330) (11 316 910) (9 980 590) (1 730 372)Social security costs (note 34.2.1) (2 442 648) (3 016 792) (2 244 936) (453 131)
(256 531 574) (192 302 875) (228 407 422) (26 174 704)
INFLATION ADJUSTED HISTORICAL COSTCompany
2020ZWL
Company2019ZWL
Company2020ZWL
Company2019ZWL
Employee benefit expensesDirectors’ remuneration (executive directors) (16 395 165) (10 783 363) (11 229 302) (813 423)Wages and salaries (excluding executive directors) (20 680 628) (9 426 214) (15 527 694) (739 123)Other staff costs (7 182 637) (6 070 389) (5 701 106) (576 581)Social security costs (note 34.2.1) (1 998 791) (1 019 349) (153 310) (83 205)
(46 257 221) (27 299 315) (32 611 412) (2 212 332)

151
ZIMRE HOLDINGS LIMITED 2020 ANNUAL REPORT
NOTES TO THE FINANCIAL STATEMENTSFOR THE YEAR ENDED 31 DECEMBER 2020 (continued)
34.2 Staff pension and life assurance scheme
Group2020ZWL
Group2019ZWL
Group2020ZWL
Group2019ZWL
Employees are members of the life assurance scheme managed by Fidelity life Assurance of Zimbabwe Limited. The Group’s contributions (employer contributions) to the scheme are charged directly to the statement of profit or loss during the year in which they are incurred. However, there were no contributions to this pension fund in the current and prior year since the scheme was paid up in 2016.Credit Insurance Zimbabwe Limited and subsidiaries domiciled outside Zimbabwe have separate schemes to which they contribute. These schemes are all defined contribution plans and contributions are directly expensed through the statementof profit or loss during the year in which they are incurred.
Pension fund contributions (10 523 330) (11 316 910) (9 980 590) (1 730 372)
34.2.1 National Social Security Authority SchemeThe entities domiciled in Zimbabwe and their employees contribute to the National Social Security Authority Pension Scheme. This is a social security scheme, which was promulgated under the National Social Security Act (Chapter 17:04). The Group’s obligations under the scheme are limited to specific contributions legislated from time to time. Similarly, regional subsidiaries and their staff also contribute to national social security schemes in their respective countries where such schemes are legislated. Company contributions are charged to the statement of profit or loss in the year in which they are incurred.
National Social Security Authority Scheme contributions (2 442 648) (3 016 792) (2 244 936) (453 131)
Company2020ZWL
Company2019ZWL
Company2020ZWL
Company2019ZWL
National Social Security Authority Scheme contributions (236 199) (1 019 350) (153 310) (83 205)
35 EARNINGS PER SHARE
Group2020ZWL
Group2019ZWL
Group2020ZWL
Group2019ZWL
Basic and diluted earnings per share35.1 Basic earnings per share
The following reflects the income and ordinary share data used in the computations of basic and diluted earnings/(loss) per share:Earnings attributable to ordinary equity holders of the parent for basic earnings per share 558 250 504 187 395 112 2 015 543 197 269 729 090
Weighted average number of ordinary shares in issue 1 557 078 924 1 533 338 937 1 557 078 924 1 533 338 937
Basic earnings per share (ZWL cents) 35.85 12.22 129.44 17.60
35.2 Diluted earnings per shareThe Company has no arrangements or contracts that could result in dilution therefore, the diluted earnings per share are the same as the basic earnings per share.

152
ZIMRE HOLDINGS LIMITED 2020 ANNUAL REPORT
NOTES TO THE FINANCIAL STATEMENTSFOR THE YEAR ENDED 31 DECEMBER 2020 (continued)
36 RELATED PARTY DISCLOSURES
36.1 Principal subsidiariesThe holding company’s direct subsidiaries are Emeritus Reinsurance (Private) Limited, Credit Insurance Zimbabwe Limited and Fidelity Life Assurance which are owned 100% (2019: 100%), 90.65% (2019: 90.65%) and 66.95% (2019: an associate 20.57%) respectively of the issued share capital. Emeritus Reinsurance (Private) Limited is domiciled in Zimbabwe. In turn Emeritus Reinsurance Zimbabwe (Private) Limited has interests in the subsidiaries listed below:Subsidiaries of Emeritus Reinsurance Zimbabwe(Private) Limited
Country ofincorporation Activity 2020 2019
Zimre Property Investments Limited Zimbabwe Properties 100.0% 64.4%Emeritus Reinsurance Zambia Limited(through Emeritus International) Zambia Reinsurance 100% 100%Emeritus Reinsurance Company Limited (through Emeritus International) Malawi Reinsurance 100% 100%Emeritus Resegguros, SA(owned through Emeritus International) Mozambique Reinsurance 70% 70%Emeritus Reinsurance Company (Proprietary) Limited (through Emeritus International) Botswana Reinsurance 91.5% 91.5%Emeritus Reinsurance Company of South AfricaLimited (through Emeritus International) South Africa Reinsurance 100% 100%Emeritus International Reinsurance Company Limited Botswana Reinsurance 100% 100%
36.2 Entity with significant influence over the GroupDay River Corporation Limited owns 33.81% of the issued share capital of Zimre Holdings Limited (2019: 40.09%), National Social Security Authority (NSSA) owns 21.14% (2019: 16.75%) and the Government of Zimbabwe owning 18.24% (2019: 21.63%)
36.3 Associates
The Group’s information on associates is disclosed in note 13.36.4 Transactions and balances with related parties
The total amount of transactions and balances that have been entered into with related parties are analysed as follows.

153
ZIMRE HOLDINGS LIMITED 2020 ANNUAL REPORT
NOTES TO THE FINANCIAL STATEMENTSFOR THE YEAR ENDED 31 DECEMBER 2019 (continued)
36 RELATED PARTY DISCLOSURES (continued)36.4 Transactions and balances with related parties (continued)
Related party transactions
Descrip-tion Company owed Relationship
2020Transaction
amount for theyear
ZWLBalance
ZWL
2019Transactionamount for
the yearZWL
BalanceZWL
Dividends
Zimre PropertyInvestments Limited Subsidiary 1 542 045 900 394 - 208 733
INFLATION ADJUSTED HISTORICAL COST2020ZWL
2019ZWL
2020ZWL
2019ZWL
36.4.2 Compensation of key management personnel of the Group
Short-term employee benefits (54 974 052) (109 737 306) (57 294 574) (11 475 791)Total compensation paid to key management personnel (54 974 052) (109 737 306) (57 294 574) (11 475 791)
36.4.3 Other interests of directors in the holding company Number of shares
2020 2019
B.N. Kumalo 1 031 315 1 031 315
R.C. Von Seidel (indirectly) 166 033 426 166 033 426
H.B.W. Rudland (indirectly) 614 769 314 614 769 314
Stanley Kudenga 100 000 100 000

154
ZIMRE HOLDINGS LIMITED 2020 ANNUAL REPORT
NOTES TO THE FINANCIAL STATEMENTSFOR THE YEAR ENDED 31 DECEMBER 2019 (continued)
36 RELATED PARTY DISCLOSURES (continued)36.5 Transactions involving changes in subsidiaries shareholding
36.5.1 Change in ownership percentage in Zimre Property Investments Limited Zimre Holdings Limited purchased a further interest in Zimre Property 2020 2019Investments Limited as analysed below:Additional interest purchased 35.65% 1.15%Interest after purchase 100% 64.35%Purchase price ZWL620 752 384 ZWL3 122 522
As a result of the above transaction a change in ownership reserve of ZWL425 491 471 (2019:ZWL22 682 123) was recognised in equity.
36.5.2 Business combinationsOn 4 December 2020, the Group acquired an additional 35.09% of the share capital of Fidelity life Assurance of Zimbabwe Limited, a long term insurer operating in Zimbabwe. As a result of the purchase, the Group expects to increase presence in the long term and pensions assurance business.Determination of fair values on acquisition dateDue to the proximity of the acquisition date of the subsidiary to the year end, the difference between the book value of the acquired net assets and consideration payable has been provisionally recognised as goodwill. During 2021 the Group will determine the fair values of the identifiable assets acquired and liabilities assumed and make the necessary adjustments to the goodwill that has been recognised in these financial statements. IFRS 3 requires fair values of assets and liabilities acquired in a business combination to be finalised within 12 months of the acquisition date.Purchase consideration INFLATION
ADJUSTEDZWL
HISTORICAL COST
ZWLOrdinary shares issued 191 805 365 184 033 190
The fair value of the 65 144 492 shares issued as part of the consideration paid by Zimre Holdings Limited (ZWL184m) was based on the published share price on 4 December 2020 of ZWL 2.825 per ordinary share. Issue costs of ZWL25 641 696 which were directly attributable to the issue of the shares have been netted against the deemed proceeds.

155
ZIMRE HOLDINGS LIMITED 2020 ANNUAL REPORT
NOTES TO THE FINANCIAL STATEMENTSFOR THE YEAR ENDED 31 DECEMBER 2019 (continued)
36 RELATED PARTY DISCLOSURES (continued)36.5.2 Business combinations (continued)
The assets and liabilities recognised as a result of the acquisition are as follows: Fair valuesINFLATION HISTORICAL ADJUSTED COST
ZWL ZWLProperty and equipment 388 415 097 388,415,097 Investment property 3 117 751 896 3,117,751,896 Intangible assets 35 738 159 34,290,008 Inventories 60 345 478 2,225,029 Trade and other receivables 380 498 771 365,080,522 Deferred tax assets 6 477 6,228 Equities at fair value through profit or loss 829 080 888 795,485,574 Debt securities at amortised cost 2 372 786 2,276,638 Cash and deposits with banks 704 693 434 676,138,443 Insurance contract liabilities, and investment contract liabilities withdiscretionary participation features (3 722 269 955) (3,722,269,955)Investment contracts without discretionary participation features (397 468 982) (397,468,982)Borrowings (19 651 669) (18,855,361)Deferred tax liabilities (43 333 091) (41,577,184)Lease obligation (28 352 400) (27,203,528)Trade and other payables (530 944 661) (509,430,171)Corporate tax liability (9 231 982) (8,851,677)
Total identifiable net assets 767 650 246 656 012 577
Less: non controlling interests (465 342 643) (433 759 577)
Add: Goodwill (note 11.2) 61 417 154 144 955 157
Net assets acquired 363 724 757 367 208 157
A profit of ZWL51 113 672 was recognised from the remeasurement of the previously held interest in Fidelity Life Assurance of Zimbabwe Limited. The remeasurement gain is included in other income in statement of comprehensive income.
The non-controlling interest has been recognised as a proportion of net assets acquired.
The gross written premium included in the consolidated statement of comprehensive income from 1 December 2020 to 31 December 2020 contributed by Fidelity Life Assurance of Zimbabwe Limited was ZWL33.85 million. Fidelity Life Assurance of Zimbabwe Limited also contributed a profit for the year of ZWL4.5 (ZWL29.27 historical cost) million over the same period.
The fair value of acquired trade receivables is ZWL294 119 268. The gross contractual amount for trade receivables due is ZWL307 295 829, with a loss allowance of ZWL13 1765 678 561 recognised on acquisition.

156
ZIMRE HOLDINGS LIMITED 2020 ANNUAL REPORT
NOTES TO THE FINANCIAL STATEMENTSFOR THE YEAR ENDED 31 DECEMBER 2019 (continued)
36.5.2 Business combinations (continued)Mandatory offer to FLA non-controlling shareholders
The International Financial Reporting Interpretations Committee, (“IFRS IC”) received a request to address the accounting for mandatory purchases of non-controlling interests that arise as a result of business combinations. The submission noted that IFRS 3-Business Combinations does not specifically address the accounting for a sequence of transactions that begins with an acquirer gaining control of an entity and is followed shortly thereafter by the acquisition of additional ownership interests as a result of a regulatory requirement that obliges the acquirer to offer to purchase the ownership interests of non-controlling-interest shareholders.The Interpretations Committee tentatively agreed that the initial acquisition of the controlling stake and the subsequent mandatory tender offer (“MTO”) should be treated as a single acquisition.The Interpretations Committee discussed whether a liability should be recognized for the MTO at the date the acquirer obtains control of the acquiree. The Interpretations Committee noted that IAS 37 Provisions, Contingent Liabilities and Contingent Assets excludes from its scope contracts that are executory in nature and concluded that no liability needed to be recognized for the MTO. The Interpretations Committee tentatively decided to recommend to the IASB that it should not amend IFRS 3. The IFRS IC tentatively decided to propose to the IASB that it should amend IFRS 3 through annual improvements.Notwithstanding the above, the Group has not accounted for the MTO because the issue is still subject to Board review and other regulatory requirements and the mandatory 60-day period within which to make the offer has since expired. The decision of the Board and the outcome of the various regulatory engagements will be communicated to stakeholders in due course and appropriately dealt with in terms of the IFRS requirements.
INFLATION ADJUSTED HISTORICAL COST
37 DIVIDENDS
Group2020ZWL
Group2019ZWL
Group2020ZWL
Group2019ZWL
As at 1 January - - - -Dividends declared 5 307 862 - 3 100 000 -Dividends paid (5 307 862) - (3 100 000) -
- - - -
During the year ended 31 December 2020, the board of directors declared and paid a dividend of ZWL3 100 000 (2019: nil)
2020Company
ZWL
2019Company
ZWL
2020Company
ZWL
2019Company
ZWLAs at 1 January - - - -Dividends declared 5 307 862 - 3 100 000 -Dividends paid (5 307 862) - (3 100 000) -
- - - -
During the year ended 31 December 2020, the board of directors declared and paid a dividend of ZWL3 100 00 (2019: nil).
38 CONTINGENT ASSETS
The Group has had a 49% shareholding in the Zimbabwe United Passenger Company (Private) Limited (“ZUPCO”) since 1993. In2000, the Group expressed intention to exit ZUPCO through disposal of its shareholding to the majority shareholder, the Government of Zimbabwe. It was agreed that a valuation of the 49% shareholding be performed for the determination of the consideration. However, neither the valuation nor an agreement of sale was concluded. The investment in ZUPCO was impaired in 2000 from the Group’s financial statements from then. Negotiations are ongoing between the board and the majority shareholder to determine the value of the investment in ZUPCO.
157
ZIMRE HOLDINGS LIMITED 2020 ANNUAL REPORT
NOTES TO THE FINANCIAL STATEMENTSFOR THE YEAR ENDED 31 DECEMBER 2019 (continued)
39 Impact of COVID 19 pandemicThere was a resurgence of the COVID-19 pandemic towards the end of year and at the beginning of 2021 leading to the imposition of lockdowns in many countries in which the Group has operations and sources of business but there was minimum impact on Group’s business. Notwithstanding this, the COVID-19 situation is still evolving making it difficult to quantify the full actual and potential financial impact on the Group’s business operations in both the domestic and regional economies. The Group will continue to monitor developments in each jurisdiction and business operations and take appropriate measures to mitigate any emerging risks. The Group has put in place adequate mitigatory measures to minimise the impact of COVID-19 on business which in the opinion of the directors will safeguard its going concern status.Suspension and resumption of trading on the Zimbabwe Stock Exchange On 28 June 2020, the Zimbabwe Stock Exchange Limited (“ZSE”) announced the suspension of trading following a directive from the Government of Zimbabwe. Following the engagements between the ZSE and the Ministry of Finance and Economic Development, the local bourse resumed trading effective 03 August 2020 with the exception of the following three counters in which the Group holds investments either directly or indirectly:• Old Mutual Zimbabwe;• PPC Limited and• Seed Co International LimitedSubsequent to year end, the suspension on Seed Co International Limited was lifted and the counter was re-listed. However, Old Mutual Zimbabwe and PPC Limited remain suspended and the Group will continue to assess the situation and take appropriate measures to mitigate any emerging risks.
40 EVENTS AFTER THE REPORTING DATE40.1 On 26 May 2021, the Government issued Statutory Instrument (“SI”) - 27 Presidential Powers (Temporary Measures) (Financial Laws
Amendment) Regulations, 2021 which seeks to instill discipline in the foreign exchange market by imposing fines on individuals and corporates who fail to adhere to Government Policy on foreign exchange. As a law abiding corporate citizen, the Group will comply with these foreign exchange laws.However, the introduction of these regulations has created uncertainty in the economy in general. The Group will monitor developments and take appropriate action to mitigate any emerging risks.
40.2 New COVID-19 pandemic lockdown measuresIn response to the advent of the second wave of the COVID-19 pandemic, the Government of Zimbabwe introduced a national lockdown in January 2021. Although the restrictions had been partially relaxed, the threat of as third wave of the pandemic has led to the imposition of another lockdown effective June 2021.Although the pandemic and the lockdown period are expected to negatively impact on business growth, insurance claims, investment and property values and returns, this is still an evolving issue whose full financial implications can not be determined with certainty as of the date of signing of these financial statements. The Group will continue to monitor developments in each jurisdiction and business operation and take appropriate measures to mitigate any emerging risks.
40.3 Declaration of dividendOn 9 June 2021, the Directors of the Company declared a dividend of ZWL30 million for the year ended 31 December 2020.

158
ZIMRE HOLDINGS LIMITED 2020 ANNUAL REPORT
SHAREHOLDERS ANALYSIS31 December 2020 31 December 2019
HOLDER NAMENUMBER OF
SHARES
PERCENTAGEOF TOTAL
OF ISSUEDSHARES HOLDER NAME
NUMBERS OFSHARES
PERCENTAGEOF TOTAL
OF ISSUEDSHARES
DAY RIVER CORPORATION (PRIVATE) LIMITED
614,769,314 33.81 DAY RIVER CORPORATION (PRIVATE) LIMITED
614 769 314 40.09
GOVERNMENT OF ZIMBA-BWE
331,728,844 18.24GOVERNMENT OF ZIMBABWE
331 728 844 21.63
NSSA-NATIONAL PENSION SCHEME
257,088,408 14.14 NATIONAL SOCIAL SECURITY AUTHORITY
203 905 526 13.30
LALIBELA LIMITED-NNR 157,498,202 8.66 LALIBELA LIMITED-NNR 157 498 202 10.27
NSSA-WORKERS COMPENSA-TION IF
88,655,034 4.88 NICKDALE ENTERPRISES (PVT) LTD
68 123 292 4.44
NICKDALE ENTERPRISES (PVT) LTD
68,123,292 3.75 NSSA-WORKERS COMPENSA-TION IF
53 005 462 3.46
STANBIC NOMINEES 110008040010
44,204,469 2.43 LOCAL AUTHORITIES PENSION FUND
34 788 794 2.27
NATIONAL SOCIAL SECURITY AUTHORITY
38,602,044 2.12 VON SEIDEL-NNR RICHARD JOHN
8 535 224 0.56
LOCAL AUTHORITIES PEN-SION FUND
34,798,935 1.91 MARIOT COMPUTING AND MANAGEMENT SERVICES (PVT)
LTD
6 259 711 0.41
MEGA MARKET (PVT) LTD 10,756,601 0.59 TEMBO SOLOMON 4 588 775 0.30
ZESA PENSION FUND 10,495,087 0.58 GURAMATUNHU FAMILY TRUST
3 758 894 0.25
LHG MALTA HOLDINGS LIMITED
9,749,649 0.54 OLD MUTUAL LIFE ASSURANCE OF ZIMBABWE LIMITED
3 593 205 0.23
VON SEIDEL-NNR RICHARD JOHN
8,535,224 0.47MEGA MARKET (PVT) LTD
3 204 719 0.21
GURAMATUNHU FAMILY TRUST
7,271,463 0.40 MEALCRAFT INVESTMENTS (PVT)LTD
2 596 040 0.17
SCB NOMINEES 033667800001 6,232,183 0.34 MUNSTER INVESTMENTS (PVT) LTD
2 285 052 0.15
MARIOT COMPUTING AND MANAGEMENT SERVICES (PVT) LTD
5,657,228 0.31STANBIC NOMINEES(PVT)LTD
NNR AC 140043470002
2 221 855 0.14
STANBIC NOMINEES (PVT)LTD-A/C 140043470003
4,494,136 0.25 SALISBURY GENERAL INVEST-MENTS CO P/L
2 183 668 0.14
TRIANGLE MONEY PLAN PENSION FUND-IMARA A/C 110008090006
3,955,894 0.22
ANDERSON ROBERT
1 920 161 0.13
HIPPO VALLEY ESTATES PF-IMARA
3,883,988 0.21 REMO INVESTMENT BROKERS (PVT) LTD
1 489 972 0.10
OLD MUTUAL LIFE AS-SURANCE OF ZIMBABWE LIMITED
3,657,984 0.20KUMALO BENJAMIN NKOSENT-
YA
1 031 315 0.07
1,710,157,979 94.06 1,507,488,025 98.31
108,060,807 5.94 25,850,912 1.69
1,818,218,786 100 1,533,338,937 100
SHARE MOVEMENTSNSSA increased its shareholding from 13.30% in 2019 to 14.14% in 2020.NSSA-Workers Compensation increased its holding during the period under assessment from 3.46% in 2019 to 4.88% in 2020.Mariot Computing and Management services shareholding depleted to 0.31% in 2020 from 0.41% in 2019.Guramatunhu Family Trust’s shareholding added 0.15% to close the year 2020 at 0.4% compared to 0.25% in 2019. Mega Market augmented its shareholding to 0.59% in 2020 from 0.21% in 2019.

159
ZIMRE HOLDINGS LIMITED 2020 ANNUAL REPORT
NOTICE OF ANNUAL GENERAL MEETING
Notice is hereby given that the 23rd Annual General Meeting (AGM) of members will be held virtually using the following zoom meeting I.D. 94244468268 on the 11th of August 2021 at 10.00 hours, to consider the following business:
ORDINARY BUSINESS1. Financial Statements
To receive, consider and adopt the Financial Statements for the year ended 31 December 2020 together with the Report of the Directors and Auditors thereon.
2. Corporate Governance StatementTo receive, consider and approve the Corporate Governance Statement for the period 1 January 2020 to 31 December 2020.
3. Dividend To sanction the ZWL30 000 000 dividend paid to shareholders in accordance with Article 99 of the Company’s Articles of Association.
4. Directoratea) To re-elect Mr. Desmond Matete who was appointed on 12 April 2021 in terms of
Article 82 of the Company’s Articles of Association.Mr. Matete is the Managing Director of New Frontier Capital, a local financial advisory and consulting services firm which he co-founded in 2013. He is an accomplished commercial lawyer and banker with over 26years experience in financial advisory services, investment banking and a development finance specialist. He is a Candidate – Master of Commerce degree in Development Finance with the University of Cape Town Graduate School of Business. He holds directorships with Financial Securities Exchange (Finsec); Mosi oa Tunya Development Company, Zambezi Society and Chapman Golf Club, as non-executive director.
b) To re-elect Mr. Cron von Seidel who retires by rotation in terms of Article 75 of the Company’s Articles of Association, and being eligible, offers himself for re-election.Mr. von Seidel holds a Bachelor of Business Science degree, specializing in Finance. He has over 22 years’ experience in Corporate Finance and Investment Banking and has been involved in a number of fundraising initiatives, acquisitions, disposals, company restructuring, valuations and private equity investments. He is based in Cape Town and currently managing and advising on listed and private investments. He is a member of the Institute of Chartered Accountants (England and Wales).
c) To re-elect Mr. Ignatius Mvere who retires by rotation in terms of Article 75 of the Company’s Articles of Association, and being eligible, offers himself for re-election.Mr. Mvere holds a Bachelor of Commerce degree and is presently the Director responsible for Finance and Administration in the Ministry of Finance and Economic Development in Zimbabwe. He has vast experience in Public Finance and sits on the Board of People’s Own Savings Bank (POSB)and Fidelity Life Assurance Company of Zimbabwe Limited. He is a registered Public Accountant (Zimbabwe).
d) To re-elect Mr. Mark John Haken who retires by rotation in terms of Article 75 of the Company’s Articles of Association, and being eligible, offers himself for re-election.Mr. Haken is a seasoned and professional insurance practitioner. He has a wealth of experience, expertise in insurance and related disciplines, acquired over a period of 40 years in a variety of roles across geographies and industries. He is currently the Managing Director of Emjayaitch Consulting (Pty) Limited and shareholder of Cotsworld Consulting (Pty) Limited, both domiciled in South Africa.
5. Directors RemunerationTo approve the remuneration of the Directors amounting to ZWL7 054 986 for the year ended 31 December 2020.(NOTE In terms of Practice Note 4 issued by the Zimbabwe Stock Exchange on the 17th of January 2020, the ZHL Directors Remuneration Report shall be available for inspection at the Company’s registered office during the Annual General Meeting.)
6. Independent Auditor Fees To approve the remuneration of the Independent Auditor, PricewaterhouseCoopers Chartered Accountants (Zimbabwe), amounting to ZWL3 247 501 for the year ended 31 December 2020.
7. Appointment of Independent AuditorTo appoint Messrs Grant Thornton Chartered Accountants (Zimbabwe) as the Independent Auditor for the Company for the ensuing year until the conclusion of the next Annual General Meeting.(NOTE In terms of section 191 of the Companies and Other Business Act [Chapter 24:31] no person shall serve as an auditor of a company for more than five consecutive financial years. PricewaterhouseCoopers Chartered Accountants (Zimbabwe) have served as the Company’s Independent Auditors since 2016.)
SPECIAL BUSINESS8. General Authority to buy back shares
As an Ordinary ResolutionSubject to the requirements of the Companies and Other Business Entities Act [Chapter 24:31] and Zimbabwe Stock Exchange, the Directors be and are hereby authorised to renew the authority granted on 14 August 2020, to buyback the Company’s issued ordinary shares subject to the following terms and conditions:
(i) That the purchase price shall not be lower than the nominal value of the Company’s shares and not greater than 5% or lower than 5% of the weighted average trading price of the ordinary shares five (5) business days immediately preceding the date of the repurchase of such shares.
(ii) The maximum number of shares that may be acquired shall not exceed 10% (ten percent) of the company’s issued ordinary share capital.
(iii) That this authority shall expire on the date of the next Annual General Meeting of the Company and shall not extend beyond 15 (fifteen) months from the date of the resolution.
(iv) That the shares repurchased may be held for treasury purposes or cancelled as may be decided by the Board of Directors from time to time.
9. Placing of authorised unissued shares under the control of the Directors As an Ordinary Resolution
“The Company be and is hereby authorised to place its authorised unissued ordinary shares, under the control of Directors, until the next Annual General Meeting, to be issued, subject to the requirements of the Company’s Memorandum of Articles of Association and the Zimbabwe Stock Exchange Listing Requirements.”(The proposal will enable the Directors to undertake key transactions which transactions will be in accordance with section 309 (2) of the ZSE Listing Requirements, which requires that the Directors consult the ZSE prior to issuing the shares under their control, and complying with any instruction given by the ZSE regarding such issue.)
10. Employee Share Option Scheme To consider and, if thought fit, to pass the following resolution as an ordinary resolution of the Company:(a) “That the 2021 ZHL Share Appreciation Scheme be and is hereby approved
and granted(b) That in accordance with the applicable provisions (if any) of the Companies and
Other Business Entities Act [Chapter 24:31], the Zimbabwe Stock Exchange Listing Requirements (Statutory Instrument 134 of 2019) and the Company’s Articles of Association, the Board of Directors be and are hereby authorised to offer and issue, for a period of 5 years, up to 90 932 745 authorised but unissued ZHL shares to employees of the ZHL Group in terms of the 2021 ZHL Share Appreciation Scheme.
(c) That the Board of Directors be and are hereby authorised to allot and cause to be listed such number of ordinary shares as may be required from time to time in pursuance of the 2021 ZHL Share Appreciation Scheme , and the ordinary shares so issued and allotted will rank pari passu with the existing shares of the Company.”(The Directors of ZHL are proposing that the Company sets up the 2021 Share Appreciation Scheme as a method of aligning the Group’s employees to its strategic goals while merging employee and shareholder interests. 90 932 745 ZHL authorised but unissued shares will be set aside for the scheme for a period of 5 (five) years. The number of shares set aside constitutes 5% of the Company’s issued share capital as at 31 December 2021. The Directors are of the opinion that the dilutive effects of the Share Appreciation Scheme are more than offset by the benefits to be accrued. The 2021 ZHL Share Appreciation Scheme rules will be available for inspection by members at the registered office of the Company.)
11. Any other businessTo transact all such other business as may be transacted at an Annual General Meeting.
(Registration number 2873/98 and Certificate of Change of Name dated 14/01/03)
EXPLANATORY NOTE:-TO THE GENERAL AUTHORITY TO BUY BACK SHARES The Directors, in considering the effect of the purchase above, have reviewed the Company’s budget and cash flow forecast for the period of twelve months after date of notice convening the Annual General Meeting. On the basis of this review, the Directors are satisfied that:
• The Company is in a strong financial position and will, in the ordinary course of business, be able to pay its debts for the period of twelve (12) months after the Annual General Meeting;
• The assets of the Company will be in excess of its liabilities for a period of twelve (12) months after the Annual General Meeting;
• The ordinary capital and reserves of the Company will be adequate for a period of twelve (12) months after the Annual General Meeting, and
• The working capital will be adequate for a period of twelve (12) months after the Annual General Meeting.
By order of the Board
R Chidora Group Legal Executive/Company Secretary
2nd Floor, Block D, Smatsatsa Office Park, Borrowdale Harare | Tel: +263 (242) 870 762-8 | Email: [email protected] | Website: www. zhl.co.zw
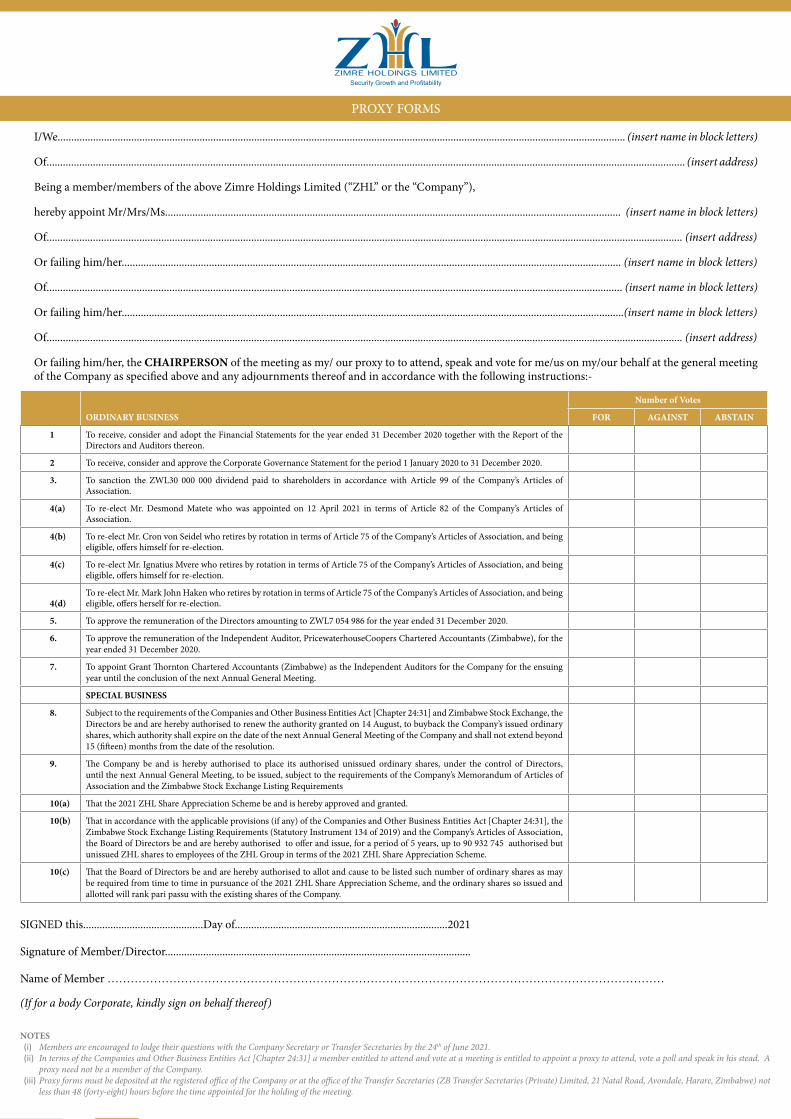
160
ZIMRE HOLDINGS LIMITED 2020 ANNUAL REPORT
I/We................................................................................................................................................................................................................ (insert name in block letters)
Of.......................................................................................................................................................................................................................................... (insert address)
Being a member/members of the above Zimre Holdings Limited (“ZHL” or the “Company”),
hereby appoint Mr/Mrs/Ms....................................................................................................................................................................... (insert name in block letters)
Of......................................................................................................................................................................................................................................... (insert address)
Or failing him/her....................................................................................................................................................................................... (insert name in block letters)
Of................................................................................................................................................................................................................... (insert name in block letters)
Or failing him/her........................................................................................................................................................................................(insert name in block letters)
Of......................................................................................................................................................................................................................................... (insert address)
Or failing him/her, the CHAIRPERSON of the meeting as my/ our proxy to to attend, speak and vote for me/us on my/our behalf at the general meeting of the Company as specified above and any adjournments thereof and in accordance with the following instructions:-
PROXY FORMS
ORDINARY BUSINESS
Number of Votes
FOR AGAINST ABSTAIN
1 To receive, consider and adopt the Financial Statements for the year ended 31 December 2020 together with the Report of the Directors and Auditors thereon.
2 To receive, consider and approve the Corporate Governance Statement for the period 1 January 2020 to 31 December 2020.
3. To sanction the ZWL30 000 000 dividend paid to shareholders in accordance with Article 99 of the Company’s Articles of Association.
4(a) To re-elect Mr. Desmond Matete who was appointed on 12 April 2021 in terms of Article 82 of the Company’s Articles of Association.
4(b) To re-elect Mr. Cron von Seidel who retires by rotation in terms of Article 75 of the Company’s Articles of Association, and being eligible, offers himself for re-election.
4(c) To re-elect Mr. Ignatius Mvere who retires by rotation in terms of Article 75 of the Company’s Articles of Association, and being eligible, offers himself for re-election.
4(d)
To re-elect Mr. Mark John Haken who retires by rotation in terms of Article 75 of the Company’s Articles of Association, and being eligible, offers herself for re-election.
5. To approve the remuneration of the Directors amounting to ZWL7 054 986 for the year ended 31 December 2020.
6. To approve the remuneration of the Independent Auditor, PricewaterhouseCoopers Chartered Accountants (Zimbabwe), for the year ended 31 December 2020.
7. To appoint Grant Thornton Chartered Accountants (Zimbabwe) as the Independent Auditors for the Company for the ensuing year until the conclusion of the next Annual General Meeting.
SPECIAL BUSINESS
8. Subject to the requirements of the Companies and Other Business Entities Act [Chapter 24:31] and Zimbabwe Stock Exchange, the Directors be and are hereby authorised to renew the authority granted on 14 August, to buyback the Company’s issued ordinary shares, which authority shall expire on the date of the next Annual General Meeting of the Company and shall not extend beyond 15 (fifteen) months from the date of the resolution.
9. The Company be and is hereby authorised to place its authorised unissued ordinary shares, under the control of Directors, until the next Annual General Meeting, to be issued, subject to the requirements of the Company’s Memorandum of Articles of Association and the Zimbabwe Stock Exchange Listing Requirements
10(a) That the 2021 ZHL Share Appreciation Scheme be and is hereby approved and granted.
10(b) That in accordance with the applicable provisions (if any) of the Companies and Other Business Entities Act [Chapter 24:31], the Zimbabwe Stock Exchange Listing Requirements (Statutory Instrument 134 of 2019) and the Company’s Articles of Association, the Board of Directors be and are hereby authorised to offer and issue, for a period of 5 years, up to 90 932 745 authorised but unissued ZHL shares to employees of the ZHL Group in terms of the 2021 ZHL Share Appreciation Scheme.
10(c) That the Board of Directors be and are hereby authorised to allot and cause to be listed such number of ordinary shares as may be required from time to time in pursuance of the 2021 ZHL Share Appreciation Scheme, and the ordinary shares so issued and allotted will rank pari passu with the existing shares of the Company.
SIGNED this............................................Day of..............................................................................2021
Signature of Member/Director................................................................................................................
Name of Member ………………………………………………………………………………………………………………………………
(If for a body Corporate, kindly sign on behalf thereof)
NOTES(i) Members are encouraged to lodge their questions with the Company Secretary or Transfer Secretaries by the 24th of June 2021. (ii) In terms of the Companies and Other Business Entities Act [Chapter 24:31] a member entitled to attend and vote at a meeting is entitled to appoint a proxy to attend, vote a poll and speak in his stead. A
proxy need not be a member of the Company.(iii) Proxy forms must be deposited at the registered office of the Company or at the office of the Transfer Secretaries (ZB Transfer Secretaries (Private) Limited, 21 Natal Road, Avondale, Harare, Zimbabwe) not
less than 48 (forty-eight) hours before the time appointed for the holding of the meeting.


2nd Floor, Block DSmatsatsa O�ce ParkBorrowdale, Harare.
Tel: +263 (242) 870 762-8Email: [email protected]