Zimbabwe Vulnerability Assessment Committee (ZimVac
29
ZIMBABWE Vulnerability Assessment Committee VAC Zimbabwe Vulnerability Assessment Committee (ZimVac) Interim Rural Food Security Assessment May 2009
Transcript of Zimbabwe Vulnerability Assessment Committee (ZimVac

ZIMBABWE Vulnerability
Assessment Committee
VAC
Zimbabwe Vulnerability Assessment Committee
(ZimVac) Interim Rural Food Security
Assessment
May 2009

2
Co-ordinated by the Scientific Industrial Research and Development’s
(SIRDC) Food and Nutrition Council (FNC). Number 1574 Alpes Rd
Hatcliff Harare.
Telephone: +263 4 862586

3
ACKNOWLEDGEMENTS The assessment was made possible through the financial, in-kind and technical contributions made by the Government of Zimbabwe (Scientific and Industrial Research Development Centre –Food and Nutrition Council, Ministry of Agriculture – AGRITEX, Ministry of Public Service Labour and Social Welfare, Ministry of Local Government, Public Works and Urban Development, Ministry of Health, Ministry of Education and the Central Statistics Office), UN Agencies (FAO,WFP and OCHA) and non-state institutions (Famine Early Warning Systems Network, World Vision and USAID Food for Peace. National and provincial facilitators for the Interim Rural Food Security Assessment were drawn from these agencies. ZimVAC acknowledges all the invaluable support from these organizations. ZimVAC would also like to acknowledge the support of the district and provincial officials, from both Government and Non-Governmental Organisations, who participated actively in the district focus group discussions. This assessment would not have been possible without their corporation, knowledge and participation.

4
TABLE OF CONTENTS 1. Introduction and Background .................................................................... 5
2. Methodology................................................................................................. 6
3. National Food Security Profile for the 2009/10 Consumption Year....... 7
4 Current Cereal Markets .............................................................................. 11
5 Livestock Prices .......................................................................................... 12
6. Potential Hazards to Food Access in the 2009/10 Consumption Year
........................................................................................................................... 13
7. Conclusions and Recommendations...................................................... 14
8.1 Immediate/Short Term ......................................................................... 14
8.2 Medium to Long Term .......................................................................... 15
Appendix 1: Average Household Cereal Production, Projected Cereals
from Other Income Sources and Expected Cereal access Deficits ...... 17
Appendix 2: Maize and Livestock Prices in the Period 23 – 30 April 2009
........................................................................................................................... 18
Appendix3: Provincial Food Security Profiles for the 2009/10
Consumption Year compared to 2008/09 Consumption year................ 21

5
1. Introduction and Background The Zimbabwe Vulnerability Assessment Committee (ZimVAC) has carried annual household surveys to understand the food security situation for rural households in Zimbabwe since 2002. The surveys took place between May and August and were relatively heavy in terms of financial, human and transport resources requirements. In 2008, the rural household food security assessment survey was crowded out by the presidential elections. Demands for food security information by various agencies that had come to rely on the ZimVAC rural food security assessments prompted the Committee to come up with an alternative assessment approach that was feasible given the resource and logistical challenges that prevailed then. The strategy, then, was providing a preliminary food security picture for the rural areas that could be used for programming, in the meantime, and then conduct the usual household rural food security survey when conditions were permitting. As such ZimVAC decided to call the assessment the Interim Rural Food Security Assessment and it was conducted in August 2008. The main report of this assessment presented food security profiles of all the country’s rural districts in an atlas format. It was well received and formed the basis of the 2008/09 consumption year food assistance programming. The success of the 2008 interim rural food security assessment encouraged ZimVAC to adopt the interim assessment approach as an annual activity preceding the household rural food security survey. The 2009 Interim Rural Food Security Assessment was carried out in April 2009 with the following objectives;
� To establish the average household food access picture for each rural ward in all rural districts of Zimbabwe.
� To identify geographic hot spots in which household food access challenges are likely to be experienced during the 2009/10 consumption year.
� To identify and assess household and community coping strategies that were being employed in cases were food access challenges were already being experienced
� To identify and assess food assistance, district by district, that are currently taking place.
� To identify and assess the functioning of current and appropriate staple cereals’ markets for cereal deficit households in rural districts of Zimbabwe.
� To develop recommendations of what could be done to address food security challenges in rural districts in the short term and the medium to long term.

6
This report presents the national and the provincial food security profiles for the 2009/10 consumption year. 2. Methodology The Interim Rural Food Security Assessment was designed to capture a food security picture of most households within a given rural ward through the eyes and experiences of knowledgeable district level key informants in district focus group discussions (FGDs). The assessment recognizes food security as one of the key livelihoods outcomes of rural households in Zimbabwe and it used cereal access as a proxy for food security. In the FGDs, held in each of Zimbabwe’s 59 rural districts and facilitated by national facilitators with the support of provincial facilitators, broad livelihoods patterns and activities for most households in each rural ward in the districts were identified and their usual and current contribution to annual household cereal requirements was analyzed. This process culminated in the estimation of:
� The contribution of own cereals production to annual household requirements for most households in each ward.
� The contribution of other income source (excluding own cereal production) to the cereal requirements of most households in each ward.
� Using the above two estimates the potential cereal access, and conversely the annual cereal deficit, of most households in each ward was estimated and mapped out.
Cereal markets in each rural district were identified and analyzed in terms of market importance, cereal availability and cereal prices. Livestock prices (cattle, goats and chickens) were collected at district level and these were reduced to maize price equivalence to allow for spatial price difference analysis as well as the computation of livestock to maize terms of trade. Factors that are likely to worsen the food access by most households in the district were identified and discussed during the district FGDs. So were the measures that were being undertaken at district level to address the food access problems most rural households were facing. The FGDs finished by identifying district priority measures that could be undertaken immediately or in the short to medium term to address the district food insecurity problems. When all FGDs were completed a synthesis of their findings was compiled into draft provincial food security profiles which were presented to selected provincial government representatives as a basis for obtaining their insights and contribution to the food security

7
assessment of their province. A few district food security profiles were adjusted as a result of these provincial consultations. The provincial food security profiles were synthesized to produce the national food security picture for the rural areas of Zimbabwe. 3. National Food Security Profile for the 2009/10 Consumption Year Generally, there was an improvement in household cereal production in the 2008/09 agricultural season compared to the 2007/08 season in most rural districts and this is estimated to contribute to a marked improvement in household cereal access for the 2009/10 consumption year (figure 1). The first part of Figure 1 compares average rural households cereal production (computed in months of household consumption) for the 2008/09 agricultural season to that for the 2007/08. The second part of the figure depicts the average household cereal access deficit estimated to remain when own household cereal production and the likely contribution of other income sources to household cereal access are taken into account; overall household cereal access deficit. Figure1: Own Household Cereal Production and Overall Cereal Access Deficits for the 2009/10 Consumption Year Compared to the 2008/09
2.8
5.95.7
3.8
0
1
2
3
4
5
6
7
Household Own Cereal Production Overall Household Cereal Deficit
Hous
ehol
d Ce
real
Pro
duct
ion/
Cere
al A
cces
s De
ficit
(mon
ths)
2008/09 2009/10
The most common other income sources deemed to be available to most households across all districts in the 2009/10 consumption year are similar to those for the previous consumption year. They include;
o Casual labour o Market gardening o Sale of non food crops such as tobacco and cotton

8
o Livestock sales and bartering o Gold panning o Remittances; most pronounced in districts closer to the
borders with South Africa and Botswana o Fishing near lakes, rivers and dams o Petty trading o Fruit sales; most pronounced in Mutasa and Chimanimani
districts o Non agricultural employment
Average household cereal production increased from about three months of household requirements last year to about six months in the current year. Overall household cereal access deficits are projected to drop from an average of six months of household requirements to four months in the current consumption year (figure 1). Despite the generally stable food security situation attaining at the time of this assessment in all rural districts, chronically food insecure households were reported to be facing food access challenges in all rural districts. These households are dependent on or comprise of the aged, physically and mentally disabled, the chronically ill and orphans without any support system. Special food assistance is required for these people in areas they are most concentrated; the communal areas, defunct mines and farm worker compounds within areas with limited work opportunities. The highest district average household cereal production in 2008/09 ranged from 7-10 months of household consumption and these were in Bindura and Chipinge districts. Table 1: Rural Districts with the Highest Average Household Cereal Production in 2008/09 Agricultural Season Province District Average
Household Cereal Production in 2008/09 Agricultural Season (in months)
Average Most likely contribution of other incomes to 2009/10 household cereal consumption ( in months)
Average Household Cereal Access Deficit for the 2009/10 consumption
Mash Central Bindura 10 1 1 Manicaland Chipinge 10 1 1 Masvingo Chiredzi 9 1 2 Mash West Zvimba 9 3 0 Mash West Kadoma 9 2 1 Midlands Chirumanzu 8 2 2 Mat South Insiza 8 2 2 Masvingo Chivi 8 2 2

9
Mash West Makonde 8 2 2 Mat South Umzingwane 8 3 1 Mash Central Guruve 8 2 2 Midlands Mberengwa 8 2 2 Midlands Shurugwi 7 3 2 Mat South Bulilima 7 2 3 Mash Central Mbire 7 3 2 Mash Central Mazowe 7 4 1 Mash East Goromonzi 7 3 2 Mash West Chegutu 7 3 2
While the usual best agricultural districts are amongst the best performing districts in the 2008/09 agricultural season, an unusually good rainfall season quality experienced in the central and southern parts of the country resulted in above normal household cereal production in Bulilima, Mberengwa, Chivi, Chipinge and Chiredzi districts. The districts with the highest average household cereal production are also amongst the ones with the lowest overall household cereal access deficits after considering the contribution of other income sources. The lowest district average household cereal production in 2008/09 agricultural season were 1-4 months of household requirements. Most of the districts with such low average household cereal production are the usually low cereal production districts and most of them were affected by a prolonged dry spell that occurred in February 2009. Highest average household cereal access deficits were found in these districts ( table 2). Table 2: Rural Districts with the Lowest Average Household Cereal Access Province District Average
Household Cereal Production in 2008/09 Agricultural Season (in months)
Average Most likely contribution of other incomes to 2009/10 household cereal consumption ( in months)
Average Household Cereal Access Deficit for the 2009/10 consumption
Mash East UMP 1 1 10 Mash East Mudzi 2 2 8 Mash Central Rushinga 2 2 8 Mash East Mutoko 2 2 8 Manicaland Nyanga 3 3 6 Mat North Nkayi 4 3 5 Mash Mount 4 2 6

10
Province District Average Household Cereal Production in 2008/09 Agricultural Season (in months)
Average Most likely contribution of other incomes to 2009/10 household cereal consumption ( in months)
Average Household Cereal Access Deficit for the 2009/10 consumption
Central Darwin Manicaland Chimanimani 4 3 5 Mat North Lupane 4 4 4 Mash East Hwedza 4 1 7 Manicaland Mutare 4 3 5 Manicaland Makoni 4 2 6 Masvingo Gutu 4 2 6 Mash East Murehwa 4 2 6 Mash East Seke 4 2 6
About 72 percent of the rural districts had average household cereal production of 1-3 months in 2007/08 agricultural season, whereas in the 2008/09 agricultural season over 60 percent of the rural districts had most of their households producing cereals enough to last 4-6months of household cereal requirements (figure 2). Figure 2: Average Household Cereal Production in 2008/09 Agricultural Season Compared to the 2007/08 Season by Rural Districts.
0
10
20
30
40
50
60
70
80
1-3 4-6 7-9 10-11 12+
Average Household Cereal Production(in months)
Perc
ent o
f Tot
al R
ural
Dis
trict
s(%
)
2007/08 2008/09
Overall household cereal access deficits are projected to be less this consumption year( 2009/10) compared to the last (2008/09) (figure 3). Projected average household cereal access deficits for about 45 percent of the rural districts are estimated to be in the lower range of 1-3months in the 2009/10 consumption year. This number was just about

11
12 percent in the previous consumption year. In the 2008/09 consumption year about 88 percent of the rural districts were estimated to have average household cereal access deficits greater than four months. Figure 3: Average Cereal District Cereal Assess Deficits for the 2008/09 consumption Year Compared to that for the 2009/10 Year
Most households in Bindura, Zvimba, Mazowe and Umzingwane are expected to have no cereal access challenges in the 2009/10 consumption year provided no hazards occur to reduce the expected cereal harvests and other household income sources in the districts. Last year no such districts could be found; all districts had most of their households facing cereal access deficit. Districts with low household own cereal production seemed to have highest average cereal deficits; Mudzi, Rushinga, Mutoko and Mt Darwin. Overall household average cereal access deficits are estimated to be more pronounced in communal farming areas than any other farming sector across the whole country. 4 Current Cereal Markets Rural households that did not produce enough food for the 2009/10 consumption year and have the income will necessarily be dependent on the market to satisfy their needs. The most common cereal markets that were observed in all the districts included local shops, farmer to farmer, the Grain Marketing Board(GMB) and millers.

12
Shops located in urban centres, growth points and service centres within rural districts were reported to be the main source of maize meal and the commodity was readily available at the time of this assessment. The maize meal prices ranged from ZAR1 3.00-10.00/kg and averaged ZAR5.00/kg at the time of the assessment. The highest maize meal prices were reported in Shamva, Tsholotsho and Nyanga districts and the lowest prices were in Mazowe, Mt Darwin and Mbire. Millers were supplying mealie meal in some districts at prices that ranged from ZAR 3.20-4.00/kg. Farmer to farmer maize grain transactions were common in all districts and the maize grain was readily available on this market. Prices of maize grain ranged from ZAR 1.10 - 5.60/kg and averaged ZAR 2.70/kg across all rural districts. While the lowest prices of maize grain were reported in Gokwe North and South and Chegutu districts, the highest prices were prevailing in Mutare, Hwange, Umzingwane, Tsholotsho and Shamva districts. The GMB was not an active source of maize grain or flour during the time of the assessment. Only six rural districts had depots that were selling maize grain and maize meal to the public for about ZAR 3.20/kg and ZAR 3.60/kg, respectively. Most depots have been without maize grain/meal since December 2008. It is of great concern that highest maize grain prices were reported in UMP and Rushinga yet the majority of households in these districts are projected to have overall cereal access deficits of between 8-10 months in the 2009/10 consumption year. It is surprising that Mtoko district reported the lowest maize grain prices while it is projected to have a relatively high average household cereal access deficit of seven months; this warrants further investigation. 5 Livestock Prices Some cereal deficit households either directly exchange their livestock (cattle, goats and chicken) for grain or they sell their livestock for cash which in turn is used to buy grain. Cattle prices were found to range from ZAR 800 -3,000/beast. The most common range was ZAR1000 – 1500. The highest prices of ZAR2000 -2500 were reported in Kariba, Kadoma and Bikita districts. In most districts cattle were fetching below the normal exchange rate of one tonne of maize grain; only 11 of the 59 rural districts (Table 3), had cattle maize equivalents greater than the one tonne threshold.
1 South African Rand is converted at a rate of ZAR10 to 1United States of America Dollar

13
Table 3: Maize Grain, Cattle, Goats and Chicken Prices for Districts with the Highest Cattle Maize Grain Equivalent.
Maize grain Livestock Prices in ZAR Maize Grain equivalent( kg) District ZAR/kg Cattle Goat Chicken Cattle Goat Chicken Bikita 2.22 2500 300 40 1125 135 18 Goromonzi 1.67 2000 400 40 1200 240 24 Hwedza 1.67 2000 200 40 1200 120 24 Mazowe 1.67 2000 200 50 1200 120 30 Mberengwa 1.67 2000 200 25 1200 120 15 Chegutu 1.11 1500 200 60 1350 180 54 Gokwe North 1.11 1500 200 30 1350 180 27 Gokwe South 1.11 1500 100 20 1350 90 18 Chirumhanzu 1.67 2500 400 50 1500 240 30 Gweru 1.67 2500 150 40 1500 90 24 Kadoma 1.67 2500 200 50 1500 120 30
Goat prices ranged from ZAR100-400/goat. and the most common price was ZAR200. The highest goat prices were reported in Goromonzi, Chirumhanzu and Marondera districts. One goat could earn between 27 and 240 kg of maize in April 2009. In about half of the rural districts goats were earning less than the normal 72kg of maize grain and districts with the poorest exchanges of grain for goat are shown in Table 4. Table 4: Maize Grain, Cattle, Goats and Chicken Prices for Districts with the Lowest Goat Maize Grain Equivalent. District Maize
grain (ZAR/kg)
Livestock Prices in (ZAR)
Maize Grain equivalent (kg)
Cattle Goat Chicken Cattle Goat Chicken Shamva 5.56 2,000.00 150 50 360 27 9 Rushinga 3.89 1,000.00 120 20 257 31 5 Mutare 4.44 1,000.00 150 50 225 34 11 Hwange 4.44 2,000.00 150 40 450 34 9 UMP 4.17 1,000.00 150 30 240 36 7 Tsholotsho 5.56 1,500.00 200 40 270 36 7 Mudzi 2.78 1,000.00 100 20 360 36 7
Chicken prices were ZAR30 in most districts and the highest prices were between ZAR50 and 60/bird. 6. Potential Hazards to Food Access in the 2009/10 Consumption Year

14
Since every rural district will have some cereal production deficits, availability of cereals on the market at affordable price levels will be a key determinant of food security in all rural districts. Any policy measures that reduce maize meal/grain availability and increase prices of the staple cereal to levels higher than they are currently without improving rural income levels will worsen the overall average cereal access deficits in all rural districts. In many rural districts, livestock provide or are the income used to acquire maize grain or meal and other household needs. Factors such as poor livestock marketing arrangements, reduced livestock condition resulting from loss of the fair to good available grazing as well as livestock disease outbreaks could result in much reduced livestock-maize terms of trade. Cereal deficit households dependent on livestock to access food could end up with much higher cereal access deficits. Own crop production of both cash and food crops is also the major source of income used to cover other household basic goods and services. Hence, a sudden increase in the cost of the other essential household goods and services is likely to reduce the purchasing power of the available food income for most households resulting in increased cereal access deficits. The food already secured from own production should be kept in a manner that limits post harvest loss which are known to be quite significant amongst many rural farming households. Rodent, weevils and wild animals can cause serious post harvest crop losses thereby increasing average household deficits. Some of the other income sources some rural households are going to depend on to generate income for food in the 2009/10 consumption year, such as gold panning, hunting, petty trade, are illegal. Heavy policing may reduce these activities resulting in reduced income for food for many households. 7. Conclusions and Recommendations 7.1 Immediate/Short Term Recognising that all rural districts have chronically food insecure people who were facing serious food access challenges at the time of the assessment, urgent attention is required to assist them with food. These people include the aged, physically and mentally disabled, the chronically ill and orphans without any support system. Special food assistance is required for these people in areas they are most

15
concentrated; the communal areas, defunct mines and farm worker compounds within areas with limited work opportunities. Since most rural district households were projected to have cereal harvest deficits and the highest deficits in the communal areas, there is an urgent need to put in place measures that encourage efficient redistribution of domestic harvest from surplus areas to deficit areas, prioritising the communal areas. In addition more cereals (maize and small grains) should be imported to make up for the harvest shortfalls. Government, private and donor partnerships seen in the latter half of the previous consumption year are encouraged here. The role played by the market and the private sector in the last consumption year in the supply of cereals to many parts of the country from November last year cannot be overemphasised. This role should be encouraged in the current consumption year since many households will be dependent on the market for their food needs. In this regard the current policy on importation of maize meal and other basic food stuffs should be maintained. Improved livestock marketing arrangements should be encouraged, particularly in areas with poor links with the wider national economy, to ensure households dependent on livestock for their food income will not be short-changed by unscrupulous traders. Measures to protect the available grazing from veldt fires such as awareness campaigns and construction of fire guards should be promoted immediately. In addition livestock veterinary services need to be improved. Both measures will ensure healthy livestock-cereals terms of trade. 7.2 Medium to Long Term In the medium to long term there is need to strengthen food production and improve rural incomes to address the current food insecurity problem. Key priorities in this regard are; � Better preparation for the coming summer season through measures
that put seeds, fertilizers, fuels, chemicals and other key inputs and implements on the market at prices that are economically viable for both farmers and suppliers.
� Provision of inputs support to poor households without the means to buy their own inputs from the market but with the capacity to effectively use the inputs
� Rehabilitation and construction of irrigations schemes and provision of the necessary management and market intelligence support that make them sustainable entities.

16
� Provision of more effective extension support to all farmers, with special attention on the newly resettled farmers. This in turn requires strengthening of capacities of all Government arms responsible for agricultural extension services.

17
Appendix 1: Average Household Cereal Production, Projected Cereals from Other Income Sources and Expected Cereal access Deficits Province District Averaged
Contribution of 2008/09 Own Cereal Production to 2009/10 Household consumption (in months)
Average Most likely contribution of other incomes sources to 2009/10 Household consumption ( in months)
Average Household Cereal Access Deficit in 2009/10 (months)
Mash West Zvimba 9 3 0 Mat South Unzimngwane 8 4 1 Mash Central Mazowe 7 4 1 Mash Central Bindura 10 1 1 Mat South Gwanda 6 5 1 Manicaland Chipinge 10 1 1 Mash West Kadoma 9 2 1 Midlands Chirumanzu 8 2 2 Mash West Makonde 8 3 1 Masvingo Chiredzi 9 1 2 Manicaland Mutasa 5 5 2 Masvingo Chivi 8 2 2 Mash Central Guruve 8 2 2 Mat South Insiza 8 2 2 Midlands Gokwe South 5 4 3 Midlands Gweru 5 4 3 Midlands Shurugwi 7 3 2 Mash East Goromonzi 7 3 2 Midlands Mberengwa 8 2 2 Mat South Bulim 7 2 3 Mat South Matobo 5 4 3 Mash West Chegutu 7 3 2 Mash Central Mbire 7 3 2 Mat South Beitbridge 6 3 3 Mat North Hwange 6 2 4 Mat North Binga 5 4 3 Mat North Tsholotsho 6 3 3 Manicaland Buhera 6 2 4 Mash Central Shamva 6 2 4 Mash East Chikomba 6 2 4 Masvingo Zaka 6 2 4 Masvingo Bikita 6 2 4 Midlands Zvishavane 6 2 4 Masvingo Masvingo 5 2 5 Mash Central Centenary 5 3 4

18
Province District Averaged Contribution of 2008/09 Own Cereal Production to 2009/10 Household consumption (in months)
Average Most likely contribution of other incomes sources to 2009/10 Household consumption ( in months)
Average Household Cereal Access Deficit in 2009/10 (months)
Masvingo Mwenezi 6 2 4 Mat North Lupane 4 4 4 Midlands Gokwe North 5 2 5 Mat South Mangwe 5 2 5 Mat North Umguza 5 2 5 Mat North Bubi 5 2 5 Midlands Kwekwe 6 1 5 Manicaland Chimanimani 4 3 5 Mash East Marondera 5 2 5 Mash West Hurungwe 6 1 5 Mash East Seke 4 2 6 Manicaland Mutare 4 3 5 Mash West Kariba 5 2 5 Mash East Murehwa 4 2 6 Mat North Nkayi 4 3 5 Masvingo Gutu 4 2 6 Manicaland Makoni 4 2 6 Manicaland Nyanga 3 3 6 Mash Central Mount Darwin 4 2 6 Mash East Hedza 4 1 7 Mash East Mutoko 2 2 8 Mash East Mudzi 2 2 8 Mash Central Rushinga 2 2 8 Mash East UMP 1 1 10
Appendix 2: Maize and Livestock Prices in the Period 23 – 30 April 2009
Livestock Prices ( ZAR)
The Amount of Maize Grain a Beast/Bird Could Buy ( kg)
District
Maize grain (ZAR/kg) Cattle Goat
Chicken Cattle Goat
Chicken
Mutare 4.44 1,000.00 150 50 225 34 11 UMP 4.17 1,000.00 150 30 240 36 7 Rushinga 3.89 1,000.00 120 20 257 31 5 Tsholotsho 5.56 1,500.00 200 40 270 36 7 Mudzi 2.78 1,000.00 100 20 360 36 7 Lupane 3.89 1,400.00 200 30 360 51 8 Shamva 5.56 2,000.00 150 50 360 27 9 Umzingwan 5.56 2,000.00 250 60 360 45 11
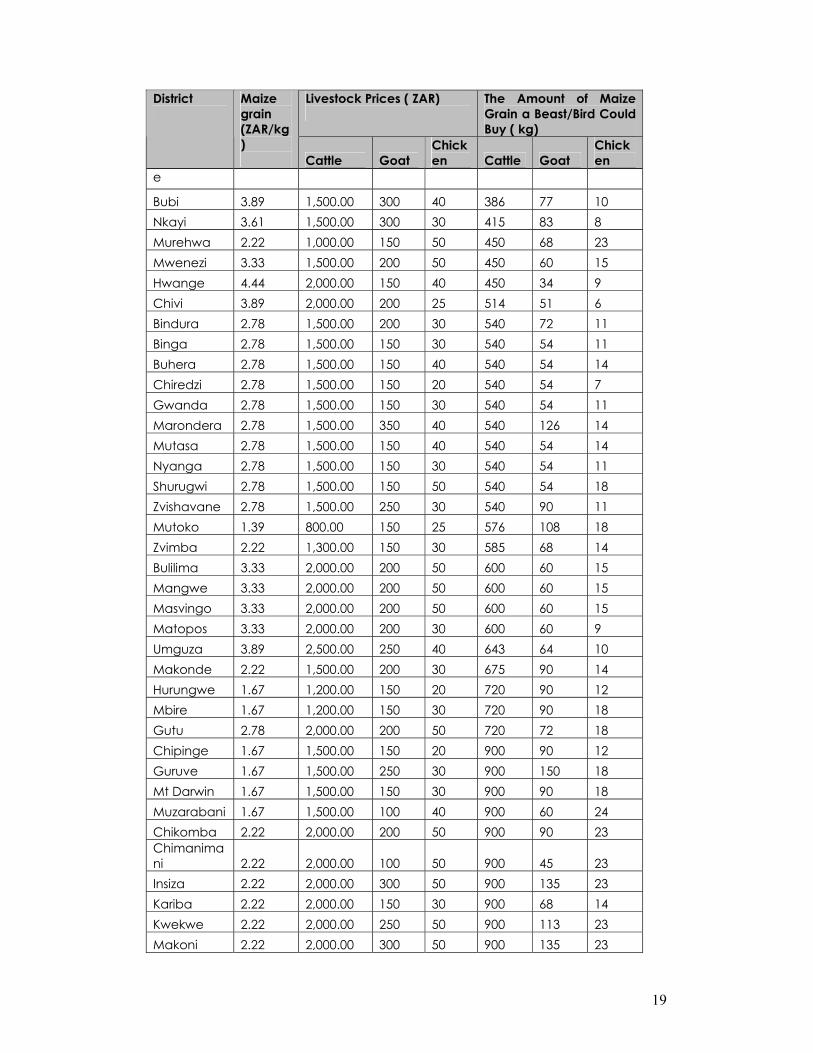
19
Livestock Prices ( ZAR)
The Amount of Maize Grain a Beast/Bird Could Buy ( kg)
District
Maize grain (ZAR/kg) Cattle Goat
Chicken Cattle Goat
Chicken
e
Bubi 3.89 1,500.00 300 40 386 77 10 Nkayi 3.61 1,500.00 300 30 415 83 8 Murehwa 2.22 1,000.00 150 50 450 68 23 Mwenezi 3.33 1,500.00 200 50 450 60 15 Hwange 4.44 2,000.00 150 40 450 34 9 Chivi 3.89 2,000.00 200 25 514 51 6 Bindura 2.78 1,500.00 200 30 540 72 11 Binga 2.78 1,500.00 150 30 540 54 11 Buhera 2.78 1,500.00 150 40 540 54 14 Chiredzi 2.78 1,500.00 150 20 540 54 7 Gwanda 2.78 1,500.00 150 30 540 54 11 Marondera 2.78 1,500.00 350 40 540 126 14 Mutasa 2.78 1,500.00 150 40 540 54 14 Nyanga 2.78 1,500.00 150 30 540 54 11 Shurugwi 2.78 1,500.00 150 50 540 54 18 Zvishavane 2.78 1,500.00 250 30 540 90 11 Mutoko 1.39 800.00 150 25 576 108 18 Zvimba 2.22 1,300.00 150 30 585 68 14 Bulilima 3.33 2,000.00 200 50 600 60 15 Mangwe 3.33 2,000.00 200 50 600 60 15 Masvingo 3.33 2,000.00 200 50 600 60 15 Matopos 3.33 2,000.00 200 30 600 60 9 Umguza 3.89 2,500.00 250 40 643 64 10 Makonde 2.22 1,500.00 200 30 675 90 14 Hurungwe 1.67 1,200.00 150 20 720 90 12 Mbire 1.67 1,200.00 150 30 720 90 18 Gutu 2.78 2,000.00 200 50 720 72 18 Chipinge 1.67 1,500.00 150 20 900 90 12 Guruve 1.67 1,500.00 250 30 900 150 18 Mt Darwin 1.67 1,500.00 150 30 900 90 18 Muzarabani 1.67 1,500.00 100 40 900 60 24 Chikomba 2.22 2,000.00 200 50 900 90 23 Chimanimani 2.22 2,000.00 100 50 900 45 23 Insiza 2.22 2,000.00 300 50 900 135 23 Kariba 2.22 2,000.00 150 30 900 68 14 Kwekwe 2.22 2,000.00 250 50 900 113 23 Makoni 2.22 2,000.00 300 50 900 135 23

20
Livestock Prices ( ZAR)
The Amount of Maize Grain a Beast/Bird Could Buy ( kg)
District
Maize grain (ZAR/kg) Cattle Goat
Chicken Cattle Goat
Chicken
Seke 2.22 2,000.00 250 40 900 113 18 Zaka 2.22 2,000.00 200 40 900 90 18 Beitbridge 3.33 3,000.00 250 50 900 75 15 Bikita 2.22 2,500.00 300 40 1125 135 18 Goromonzi 1.67 2,000.00 400 40 1200 240 24 Hwedza 1.67 2,000.00 200 40 1200 120 24 Mazowe 1.67 2,000.00 200 50 1200 120 30 Mberengwa 1.67 2,000.00 200 25 1200 120 15 Chegutu 1.11 1,500.00 200 60 1350 180 54 Gokwe North 1.11 1,500.00 200 30 1350 180 27 Gokwe South 1.11 1,500.00 100 20 1350 90 18 Chirumanzu 1.67 2,500.00 400 50 1500 240 30 Gweru 1.67 2,500.00 150 40 1500 90 24 Kadoma 1.67 2,500.00 200 50 1500 120 30
21
Appendix 3: Provincial Food Security Profiles for the 2009/10 Consumption Year compared to 2008/09 Consumption year


23

24

25

26

27

28

29