Zignago
27
ZIGNAGO November 2001 ZIGNAGO GROUP www.zignago. com
-
Upload
nirmala-last -
Category
Technology
-
view
399 -
download
1
Transcript of Zignago
ZIGNAGO
November 2001
ZIGNAGO GROUPZIGNAGO GROUP
www.zignago.com
www.zignago.com

ZIGNAGO
2
ZIGNAGO CONSOLIDATED RESULTS
___________________________________________________________________________
THIRD QUARTER 2001AND
YEAR 2000 ___________________________________________________________________________
ZIGNAGO
3
BY SECTOR
1
3
2
BY SECTOR
1
3
2
BY GEOGRAPHIC AREA
4
53
21
BY GEOGRAPHIC AREA
4
53
21
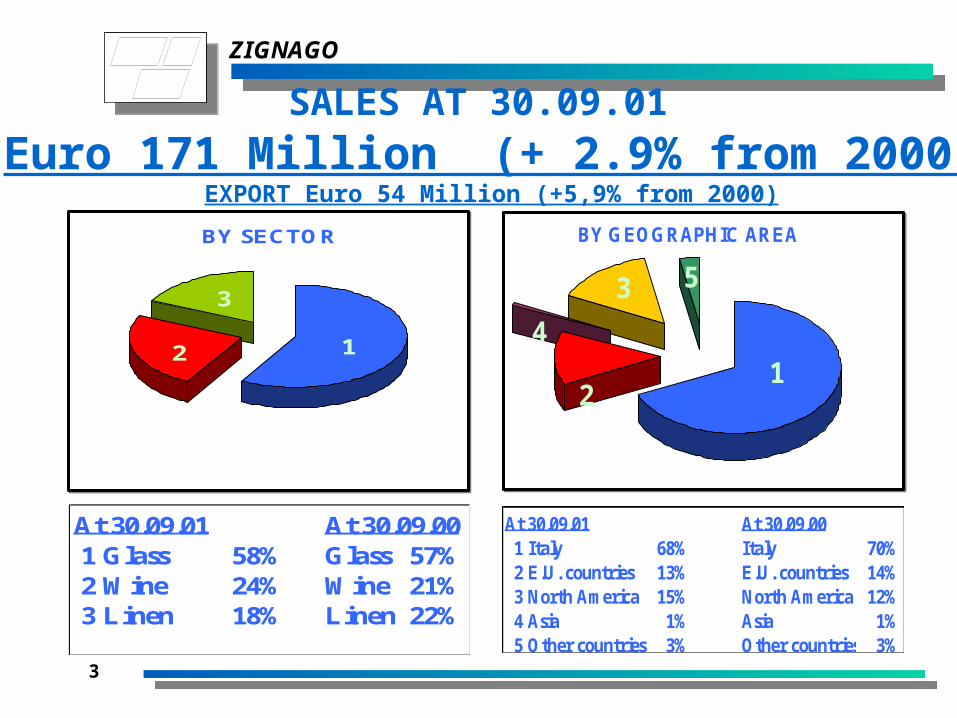
At 30.09.01 At 30.09.001 Glass 58% Glass 57%2 Wine 24% Wine 21%3 Linen 18% Linen 22%
At 30.09.01 At 30.09.001 Italy 68% Italy 70%2 E.U. countries 13% E.U. countries 14%3 North America 15% North America 12%4 Asia 1% Asia 1%5 Other countries 3% Other countries 3%
SALES AT 30.09.01 Euro 171 Million (+ 2.9% from 2000)
EXPORT Euro 54 Million (+5,9% from 2000)

ZIGNAGO
4
BY SECTOR
1
3
2
BY SECTOR
1
3
2
At 31.12.00 At 31.12.991 Glass 54% Glass 57%2 Wine 23% Wine 22%3 Linen 23% Linen 21%
At 31.12.00 At 31.12.991 Italy 69% Italy 71%2 E.U. countries 15% E.U. countries 14%3 North America 13% North America 12%4 Other European c. 1% Other European c. 1%5 Other countries 2% Other countries 2%
SALES AT 31.12.00 Euro 227.6 million (+ 9.7% from 1999)
BY GEOGRAPHIC AREA
453
21
BY GEOGRAPHIC AREA
453
21

ZIGNAGO
5
Euro ml. 30.09.01 30.09.00 31.12.00
Net Sales 171.0 166.2 227.6
EBITDA 44.5 41.0 57.0% of Net Sales 25.1% 24.7% 25.1%
EBIT 24.3 27.8 39.3% of Net Sales 13.7% 16.7% 17,3%
Extraordinary Income (0.7) - 1.3
Net Income 14.9 15.8 31.7% Of Net Sales 8.4% 9.5% 14.0%
Cash Flow 34.6 28.7 48.4% of Value of Production 19.6% 17.3% 21.3%
Group Profit & Loss
ZIGNAGO
6
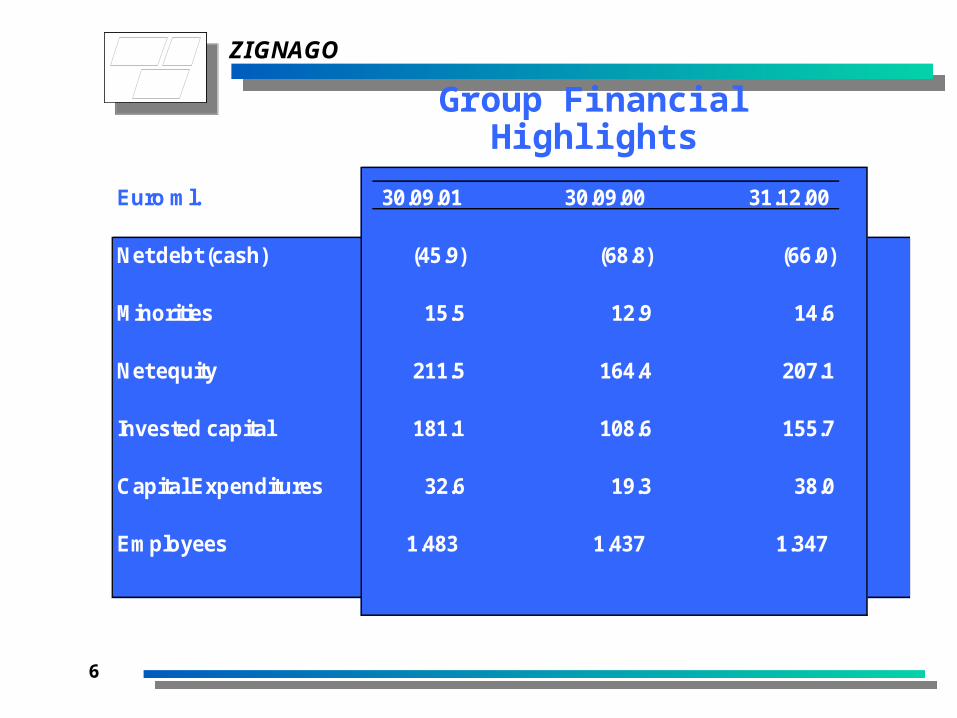
Euro ml. 30.09.01 30.09.00 31.12.00
Net debt (cash) (45.9) (68.8) (66.0)
Minorities 15.5 12.9 14.6
Net equity 211.5 164.4 207.1
Invested capital 181.1 108.6 155.7
Capital Expenditures 32.6 19.3 38.0
Employees 1.483 1.437 1.347
Group Financial Highlights

ZIGNAGO
7
Group Performance ‘93 - ‘00Group Performance ‘93 - ‘00
0
50
100
150
200
250
31/1
2/93
31/1
2/94
31/1
2/95
31/1
2/96
31/1
2/97
31/1
2/98
31/1
2/99
31/1
2/00
SA
LE
S
0
5
10
15
20
25
30
35
40
45
EB
IT
Sales EBIT
SALES + 98%EBITDA + 170%EBIT + 268%
Trend of Net Sales and EBIT In the period the increase of theconsolidated net sales has been satisfactory (+ 14% average per year)
Our companies' growth rates have beenfaster than the average for theirindustries.
The increase of EBITDA was doublethat of net sales
The increase of EBIT was triplethat of net sales
Euro ml.

ZIGNAGO
8
Group Performance ‘93 - ‘00Group Performance ‘93 - ‘00
0,0%
5,0%
10,0%
15,0%
20,0%
25,0%
30,0%
EB
ITD
A (
%)
0,0%
5,0%
10,0%
15,0%
20,0%
25,0%
EB
IT (
%)
EBITDA EBIT
1993 2000
EBITDA 18.3% 25.0%
EBIT 9.3% 17.3%
EBITDA and EBIT as a % of Sales
EBITDA and EBIT growth has beenconstant due to our ability to managecyclical businesses
Profitability ratios have been higherthan those of the relevant industries

ZIGNAGO
ZIGNAGO
A company with three lines of business
Glass Wines Linen yarns
9

ZIGNAGO
10
Glass ContainersGlass Containers

ZIGNAGO Glass ContainersGlass Containers
11
Products forthe food and
beverage, cosmeticsand pharmaceutical
sectors
Production of 1.5 billion containers
One of world’s top 5 producers of cosmetics flacons,largest in the food containers sector in Italy
Sales breakdown: Food 40%, Beverage 30%, Cosmeticsand Pharmaceuticals 30%
Exports account for 21% of sales: USA – France – UK – Greece – Spain
Three production facilities in Italy

ZIGNAGO Glass ContainersGlass Containers
12
Euro ml. Euro ml. Euro ml.
Sales 99.9 100% 94.8 100% 126 100%
EBITDA 28.6 28% 23.5 25% 31 25%
EBIT 13.4 13% 13.5 14% 19 15%
Net Profit 8.7 8% 8.3 9% 19 15%
Net Debt (Cash) (17.5) (17%) (51.3) (98) (48) (59)
Equity 123.2 117% 103.4 198% 132 159%
Invested Capital 105.7 100% 52.1 100% 83 100%
Cash Flow 23.7 18.1 30.8% of Value of Prod. 23.7% 19.8% 25.1%
30/09/01 30/09/00 31/12/00
Results at 30 September 2001 Results at 30 September 2001
82
84
86
88
90
92
94
96
98
100
102
30/09/98 30/09/99 30/09/00 30/09/01
Sa
les
0
2
4
6
8
10
12
14
16
18
EB
IT
Sales EBIT
Euro ml.

ZIGNAGO Glass ContainersGlass Containers
13
Expectations 2001 - 2003
• Market OutlookGrowing demand for “environmentally friendly” containers (EU guidelines)
Food industry focusing on Mediterranean products requiring glass containers
World-wide increase in consumption of “personal hygiene” products with a higher demand for high value-added glass cosmetic containers
Steady demand for pharmaceutical containers
• Performance
Above average performance should continue
ZIGNAGO Glass ContainersGlass Containers
14
Strategic Goals
2001 - 2003
ObjectivesInternationalise food segment
Increase growth in cosmetics and flacons
Further strengthen technological and production leadership
Look for acquisitions, JVs or alliances
Increase Group value
ZIGNAGO
15
Fine WinesFine Wines

ZIGNAGO
16
Fine WinesFine Wines
Ranks among the top Italian producers of
premium, fine and sparkling
wines
• Sales of 14 million bottles in 2000
• Over the past 10 years, Santa Margherita’s Pinot Grigio has been the best selling European wine in US restaurants
• Unique multi-regional brands. Wide product range from top wine areas in Italy:
Santa Margherita Veneto and Trentino Alto AdigeTorresella VenetoKettmeir Trentino Alto AdigeCà del Bosco FranciacortaLamole and Vistarenni Chianti - Tuscany
• Well balanced distribution channel in Italy
• Exports 54% of total sales
• Ca’ del Bosco leader in top segment

ZIGNAGO
17
Fine WinesFine Wines
Results at 30 September 2001 Results at 30 September 2001
Euro ml. Euro ml. Euro ml.
Sales 42.3 100% 36.9 100% 52.9 100%
EBITDA 10.1 25% 8.3 22% 12.8 24%
EBIT 8.3 20% 6.8 18% 10.1 19%
Net Profit 5.1 13% 3.9 11% 5.8 11%
Net Debt (Cash) 8.5 20% 8.8 24% 8.4 22%
Minorities 4.0 10% 3.6 10% 4.0 10%
Equity 29.6 70% 24.1 66% 26.0 68%
Invested Capital 42.0 100% 36.6 100% 38.3 100%
Cash Flow 6.8 5.4 7.8% of Value of Prod. 15.2% 13.7% 14.4%
30/09/01 30/09/00 31/12/00
0
5
10
15
20
25
30
35
40
45
30/09/98 30/09/99 30/09/00 30/09/01
Sa
les
0
1
2
3
4
5
6
7
8
9
EB
IT
Sales EBIT
Euro ml.

ZIGNAGO
18
Fine WinesFine Wines
Expectations 2001 - 2003
• Market OutlookFurther increase in world-wide consumption of high-quality wines
Consumption of red wines continues to grow
Faster export-driven growth
• Performance
Higher profits

ZIGNAGO
19
Fine WinesFine Wines
Strategic Goals
2001 - 2003
ObjectivesInternal growth through development and reinforcement of current company portfolio (Increase red and high-quality wines)
External growth through acquisitions and development of estates that produce high-quality wines with a high brand potential
Increase Santa Margherita brand awareness
Increase Group value

ZIGNAGO
20
Linen YarnsLinen Yarns
ZIGNAGO
21
Linen YarnsLinen Yarns
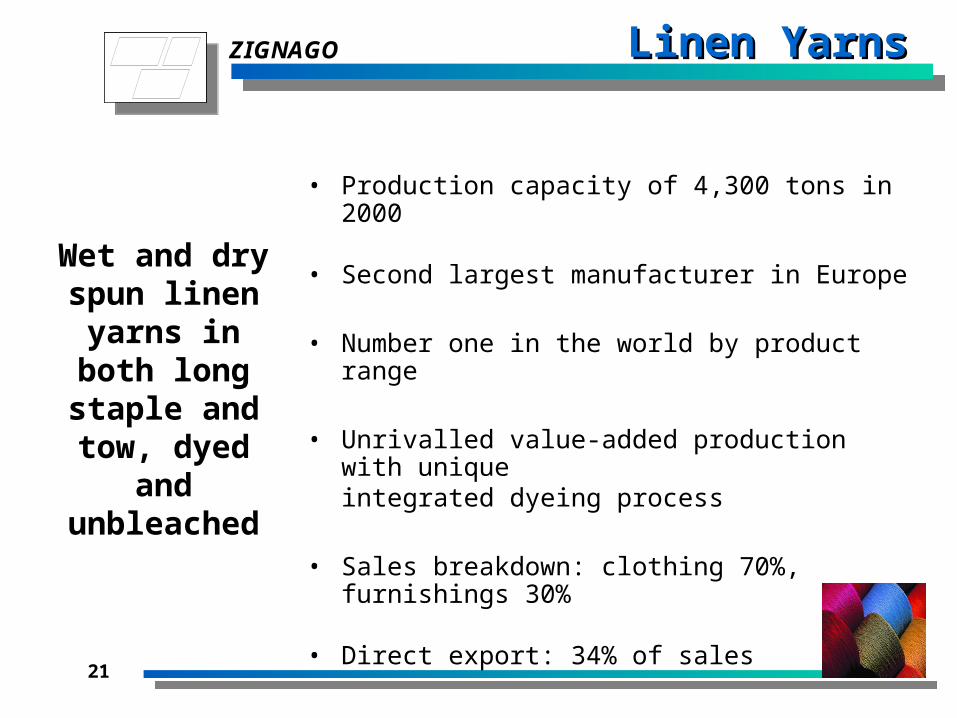
Wet and dry spun linen yarns
in both long staple and tow,
dyed and unbleached
• Production capacity of 4,300 tons in 2000
• Second largest manufacturer in Europe
• Number one in the world by product range
• Unrivalled value-added production with unique integrated dyeing process
• Sales breakdown: clothing 70%, furnishings 30%
• Direct export: 34% of sales
ZIGNAGO
22
Linen YarnsLinen Yarns
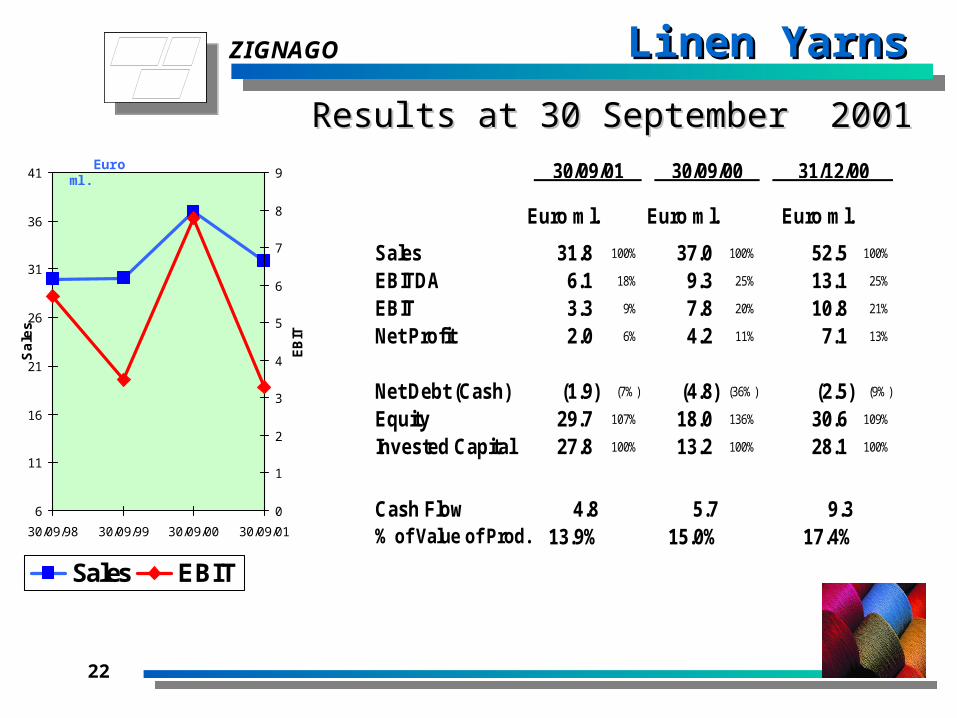
Results at 30 September 2001 Results at 30 September 2001
Euro ml. Euro ml. Euro ml.
Sales 31.8 100% 37.0 100% 52.5 100%
EBITDA 6.1 18% 9.3 25% 13.1 25%
EBIT 3.3 9% 7.8 20% 10.8 21%
Net Profit 2.0 6% 4.2 11% 7.1 13%
Net Debt (Cash) (1.9) (7%) (4.8) (36%) (2.5) (9%)
Equity 29.7 107% 18.0 136% 30.6 109%
Invested Capital 27.8 100% 13.2 100% 28.1 100%
Cash Flow 4.8 5.7 9.3% of Value of Prod. 13.9% 15.0% 17.4%
30/09/01 30/09/00 31/12/00
6
11
16
21
26
31
36
41
30/09/98 30/09/99 30/09/00 30/09/01
Sa
les
0
1
2
3
4
5
6
7
8
9
EB
IT
Sales EBIT
Euro ml.
ZIGNAGO
23
Linen YarnsLinen Yarns
Expectations 2001 - 2003
• Market OutlookFashion is still driving demand for high quality linen and dyed yarns
Increased awareness of natural fibres by consumers
Market fluctuations are becoming less cyclical
• Performance
Above average performance should continue

ZIGNAGO
24
Linen YarnsLinen Yarns
Strategic Goals
2001 - 2003
ObjectivesContinue to grow in the fashion segment
Reduce costs, implement services
Take advantage of new technologies developed at company level
Look for acquisitions
ZIGNAGO
25
Zignago ShareZignago Share
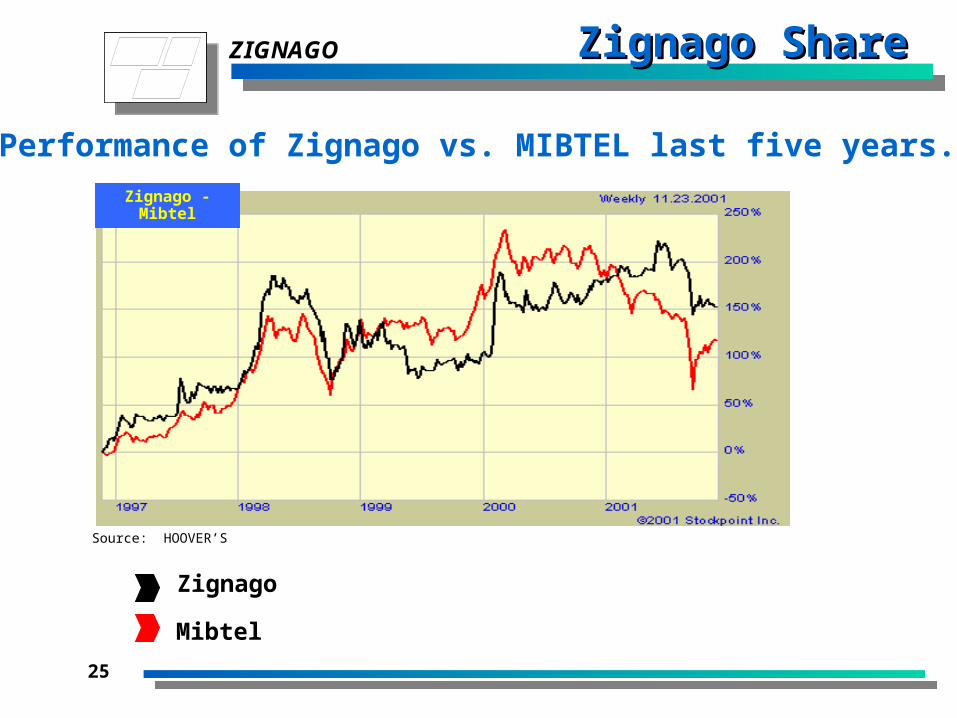
Performance of Zignago vs. MIBTEL last five years.
Zignago
Mibtel
Zignago - Mibtel
Source: HOOVER’S

ZIGNAGO
26
Performance per SharePerformance per Share
Earnings Per Share Compared
0.600.61
0.73
0.63
1.27
1.07
0.80
0,00
0,20
0,40
0,60
0,80
1,00
1,20
1,40
1998 1999 2000 2001
Euro
third quarter full year
Book Value per Share Compared
8.46
5.38
5.97
6.58
5.57
6.31
8.28
2,00
2,50
3,00
3,50
4,00
4,50
5,00
5,50
6,00
6,50
7,00
7,50
8,00
8,50
9,00
1998 1999 2000 2001
Euro
third quarter full year

ZIGNAGO
27
Share Value CreationShare Value Creation
Focused on Shareholders’ Value
since flotation never raised money disposed of dairy activities dedicated rights issue for employees consistency of results information disclosure increased size of three core businesses constantly increasing dividends