1 COSC3557: Object-Oriented Programming Haibin Zhu, Ph. D. Professor of CS, Nipissing University.
description

Available online at www.sciencedirect.com
www.elsevier.com/locate/cap
www.kps.or.kr
Current Applied Physics 9 (2009) 131–139
Dispersion behavior and thermal conductivity characteristicsof Al2O3–H2O nanofluids
Dongsheng Zhu a, Xinfang Li a,*, Nan Wang a, Xianju Wang a,b, Jinwei Gao a, Hua Li a
a Key Lab of Enhanced Heat Transfer and Energy Conservation, Ministry of Education, School of Chemical and Energy Engineering,
South China University of Technology, Guangzhou, Guangdong 510641, Chinab Navy Arms of Services Command Academy, Guangzhou, Guangdong 510431, China
Received 20 July 2007; accepted 28 December 2007Available online 8 January 2008
Abstract
Nanofluid is a kind of new engineering material consisting of solid nanoparticles with sizes typically of 1–100 nm suspended in basefluids. In this study, Al2O3–H2O nanofluids were synthesized, their dispersion behaviors and thermal conductivity in water were inves-tigated under different pH values and different sodium dodecylbenzenesulfonate (SDBS) concentration. The sedimentation kinetics wasdetermined by examining the absorbency of particle in solution. The zeta potential and particle size of the particles were measured andthe Derjaguin–Landau–Verwey–Overbeek (DLVO) theory was used to calculate attractive and repulsive potentials. The thermal conduc-tivity was measured by a hot disk thermal constants analyser. The results showed that the stability and thermal conductivity enhance-ments of Al2O3–H2O nanofluids are highly dependent on pH values and different SDBS dispersant concentration of nano-suspensions,with an optimal pH value and SDBS concentration for the best dispersion behavior and the highest thermal conductivity. The absolutevalue of zeta potential and the absorbency of nano-Al2O3 suspensions with SDBS dispersant are higher at pH 8.0. The calculated DLVOinterparticle interaction potentials verified the experimental results of the pH effect on the stability behavior. The Al2O3–H2O nanofluidswith an ounce of Al2O3 have noticeably higher thermal conductivity than the base fluid without nanoparticles, for Al2O3 nanoparticles ata weight fraction of 0.0015 (0.15 wt%), thermal conductivity was enhanced by up to 10.1%.� 2008 Elsevier B.V. All rights reserved.
PACS: 82.70.K; 47.17
Keywords: Nanofluid; Alumina nanoparticle; Dispersion and stability; Zeta potential; Absorbency; Thermal conductivity
1. Introduction
Recently, due to the development of nanotechnologyand surface science, many researches on nanofluids havebeen carried out actively. Nanofluid is a kind of new engi-neering material consisting of solid nanoparticles with sizestypically of 1–100 nm suspended in base fluids. It cannotonly solve the problems such as sedimentation, cohesionand corrosion which happen conventionally in heteroge-neous solid/liquid mixture with millimeter or micrometerparticles, but also increase the thermal performance of base
1567-1739/$ - see front matter � 2008 Elsevier B.V. All rights reserved.
doi:10.1016/j.cap.2007.12.008
* Corresponding author. Tel.: +86 20 87114568; fax: +86 20 87114185.E-mail address: [email protected] (X. Li).
fluids remarkably [1–9]. Choi [1], Das et al. [4], Xuan et al.[5], Eastman et al. [6,7] and Lee et al. [8] who found greatenhancement of thermal conductivity (5–60%) over the vol-ume fraction range of 0.1–5%. Patel et al. [10] concludedthat 5–21% enhancement of the thermal conductivity ofnanofluids for water with citrate in the temperature range30–60 �C at a very low loading of 0.00026 vol% of Ag par-ticles. For a loading of 0.011% of Au particles, theimprovement of thermal conductivity was around 7–14%.Kumar et al. [11] reported an enhanced thermal conductiv-ity of about 20% for a nanofluid of only 0.00013% Aunanoparticles in water. Since such an anomalous enhance-ment is expected to have wide applications in thermal engi-neering, nanofluids have received considerable attention in

Fig. 1. TEM micrograph of nano-alumina.
132 D. Zhu et al. / Current Applied Physics 9 (2009) 131–139
thermal science and engineering. However, it is very diffi-cult to understand why nanofluids would have such a highthermal conductivity. Meanwhile, there are large differ-ences among the thermal conductivities reported by differ-ent researchers. Keblinski et al. [12] further pointed outthat the most exciting experimental results have not beenreproducible. Therefore, it is necessary to reconsider thereliability of the measurements reported so far.
To explain the experimental results, Keblinski et al. [13]suggested the potential mechanisms for thermal conductiv-ity enhancement such as Brownian motion, liquid layeringand nanoparticle clustering. Koo and Kleinstreuer [14]found that the role of Brownian motion is much moreimportant than the thermo-phoretic and osmo-phoreticmotions. Lee et al. [15] experimentally investigated theeffect of surface charge state of the nanoparticle in suspen-sion on the thermal conductivity. They showed that the pHvalue of the nanofluid strongly affected the thermal perfor-mance of the fluid. With farther diverged pH value fromthe isoelectric point of the particles, the nanoparticles inthe suspension got more stable so to change the thermalconductivity. That may partially explain the disparitiesbetween different experimental data since many researchersused surfactants in nanofluids. Vadasz [16] demonstratedthat the transient heat conduction process in nanofluidsmay provide a valid explanation for the apparent heattransfer enhancement.
Many researches are conducted to enhance the thermalconductivity of nanofluid and also to produce more stablesuspensions. Studies to date have shown that the amountand the charge of nanoparticles in the nanofluid, and theinteraction between the particles and the dispersant directlyaffect the stability of the suspension. Agitation [17,18],changing pH values of the suspension [19,20] and addingsurfactants [21,22] have been applied to reduce the coagula-tion of nanoparticles in the nanofluid. Although the stabil-ity of nanofluid is very important for its application, there isa little study on estimating the stability of suspension. Zetapotential and UV–vis spectrophotometric measurementshave been used to quantitatively characterize colloidal sta-bility of the dispersions [23–25]. Lisunova et al. [26] studiedthe stability of the aqueous suspensions of nanotubes in thepresence of nonionic surfactant, and found the addition ofsurfactant exerts a stabilizing effect at surfactant concentra-tion Cs proportional to the weight concentration C of mul-tiwalled carbon nanotubes (MWNTs), Cs � C mol/dm3.These studies have given a good foundation for highlyhomogenous, industrial enhanced heat transfer suspensionfluids. Karimian et al. [27] investigated the dispersionbehavior of colloidal Al2O3 aqueous suspensions in thepresence of highly charged CeO2 nanoparticles and con-cluded the stability of these bidispersed systems reachesan optimum condition at pH 10 by increasing ceria nano-particle concentration. The calculated Derjaguin–Landau–Verwey–Overbeek (DLVO) interparticle interaction poten-tials verified the experimental results of the pH effect on thestability behavior.
In order to study the stability and thermal conductivityof Al2O3 nanoparticles in aqueous solutions, during thiswork, Al2O3 nanoparticle suspensions were synthesized,their dispersion behaviors and thermal conductivity inwater were investigated under different pH values and dif-ferent sodium dodecylbenzenesulfonate (SDBS) concentra-tion. It is expected to provide guidance to design nanofluidswith excellent performance.
2. Experimental
2.1. Chemical
The Al2O3 powder (Alfa Aesar, Ward Hill, MA, USA)with alumina content >99.9% was used in the study. Ithas a BET surface area of 100 m2/g, and a median particlesize of 15–50 nm, and a density of 3965 kg/m3. The surfacearea was determined using the Micromeretic Tristar 3000.The particle size was measured using the X-ray disk centri-fuge particle size analyser ver. 3.49. The transmission elec-tron micrograph (TEM) of alumina powder is shown inFig. 1. In Fig. 1, there are a few larger particles, whichare likely aggregates of the smaller ones, but the whole dis-tribution of the particles is relatively well-dispersed. Theparticles are basically spherical or near spherical.
An anionic surfactant, sodium dodecylbenzenesulfonate(referred to as SDBS) in chemical grade, from GuangzhouChemical Reagent Factory (China), was used. The surfac-tant structure is shown in Fig. 2. The water was purified bya Milli-Q academic millipore system. The pH was con-trolled using hydrochloric acid (HCl) and sodium hydrox-ide (NaOH) in analytical grade. All chemicals were used asreceived without any further purification.
2.2. Evaluation of dispersion by sedimentation method
The experiments were conducted using 0.1 wt% aluminanano-suspensions. Different concentrations of the disper-
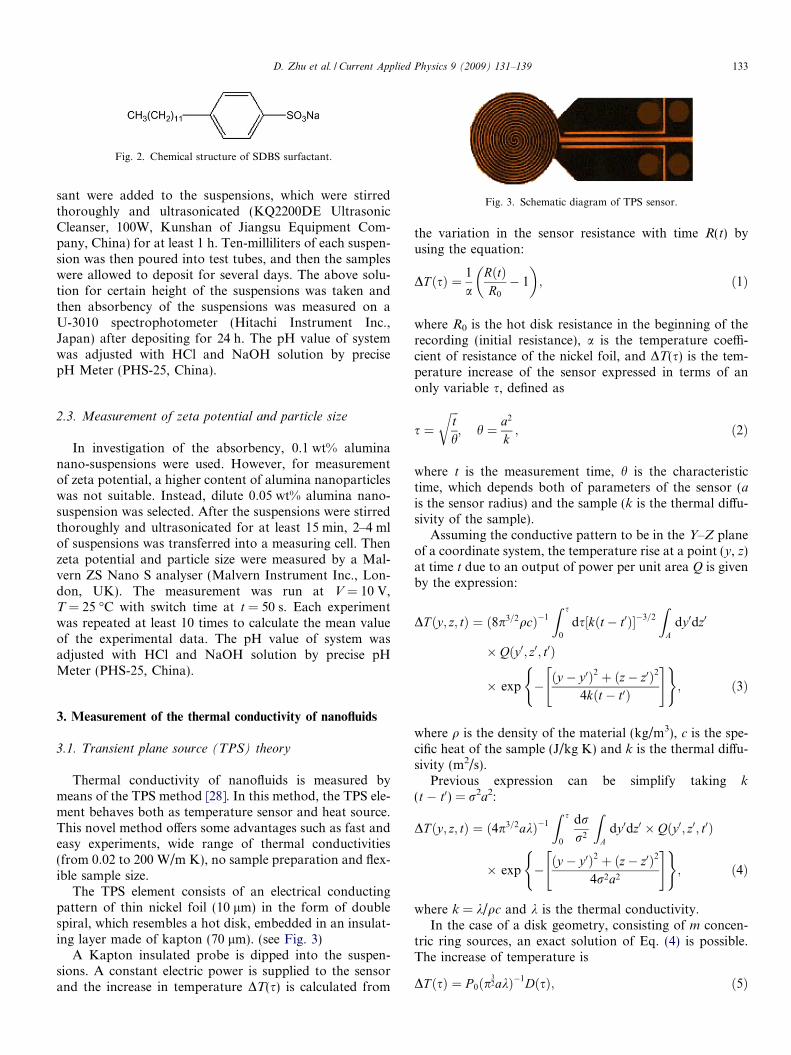
Fig. 3. Schematic diagram of TPS sensor.
Fig. 2. Chemical structure of SDBS surfactant.
D. Zhu et al. / Current Applied Physics 9 (2009) 131–139 133
sant were added to the suspensions, which were stirredthoroughly and ultrasonicated (KQ2200DE UltrasonicCleanser, 100W, Kunshan of Jiangsu Equipment Com-pany, China) for at least 1 h. Ten-milliliters of each suspen-sion was then poured into test tubes, and then the sampleswere allowed to deposit for several days. The above solu-tion for certain height of the suspensions was taken andthen absorbency of the suspensions was measured on aU-3010 spectrophotometer (Hitachi Instrument Inc.,Japan) after depositing for 24 h. The pH value of systemwas adjusted with HCl and NaOH solution by precisepH Meter (PHS-25, China).
2.3. Measurement of zeta potential and particle size
In investigation of the absorbency, 0.1 wt% aluminanano-suspensions were used. However, for measurementof zeta potential, a higher content of alumina nanoparticleswas not suitable. Instead, dilute 0.05 wt% alumina nano-suspension was selected. After the suspensions were stirredthoroughly and ultrasonicated for at least 15 min, 2–4 mlof suspensions was transferred into a measuring cell. Thenzeta potential and particle size were measured by a Mal-vern ZS Nano S analyser (Malvern Instrument Inc., Lon-don, UK). The measurement was run at V = 10 V,T = 25 �C with switch time at t = 50 s. Each experimentwas repeated at least 10 times to calculate the mean valueof the experimental data. The pH value of system wasadjusted with HCl and NaOH solution by precise pHMeter (PHS-25, China).
3. Measurement of the thermal conductivity of nanofluids
3.1. Transient plane source (TPS) theory
Thermal conductivity of nanofluids is measured bymeans of the TPS method [28]. In this method, the TPS ele-ment behaves both as temperature sensor and heat source.This novel method offers some advantages such as fast andeasy experiments, wide range of thermal conductivities(from 0.02 to 200 W/m K), no sample preparation and flex-ible sample size.
The TPS element consists of an electrical conductingpattern of thin nickel foil (10 lm) in the form of doublespiral, which resembles a hot disk, embedded in an insulat-ing layer made of kapton (70 lm). (see Fig. 3)
A Kapton insulated probe is dipped into the suspen-sions. A constant electric power is supplied to the sensorand the increase in temperature DT(s) is calculated from
the variation in the sensor resistance with time R(t) byusing the equation:
DT ðsÞ ¼ 1
aRðtÞR0
� 1
� �; ð1Þ
where R0 is the hot disk resistance in the beginning of therecording (initial resistance), a is the temperature coeffi-cient of resistance of the nickel foil, and DT(s) is the tem-perature increase of the sensor expressed in terms of anonly variable s, defined as
s ¼ffiffiffith
r; h ¼ a2
k; ð2Þ
where t is the measurement time, h is the characteristictime, which depends both of parameters of the sensor (ais the sensor radius) and the sample (k is the thermal diffu-sivity of the sample).
Assuming the conductive pattern to be in the Y–Z planeof a coordinate system, the temperature rise at a point (y, z)at time t due to an output of power per unit area Q is givenby the expression:
DT ðy; z; tÞ ¼ ð8p3=2qcÞ�1
Z s
0
ds½kðt � t0Þ��3=2
ZA
dy 0dz0
� Qðy0; z0; t0Þ
� exp � ðy � y 0Þ2 þ ðz� z0Þ2
4kðt � t0Þ
" #( ); ð3Þ
where q is the density of the material (kg/m3), c is the spe-cific heat of the sample (J/kg K) and k is the thermal diffu-sivity (m2/s).
Previous expression can be simplify taking k
(t � t0) = r2a2:
DT ðy; z; tÞ ¼ ð4p3=2akÞ�1
Z s
0
drr2
ZA
dy0dz0 � Qðy0; z0; t0Þ
� exp � ðy � y 0Þ2 þ ðz� z0Þ2
4r2a2
" #( ); ð4Þ
where k = k/qc and k is the thermal conductivity.In the case of a disk geometry, consisting of m concen-
tric ring sources, an exact solution of Eq. (4) is possible.The increase of temperature is
DT ðsÞ ¼ P 0ðp32akÞ�1DðsÞ; ð5Þ

134 D. Zhu et al. / Current Applied Physics 9 (2009) 131–139
where P0 is the total output power and D(s) is a geometricfunction given by the next expression:
DðsÞ ¼�
mðmþ 1Þ��2 �Z s
0
drr2
Xm
l¼1
lXm
k¼1
k
("
� exp�ðI2 þ k2Þ
4r2m2
� �I0
lk2r2m2
� ���; ð6Þ
in which I0 is the modified Bessel function.By fitting the experimental data to the straight line given
by Eq. (5), the thermal conductivity can be obtained bycalculating the value of slope for the fitting line P 0=ðp3=2akÞ.
3.2. Measurement process of the thermal conductivity of
nanofluids
Different concentration nano-suspensions were pre-pared, which were stirred thoroughly and ultrasonicated(KQ2200DE Ultrasonic Cleanser, 100 W, Kunshan ofJiangsu Equipment Company, China) for half of an hour.A Kapton insulated probe (design 7577) was successivelydipped into the different nano-suspensions. The diameterof the sensing spiral in the probe was about 2.001 mmand the Kapton insulation on both sides of the spiral hada thickness of 13 lm. Then the thermal conductivity wasmeasured by a hot disk thermal constants analyser (HotDisk Inc., Uppsala, Sweden). The measurement was runat V = 0.02 V, T = 25 �C with switch time at t = 5 s. Eachexperiment was repeated at least 10 times to calculate themean value of the experimental data. The pH value of sys-tem was adjusted with HCl and NaOH solution by precisepH Meter (PHS-25, China).
Fig. 4. Particle size distributions of Al2O3–H2O suspensions in the absence (a)SDBS dispersant are 0.05 wt%.
4. Results and discussion
4.1. Preparation of nanofluids
Ultrasonication was used for preparation of mixedaqueous nano-suspensions, which is an accepted techniquefor dispersing the highly entangled or aggregated nanopar-ticle samples [29,30], but longer time of high-energy sonica-tion can introduce defects. In the study, aluminananoparticle (0.1 g) and a water solution (99.8 g) withSDBS surfactant (0.1 g) were directly mixed in a 150 mlbeaker. The suspension was transferred into an ultrasonicvibrator and sonicated for 1 h at a frequency of 40 kHzand an output power of 100 W at 25–30 �C. For the com-parison, the suspension without SDBS dispersant was son-icated for 1 h in the same way. Fig. 4 illustrates the particlesize distributions of Al2O3–H2O nano-suspensions in theabsence (a) and in the presence (b) of SDBS dispersant,which shows that there are obvious variations in the parti-cle size characteristics between two samples. The averageparticle sizes obtained are (a) in the absence of SDBS dis-persant: 6770 nm, (b) in the presence of SDBS dispersant:207 nm. Therefore, the stabilization of Al2O3–H2O suspen-sion with SDBS dispersant is better.
4.2. Influence of pH on stability and thermal conductivity of
alumina nano-suspensions
The stability of alumina powder suspension in aqueoussolution is closely related to its electrokinetic properties.Well-dispersed suspension can be obtained with high sur-face charge density to generate strong repulsive forces.Therefore, The study of the electrophoretic behavior
and in the presence (b) of SDBS dispersant. Concentration of Al2O3 and
D. Zhu et al. / Current Applied Physics 9 (2009) 131–139 135
through measurement of the zeta potential becomes impor-tant for understanding the dispersion behavior of aluminaparticles in a liquid medium [31,32]. Fig. 5 shows thechange of zeta potential for Al2O3–H2O suspensions withSDBS dispersant as a function of pH. According to thezeta potential values of alumina powders, pH 8.0 can beselected as an operating pH for the suspensions with SDBSdispersants. Because, in the pH, the absolute values of zetapotential for Al2O3–H2O suspensions with SDBS disper-sants is higher, nalumina (SDBS) = �40.1 mV.
The measurement of the absorbency has become animportant evaluation for understanding the dispersionbehavior of alumina particles in a liquid medium. Thegreater the absorbency is, the higher the particle concentra-tion in the suspension is, hence the more stable the suspen-sion is. In the case of alumina suspension with SDBSdispersant, the alumina powder is negatively charged inthe whole pH ranges (from 2 to 12). At pH below two,the absolute value of zeta potential and the absorbencyof the particle surface (see Fig. 5) are at the minimum,therefore the force of electrostatic repulsion between parti-cles is not sufficient to overcome the attraction forcebetween particles, and dispersion stability is poor. As pHincreases, the absolute value of zeta potential of the particlesurface increases, so the electrostatic repulsion forcebetween particles becomes sufficient to prevent attractionand collision between particles caused by Brownianmotion. Greater electrostatic force can also lead to morefree particles by increasing particle–particle distance so thatthe distance exceeds the hydrogen bonding range betweenparticles and further reduces the probability of particlecoagulation and settling. The absorbency also becomes lar-ger with pH increase, improving the dispersion stability ofalumina nanoparticles. At pH around 8.0, the absolutevalue of zeta potential becomes even higher; and the absor-bency becomes even larger; the electrostatic repulsion forcebetween particles is stronger, and the coagulated particlescan be redispersed through mechanical force, so the disper-
2 4 6 8 10 12
-40
-38
-36
-34
-32
-30
-28 Zeta potential Absorbency
pH
Zet
a po
tent
ial/m
V
0.95
1.00
1.05
1.10
1.15
1.20
Absorbency
Fig. 5. Effect of pH on zeta potential and absorbency of Al2O3–H2Osuspensions with SDBS dispersants. Concentration of Al2O3 and disper-sants for the measurement of zeta potential are 0.05 wt%, and concentra-tion of Al2O3 and SDBS for the measurement of absorbency are 0.1 wt%.
sion stability of alumina nanoparticles is the best. As pHvalue continues to further increase, the concentration ofthe pH adjustment reagent (NaOH) in the system increases,which causes the compression of electrical double-layer, solowering the absolute value of zeta potential of the particlesurface and electrostatic repulsion force, and the suspen-sion exhibits a poorer dispersion. This analysis shows thatthe dispersion behavior of alumina nanoparticles is affectedby electrostatic repulsion force and is basically agreementwith the classical DLVO theory.
According to the DLVO theory, the total interactionpotential (VT) was determined by a repulsive interactionenergy due to the overlap between the diffuse double-layersof the particles (VR) and the attractive interaction energydue to London–van der Waals dispersion (VA). In princi-ple, the presence of surfactant covering the external surfaceof alumina particles should be taken into account by meansof an electrosteric potential. However, it has been shownthat the adsorption of ionic surfactants onto charged alu-mina particles alters mainly the electrical interactionbetween the particles [33]; as a consequence, and for thesake of clarity, the steric contribution could be neglectedin order to calculate the total interaction potential.
The total interaction energy as a function of the shortestdistance between the particle surfaces (H) is assumed to bethe sum of all the attractive and repulsive potentials men-tioned above:
V TðHÞ ¼ V RðHÞ þ V AðHÞ: ð7ÞFor small particle’s surface potentials (w0) and ka > 10, theelectrostatic repulsive energy (VR) is given by the expression:
V RðHÞ ¼ 2peaw20 ln½1þ expð�kHÞ�; ð8Þ
where e is the permittivity of the medium, and k�1 is thethickness of the electrical double-layer surrounding theparticle, or Debye’s length.
The van der Waals attractive energy (VA) betweenspherical particles is given by
V AðHÞ ¼ �A6
2a2
H 2 þ 4aH
� �þ 2a2
H 2 þ 4aH þ 4a2
� ��
þ lnH 2 þ 4aH
H 2 þ 4aH þ 4a2
� ��; ð9Þ
where H is the separation distance between the surfaces ofthe spheres, and A is the Hamaker constant, whose valuedepends on the properties of the particles and the dispers-ing medium. At close separations (H << a) the above equa-tion may be simplified considerably:
V AðHÞ ¼ �aA
12H: ð10Þ
According to Eqs. (7), (8) and (10), the calculated DLVOinterparticle interaction potentials [34] between aluminananoparticles with SDBS dispersant at pH 3.0 and 8.0 areshown in Fig. 6 and Fig. 7, respectively. The maximum inVT is considered an energy barrier that particles mustovercome to form an aggregate. In Fig. 6, the repulsive

3 4 5 6 7 8 9 10 111.01
1.02
1.03
1.04
1.05
1.06
1.07
1.08
1.09
1.10
1.11
The
rmal
con
duct
ivity
rat
io(k
/kf)
pH
0.02 wt% 0.05 wt% 0.10 wt% 0.15 wt%
Fig. 8. Effect of pH on thermal conductivity of Al2O3–H2O suspensionswith SDBS dispersants.
0 5 10 15 20 25
-80
-60
-40
-20
0
20
40
60
80
100
120
VA
VR
VT
V T/k
T
H/nm
Fig. 6. The calculated DLVO interparticle interaction potentials betweenalumina particles at pH 3.
0 5 10 15 20 25
-80
-60
-40
-20
0
20
40
60
80
100
120
VA
VR
VT
V T/k
T
H/nm
Fig. 7. The calculated DLVO interparticle interaction potentials betweenalumina particles at pH 8.0.
136 D. Zhu et al. / Current Applied Physics 9 (2009) 131–139
interaction between particles is smaller than the attractiveinteraction at H < 2 nm, and the repulsive interaction be-tween particles is larger than the attractive interaction atH > 2 nm. Moreover, the maximum in VT is about 49 kT.In Fig. 7, the repulsive interaction between particles is largerthan the attractive interaction and hence the total potentialenergy is always positive. Moreover, the maximum in VT isabout 94 kT. The calculated total potential energy increasesas pH increases due to the increase of the repulsive compo-nent. This increase in the repulsion component betweennanoparticles hinders agglomeration of the particles andcontributes to the increasing stability of the colloidal system.This is in agreement with our experimental observations.
Fig. 8 shows the change of thermal conductivity ratio forAl2O3–H2O suspensions with SDBS dispersant as a func-tion of pH. It can be seen that the thermal conductivity ratioincreases as pH increases from 3 to 8.0–9.0. As addressed inthe literatures [10,35], such abnormal enhancements are notexplained by any pre-existing model. When the nanoparti-cles are dispersed into water, the overall behavior of the par-ticle–water interaction depends on the properties of theparticle surface. At the point of zero change (PZC), therepulsive forces among alumina particles are zero and nano-
particles will coagulate together under this pH value. There-fore, when the pH value is equal to or close to the PZC,alumina particle suspension is unstable according to theDLVO theory [36–38]. The hydration forces among parti-cles increase with the increasing difference of the pH valueof a suspension from the PZC, which results in the enhancedmobility of nanoparticles in the suspension. The micro-scopic motions of the particles cause microconvection thatenhances the heat transport process. So we attempt to linkthe concept of surface charges to the change in thermal con-ductivity ratio of nanofluids. The point to mention is thatthe charged surface sites seemingly provide much moreeffective passages through which heats or phonons are goingmore efficiently. Lee et al. [39] showed that surface chargestates are mainly responsible for the increase of thermalconductivity in the present condition by a surface com-plexatio model for the measurement data of hydrodynamicsize, zeta potential, and thermal conductivity. Xue et al. [40]showed from molecular dynamic simulation that phononsfelt much less resistance during travel from particle to liquidat stronger interfacial bonding. Therefore, it looks reason-able to infer that optimizing pH or higher surface chargingcondition facilitates phonon transport through increases ofeffective sites and transport efficiency.
As depicted in Fig. 5, as the pH goes away from thePZC, the surface charge increases because of more frequentattacks to the surface hydroxyl groups and phenyl sulfonicgroup by potential-determining ions (H+, OH� and phenylsulfonic group), leading to an increase in the zeta potentialon the alumina powder surface. In this way, we can inferthat there are more surface charges at pH 8.0–9.0, at whichthe dispersion behavior is better and the thermal conduc-tivity is higher. As expected, the surface charge is minimumat the PZC.
4.3. Influence of the dispersant concentration on stability and
thermal conductivity of alumina nano-suspensions
The effect of SDBS dispersant concentration on the sta-bility of alumina nanoparticles at pH 8.0 for the 0.1 wt%

-0.02 0.00 0.02 0.04 0.06 0.08 0.10 0.12 0.14 0.16
0.98
1.00
1.02
1.04
1.06
1.08
1.10
H2O
0.1 wt% Al2O3-H2O
The
rmal
con
duct
ivity
rat
io (
k/k f)
Weight fraction (SDBS) /%
Fig. 10. Effect of SDBS concentration on thermal conductivity of Al2O3–H2O suspensions.
D. Zhu et al. / Current Applied Physics 9 (2009) 131–139 137
nano-suspensions are shown in Fig. 9. It can be seen that thealumina powder is negatively charged by adding SDBS dis-persant. It may be due to dissociation of SDBS in the solu-tion producing phenyl sulfonic group adsorbed on thealumina particle, which in turn increases the net negativecharge of powder surface and also increases the repulsiveforces. As the dispersant concentration increases, the abso-lute value of zeta potential is observed to increase, resultingin a maximal value, thereby suggesting good dispersion sys-tem. The optimum concentration of the SDBS is found tobe 0.10 wt%, which is also corroborated from absorbencytest. At this concentration, the absolute value of zeta poten-tial and the absorbency is maximal, and the system is morestable, which suggests SDBS dispersant yields well-dis-persed system. A plausible dispersion mechanism of SDBSon the alumina suspension is as follows: SDBS can partiallyionize in water and give anionic species, while aluminananoparticles carry positive charge in a neutral aqueousmedium, having a strong affinity for anionic groups. WhenSDBS concentration is lower, the negatively charged phenylsulfonic group dissociated from SDBS is adsorbed on thepositively charged alumina surface and consequently thesurface is negatively charged because of the ionization ofSDBS, thus effect of electrostatic stabilization is obtained.With the increase of SDBS, on the hand, the anion groupspushed into the adsorbed layer makes the absolute valueof zeta potential increase, resulting in increasing the repul-sive forces between the particles, thereby increasing thethickness of electrical double-layer; on the other hand, largenumbers of anion groups in the aqueous suspension hindersthe particles from colliding and then reduces the collisionprobability between the particles. Here, the adsorbed phe-nyl sulfonic group and a significant electrical double-layerwere simultaneously presented. When more SDBS is addedinto the suspension, the concentration of Na+ increaseswith SDBS concentration increase, and the Na+ groupentering into the absorbed layer reduces the net charge of
0.00 0.02 0.04 0.06 0.08 0.10 0.12 0.14 0.16 0.18 0.20
-38
-36
-34
-32
-30
-28
Zeta potential Absorbency
Weight fraction/%
Zet
a po
tent
ial/m
V
0.75
0.80
0.85
0.90
0.95
1.00
1.05
1.10
1.15
Absorbency
Fig. 9. Effect of SDBS concentration on the zeta potential and absorbency(pH = 8.0). Concentration of Al2O3 and SDBS for the measurement ofzeta potential are 0.05 wt%, and concentration of Al2O3 and SDBS for themeasurement of absorbency are 0.1 wt%.
powder surface and makes the absolute value of zeta poten-tial decrease, resulting in weak dispersion system.
Fig. 10 presents the thermal conductivity ratio of theAl2O3–H2O suspensions and the base fluid with respectto the concentration of SDBS dispersant at pH 8.0–9.0.The weight fraction of the Al2O3–H2O suspensions is0.1 wt%. For the base fluid, the thermal conductivity ratiostarts to decrease after a certain value of the dispersantconcentration. In the present experiments, the highest ther-mal conductivity appears at 0.02 wt% water solution,which means when an ounce of SDBS dispersant is added,the thermal conductivity at 0.02 wt% water solution ishigher than that of pure water. In the 0.1 wt% Al2O3–H2O suspensions, the trend of the variation of the thermalconductivity is very similar to those in the base fluid withdispersant only. However, the thermal conductivity ratiodecreases slowly as SDBS concentration increases from0.02 to 0.10 wt%, and then decreases very quickly with anincrease in the SDBS concentration. Obviously, For theAl2O3–H2O suspensions and the base fluid, when moreSDBS is added into the systems, the thermal conductivityratios decrease very quickly. Owing to this trend, the addi-tion of more dispersant seems noneffective in the Al2O3–H2O suspensions. This is because the heat transfer areabecomes narrower due to the amount of the surfactantson the particle surface. Taking into account the combinedeffect of dispersion behavior and thermal conductivity, the0.10 wt% SDBS can be selected as an optimizing concentra-tion for the 0.1% alumina nano-suspensions. Therefore, itcan be concluded that the application of nanofluid withoptimizing chemical dispersant is a better way among theconsidered enhancement techniques in the viewpoint ofthe effectiveness of dispersion behavior and thermalconductivity.
4.4. Influence of the weight fraction of nanoparticle on
thermal conductivity of alumina nano-suspensions
Fig. 11 shows the enhanced thermal conductivity ratio ofAl2O3–H2O suspensions with the optimizing SDBS

0.00 0.02 0.04 0.06 0.08 0.10 0.12 0.14 0.161.065
1.070
1.075
1.080
1.085
1.090
1.095
1.100
1.105
The
rmal
con
duct
ivity
rat
io (k
/kf)
Weight Fraction /%
Fig. 11. Thermal conductivity ratio of Al2O3–H2O suspensions as afunction of solid weight fraction.
138 D. Zhu et al. / Current Applied Physics 9 (2009) 131–139
concentration as a function of the weight fraction of nano-particle. pH 8.0–9.0 can be selected as an operating pH fordifferent weight fraction suspensions. The results show thatan ounce of nanoparticle suspensions have noticeably higherthermal conductivities than the base fluid without nanopar-ticles. The thermal conductivity of Al2O3–H2O nanofluid isenhanced approximately nonlinearly with the weight frac-tion of the alumina nanoparticle, it implies that Al2O3–H2O suspensions can enhance the heat transfer perfor-mance. The maximum thermal conductivity enhancementsof up to 10.1% is observed at the 0.15 wt% suspension.
5. Conclusions
This paper is concerned with the dispersion behaviorsand thermal conductivity of Al2O3–H2O nanofluid underdifferent pH values and different sodium dodecylbenzene-sulfonate (SDBS) concentration. Key conclusions can besummarized as follows:
� Zeta potential and absorbency are important basis forselecting conditions for dispersing particles. There is agood correlation between absorbency and zeta potential.The higher the absolute value of zeta potential is, thegreater the absorbency is, and the better the stabilityof the system is.� Al2O3–H2O nanofluids by two-step method were pre-
pared. The particle size distribution shows better disper-sion behavior in the suspension with the addition ofdispersant.� The effect of pH on the stability of the alumina suspen-
sion was critical. At pH 8.0, a good dispersion of alu-mina particles was obtained which is attributed tocharge build up on the surface of alumina particlesdue to adding SDBS dispersants. The calculated DLVOinterparticle interaction potentials verified the experi-mental results of the pH effect on the stability behaviorof the alumina suspensions. Therefore, the high chargedformation around alumina particles and a good disper-sion of suspension was verified at pH 8.0.
� SDBS dispersants can significantly increase the absolutevalue of zeta potential of particle surfaces by electro-static repulsions, which lead to the enhancement of thestability for Al2O3 suspensions. In the 0.1 wt% aluminanano-suspensions, the optimizing concentrations forSDBS is 0.10 wt%, which have the best dispersionresults.� The use of Al2O3 nanoparticles as the dispersed phase in
water can significantly enhance the thermal conductiv-ity, and the enhancement increases with particle concen-tration under the conditions of this work. The maximumthermal conductivity enhancements of up to 10.1% isobserved at the 0.15 wt% suspension.� We have shown that the pH of the nanofluid strongly
affects the thermal conductivity of the suspension. Asthe pH of the nanofluid goes far from the PZC, the sur-face charge increases because of more frequent attacksto the surface hydroxyl groups and phenyl sulfonicgroup by potential-determining ions (H+, OH� and phe-nyl sulfonic group), and the colloidal particles get morestable and eventually alter the thermal conductivity ofthe fluid. In this way, we can infer that there are moresurface charges at pH 8.0–9.0, at which the thermal con-ductivity is higher.� The thermal conductivity can be improved by adding
optimizing SDBS dispersant. However, the combinedtreatment with both the pH and chemical dispersant isrecommended to improve the thermal conductivity forpractical applications of nanofluid.
Acknowledgments
The authors like to acknowledge the financial supportsfrom the National Natural Science Foundation of China(Grant No. 20346001), Program for New Century Excel-lent Talents in University (Grant No. NCET-04-0826),Specialized Research Fund for the Doctoral Program ofHigher Education (Grant No. 20050561017), Post-doctorFoundation of China (Grant No. 20060400219) for the re-search work.
References
[1] S.U.S. Choi, ASME 231 (1995) 99.[2] K. Hong, T.-K. Hong, H.-S. Yang, Appl. Phys. Lett. 88 (3) (2006)
31901.[3] C.H. Li, G.P. Peterson, J. Appl. Phys. 99 (8) (2006) 084314.[4] S.K. Das, N. Putra, P. Thiesen, W. Roetzel, J. Heat Transfer 125
(2003) 567.[5] Y.M. Xuan, Q. Li, W. Hu, AIChE J. 49 (2003) 1038.[6] J.A. Eastman, S.U.S. Choi, S. Li, L.J. Thompson, Mater. Res. Soc.
457 (1997) 3.[7] J.A. Eastman, S.U.S. Choi, S. Li, W. Yu, L.J. Thompson, Appl. Phys.
Lett. 78 (2001) 718.[8] S. Lee, S.U.S. Choi, S. Li, J.A. Eastman, J. Heat Transfer 121 (1999)
280.[9] X.F. Li, D.S. Zhu, Chem. Ind. Eng. Prog. 25 (2006) 875.
[10] H.E. Patel, S.K. Das, T. Sundararagan, A.S. Nair, B. Geoge, T.Pradeep, Appl. Phys. Lett. 83 (2003) 2931.

D. Zhu et al. / Current Applied Physics 9 (2009) 131–139 139
[11] D.H. Kumar, H.E. Patel, V.R.R. Kumar, T. Sundararajan, T.Pradeep, S.K. Das, Phys. Rev. Lett. 93 (2004) 144301.
[12] P. Keblinski, J.A. Eastman, D.G. Cahill, Mater. Today 8 (2005) 36.[13] P. Keblinski, S.R. Pillpot, S.U.S. Choi, J.A. Eastman, Int. J. Heat
Mass Transfer 45 (2002) 855.[14] J. Koo, C. Kleinstreuer, Int. Commun. Heat Mass Transfer 32 (9)
(2005) 1111.[15] D. Lee, J.-W. Kim, B.G. Kim, J. Phys. Chem. B 110 (9) (2006) 4323.[16] P. Vadasz, J. Heat Transfer 128 (5) (2006) 465.[17] Y.M. Xuan, Q. Li, Int. J. Heat Fluid Flow 21 (2000) 58.[18] S.M.S. Murshed, K.C. Leong, C. Yang, Int. J. Therm. Sci. 44 (2005)
367.[19] X.F. Li, D.S. Zhu, X.J. Wang, J. Colloid Interface Sci. 310 (2007)
456.[20] E. Illes, E. Tombacz, J. Colloid Interface Sci. 295 (2006) 115.[21] J.P. Li, K.H. Guo, D.Q. Liang, R.Z. Wang, Int. J. Refrig. 27 (2004)
932.[22] A.B. Jodar-Reyes, A. Martın-Rodrıguez, J.L. Ortega-Vinuesa, J.
Colloid Interface Sci. 298 (2006) 248.[23] L. Jiang, L. Gao, J. Sun, J. Colloid Interface Sci. 260 (2003) 89.[24] Y. Hwang, J.K. Lee, C.H. Lee, Y.M. Jung, S.I. Cheong, C.G. Lee,
B.C. Ku, S.P. Jang, Thermochim. Acta 455 (2007) 70.[25] X.F. Li, D.S. Zhu, X.J. Wang, J.W.Gao, H.Li, in: Proceedings of the
International Symposium on Biophotonics, Nanophotonics andMetamaterials, Hangzhou, China, October 2006, p. 363.
[26] M.O. Lisunova, N.I. Lebovka, O.V. Melezhyk, Y.P. Boiko, J.ColloidInterface Sci. 299 (2006) 740.
[27] H. Karimian, A.A. Babaluo, J. Eur. Ceram. Soc. 27 (2007) 19.
[28] M.A. Rodrıguez-Perez, J.A. Reglero, D. Lehmhus, M. Wichmann,J.A. de Saja, A. Fernandez, in: International Conference AdvancedMetallic Materials, Smolenice Slovakia, November 2003, p. 253.
[29] M. Lindheimer, E. Keh, S. Zaini, S. Partyka, J. Colloid Interface Sci.138 (1990) 83.
[30] P. Cheol, O. Zoubeida, K.A. Watson, R.E. Crooks, J. Smith, S.E.Lowther, J.W. Connell, E.J. Siochi, J.S. Harrison, T.L. Clair, Chem.Phys. Lett. 364 (2002) 303.
[31] H. Bala, W.Y. Fu, J.Z. Zhao, X.F. Ding, Y.Q. Jiang, K.F. Yu, Z.C.Wang, Colloids Surf., A: Physicochem. Eng. Aspects 252 (2005)129.
[32] C.R. Mayer, S. Neveu, F. Secheresse, V. Cabuil, J. Colloid InterfaceSci. 273 (2004) 350.
[33] R. Porcel, A.B. Jodar, M.A. Cabrerizo, R. Hidalgo-Alvarez, A.Martın-Rodrıguez, J. Colloid Interface Sci. 239 (2001) 568.
[34] D. Kong, H. Yang, Y. Yang, S. Wei, B. Cheng, Mater. Lett. 58 (2004)3503.
[35] H. Xie, H. Lee, W. Youn, M. Choi, J. Appl. Phys. 94 (2003) 4967.[36] W.B. Russel, D.A. Saville, W.R. Schowwalter, Colloidal Suspensions,
Cambridge University Press, Cambridge, 1989.[37] R.J. Hunter, Foundations of Colloid Science, vol. 1, Clarendon Press,
Oxford, 1987.[38] M. Elimelech, J. Gregory, X. Jia, R.A. Williams, Particle Deposition
and Aggregation: Measurement, Modeling and Simulation, Butter-worths, Oxford, 1995.
[39] D. Lee, J.-W. Kim, B.G. Kim, J. Phys. Chem. B 110 (2006) 4323.[40] L. Xue, P. Keblinski, S.R. Phillpot, S.U.S. Choi, J.A. Eastman, J.
Chem. Phys. 118 (2003) 337.


![BlockBuster - TuoRen · BlockBuster Smooth ETT Exchange TM [1] Zhu Xiaojun, Zhu Hairong, Lu Lei, et al. The Clinical application of BlockBuster ... Journal of Clinical Anesthesia,](https://static.fdocuments.in/doc/165x107/5bf3dac909d3f256398cdcf4/blockbuster-blockbuster-smooth-ett-exchange-tm-1-zhu-xiaojun-zhu-hairong.jpg)


![GAN Architectures and Conditional GANs · transition between the original and edited projection different degree of image manipulation Editing UI Slide credit Zhu / [Zhu et al. 16]](https://static.fdocuments.in/doc/165x107/5fcdaa29ce10d3567f6ccdc3/gan-architectures-and-conditional-gans-transition-between-the-original-and-edited.jpg)