Zhongli Talesun Solar Financial Due Diligence Report · Zhongli Talesun Solar Financial Due...
35
Zhongli Talesun Solar Financial Due Diligence Report CLEAN ENERGY ASSOCIATES September 15, 2015
Transcript of Zhongli Talesun Solar Financial Due Diligence Report · Zhongli Talesun Solar Financial Due...
Zhongli Talesun Solar
Financial Due Diligence Report
CLEAN ENERGY ASSOCIATES
September 15, 2015

Page 2 of 35
Table of Contents LIST OF ACRONYMS ............................................................................................................................ 4
1. TALESUN COMPANY INTRODUCTION .................................................................................... 5 1.1 Overview ............................................................................................................................................. 5
Graph A: Talesun Organizational Structure ............................................................................................... 6
Chart A: Talesun Top 6 Shareholders as of 2Q 2015 ................................................................................. 7
1.2 Leadership Team ................................................................................................................................. 8
Chart B: Executive Structure of Talesun Solar ........................................................................................... 8
2. COMPANY FINANCIAL OVERVIEW ........................................................................................ 11 2.1 Summary of Annual Reports ............................................................................................................. 11
Chart C: Talesun Solar Financial Indices (FY2014-FY2015) .................................................................. 11
Chart D: Talesun Solar Financial Indices (2Q 2014-2Q 2015) ................................................................ 13
Chart E: Zhongli Talesun Financial Budget (FY2015E-FY2017E) ......................................................... 14
2.2 Accounts Receivable and Accounts Payable ..................................................................................... 15
Chart F: Talesun Solar Business AR as of 2014 ....................................................................................... 15
Chart G: Talesun Business Top AR as of 2Q 2015 .................................................................................. 16
Chart H: Talesun Solar Polysilicon Business AP as of 2014 .................................................................... 16
Chart I: Talesun Solar Wafer Business AP as end of 2Q 2015 ................................................................ 17
2.3 Profitability ........................................................................................................................................ 17
Chart J: Talesun Solar Profitability Trends (FY2012-FY2014) ............................................................... 17
Chart K: Talesun Profitability Trends (2Q 2014-2Q 2015) ...................................................................... 18
2.4 Financing Solvency and Operating Capacity .................................................................................... 18
Chart L: Talesun Solar Bank Loans as end June 2015 ............................................................................. 19
Chart M: Solvency Ratios ......................................................................................................................... 19
Chart N: Operating Ratios ........................................................................................................................ 20
3. PRODUCTION AND SALES ......................................................................................................... 21 3.1 Production Capacity .......................................................................................................................... 21
Chart O: Talesun Solar Cell Capacity Production and Sales (FY2012-FY1H2015E) ............................. 21
Graph B: Talesun Solar Cell Capacity Production and Sales (FY2012-FY1H2015E) ............................ 21
Chart P: Talesun Solar Module Capacity Production and Sales (FY2012-FY1H2015E) ........................ 22
Graph C: Talesun Solar Module Capacity Production and Sales (FY2012-FY1H2015E) ....................... 22
3.2 Sales Overview .................................................................................................................................. 23
Chart Q: Talesun Solar Sales (USD) by Region (FY2013-FY2015E) ..................................................... 23
Graph D: Talesun Solar Sales (USD) by Region (FY2013-FY2015E) .................................................... 23
Chart R: Talesun Solar Shipment (MW) by Region (FY2012-FY2015E) ............................................... 24
Graph E: Talesun Solar Shipment (MW) by Region (FY2012-FY2015) ................................................. 24
Chart S: Talesun Solar Sales Percentage by Region (FY2011-FY2016E) ............................................... 25
Graph F: Talesun Solar Sales Percentage by Region (FY2011-FY2016E) .............................................. 25
Chart T: Talesun Solar Downstream Projects ........................................................................................... 26
Chart U: Talesun Solar Top 10 Customer (FY2012-FY2014) ................................................................. 26

Page 3 of 35
4. WARRANTY .................................................................................................................................... 27
4.1 Warranty Claims Terms and Procedures ........................................................................................... 27
4.2 Warranty Claims Record ................................................................................................................... 32
Chart V: Warranty Claims (FY2012-1Q 2015) ........................................................................................ 32
5. SUMMARY ....................................................................................................................................... 34
6. DISCLAIMER .................................................................................................................................. 35

Page 4 of 35
List of Acronyms
AR – Account Receivable
CAPEX – Capital Expenditure
Co. – Corporation
EBIT – Earnings before Interest and Taxes
EBITDA – Earnings before Interest, Taxes, Depreciation and Amortization
EU – European Union
FY – Fiscal Year
GmbH – Gesellschaft mit beschränkter Haftung
GW – Gigawatt
Inc. – Incorporated
Ltd. – Limited
MW – Megawatt
N/A – Not Applicable
PV – Photovoltaic
Q – Quarter
RMB – Chinese Renminbi
ROA – Return on Assets
ROE – Return on Equity
ROW – Rest of the World
USA – United States of America
USD – US Dollar

Page 5 of 35
1. Talesun Company Introduction
1.1 Overview
Zhongli Talesun Solar (Zhongli Talesun, Talesun, or Talesun Solar) is a wholly owned subsidiary of
Zhongli Sci-Tech Group, (SZ: 002309) which is a national high-tech key enterprise located in Changshu,
Jiangsu. Zhongli Sci-Tech Group has been awarded “China Top 500 Private Enterprises,” “China Top
10 Independent Innovation Enterprises” and “National AAA Enterprise of Quality, Service and Credit.”
Zhongli Sci-Tech Group has six (6) national high-tech companies, the main products of which are
HV/LV cables, flame-retardant and fire-resistant cables series; optical fiber preform and optical fiber
cables series; solar PV industrial chain series; 3D printing series and electronic information products
series.
Zhongli Talesun was established in 2010 with a total investment of RMB five billion (元 5 billion). With
a one point five gigawatts (1.5GW) cell capacity and a two point five gigawatts (2.5GW) module
capacity, Zhongli Talesun has built a fully-automated production line. As of the end of 2014, Zhongli
Talesun had cumulatively invested and developed more than two gigawatts (2GW) PV power plants in
the downstream PV market.

Page 6 of 35
Graph A: Talesun Organizational Structure

Page 7 of 35
Chart A: Talesun Top 6 Shareholders as of 2Q 2015
Shareholders Share Volume
(RMB Million)
Percentage of Total
Talesun Shares
Zhongli Science and Technology Group Co.,
Ltd. 2,218.04 74.81 %
China Development Finance Co., Ltd. 533.55 17.99 %
Agricultural Bank(Suzhou) Investment
Management Co., Ltd. 22.87 0.77 %
Wuxi National League Venture Capital Fund
(Limited Partnership) 60.98 2.06 %
Agricultural Bank Wuxi Equity Investment
Fund (Limited Partnership) 91.47 3.08 %
Agricultural Bank League of Nations Wuxi
Investment Management Ltd. 38.11 1.29 %
Total 2,965.01 100%

Page 8 of 35
1.2 Leadership Team
Chart B: Executive Structure of Talesun Solar
Title Biography
Mr. Baixing Wang
Chairman of Board
/President
Mr. Baixing Wang, male, born in October 1956, Chinese nationality, college
degree, Senior Economist, Communist Party member; former Assistant Director
(of Changshu Wire and Cable 2nd Plant); Director (of Changshu Wire and Cable
3rd Plant); Chairman and General Manager (of Changshu Zhongli Cable Co.,
Ltd.); Chairman and General Manager (of Jiangsu Zhongli Cable Co., Ltd.);
Chairman and General Manager (of Jiangsu Zhongli Optical Group Ltd.);
Chairman and General Manager (of Zhongli Science and Technology Group Co.,
Ltd.).He currently is Chairman of the Board (of Changshu Zhonglian
photoelectric New Materials Co., Ltd.); Chairman (of Changshu Zhongli
Optoelectronics Technology Research Center Co., Ltd.); Chairman (of Shenzhen
Zhongli Technology Co., Ltd.); served as Chairman (of Jiangsu Changfei Zhongli
fiber optic cable Co., Ltd.); Chairman of the Board (of Jiangsu Zhongding real
estate development Co., Ltd.); Chairman (of Jiangsu Zhongji Automobile New
Material Technology Co., Ltd.); Chairman of the Board (of Changshu Municipal
Zhongsheng Investment Management Co., Ltd.); Chairman (of Jiangsu
Zhongding Advertising Media Co., Ltd.); Chairman (Zhongli Talesun Solar Co.,
Ltd.).
Mr. Weichang Yu
Member of the
Board of Directors
Mr. Weichang Yu, male, born in July 1952, Chinese nationality, without a
Residence-abroad right, Bachelor degree, Senior Engineer; former engineer,
Senior Engineer (of Wuhan Post and Telecommunications Research Institute);
Secretary, Chairman (of Changfei Optical Fiber and Cable Co., Ltd.); Materials
Manager, Marketing Manager, Quality Assurance Manager, Marketing Director,
Commercial Director; General Manager (of Jiangsu Changfei Zhongli fiber optic
cable Co., Ltd.); Vice Chairman (Jiangsu Changfei Libya fiber cable Co., Ltd.);
General Manager (of Zhongli Science and Technology Group Co., Ltd.).
He currently is a member of the Board of Directors (of Zhongli Talesun Solar
Co., Ltd.).
Mr. Zhoujian Xin
Member of the
Board of Directors
Mr. Zhoujian Xin, born in November 1966, Chinese nationality, without a
Residence-abroad right, College degree, Senior Economist, member of the
Chinese Communist Party; former Director (of brick and tile planting Tang Town
/Changshu City); Party Secretary (Zhanghu Village of Tang Town /Changshu
City); Assistant General Manager (of Jiangsu Zhongli Optical Group Ltd.);
Deputy General Manager (of Zhongli Talesun Solar Co., Ltd.). He currently is a
member of the Board of Directors (both for Zhongli Talesun Solar Co., Ltd. and
Zhongli Science and Technology Group Co., Ltd.).

Page 9 of 35
Title Biography
Mr. Changqing Hu
Member of the
Board of Directors
Mr. Changqing Hu, male, born in December 1979, Chinese nationality, no right
of abode abroad, Undergraduate degree, Intermediate Accountant; former Fixed
Asset Accountant and Tax Accountant, Financial Officer, Vice President of
Finance, Financial Manager, and Assistant General Manager (of Zhongli Science
and Technology Group Co., Ltd.). He currently is a member of the Board of
Directors, Secretary of the Board, Chief Financial Officer (of Zhongli Science
and Technology Group Co., Ltd.); Director (of Zhongli Talesun Solar Co., Ltd.).
Ms. Zeying Wang
Member of the
Board of Directors
Ms. Zeying Wang, female, born in June 1988;
Working Experience:
2013.08 ~ 2014.3: China Development Finance Co., Ltd., Equity Investment
Manager;
2014.04 - present: CDB Capital Co., Ltd., an Equity Investment Manager
Working Responsibilities:
1. Understanding the potential investment targets and financing needs, conduct
field visits for research; for the investment industry, corporate finance and
operation for analysis, report writing assessment and due diligence work;
2. To do routine work for the invested company after an investment has been
made.
Ms. Chengzhi Zhong
Member of the
Board of Directors
Ms. Chengzhi Zhong, female, born in January 1974, Chinese nationality,
graduate degree, Mid-Level Accountant;
Working Experience:
09-1999.10, the Agricultural Bank, the Bank for International Settlement Clerk /
Market Development Commissioner;
1999.10-2005.10, Sinar Mas Paper, China headquarters, Financial Manager
concurrently Subsidiary Financial Manager;
2005.10-2007.10, St. Mark Paper, Chief Financial Officer CFO;
2007.10-2012.05, Hanson Financial Leasing Companies, Minister of Market
Development and Business Development Director;
2012.05-2014.05, Shanghai New Energy Co., Ltd., China Xuan, Deputy General
Manager;
2014.07- present, the League of Nations CAF Wuxi Investment Management
Limited; (Limited Partnership) General Manager of CAF Wuxi Equity
Investment Fund Business.
Mr. Zhang Ling Jun
Chief Executive
Officer
Mr. Zhang Ling Jun, male, born in December 1966, Chinese nationality, with a
Residence-abroad right; He graduated from Tsinghua University in Beijing in
1986, and in 1992 obtained a PhD in semiconductor physics, CAS. From 1993 to
1996, he was a Project Manager in Chinese Hi-Tech Group; from Jan.1997 to
May 2003, he was an Operation Manager in Shanghai Wei Xu Semiconductor
Co., Ltd.; from June 2003 to July 2014 year, served as the Technology Vice
President and General Manager of Suzhou Canadian Solar Power Technology

Page 10 of 35
Title Biography
Co., Ltd.; in August, 2014 he came into Zhongli Talesun Solar Co., Ltd. and
began serving as Chief Executive Officer.
Mr. Ni Zhi Chun
Vice President of the
Technology
Research &
Development
Department
Mr. Ni Zhi Chun, male, born in October 1977, Chinese nationality, without a
Residence-abroad right; obtained Doctor Graduate degree; from2003 to 2015,
served as Technology Executive in Suntech Power Co., Ltd.; from 2007to 2013,
served as the Director of R & D Center of CEEG (Nanjing) New Energy CO.,
Ltd.; in June, 2012 he came into Zhongli Talesun Solar Co., Ltd. and began
serving as the Vice President of the Technology Research & Development
department.
Mr. Chen Jie
Vice President of the
Quality Control
Department
Mr. Chen Jie, male, born in September 1964, Chinese nationality, without a
Residence-abroad right; obtained Bachelor's degree, Intermediate Engineer; from
1993 to 1996, served as a manager in several foreign companies such as Siemens,
Fujitsu, and Celestica (Suzhou) Technology Co., Ltd.; from 2006to 2010, was the
Quality Director in Trina Solar; from2010to 2011, was the Product-Quality Vice
President in GD Solar; in Oct., 2011, he came into Zhongli Talesun Solar Co.,
Ltd. and began serving as the Vice President of the Quality-Control department.

Page 11 of 35
2. Company Financial Overview
2.1 Summary of Annual Reports1
The section below will analyze Talesun’s consolidated financial indices and development from FY2012
to FY2014.Also included are the previous five (5) quarter’s financial indices for the company.
Chart C: Talesun Solar Financial Indices (FY2014-FY2015)
Financial Indices Unit FY2012 FY2013 FY2014
Percentage
Change
FY2013/FY2014
Income
Statement
Revenue Million
RMB 2,946.23 4,921.13 4,071.94 (17.26%)
Cost of
Goods Sold
Million
RMB 2,228.37 3,560.63 2,911.83 (18.22%)
Gross Profit Million
RMB 717.86 1,360.50 1,160.11 (14.73%)
Management
Costs
Million
RMB 159.26 236.41 306.44 29.62%
EBIT Million
RMB 608.46 1,088.82 819.01 (24.78%)
Finance Costs Million
RMB 210.84 405.22 408.06 0.70%
Tax Costs Million
RMB 62.13 108.68 55.55 (48.88%)
Net
Profit/Loss
Million
RMB 335.49 574.92 355.39 (38.18%)
Assets
Cash and
Cash
Equivalents
Million
RMB 918.95 375.92 1,996.71 431.15%
Account
Receivable
Million
RMB 2,008.91 4,570.23 5,558.76 21.63%
Inventory Million
RMB 540.77 340.12 481.17 41.47%
1Figures provided by Talesun Solar’s finance team

Page 12 of 35
Financial Indices Unit FY2012 FY2013 FY2014
Percentage
Change
FY2013/FY2014
Current
Assets
Million
RMB 4,004.25 5,781.01 8,579.85 48.41%
Fixed Assets Million
RMB 1,927.51 2,065.18 1,932.29 (6.43%)
Total Assets Million
RMB 6,869.47 8,732.86 12,101.80 38.58%
Liabilities
and
Equity
Short Term
Borrowings
Million
RMB 437.08 1,135.00 150.00 (86.78%)
Account
Payable
Million
RMB 1,500.81 2,491.81 2,692.38 8.05%
Liabilities Million
RMB 5,498.78 6,937.76 7,663.41 10.46%
Equity Million
RMB 1,370.69 1,795.11 4,438.39 147.25%
Cash
Flow
Net Cash
Inflow from
Operating
Activities
Million
RMB (531.08) 839.20 (87.94) (110.48%)
Net Cash
Inflow from
Investment
Activities
Million
RMB (1,123.23) (404.72) (743.23) (83.64%)
Net Cash
Inflow from
Financing
Activities
Million
RMB 2,063.89 (804.76) 1,954.18 342.83%
Net Change
in Cash and
Cash
Equivalents
Million
RMB 486.63 107.00 1,226.88 1042.62%
Page 13 of 35
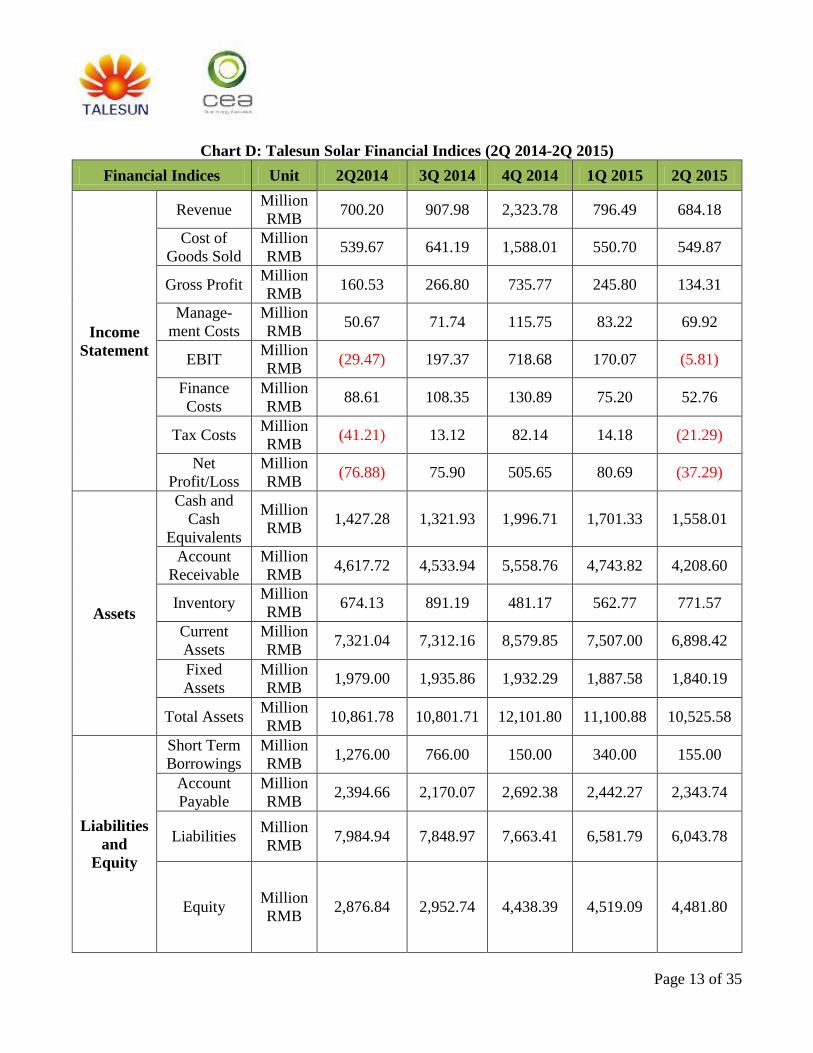
Chart D: Talesun Solar Financial Indices (2Q 2014-2Q 2015)
Financial Indices Unit 2Q2014 3Q 2014 4Q 2014 1Q 2015 2Q 2015
Income
Statement
Revenue Million
RMB 700.20 907.98 2,323.78 796.49 684.18
Cost of
Goods Sold
Million
RMB 539.67 641.19 1,588.01 550.70 549.87
Gross Profit Million
RMB 160.53 266.80 735.77 245.80 134.31
Manage-
ment Costs
Million
RMB 50.67 71.74 115.75 83.22 69.92
EBIT Million
RMB (29.47) 197.37 718.68 170.07 (5.81)
Finance
Costs
Million
RMB 88.61 108.35 130.89 75.20 52.76
Tax Costs Million
RMB (41.21) 13.12 82.14 14.18 (21.29)
Net
Profit/Loss
Million
RMB (76.88) 75.90 505.65 80.69 (37.29)
Assets
Cash and
Cash
Equivalents
Million
RMB 1,427.28 1,321.93 1,996.71 1,701.33 1,558.01
Account
Receivable
Million
RMB 4,617.72 4,533.94 5,558.76 4,743.82 4,208.60
Inventory Million
RMB 674.13 891.19 481.17 562.77 771.57
Current
Assets
Million
RMB 7,321.04 7,312.16 8,579.85 7,507.00 6,898.42
Fixed
Assets
Million
RMB 1,979.00 1,935.86 1,932.29 1,887.58 1,840.19
Total Assets Million
RMB 10,861.78 10,801.71 12,101.80 11,100.88 10,525.58
Liabilities
and
Equity
Short Term
Borrowings
Million
RMB 1,276.00 766.00 150.00 340.00 155.00
Account
Payable
Million
RMB 2,394.66 2,170.07 2,692.38 2,442.27 2,343.74
Liabilities Million
RMB 7,984.94 7,848.97 7,663.41 6,581.79 6,043.78
Equity Million
RMB 2,876.84 2,952.74 4,438.39 4,519.09 4,481.80
Page 14 of 35
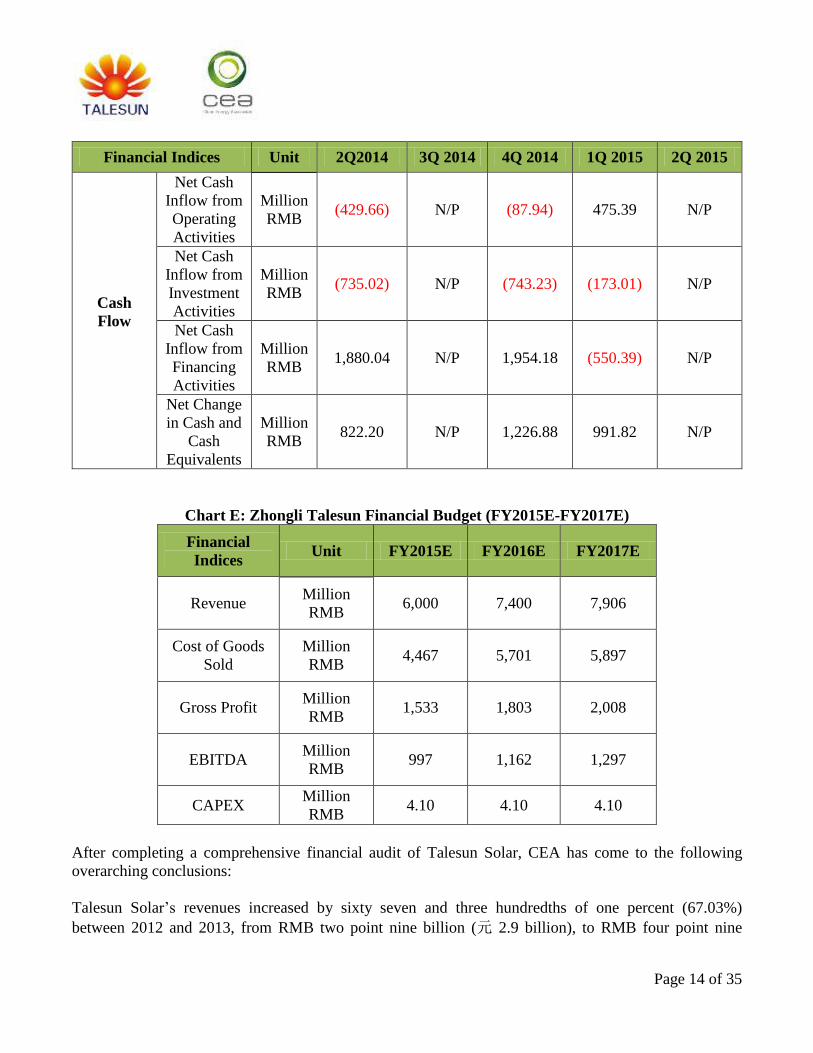
Financial Indices Unit 2Q2014 3Q 2014 4Q 2014 1Q 2015 2Q 2015
Cash
Flow
Net Cash
Inflow from
Operating
Activities
Million
RMB (429.66) N/P (87.94) 475.39 N/P
Net Cash
Inflow from
Investment
Activities
Million
RMB (735.02) N/P (743.23) (173.01) N/P
Net Cash
Inflow from
Financing
Activities
Million
RMB 1,880.04 N/P 1,954.18 (550.39) N/P
Net Change
in Cash and
Cash
Equivalents
Million
RMB 822.20 N/P 1,226.88 991.82 N/P
Chart E: Zhongli Talesun Financial Budget (FY2015E-FY2017E)
Financial
Indices Unit FY2015E FY2016E FY2017E
Revenue Million
RMB 6,000 7,400 7,906
Cost of Goods
Sold
Million
RMB 4,467 5,701 5,897
Gross Profit Million
RMB 1,533 1,803 2,008
EBITDA Million
RMB 997 1,162 1,297
CAPEX Million
RMB 4.10 4.10 4.10
After completing a comprehensive financial audit of Talesun Solar, CEA has come to the following
overarching conclusions:
Talesun Solar’s revenues increased by sixty seven and three hundredths of one percent (67.03%)
between 2012 and 2013, from RMB two point nine billion (元 2.9 billion), to RMB four point nine

Page 15 of 35
billion (元 4.9 billion). Revenues then decreased slightly to RMB four point one billion (元 4.1 billion)
in 2014. Talesun’s revenues have increased from RMB zero point seven billion (元 0.7 Billion) in 2Q
2014, to RMB zero point nine billion (元 0.9 billion) in 3Q 2014, and then jump to RMB two point three
billion (元 2.3 billion) in 4Q 2014, but then decreased slightly in 1Q 2015, to RMB zero point eight
billion (元 0.8 billion). Revenues also decreased slightly in 2Q 2015, to RMB zero point seven billion
(元 0.7 billion). According to Talesun’s next three (3) year plan, the company estimates that revenues
will increase from 2015 into the future, and plans to reach revenue levels of RMB seven point nine
billion (元 7.9 billion) in 2017.
In summary of the above, Talesun Solar’s financial indices indicate that the company experienced a big
increase in revenues from 2012 to 2013, before decreasing slightly in 2014. Gross profits and EBIT
increased between 2012 and 32013, and then decreased again in 2014, and net profits slightly fluctuated
in the past three (3) years, but the overall trend is in an upwards direction. Regarding the company’s
balance sheet, the company cash and cash equivalents also slightly fluctuated in the past years, but the
overall trend is also that in a rising direction.
Finally, revenue increases in 2013 were due partially to the rapidly increasing short term borrowings in
that year; revenues then decreased with the loan reductions in 2014.Total debt levels increased over the
past three (3) years, as did the total asset levels.
2.2 Accounts Receivable and Accounts Payable
The following tables summarize Talesun Solar’s Accounts Receivable (AR) as of 2014 and 2Q 2015.
Chart F: Talesun Solar Business AR as of 2014
Customer Name Amount (RMB in Million) % of Total
Jinchang Newsun Solar Power Co., Ltd. 620.27 14.66%
Ningxia Talesun New energy source Co., Ltd. 541.67 12.80%
Talesun Power (Hongkong) Co., Ltd. 514.74 12.17%
Hainan Talesun Power Co., Ltd. 513.28 12.13%
Baotou Talesun Power Co., Ltd. 278.80 6.59%
Yumen Newsun Solar New energy Power Co., Ltd. 243.51 5.76%
Hami Solar Power Co., Ltd. 235.67 5.57%
Talesun Solar Germany GmbH 187.14 4.42%
Moss Electrical Co., Ltd. 77.29 1.83%
Jiayuguan Talesun Solar Power Co., Ltd. 74.35 1.76%
Total Top Ten (RMB) 3,286.73 77.68%
Total Amount (RMB) 4.122.93 100%

Page 16 of 35
Chart G: Talesun Business Top AR as of 2Q 2015
Customer Name Amount (RMB in Million) % of Total
Jinchang Newsun Solar Power Co., Ltd. 621.46 14.95%
Talesun Power (Hongkong) Co., Ltd. 583.49 14.04%
Hainan Talesun Power Co., Ltd. 333.28 8.02%
Hainan Yahui New energy source Power Co., Ltd. 316.39 7.61%
GCL integrated Polytron Technologies Inc. 309.31 7.44%
Tulufan Talesun Solar Power Co., Ltd. 303.76 7.31%
Baotou Talesun Solar Power Co., Ltd. 291.13 7.00%
Yumen Talesun New energy source Power Co. ,Ltd. 235.67 5.67%
Ningxia Talesun New energy source Co., Ltd. 208.55 5.02%
Gonghe Talesun New energy source Co., Ltd. 198.42 4.77%
Total Top Ten(RMB) 3,401.46 81.84%
Total Amount (RMB) 3,961.36 100%
As of 2014, Talesun Solar held total AR of approximately RMB four point twelve billion
(元 4.12 billion). Of this amount, seventy eight and seventy eight hundredth of one percent (78.78%) is
from companies associated with Talesun. As of 2Q 2015, Talesun Solar held total AR of approximately
RMB three point ninety six billion (元 3.96 billion). Of this, sixty three and thirty three hundredth of one
percent (63.33%), is from companies associated with Talesun.
The following tables summarize Talesun Solar’s Accounts Payable (AP) as of 2014 and 2Q 2015.
Chart H: Talesun Solar Polysilicon Business AP as of 2014
Supplier Name Amount
(RMB in Million)
% of
Total AP
Zhongli Science and Technology Group Inc. 84.85 6.93%
Changshu Zhongli Talesun Material Co., Ltd. 84.74 6.92%
Taicang GCL Solar science and Technology Co., Ltd. 50.76 4.14%
Suzhou Shenteng Metal Material Co., Ltd. 49.90 4.07%
Beijing Panda International Information Technology Co., Ltd. 44.87 3.66%
CTIE Group Information Technology Co., Ltd. 42.37 3.46%
Changzhou Almaden Inc. 25.89 2.11%
Wexi Ruxing technology development Co., Ltd. 25.85 2.11%
Hubei Yongheng Solar Inc. 24.56 1.98%
Suzhou JOLYWood Inc. 23.28 1.90%
Total Top Ten (RMB) 456.77 37.28%
Total AP (RMB) 1,225.15 100.00%

Page 17 of 35
Chart I: Talesun Solar Wafer Business AP as end of 2Q 2015
Supplier Name Amount
(RMB in Million)
% of
Total AP
GCL System Integration Technology Co., Ltd. 100.36 8.32%
CSLC CSSC Guangzhou Co., Ltd. 81.76 6.78%
Changshu Talesun Solar Material Co., Ltd. 61.28 5.08%
GCL Taicang Solar Technology Co., Ltd. 57.92 4.80%
GCL Suzhou New Energy Co., Ltd. 34.57 2.87%
Hainan Tax Bureau 29.26 2.43%
Shenzhen Spaceflight Ouhua Technology Development Co., Ltd. 27.96 2.32%
CTIE Group Information Technology Co., Ltd. 25.10 2.08%
Henan Ancai Hi-Tech Inc. 24.35 2.02%
Zhejiang Gerui New Material Co., Ltd. 23.83 1.98%
Total Top Ten (RMB) 466.38 38.68%
Total AP (RMB) 1,205.82 100%
As of 2014, Talesun Solar held total AP of approximately RMB one point twenty two billion
(元 1.22 billion). Of this, forty six and forty hundredths of one percent (46.40%) is from companies
associates with Talesun. As of 2Q 2015, Talesun Solar held total AP of approximately RMB one point
twenty one billion (元 1.21 billion). Of this, approximately eighteen and fifty two hundredths of one
percent (18.52%) is from companies associates with Talesun.
2.3 Profitability
The section below will isolate and compare the net sales results and net profit results from2012 to 2014
of Talesun Solar and the previous five (5) quarters which is Talesun Solar’s wafer, cell and module
businesses.
Chart J: Talesun Solar Profitability Trends (FY2012-FY2014)
Financial Indices FY2012 FY2013 FY2014 Audit Opinion
Revenue
(Million RMB) 2,946.23 4,921.13 4,071.94
Increased and then
cut down
Change in Revenue 285.34% 67.03% (17.26%) Decreased
Gross Margin
(Million RMB) 717.86 1,360.5 1,160.11
Increased and then
slightly decreased
Change in Gross Margin 453.65% 89.52% (14.73%) Decreased
Net Profit/Loss
(Million RMB) 355.49 574.92 355.39
Increased and then
slightly decreased
Change in Net Profit 799.53% 71.37% (38.18%) Decreased to
negative

Page 18 of 35
Financial Indices FY2012 FY2013 FY2014 Audit Opinion
ROA (Return on Assets) 11.73% 13.96% 7.86% Positive year by year
ROE (Return on Equity) 32.08% (36.32%) (11.40%) Negative equity
ROA: EBIT / Average of Year Beginning Total Assets and Year Ending Total Assets
ROE: Net Profit / Average of Year Beginning Total Equity and Year Ending Total Equity
Chart K: Talesun Profitability Trends (2Q 2014-2Q 2015)
Financial Indices 2Q 2014 3Q 2014 4Q 2014 1Q 2015 2Q 2015
Revenue
(Million RMB) 700.20 907.98 2,323.78 796.49 684.18
Change in Revenue 400.21% 29.68% 155.93% (65.72%) (14.10%)
Gross Margin
(Million RMB) 160.53 266.80 735.77 245.80 134.31
Net Profit/Loss
(Million RMB) (76.88) 75.9 505.65 80.69 (37.29)
Change in Net
Profit/Loss (48.50%) (198.73%) 566.20% (84.04%) (146.21%)
Talesun Solar’s gross margin levels were four hundred fifty three and sixty five hundredths of percent
(453.65%) in 2012, and then rapidly decreased to eighty nine and fifty two hundredths of one percent
(89.52%) in 2013. For the year 2014, Talesun’s gross margin was negative fourteen and seventy three
hundredths of one percent (-14.73%) from 2013 levels, but was still at a high level overall.
Return on assets (ROA) was at a positive level from 2012 to 2014, and was positive seven and eighty six
hundredths of one percent (7.86%) in 2014. It is expected that Talesun will continue to get positive ROA
in 2015.
2.4 Financing Solvency and Operating Capacity
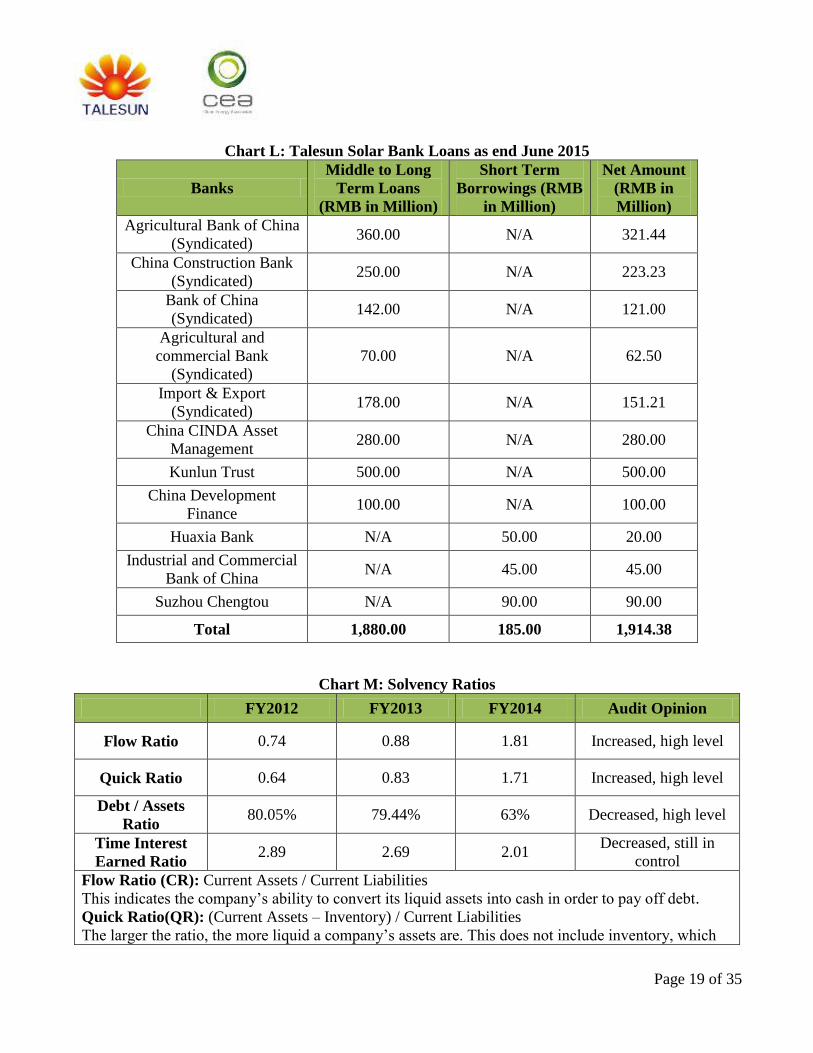
As of the end of June 2015, Talesun Solar held banks loans of RMB one and ninety two hundred billion
(元 1.92 billion). This includes middle to long term loans, which total RMB one and eighty eight
hundred billion (元 1.88 billion), and short term borrowings of RMB one hundred eighty five million
(元 185 million).
Page 19 of 35
Chart L: Talesun Solar Bank Loans as end June 2015
Banks
Middle to Long
Term Loans
(RMB in Million)
Short Term
Borrowings (RMB
in Million)
Net Amount
(RMB in
Million)
Agricultural Bank of China
(Syndicated) 360.00 N/A 321.44
China Construction Bank
(Syndicated) 250.00 N/A 223.23
Bank of China
(Syndicated) 142.00 N/A 121.00
Agricultural and
commercial Bank
(Syndicated)
70.00 N/A 62.50
Import & Export
(Syndicated) 178.00 N/A 151.21
China CINDA Asset
Management 280.00 N/A 280.00
Kunlun Trust 500.00 N/A 500.00
China Development
Finance 100.00 N/A 100.00
Huaxia Bank N/A 50.00 20.00
Industrial and Commercial
Bank of China N/A 45.00 45.00
Suzhou Chengtou N/A 90.00 90.00
Total 1,880.00 185.00 1,914.38
Chart M: Solvency Ratios
FY2012 FY2013 FY2014 Audit Opinion
Flow Ratio 0.74 0.88 1.81 Increased, high level
Quick Ratio 0.64 0.83 1.71 Increased, high level
Debt / Assets
Ratio 80.05% 79.44% 63% Decreased, high level
Time Interest
Earned Ratio 2.89 2.69 2.01
Decreased, still in
control
Flow Ratio (CR): Current Assets / Current Liabilities
This indicates the company’s ability to convert its liquid assets into cash in order to pay off debt.
Quick Ratio(QR): (Current Assets – Inventory) / Current Liabilities
The larger the ratio, the more liquid a company’s assets are. This does not include inventory, which

Page 20 of 35
takes longer to liquidate.
CR<1 and QR < 0.5, bad funding liquidity
1.5<CR<2 and 0.75<QR<1 middle funding liquidity
CR>2 and QR>1 Good funding liquidity
Debt / Assets Ratio: Proportion of Total Debt to Total Assets. Index < 1, high level
This is another measurement of a company’s health. In a worst-case scenario where the company
must liquidate its assets to pay back its debt holders, one can use this ratio to indicate the likelihood
that shareholders will be paid back.
Time Interest Earned Ratio: EBIT/ Interest Expense Index > 1, high level
This ratio is also called interest coverage, and indicates the ability to pay the interest.
Chart N: Operating Ratios
FY2012 FY2013 FY2014 Audit Opinion
Receivables Turnover
Ratio 2.16 1.50 0.73
Decreased, and then
increased
Inventory Turnover
Ratio 7.50 11.17 8.46
Increased, and then
decreased
Accounts Payable
Turnover Ratio 1.81 1.78 1.12 Decreased
Long-term Assets to
Equity Ratio 0.70 0.85 2.25 Increased
Receivables Turnover Ratio: Ratios of return of receivables, calculation by Revenues / Average
Account Receivables, Index: The higher, the better.
Inventory Turnover Ratio: Revenues/ Average Inventory
Accounts Payable Turnover Ratio: (COGS + Inventory Change)/ Average Accounts Payable
Long-term Asset Equity Ratio: (Equity)/(Fixed assets + Long-term Investment)
Talesun Solar’s flow ratio was zero point seventy four (0.74), and the company’s quick ratio was zero
point sixty four (0.64) in 2012. Both of these ratios increased in 2013, with the flow ratio rising to zero
point eighty eight (0.88), and the quick ratio rising to zero point eighty three (0.83). For the year 2014,
both the flow ratio and quick ratio increased together; the flow ratio increased to one point eighty one
(1.81), and the quick ratio increased to one point seventy one(1.71).
Talesun Solar’s receivable turnover ratio was two point sixteen (2.16) in 2012 and the number decreased
to one point five (1.50) in 2013, and then continued to decrease to zero point seventy three (0.73) in
2014.
Talesun Solar’s debt to assets ratio has decreased in the previous three (3) years. The number was eighty
and five hundredths one percent(80.05%) at end of 2012, then decreased to seventy nine and forty four
hundredths one percent (79.44%) at the end of 2013,and continued to decrease to sixty three hundredths
one percent (63%) in 2014. This number is expected to continue decreasing until it reaches a stable level.
Thanks to this lowering number, it is predicted that in the future, Talesun will have improving long term
financial stability.

Page 21 of 35
3. Production and Sales
3.1 Production Capacity
Talesun’s manufacturing bases have a total of zero point nine gigawatts (0.9GW) of cell capacity,
and one point four gigawatts (1.4GW) of module capacity in 1H2015E. The company also had eight
hundred megawatts (800MW) of both cell and module capacity in Thailand.
Chart O: Talesun Solar Cell Capacity Production and Sales (FY2012-FY1H2015E)
Year FY2012 FY2013 FY2014 FY1H2015E
Cell Capacity (MW) 500.00 500.00 1,000.00 900.00
Silicon (MW) 104.14 8.74 30.42 14.59
Polysilicon (MW) 354.03 388.20 750.02 450.29
Utilization 91.63% 79.39% 78.04% 25.83%
Graph B: Talesun Solar Cell Capacity Production and Sales (FY2012-FY1H2015E)
0.00%
10.00%
20.00%
30.00%
40.00%
50.00%
60.00%
70.00%
80.00%
90.00%
100.00%
0.00
200.00
400.00
600.00
800.00
1,000.00
1,200.00
FY2012 FY2013 FY2014 FY1H2015E
Cell Capacity (MW) Silicon (MW) Polysilicon(MW) Utilization
Page 22 of 35
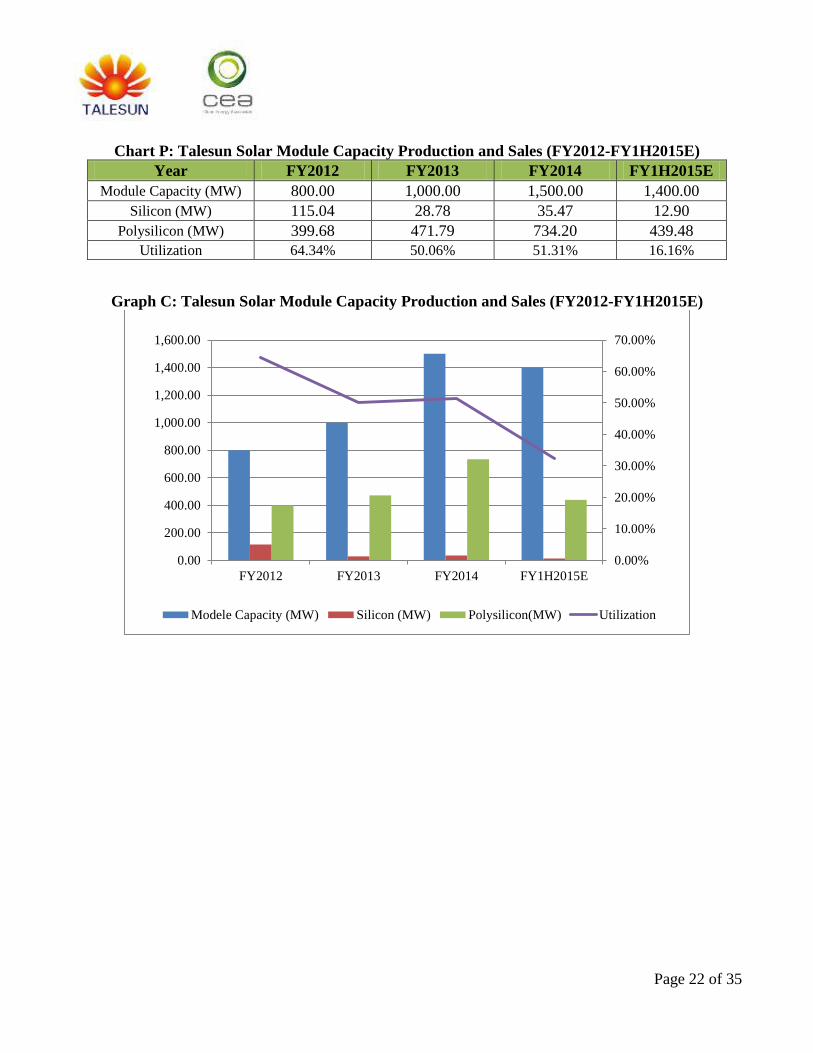
Chart P: Talesun Solar Module Capacity Production and Sales (FY2012-FY1H2015E)
Year FY2012 FY2013 FY2014 FY1H2015E
Module Capacity (MW) 800.00 1,000.00 1,500.00 1,400.00
Silicon (MW) 115.04 28.78 35.47 12.90
Polysilicon (MW) 399.68 471.79 734.20 439.48
Utilization 64.34% 50.06% 51.31% 16.16%
Graph C: Talesun Solar Module Capacity Production and Sales (FY2012-FY1H2015E)
0.00%
10.00%
20.00%
30.00%
40.00%
50.00%
60.00%
70.00%
0.00
200.00
400.00
600.00
800.00
1,000.00
1,200.00
1,400.00
1,600.00
FY2012 FY2013 FY2014 FY1H2015E
Modele Capacity (MW) Silicon (MW) Polysilicon(MW) Utilization

Page 23 of 35
3.2 Sales Overview
Sales from cell and module shipments were USD three hundred and seventy six million
(US$ 376 million) in 2013, with shipments of six hundred and forty eight megawatts (648MW) in that
year. Shipments increased to seven hundred and thirty one megawatts (731MW) in 2014, and Talesun
Solar’s revenues from cell and module sales thus increased to USD four hundred and sixty four million
(US$ 464 million) in 2014. Talesun Solar is expecting approximately one point five gigawatts (1.5GW)
of solar module sales in 2015. Cell and module shipment revenues are USD one hundred and seventy six
(US$ 176 million) actually in Q1 2015, and expect to catch a higher sales amount in 2015.
Chart Q: Talesun Solar Sales (USD) by Region (FY2013-FY2015E)
Region(USD) FY2013 FY2014 FY2015E
China 219,269,567 347,314,365 159,228,985
USA, Europe 120,323,415 78,991,065 2,345,026
Asia-Pacific 28,408,145 37,141,186 14,623,673
ROW 7,614,958 644,294 233,430
Total 375,616,086 464,090,909 176,431,114
Graph D: Talesun Solar Sales (USD) by Region (FY2013-FY2015E)
-
50,000,000
100,000,000
150,000,000
200,000,000
250,000,000
300,000,000
350,000,000
400,000,000
2013 2014 2015
China USA, Europe Asia-Pacific ROW

Page 24 of 35
Chart R: Talesun Solar Shipment (MW) by Region (FY2012-FY2015E)
Region (MW) FY2012 FY2013 FY2014 FY2015E
China 165.02 414.72 554.80 1,000.00
USA, Europe 272.06 174.96 116.80 335.00
Asia-Pacific 4.46 45.36 58.40 150.00
ROW 4.46 12.96 1.00 15.00
Total 446.00 648.00 731.00 1,500.00
Graph E: Talesun Solar Shipment (MW) by Region (FY2012-FY2015)
-
200.00
400.00
600.00
800.00
1,000.00
1,200.00
2012 2013 2014 2015E
China USA, Europe Asia-Pacific ROW

Page 25 of 35
Chart S: Talesun Solar Sales Percentage by Region (FY2011-FY2016E)
Region % FY2011 FY2012 FY2013 FY2014 FY2015E FY2016E
China 69% 37% 64% 74% 67% 60%
USA, Europe 30% 61% 27% 16% 22% 28%
Asia-Pacific 0% 1% 7% 8% 10% 10%
ROW 1% 1% 2% 2% 1% 2%
Graph F: Talesun Solar Sales Percentage by Region (FY2011-FY2016E)
0%
10%
20%
30%
40%
50%
60%
70%
80%
90%
100%
2011 2012 2013 2014 2015E 2016E
China USA, Europe Asia-Pacific ROW

Page 26 of 35
Chart T: Talesun Solar Downstream Projects
Project Location Volume
(MW)
Investment
(RMB in
Million)
Situation
Talesun Solar (Thailand) Co., Ltd. 500 450.00 Under construction
Talesun Solar (Tulufan) New
Material Co., Ltd. 60 30.00 Under construction
Talesun Solar (Baotou) New
Material Co., Ltd. 60 30.00 Under construction
Total 201.688 510.00
Chart U: Talesun Solar Top 10 Customer (FY2012-FY2014)
Region Customer Watt (W) Value (USD)
Germany Axitec GmbH 20,095,875 12,134,520
Spain Table Trading SL 2,852,400 1,848,355
UK Egmanton Park Ltd. 9,680,600 6,269,281
UK Flit Solar Park Ltd. 8,510,625 5,511,591
UK
Gaultney Solar Park
Limited 21,662,500 14,028,915
UK Moss Electrical Co. Ltd. 41,138,400 28,544,741
UK Radstone P.V. Ltd. 5,246,625 3,397,782
UK Rowles Solar Park Ltd. 10,812,500 7,002,315
UK SPRIGGS SOLAR Ltd. 12,197,350 8,342,987
Japan Nice Corporation 25,000,000 15,740,000
Romania Tecnology Com SRL 4,000,220 2,628,625
Total 161,197,095 105,449,112
Page 27 of 35
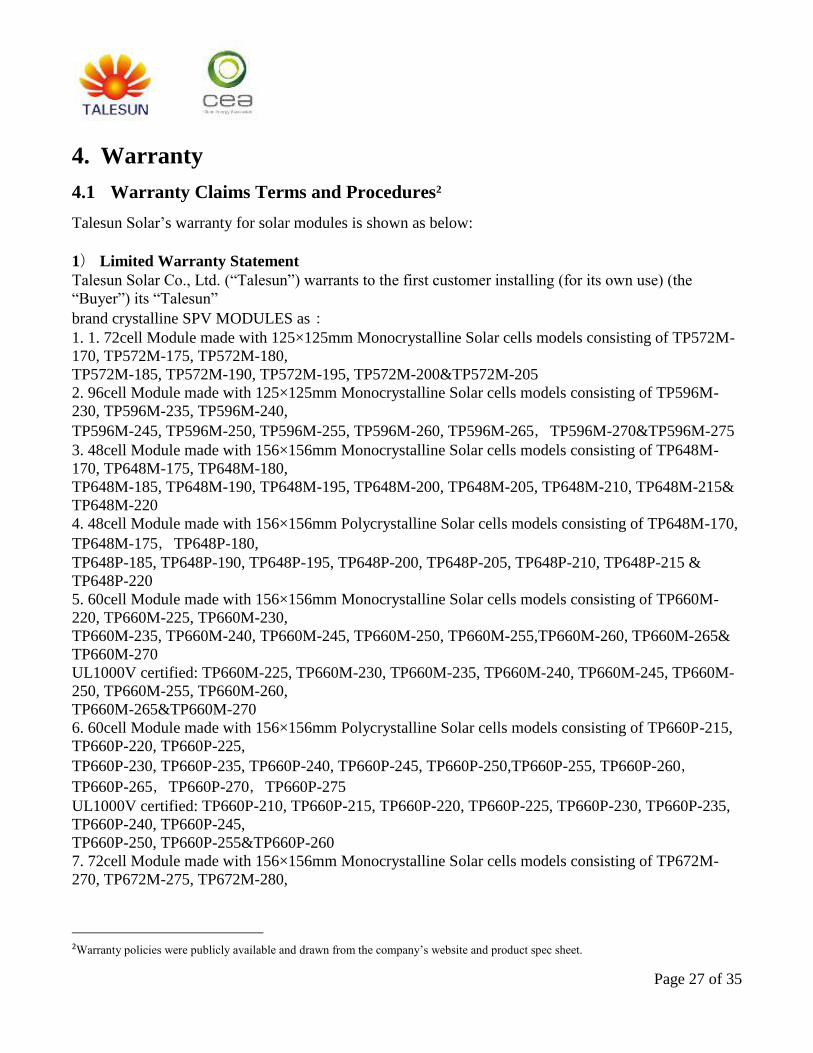
4. Warranty
4.1 Warranty Claims Terms and Procedures2
Talesun Solar’s warranty for solar modules is shown as below:
1) Limited Warranty Statement
Talesun Solar Co., Ltd. (“Talesun”) warrants to the first customer installing (for its own use) (the
“Buyer”) its “Talesun”
brand crystalline SPV MODULES as:
1. 1. 72cell Module made with 125×125mm Monocrystalline Solar cells models consisting of TP572M-
170, TP572M-175, TP572M-180,
TP572M-185, TP572M-190, TP572M-195, TP572M-200&TP572M-205
2. 96cell Module made with 125×125mm Monocrystalline Solar cells models consisting of TP596M-
230, TP596M-235, TP596M-240,
TP596M-245, TP596M-250, TP596M-255, TP596M-260, TP596M-265,TP596M-270&TP596M-275
3. 48cell Module made with 156×156mm Monocrystalline Solar cells models consisting of TP648M-
170, TP648M-175, TP648M-180,
TP648M-185, TP648M-190, TP648M-195, TP648M-200, TP648M-205, TP648M-210, TP648M-215&
TP648M-220
4. 48cell Module made with 156×156mm Polycrystalline Solar cells models consisting of TP648M-170,
TP648M-175,TP648P-180,
TP648P-185, TP648P-190, TP648P-195, TP648P-200, TP648P-205, TP648P-210, TP648P-215 &
TP648P-220
5. 60cell Module made with 156×156mm Monocrystalline Solar cells models consisting of TP660M-
220, TP660M-225, TP660M-230,
TP660M-235, TP660M-240, TP660M-245, TP660M-250, TP660M-255,TP660M-260, TP660M-265&
TP660M-270
UL1000V certified: TP660M-225, TP660M-230, TP660M-235, TP660M-240, TP660M-245, TP660M-
250, TP660M-255, TP660M-260,
TP660M-265&TP660M-270
6. 60cell Module made with 156×156mm Polycrystalline Solar cells models consisting of TP660P-215,
TP660P-220, TP660P-225,
TP660P-230, TP660P-235, TP660P-240, TP660P-245, TP660P-250,TP660P-255, TP660P-260,
TP660P-265,TP660P-270,TP660P-275
UL1000V certified: TP660P-210, TP660P-215, TP660P-220, TP660P-225, TP660P-230, TP660P-235,
TP660P-240, TP660P-245,
TP660P-250, TP660P-255&TP660P-260
7. 72cell Module made with 156×156mm Monocrystalline Solar cells models consisting of TP672M-
270, TP672M-275, TP672M-280,
2Warranty policies were publicly available and drawn from the company’s website and product spec sheet.

Page 28 of 35
TP672M-285, TP672M-290, TP672M-295, TP672M-300, TP672M-305,TP672M-310 , TP672M-315,
TP672M-320&TP672M-325
UL1000V certified: TP672M-275, TP672M-280, TP672M-285, TP672M-290, TP672M-295, TP672M-
300, TP672M-305,TP672M-310,
TP672M-315, TP672M-320&TP672M-325
8. 72cell Module made with 156×156mm Polycrystalline Solar cells models consisting of TP672P-260,
TP672P-265, TP672P-270,
TP672P-275,TP672P-280,TP672P-285,TP672P-290,TP672P-295,TP672P-300,TP672P-305,TP672P-
310,TP672P-315,TP672P-320,
TP672P-325&TP672P-330
UL1000V certified: TP672P-260, TP672P-265, TP672P-270, TP672P-275, TP672P-280, TP672P-285,
TP672P-290, TP672P-295,
TP672P-300, TP672P-305&TP672P-310
(the product), when shipped in its original container, will be free from defecve workmanship and
materials under normal applica on, installa on, use and service condions, and agrees that it will, at its op
on, either repair the defect or replace the defecve Product or part thereof with a new or remanufactured
equivalent at no charge to the purchaser for parts or labor for the period(s) set forth below.
This warranty does not apply to any appearance items of the Product nor to the addional excluded item(s)
set forth below nor to any Product the exterior of which has been damaged or defaced, which has been
subjected to misuse, abuse, abnormal service or handling, or which has been altered or modified in
design or construc on. In order to enforce the rights under this limited warranty, the purchaser should
follow the steps set forth below and provide proof of purchase to Talesun.
The limited warranty described herein is in addi on to whatever implied warranes may be granted to
purchasers by law. All impliedwarranes including the warran of merchantability and fitness for use are
limited to the period(s) from the date of delivery set forth below. Neither the sales personnel of Talesun
nor any other person is authorized to make any warran other than those described herein, or to extend
the dura on of any warran s beyond the me period described below on behalf of Talesun.
The warran described herein shall be sole and exclusive warran granted by Talesun and shall be the sole
and exclusive remedy available to the purchaser. Correc on of defects, in the manner and for the period
of me described herein, shall constute complete fulfillment of all liabilies and responsibilies of Talesun
to the purchaser with respect to the Product and shall cons tute full sasfac on of all claims, whether
based on contract, negligence, and strict liability otherwise. In no event shall
Talesun be liable, or in any way responsible, for any damages or defects in the Product which were
caused by repairs or empted repairs performed by anyone other than Talesun or authorized service
providers. Nor shall Talesun be liable or in any way responsible for any incidental or consequen al
economic or property damage. Talesun´s aggregate liability, if any, in damages or otherwise, shall not
exceed the invoice value as paid by the purchaser, for the single unit of SPV MODULE.
2)10 Year Limited Product Warranty
Page 1 of 3
Talesun warrants for the Product(s) for a period of 10 years commencing on the Warranty Start Date ,Product(s) shall be free from defects in materials and workmanship that have an effect on module
functionality under normal application, installation, use and service conditions as specified in Talesun’s
standard product technical specification.

Page 29 of 35
Talesun guarantees that the Product(s) will maintain the mechanical integrity and stability in accordance
with approved operation methods described in its installation instructions; the glass of a module will
maintain its integrity provided there are no indications of localized impacts or external forces; and that
the cable and connector plug of a module will remain safe and operational provided modules are
professionally installed. Any damages caused by abrasion, improper installation or animals are exempt
from this warranty.
Claims under the warranty can only be accepted if the Buyer can provide proof that the malfunctioning
or non-conformity of the Product(s) results exclusively from defects in materials and/or workmanship
under normal application, installation, use and service conditions specified in Talesun’s standard product
specification. Any color change on module or any other changes on module appearance do not represent
defects, insofar as the change in appearance does not stem from defects in material and/or workmanship,
and does not cause degradation of functionality of the module.If the Product(s) fails to conform to this
warranty, Talesun will, at its option, either repair or replace the defective Product(s), or refund as per the
market price of the Product(s) at the time of the claim submission, or provide an appropriate residual
market value of the Product(s) at the time of the claim submission as compensation.
3)25 Year Limited Performance Warranty
Talesun guarantees that for a period of twenty-five years the module will maintain a performance as set
forth below:
Monocrystalline Solar Cell Modules:
a) During the first year, Talesun guarantees the nominal power output of the Product will be no less than
97% of the labeled power output.
b) From year 2 to year 24, the nominal power decline will be no more than 0.7%; by the end of year 25,
the nominal power output will be no less than 80% of the labeled power output.
Polycrystalline Solar Cell Modules:
a) During the first year, Talesun guarantees the nominal power output of the Product will be no less than
97.5% of the labeled power output.
b) From year 2 to year 24, the nominal power decline will be no more than 0.7%; by the end of year 25,
the nominal power output will be no less than 80.7% of the labeled power output.
The actual power output of the Product shall be determined for verification using Standard Testing
Conditions only. The actual power output measurement is either carried out by a Talesun facility or by a
Talesun recognized 3rd party testing institute. Testing equipment tolerances will be applied to all actual
power output measurements.
In the event, power falls below the appropriate warranted amount, Talesun will replace, repair, or
provide additional Product(s) to compensate for the loss, or will provide a refund prorated to the amount
of power loss below the warranty.
4)Warranty Effective Date
The warranty effective date shall be defined as the date of sale with the certifiable invoice (SALES
DATE) to the Buyer or 90 (ninety) days after the delivery by Talesun, whichever date is earlier.

Page 30 of 35
5)Additional Item(s) Excluded from Warranty Coverage:
Warranty coverage does not apply when:
a) The Product is improperly installed or abused or misused;
b) The Product is installed in a mobile or marine environment, subjected to improper voltage or power
surges or abnormal environmentalcondions (such as acid rain or other pollu on);c) The components in
the construc on based on which the module is mounted are defecve;
c) The components in the construc on based on which the module is mounted are defecve;
d) External corrosion, mold discolora on or the like occurs;
e) Defects caused by the Product being subjected to any of the following: extreme thermal or
environmental condions or rapid changes in such condions, corrosion, oxida on, unauthorized
modificaons or connecons, unauthorized opening or repair, repair by use of unauthorized spare parts,
accident, force of nature (such as lightning strike), influence from chemical product or other acts beyond
Talesun reasonable control (including but not limited to damage by fire, flood, etc.);
f) Death or injury to personsresulng from any cause other than negligence of Talesun, its employees or
representaves;
g) Incidental, consequen al or special damages such as loss of use, loss of profits, revenues, business,
goodwill, damage to reputa on or expensed payable to a third party.
h) Module failed, such as pid (potential induced degradation) and snail trail, which worse system design,
worse installation and worse system components mismatch induced.
6)Various
The repair or replacement of the SPV MODULES or the supply of addional SPV MODULES does not
cause the beginning of new warranty terms, nor shall the original terms of this “Limited Warranty for
SPV Module” be extended. Any replaced SPV MODULES shall become the property of Talesun made
for their disposal. Talesun has the right to deliver another type (different in size, color, shape and/or
power) in case Talesundisconnue producing the replaced SPV MODULES at the me of the claim.
Page 2 of 3
7)Force Majeure
Talesun shall not be responsible or liable in any way to the purchaser or any third-party arising from any
nonperformance or delay in performance of any terms and condions of sale, including this “Limited
Warranty for SPV Module” , due to acts God, war, riots, strikes, unavailability of suitable and sufficient
labor, material, or capacity or technical or yield failures and any unforeseen event beyond its control,
including, without limitaons, any technological or physical event or condi on which is not reasonably
known or understood at the me of the sale of the SPV MODULES or the claim.
8)What to do to claim warranty
If the purchaser feels a jus fied claim covered by this “Limited Warranty for SPV Module”, an
immediate no fica on directly to Talesun at the address shown below shall be filed. Together with the no
fica on, the purchaser should enclose the evidence of the claim with the corresponding serial number of
the SPV MODULE(s) and the invoice on which the SPV MODULES have been purchased.

Page 31 of 35
Be sure to have Proof of Purchase available such as the receipt. The return of any Products will not be
accepted unless prior written authorization has been given by Talesun. If the Buyer ship the Product, be
sure it is insured and packaged securely, Talesun will not be responsible for any transportation charge,
customs clearance or any other costs for return of the Product(s), or for reshipment of any repaired or
replaced Product(s), or costs related to installation, removal or reinstallation of the Product(s).
In case of any discrepancy in a warranty-claim, a first-class internaonal test-ins tute such as TUV
Rheinland in Cologne, Germany or Arizona State University, USA shall be involved to judge the claim
finally. The final explana on right shall be borne by Talesun.
Warranty claims will not be honored if the type or serial number of the SPV MODULES have been
altered, removed or made illegible.
9)Severability
If a part, provision or clause of this “Limited Warranty for SPV Module”, or the applica on thereof to
any person or circumstance, is held invalid, void or unenforceable, such holding shall not affect and
shall leave all other parts, provisions, clauses or applicaons of this “Limited Warranty for SPV Module”,
and to this end such other parts, provisions, clauses or applicaons of this “Limited Warranty for SPV
Module” shall be treated as severable.
Page 3 of 3
Control No.: TS-AT-123
Revision: A6
Issue Date: Jue. 2015

Page 32 of 35
4.2 Warranty Claims Record3
The following table lists the past customer claims recorded by Talesun Solar.
Chart V: Warranty Claims (FY2012-1Q 2015)
3As per the manufacturer
Claim
ID Client Country
Feedback Date
Module Type
Problem Type
Pieces Result Suggestion Corrective
Action Progress
CR
1210001 ReisSolar Germany 2012/10/12 TP572M
Appearance
problem
5 Replacement Replace
for customer
Strengthen
Staff management OK
CR
1303002
Buyer
World
B.V.
EU 2013/3/6 P660M-
250- Siliconpotting 1 Replacement
Replace
for customer
Increase
Curing time OK
CR
1304003 Actensys
Germany
Bavaria 2013/4/18 TP660
Appearance
problem
2 Replacement ELok Explain to
customer OK
CR
1306004 Enalco Italy 2013/6/12 TP660P
Appearance
problem 1 Replacement Powerok
Explain to
customer OK
CR
1403005 JKBEnergy USA 2014/3/14 672P Glass breakage 1 Replacement
Replace
for customer
To inform the
supplier to improve
and strengthen the
supervision.
OK
CR
1412006 G3 JAPAN 2014/12/29 672P
Appearance
problem 1 N/A N/A N/A OK

Page 33 of 35
CR
1505007 Gtree JAPAN 2015/24/5 TP672P Glass breakage 1 Replacement
Replace for
customer
Supplier
improvement OK
CR
1505008
Nice JAPAN 2015/5/11 TP660P VOCis too low 1 Replacement Replace for
customer
Strengthen staff
management OK
CR
1506009
NihhonEco
Solar JAPAN 2015/6/30 TP660P
Jbbox
displacement 1 Replacement
Replace for
customer
Strengthen the
workshop
temperature and
humidity control
OK

Page 34 of 35
5. Summary
The CEA Financial Manager Lucia Zhu visited the Talesun Solar factory in Changshu, Jiangsu, China
on September 15, 2015. During the financial audit, the CEA auditors met a number of employees at
Talesun Solar, including members of the finance, sales, marketing, production, after service and human
resource departments.
The CEA auditing team was able to collect documents from the factory to evaluate the company’s
financial and operating health. Among the detailing material were key financial statements, management
biographies, production and sales figures, bank loan information, insurance policies and previous
customer claims records. Furthermore, the CEA financial audit team conducted further research and
collected information from other channels in order to properly assess the financial risk of the company.
In summary, CEA concluded that although Talesun Solar has faced a higher level of debt to assets ratio
in the past, the company will continue to stay in operation and has a very low probability of falling into
bankruptcy over the next twelve (12) months. Reasons that led to this conclusion are the increasing
revenues, increasing gross profit and EBIT levels, stable net profits, the increasing cash and cash
equivalents, and finally the strong support from banks in the form of loans.

Page 35 of 35
6. Disclaimer
The information in this document is confidential and may be legally privileged. The report is provided
by Clean Energy Associates Limited and is intended solely for the use of Solar Insurance & Finance,
and other related parties who may need to refer to this financial analysis. Access to this document by
another entity is strictly unauthorized. If you are not the intended recipient, please advise us
immediately and delete this document. No representation, warranty or undertaking, express or implied,
is made as to, and no reliance should be placed on, the fairness, accuracy, completeness or correctness
of the information or the opinions contained herein. Neither CEA nor any of its affiliates, advisors or
representatives will be liable (in negligence or otherwise) for any loss howsoever arising from any use
of this document.