
Zhong Shan University Guangzhou 510275, China ass
15
Journal of Coastal Research Fort Lauderdale, Florida Response of the Pearl River Estuarine Complex to the Meteorological Forcing and River Inflow: A Cybernetics Approach Chaoyu Wu Institute of Estuarine and Coastal Studies College of Earth and Environment Sciences Zhong Shan University Guangzhou 510275, China ABSTRACT _ .tllllllll:. ass • • --: .... , w= WU, c., 1991. Response of the Pearl River estuarine complex to the meteorological forcing and river inflow: Acybernetics approach. Journal or Coastal Research, 7(4), 1153-1167. Fort Lau- derdale (Florida). ISSN 0749-0208. The present paper is a study on the sub-tidal sea level dynamic system from an extensive inves- tigation on the "sea-river-atmosphere" system in the Pearl River Delta, Guangdong, China. The two-year long continuous time series records of sea level and meteorological forcing collected from more than 18 stations in the Pearl River Delta area reveal large amplitude fluctuations within the sub-tidal range 0.01-0.5 cpd. These fluctuations, according to power spectrum and coherence spectrum analysis, represent direct or indirect response of the estuary to variations in river inflow, wind stress and atmospheric pressure. MISO CAR model for each station is identified based on 1982 time series records. The system output is sub-tidal sea level, system inputs are river discharge. wind stress and atmospheric pressure. Models obtained and validated are used to conduct multistep prediction of 1983 sub- tidal sea level with good agreement. Frequency response analysis based on the models provides some important insights into the system. It is found that the maximum response of the estuary occurs at the frequencies 0.025-0.07 cpd. System simulations reveal, quantitatively, the rela- tive importance and variations of the control variables on sea level in the estuarine complex. Response analyses in both frequency and time domains indicate that the non tidal sea level sys- tem is an oscillatory system. Its effects on estuarine circulation, volume, salt and sediment transport, and the formation ofturbidity maximum need further study. ADDITIONAL INDEX WORDS: Sub-tidal, sea level, system simulation, CAR model, multistep prediction, China. 1 I l f I INTRODUCTION The Pearl River Delta is located in Guang- dong province, South China. After entering the delta area, West River, North River and East River, which are the three main tributaries of the Pearl River, bifurcate continuously and form the network system of the Pearl River, one of the most complicated network systems in the world. The Pearl River discharges into the South China Sea through eight major outlets (estuaries), which are interrelated through the network system (Figure 1). In his pioneering work on estuarine dynam- ics, PRITCHARD (1952, 1954, 1955, 1956, 1958) clearly identified the role of baroclinic pressure gradients in estuaries in driving the classical patterns of non-tidal circulation. The effects of 90130 received 28 October 1990; accepted in revision 10 April 1991. This Project is supported by 1989 National Natural Sciences Foun- dation No. 48970278. low-frequency, time varying wind stress, river run-off, and atmospheric pressure on non-tidal estuarine variability were ignored for many years. Largely as the consequences oflong-term field studies undertaken in the Chesapeake Bay and elsewhere, it has been demonstrated that the sub-tidal frequency band from .01 to 1.0 cpd is highly energetic (WEISBERG, 1976; ELLIOTT, 1978; ELLIOTT and WANG, 1978; WANG, 1979(1),(2); CHUANG and WISEMAN, 1983; WISE- MAN, 1983; Wu, 1986). These studies have established empirical relations between mete- orological forcing and estuary response in the frequency domain. OLSON (1986) transferred the momentum, continuity and salt balance equations from the time domain into the fre- quency domain, and presented a spectral model to calculate the response of the Chesapeake Bay to meteorological forcing and river run-off. The results are in good agreement with Wang's time-series models.
Transcript of Zhong Shan University Guangzhou 510275, China ass

Journal ofCoastal Research Fort Lauderdale, Florida
Response of the Pearl River Estuarine Complexto the Meteorological Forcing and River Inflow:A Cybernetics Approach
Chaoyu Wu
Institute of Estuarine and Coastal StudiesCollege of Earth and Environment SciencesZhong Shan UniversityGuangzhou 510275, China
ABSTRACT _
.tllllllll:.ass• •--: ~ ~.
...., w=
WU, c., 1991. Response of the Pearl River estuarine complex to the meteorological forcing andriver inflow: Acybernetics approach. Journal or Coastal Research, 7(4), 1153-1167. Fort Lauderdale (Florida). ISSN 0749-0208.
The present paper is a study on the sub-tidal sea level dynamic system from an extensive investigation on the "sea-river-atmosphere" system in the Pearl River Delta, Guangdong, China. Thetwo-year long continuous time series records of sea level and meteorological forcing collectedfrom more than 18 stations in the Pearl River Delta area reveal large amplitude fluctuationswithin the sub-tidal range 0.01-0.5 cpd. These fluctuations, according topower spectrum andcoherence spectrum analysis, represent direct or indirect response of the estuary to variationsin river inflow, wind stress and atmospheric pressure.
MISO CAR model for each station isidentified based on 1982 time series records. The systemoutput is sub-tidal sea level, system inputs are river discharge. wind stress and atmosphericpressure. Models obtained and validated areused toconduct multistep prediction of1983 subtidal sea level with good agreement. Frequency response analysis based on the models providessome important insights into the system. It is found that the maximum response of the estuaryoccurs at the frequencies 0.025-0.07 cpd. System simulations reveal, quantitatively, the relative importance and variations of the control variables on sea level in the estuarine complex.Response analyses in both frequency and time domains indicate that the non tidal sea level system is an oscillatory system. Its effects on estuarine circulation, volume, salt and sedimenttransport, and theformation ofturbidity maximum need further study.
ADDITIONAL INDEX WORDS: Sub-tidal, sea level, system simulation, CAR model, multistepprediction, China.
1
Ilf
I
INTRODUCTION
The Pearl River Delta is located in Guangdong province, South China. After entering thedelta area, West River, North River and EastRiver, which are the three main tributaries ofthe Pearl River, bifurcate continuously andform the network system of the Pearl River, oneof the most complicated network systems in theworld. The Pearl River discharges into theSouth China Sea through eight major outlets(estuaries), which are interrelated through thenetwork system (Figure 1).
In his pioneering work on estuarine dynamics, PRITCHARD (1952, 1954, 1955, 1956, 1958)clearly identified the role of baroclinic pressuregradients in estuaries in driving the classicalpatterns of non-tidal circulation. The effects of
90130 received 28 October 1990; accepted in revision 10 April 1991.This Project issupported by 1989 National Natural Sciences Foundation No. 48970278.
low-frequency, time varying wind stress, riverrun-off, and atmospheric pressure on non-tidalestuarine variability were ignored for manyyears. Largely as the consequences oflong-termfield studies undertaken in the Chesapeake Bayand elsewhere, it has been demonstrated thatthe sub-tidal frequency band from .01 to 1.0 cpdis highly energetic (WEISBERG, 1976; ELLIOTT,1978; ELLIOTT and WANG, 1978; WANG,1979(1),(2); CHUANG and WISEMAN, 1983; WISEMAN, 1983; Wu, 1986). These studies haveestablished empirical relations between meteorological forcing and estuary response in thefrequency domain. OLSON (1986) transferredthe momentum, continuity and salt balanceequations from the time domain into the frequency domain, and presented a spectral modelto calculate the response of the Chesapeake Bayto meteorological forcing and river run-off. Theresults are in good agreement with Wang'stime-series models.

1154 Wu
oP(;J'V
C m 20 3C KMI j
Figure 1. Study area.
In this paper, cybernetics models are appliedin the first time to simulate the natural systemwith the sub-tidal sea level at 15 stations in thePearl River estuarine complex as system output, river discharge, wind stress and atmospheric pressure as system inputs. Fifteen MISO(Multiple Input Single Output) CAR (Controlled Autoregressive) models identified from1982 data then are used to make one- andmulti-step predictions of 1983 data, and analyze the characteristics of the estuarineresponse to external forcing, both in the frequency and time domains.
Data Sets
sha, Hengmen, Xiaolan, Sanzao, Daheng, Denglong, Zhuyin, Zhongda and Daao (Figure 1).River discharge (daily average) at Makouwhich is about 150 km from the river mouth,wind data from Hong Kong, and atmosphericpressure at Shenzhen over the same period werecollected. The wind velocity, v , was converted toa quantity proportional to stress vlvl and thenresolved into north-south and east-west components. All time series were low-pass filtered,with a 48 hour cutoff frequency and 24 hourresampling interval. Each one-year long timeseries thus obtained actually has 355 datapoints (Figure 2 and Figure 3) because of thedata loss during the filtering process.
Two-year long records (January 1, 1982 toDecember 31, 1983) of sea level records alongthe estuaries in the delta area were examinedat 15 locations: Huangbu, Fubiao , Shanbanzhou, Banshawei, Wanqinsha, Lingshan, Nan-
Methods
Autoregressive (AR) Spectral Estimation
If the series satisfies a discrete parameterAR(k) model of the form:
Journal of Coastal Research, Vol. 7, No.4, 1991
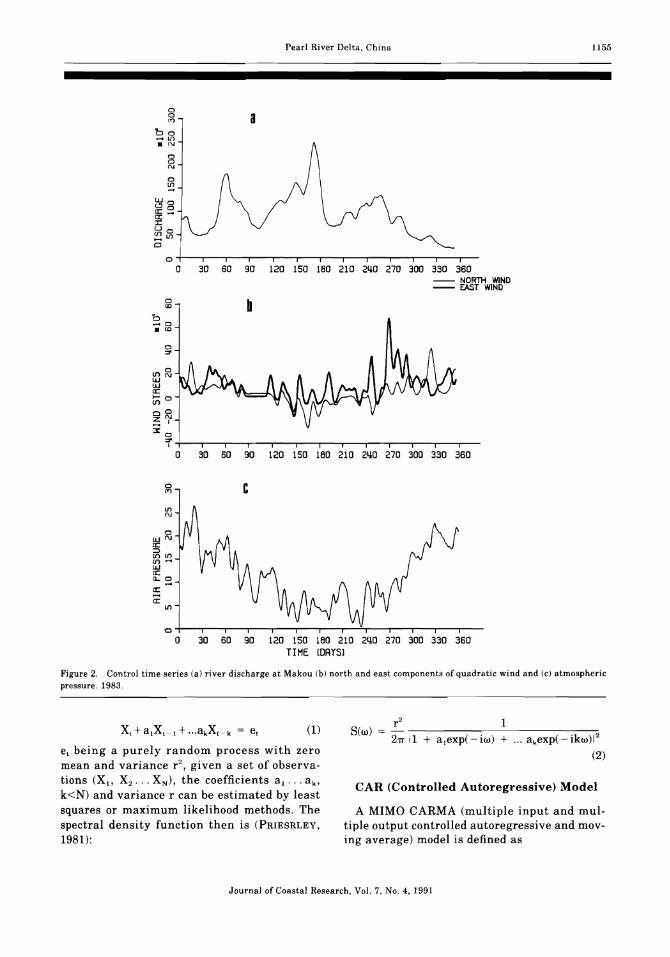
Figure 2. Control time series (a) river discharge at Makou (b) north and east components of quadratic wind and (c) atmosphericpressure. 1983.
1155
a
c
b
Pearl River Delta, China
30 60 90 120 150 180 210 2110 270 300 330 360-- NORTH WIND-- EAST WIND
30 60 90 120 150 180 210 2110 270 300 330 360
30 60 90 120 150 180 210 2110 270 300 330 360TIME lORrS]
00
'"bo.... It>.'"8
'"0
~
"-1 0~o
~-:I:W o~It>0
0
0
0!Xl
b.... 0.'"
0
""l3~"-Ia:~o
DoZN
-'::1:0
""I0
0
'"It>N
0UJNa:~U")1t>U")-"-Ia:a..ga:a:
It>lII)
I1
IlJ
)
I,t
J1j
Journal of Coastal Research, Vol. 7, No.4, 1991
CAR (Controlled Autoregressive) Model
A MIMO CARMA (multiple input and multiple output controlled autoregressive and moving average) model is defined as
f
11I
1
Xt+aIXt-I+ ...akXt-k = e, (1)
e, being a purely random process with zeromean and variance r", given a set of observations (Xl' Xz ' " XN ) , the coefficients a, ... a k ,
k<N) and variance r can be estimated by leastsquares or maximum likelihood methods. Thespectral density function then is (PRIESRLEY,
1981):
s(w)1
1156 Wu
a"' a
~1-- DAAO---- ZHUYlN-- DENGLONG
a,..~o
Wo'-"0<r.:;;0
§l
9s9
30 60 90 120 ISO 180 210 2~0 270 300 330 360
-- DENGLONGDAliENGSANZAO
~ ~ _ m = = _ = _TIME lOATS)
b
9030 60
fii
9~~:--:::-~-'-----.--r------r---,---,.--..-----,.-
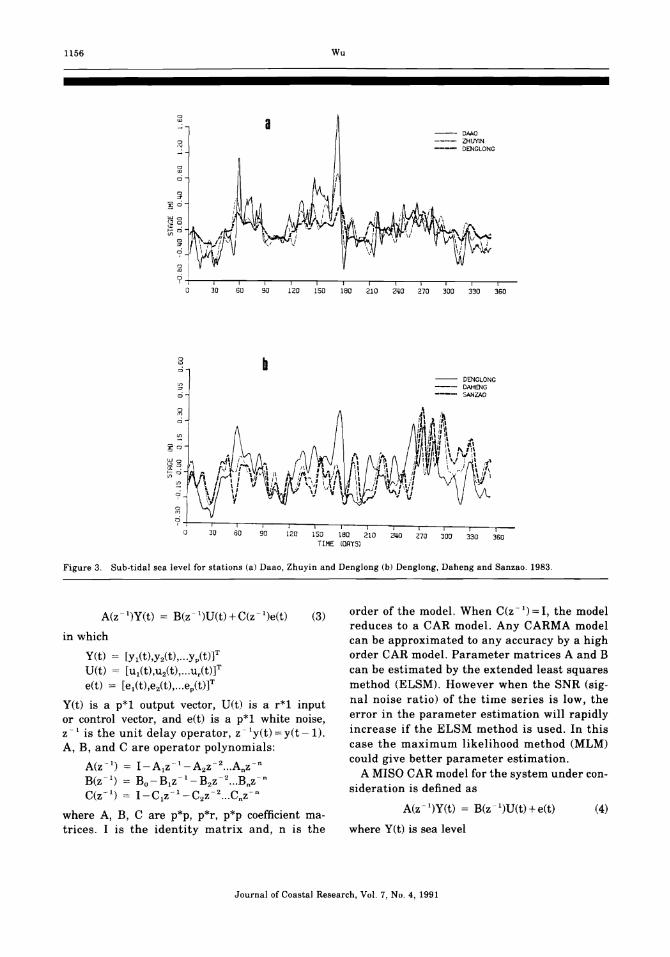
Figure 3. Sub-tidal sea level for stations (a) Daao, Zhuyin and Denglong (b) Denglong, Daheng and Sanzao. 1983.
Ytt) = [Yl(t),yit), y/tWU(t) = [u1(t),U2(t), ur(tW
ett) = [e1(t),e2(t), e/tW
Y(t) is a p*1 output vector, Utt) is a r*1 inputor control vector, and e(t) is a p*1 white noise,z -I is the unit delay operator, z .ly(t) = y(t -1).A, B, and C are operator polynomials:
A(Z·l) = I-AIZ·'1_A2Z-2 Anz·nB(Z·l) = Bo-BlZ·l_B2Z·2 Bnz·nC(Z·I) = I-CIZ·l_C2Z·2",Cnz-n
where A, B, Care p*p, p*r, p*p coefficient maotrices. I is the identity matrix and, n is the
A(Z-I)Y(t)
in which
(3) order of the model. When C(Z·l) =I, the modelreduces to a CAR model. Any CARMA modelcan be approximated to any accuracy by a highorder CAR model. Parameter matrices A and Bcan be estimated by the extended least squaresmethod (ELSM). However when the SNR (signal noise ratio) of the time series is low, theerror in the parameter estimation will rapidlyincrease if the ELSM method is used. In thiscase the maximum likelihood method (MLM)could give better parameter estimation.
A MISO CAR model for the system under consideration is defined as
A(Z·l)Y(t) = B(z·I)U(t)+e(t) (4)
where Y(t) is sea level
Journal ofCoastaJ Research, Vol. 7, No.4, 1991
Pearl River Delta, China 1157
'i::,0.00 0.10 0,20 0.30 0.40 O!§O 'b0 ' 00 0.10 0.20 0.30 0.40 0'80
'b a a b ~
'b 'bwU~ aZ aa: -cr:
ba:a>S
"b '0
b '0
0.00 0.10 0.20 0.30 0.40 0.50 0.00 0.10 0.20 0.30 O.llO 0.50
'00 . 00 0.10 0.20 0.30 0.40 0.10 0.20 0.30 o.so 0'80
-''b d
~Swu
z za: M a:a: a cr:-a: a:>'0 >
b
'0 a
0.00 0.10 0.20 0.30 0.40 0.50 0.00 0.10 0.20 0.30 o.uo 0.50
FRO (\lOAYl FRQ (\lOAY]
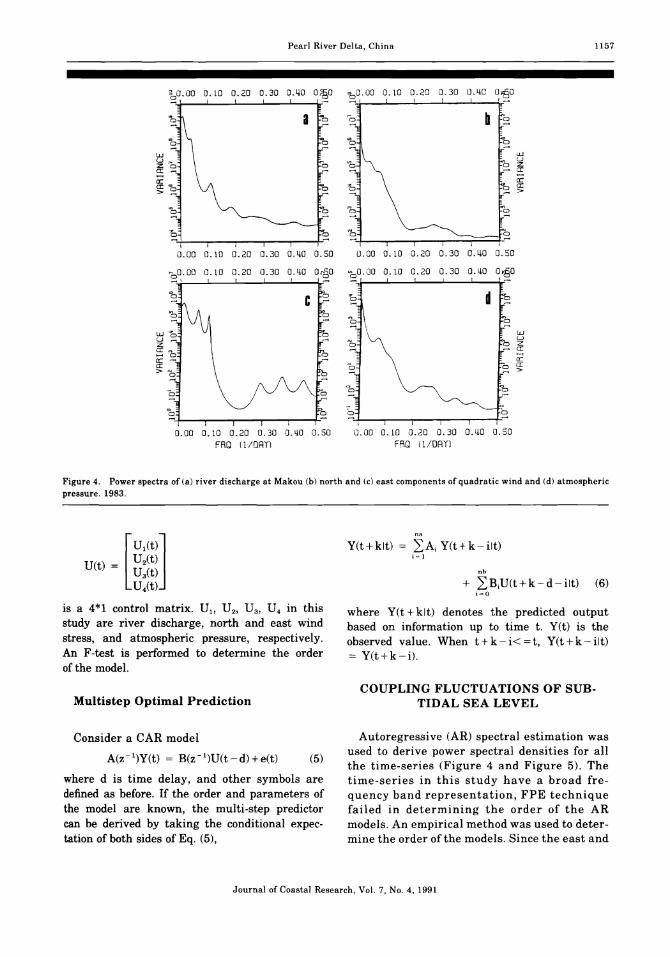
Figure 4. Power spectra of (a) river discharge at Makou (b) north and (c) east components of quadratic wind and (d) atmosphericpressure. 1983.
1I,!J)
,11J
11
I
IIJ
is a 4*1 control matrix. U" U2 , U3 , U4 in thisstudy are river discharge, north and east windstress, and atmospheric pressure, respectively.An F-test is performed to determine the orderof the model.
Multistep Optimal Prediction
Y(t+klt) = LA, Y(t+k-ilt)i=l
nb
+ LBiU(t+k-d-ilt) (6)i=O
where Y(t + kit) denotes the predicted outputbased on information up to time t. Y(t) is theobserved value. When t+k-i< =t, Y(t+k-ilt)= Y(t+k-i).
COUPLING FLUCTUATIONS OF SUB·TIDAL SEA LEVEL
Journal of Coastal Research, Vol. 7, No.4, 1991
Consider a CAR model
A(z-l)Y(t) = B(z-I)U(t-d)+e(t) (5)
where d is time delay, and other symbols aredefined as before. If the order and parameters ofthe model are known, the multi-step predictorcan be derived by taking the conditional expectation of both sides of Eq. (5),
Autoregressive (AR) spectral estimation wasused to derive power spectral densities for allthe time-series (Figure 4 and Figure 5). Thetime-series in this study have a broad frequency band representation, FPE techniquefailed in determining the order of the ARmodels. An empirical method was used to determine the order of the models. Since the east and
I
It
1158 Wu
POWER SPECTRA
'b0'00 0.10 0.20 0.30 O.~O O~O ~O.OO 0.10 0.20 0.30 O.~O O~O
UJUZcr:
~>
UJUZ0:
~>
lbl
0.00 0.10 0.20 0.30 O.~O 0.50
0.10 0.20 0.30 O.~O
0.00 0.10 0.20 0.30 O.~O 0.50
0.10 0.20 0.30 O.~O
tal
\o
'",o
'"b'+---r---r--.,...--I"'--+
,o
oo
0.00 0.10 0.20 0.30 0.~0 0.50
0.10 0.20 0.30 O.~O
0.00 0.10 0.20 0.30 O.~O 0.50
SO.OO 0.10 0.20 0.30 o.~o
'0 '"
o S'-/-_-r-_.,...-_,...-.......;..;,....::....,-
:2N
~ S~ "7- 0a:cr "> ~
"'b
N
~ ~~7_ 0
a:0:",> ~
"'b'"b'-/---,----y---r-----r-+
0.00 0.10 0.20 0.30 O.~O 0.50 0.00 0.10 0.20 0.30 O.~O 0.50FRQ (j lOAn FRQ u/osn
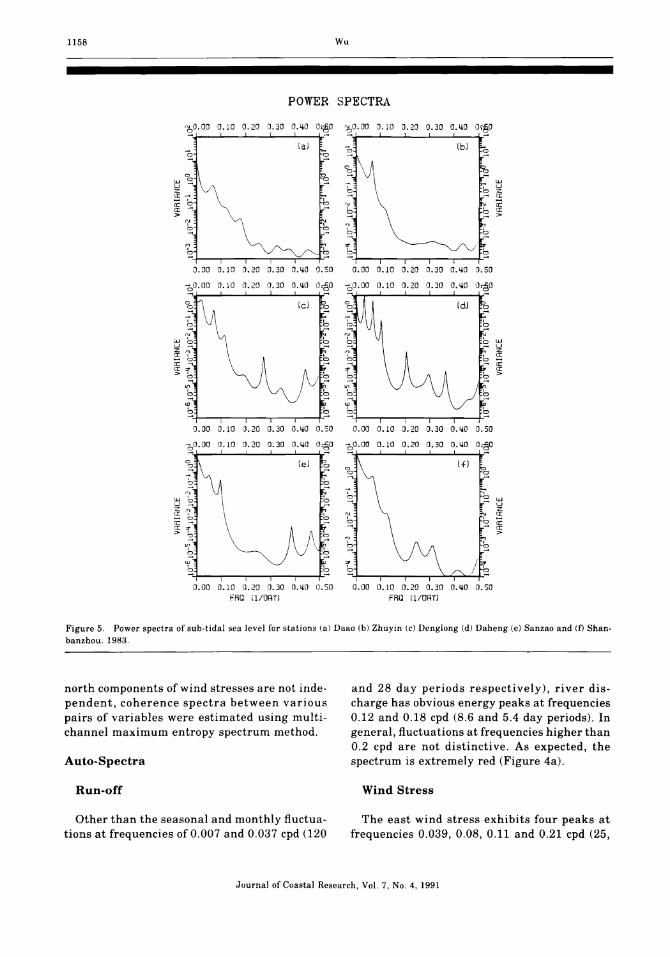
Figure 5. Power spectra of sub-tidal sea level for stations (a) Daao (b) Zhuyin (c) Denglong (d) Daheng (e) Sanzao and (f) Shanbanzhou. 1983.
north components of wind stresses are not independent, coherence spectra between variouspairs of variables were estimated using multichannel maximum entropy spectrum method.
Auto-Spectra
and 28 day periods respectively), river discharge has obvious energy peaks at frequencies0.12 and 0.18 cpd (8.6 and 5.4 day periods). Ingeneral, fluctuations at frequencies higher than0.2 cpd are not distinctive. As expected, thespectrum is extremely red (Figure 4a).
Run-off Wind Stress
Other than the seasonal and monthly fluctuations at frequencies of 0.007 and 0.037 cpd (120
The east wind stress exhibits four peaks atfrequencies 0.039, 0.08, 0.11 and 0.21 cpd (25,
Journal of Coastal Research, Vol. 7, No.4, 1991
l1
1
Pearl River Delta, China
COHERENCE SPECTRA
1159
g 0.00 0.10 0.20
o<Xl,
'"<Xlu>",a:or
0..
<:>lOa:"'-'
'"",u>"'a:or
0..
<:>"'a:"'-'
'"<Xlu>",a:, r0..
0.50
(b)
951.
(f)/
//
//
II
/95"1. S.,! //I II /I II /,/1/
Sea Level
In the lower estuary and adjacent coastalwater (Sanzao, Daheng, and Shanbanzhou, and
Atmospheric Pressure
Atmospheric pressure has only two distinctenergy peaks at 0.07 and 0.25 cpd (14 and 4 dayperiods) (Figure 4d).
0.00 0.10 0.20 0.30 0.40 0.50
o~+-T-..,..-...,.---,--f- 0
0
'"080
0.00 0.10 0.20 0.30 0.40
8 0.00 0.10 0.20 0.30 0.40
o<Xl
o
0.00 0.10 0.20 0.30 O.ijO 0.50FRQ lllDAYl
o'"
o<Xl
o~
o
g 0.00 0.10 0.20 0.30 0.40 O.~
~ ~tj
//I
@ I l /o I
o'"o
so
9SX S.L.
0.10 0.20 0.30 0.40 O.~
~
leI<Xl
~
~
951. S.:;..-co
/ '7/
/
I1/ ~
I II 0
"I
0V ~0
0.10 0.20 0.30 0.40 0.50FRQ (I/DAYl
0.10 0.20 0.30 0.40 O.~
"~
I' (el/<Xl
I II
~I II I
\ij il(""",I,
I
I
I
'"~I / '"/9~ S.L.I '"I '"
/I 0
,/ ~
II ,
II
I
I I 0It ~,
0.00 0.10 0.20 0.30 0.40 0.50
..:
0.00
s 0_00
8o
0.00 0.10 0.20 0.30 0.40 0.50
8 0.00
so .",0
~l5o·u>0
"'0u~
z·"'0<I:"'0r",D •uo
~ffio<I:a: 0::ow~o
"'0u~z .",0<I:
~~Uo
so +-"'T'"--r'~...,.---r--I-
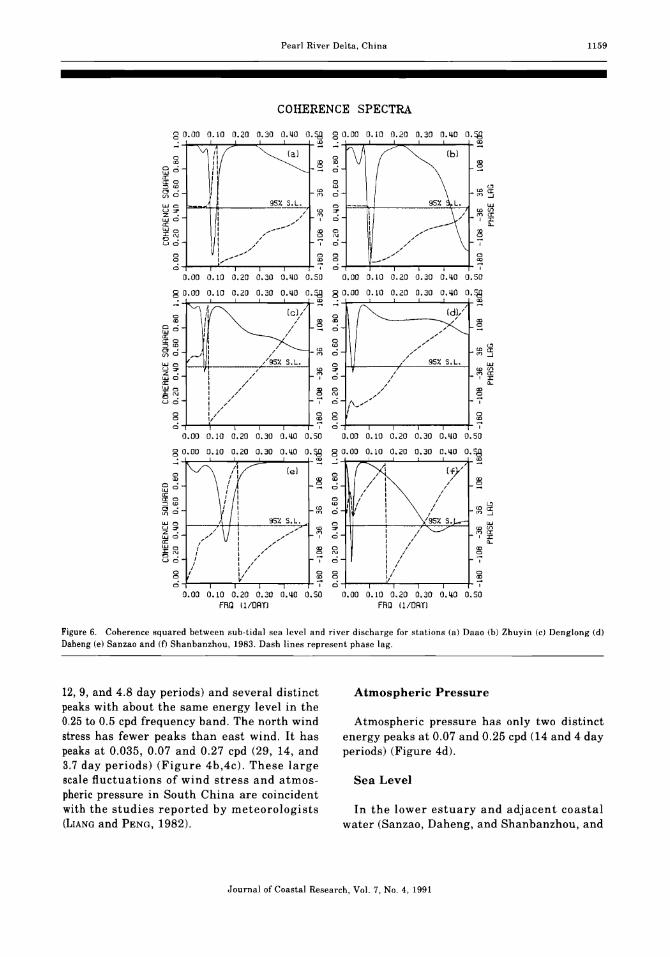
Figure 6. Coherence squared between sub-tidal sea level and river discharge for stations (a) Daao (b) Zhuyin (c) Denglong (d)Daheng (e) Sanzao and (I) Shanbanzhou, 1983. Dash lines represent phase lag.
12, 9, and 4.8 day periods) and several distinctpeaks with about the same energy level in the0.25 to 0.5 cpd frequency band. The north windstress has fewer peaks than east wind. It haspeaks at 0.035, 0.07 and 0.27 cpd (29, 14, and3.7 day periods) (Figure 4b,4c). These largescale fluctuations of wind stress and atmospheric pressure in South China are coincidentwith the studies reported by meteorologists(LIANG and PENG, 1982).
r,II1
II
J
1,\
JI
t Journal of Coastal Research, Vol. 7, No.4, 1991

1160
Chiwan), there are several distinct peaks in thehigh sub-tidal frequency band (>0.20 cpd) (Figure 5). These fluctuations mainly obtain energyfrom wind stress. Most of them are damped inamplitude when the disturbances propagatefrom coastal water into the upper estuary.There is a distinct peak in the quasi-monthlyperiod at stations along the coast water andlower estuaries which is absent in the inlandstations.
Wu
Coherence Spectra
According to the results of coherence spectralanalysis, sea level of all the stations in thePearl River Delta area are strongly coherentwith river discharge, even in stations Shanbanzhou and Chiwan, the sea level variations areaffected by river discharge at low frequencies(Figure 6).
In the inland stations in the Delta, sea level
COHERENCE SPECTRA
g 0.00 0.10 0.20 0.30 o.uo o.~ 8 0.00 0.10 0.20 0.30 o.so o.~
~ ~ ~
0 " 0 I r_-..(bl
\ cc """" \ '"o . \ ;; 0 ;;,,-,0\ r-:
1\ ! --.....a::0 I" <,a:o ~ , I ...' <,::><D ,, <0<0 i <, <o1E'" . , 0",0
" '" : 95X '.1.:;-, "'--'"-'0 0 UJW::I' <0 '" I
<0'"Z • '" 0 ma:,,-,0 I I I :I:a: I "-"-'0 '" ~
,~:I:", 0 I., .
0 I ,WO ,I
0 0 0 00 ~ 0 ~0 , 0 ,
0.00 0.10 0.20 0.30 O.~O 0.50 0.00 0.10 0.20 0.30 o.xo 0.50
8 0.00 0.10 0.20 0.30 O.~O O.~ 0.10 0.20 0.30 O.~
~
0(el
0
"" ~ "" ~o . 0UJO
~o 0:::><0
<0<0
~5'" . 0",0 '"UJo 95X s.c, 0 UJW::I' <0 ::I' <0'"Z •
,,", '" ",a:UJo I 0 , :t:a:: I \ "-"-'0 I '
~0
~:t:", : \ ...~ '"., .0 rWO I , ,
I ,,8 f , 0 8 0
f s '",,; , 0 i0.00 0.10 0.20 0.30 O.~O 0.50 0.00 0.10 0.20 0.30 O.~O 0.50
0.10 0.20 0.30 O.~O O.~ g 0.00 0.10 0.20 0.30 O.~O o.~
...: ~ ...: ~
0 l~' s (fl"" /
/
~I
8o . 0 I,,-,0 I
f Ia: ,
0 Ia:o ,::><0 ,
<0<0 I '-"'" . I 0 I <0 a:
",0 " '" I "'...J/ ,
99X s.c. S.!\.."-'0 0 "-'W::I' I I <0 ::I' I ~'"Z •I , 7 0 I ,~"-'0 I Ia:: I , I
c,"-'0 I s 0 '"I
, I:t:", f '" I 0'" . I i 0 iWO I, I
I / I0 I ...",// 0 s I 00 7
I'"0 , 0 ,
0.00 0.10 0.20 0.30 O.~O 0.50 0.00 0.10 0.20 0.30 o.uo 0.50FAQ U/DATl FAQ ll/DATl
Figure 7. Coherence squared between sub-tidal sea level and east component of quadratic wind for stations (a) Daao (b) Zhuyin(c) Denglong (d) Daheng (e) Sanzao and (D Shanbanzhou. 1983. Dash lines represent phase lag.
Journal of Coastal Research, Vol. 7, No.4. 1991

Pearl River Delta, China
-- OBSERVED- - - - PREDICTED
a
30 60 90 120 150 180 210 2110 270 300 330 360
b
30 60 90 120 150 180 210 240 270 300 330 360
c
1161
Journal of Coastal Research, Vol. 7, No.4, 1991
30 60 90 120 150 180 210 240 270 300 330 360TIME fOA,S]
Figure 8. Three step (day) prediction of 1983 sub-tidal sea level. Models were identified based on 1982 data. (a) Daao (b) Denglong(c) Daheng.
jl
II1
I(
1
is not affected by wind stress except at very lowfrequency, this is confirmed by the lack of significant coherence between east component ofwind stress and sea level at Daao, Zhuyin andDenglong (Figure 7a, 7b and 7c). As expectedsub-tidal sea level in the lower estuary has high
coherence with wind stress over a broad frequency band (Figure 7d, 7e and 70.
It seems safe to state that the influence ofriver discharge on low frequency sea level variations is over the entire delta area and thecoastal water as well. On the other hand, the

1162
oto
o
'"a
Wu
-- OBSERVED---- PREDICTED
e
o(J:)
oo~
:Eo-0
ow •if§]......<no
6(J:)
9+--..,....-...--...--.------.---.------,,---------,----r----,-----,---.-o 30 60 90 120 150 180 210 240 270 300 330 360
b'"o-=>'o
'"~oow •
~o
g:~(/)0
I
-=>'
9+--,------,----r-,---.-----.--,--...,---.-----.--,---,--o 30 60 90 120 150 180 210 240 270 300 330 360
o'"oOJ)
-=>'oo
'"o~
:>=0-0
ow •
if~......(/)0
6'"9+--,------,----.--,---,------,----r-...,---,------,-...,-,--
o 30 60 90 120 150 180 210 240 270 300 330 360TIME lORiS)
Figure 9. One step (day) prediction of 1983 sub-tidal sea level. Models were identified based on 1982 data. (a) Daao (b) Denglong(c) Daheng.
wind stress, local or non-local, mainly affectssea level along the coast and has little effect oninland stations.
The coherence between atmospheric pressure
and sub-tidal sea level in the lower estuaryindicates that the 'inverse barometer effect'does not seem applicable except, possibly, atvery low frequencies.
Journal of Coastal Research, Vol. 7, No.4, 1991

Pearl River Delta, China 1163
MODEL IDENTIFICATION ANDMULTISTEP OPTIMAL PREDICTION FREQUENCY RESPONSE (BODE)
o 11O-~ 3qS67E1310-~ 3QS671'910-12 3QS67E131~= ru
c:o ~<D ru
! 110- 3;2 3 ~S678910-22 34S67a310-12 3 II 56789 lod
The system under investigation in this studyhas as output the sub-tidal sea level at each ofthe 15 locations and as the four inputs, or control variables, river discharge, north and eastwind stress, and atmospheric pressure.
The study in this section and the nextincludes: (a) system identification, parameterestimation, and model diagnosis; (b) predictionof the sea level; (c) system analysis in both timeand frequency domains using the modelsobtained.
oru
" .2°~o_ (\J
~ I
:3 .~~CD •ClO
ccI
SOLID - [G(jw)1DASH - PHASE
a cO<D
if)W'wOcr:
crl~w0
Oz
Owq'if)
. a:0 :I:<D a,
I
System Identification and Diagnosis FREQUENCY (RRO/OJ
U m a x - U m in
andm
N L r 2(k) < = m + 1.65 / m (m<20)) (9b)k=l
1 N
E feet)} = N ];,e(k) ~ 0 (9a)
b
STEP FUNCTION RESPONSE
SYSTEM RESPONSE
20. uc. 60. 80. 100. 120. IqO. 16~'S O.; -j'.------l_--I._--I._--l._-l.._-L._......._+ 0
~ ~o 0
~~ ~E~o o~
W~ ~w>ru N>~6 o~~w ~~w -: . w~o omzro mzrr~ ocrw . . wrO °L
o 0o 0
a ~
O. 20. uo. 60. 80. 100. 120. 1qO. 160.TIME (DAYS)
Multistep Optimal Prediction
the model is acceptable. White noise tests wereapplied to the identified models. The resultsindicate that all models obtained are valid.
Figure 10. System response to river inflow input as step function at Denglong station, (a) frequency response (b) responsein time domain.
In the last section, 15 second order MISOCAR models were identified based on 1982 data,then single and multiple step predictions of1983 sea level for each station were made usingthe models obtained. Time delay was set tothree days when models were identified for thepurpose of three step forecasting. This insuredthat when a prediction was made at time t + k,(k = 1,2,3), all input variables needed wereobserved data. Figure 8a, 8b, and 8c show thethree step (day) prediction of sea levels forthree different stations. The one step prediction
(7)u'(t)
In this study, MISO (multiple input singleoutput) CAR models are used to simulate thesub-tidal sea level variations at each of the 15stations. The F-tests indicate that all themodels are of second order. The results ofparameter estimation and mean squared error(MSE) of the predicted and observed values forthe 15 MISO CAR(2,l) models are listed inTable I. The systems are identified based on1982 data. All the inputs have been normalized:
u(t) - Urn;"
where um a• and Urn;" are the maximum and minimum in time series utt) respectively.
The residual error e(t) between model outputand the observation values is defined as
are satisfied, where N is the length of data, rtk)is the autocorrelation of the series, then theseries under test is considered to be white noisewith zero mean at 95% significance level and
ert) = Yet) - G(z-') Utt) (8)
where yet) is the observed output, Utt) is theinput vector, and G(z-') is the transfer matrix.If the residual series feet)} is statistically whitenoise with zero mean, the model is then considered valid. The whiteness of feet)} can be examined by autocorrelations of the series. If conditions
l Journal of Coastal Research, Vol. 7, No.4, 1991

1164 Wu
Table 1. CAR model parameter estimation.
STATION MATRIX A MATRIX B
Banshawei 0.175E+Ol -0.862E+00 -0.109E+00 0.216E +000.276E +00 -0.301E+000.124E -01 0.114E-OlO.4IIE-Ol -0.356E -01
Daao 0.185E + 01 -0.987E+00 -0.790E+00 O.921E+OO0.185E+OO -0.206E +00
- O.904E -01 0.l17E + 000.835E- 01 -0.591E-Ol
Daheng 0.182E + 01 -0.832E +00 - 0.763E- 02 0.758E-020.129E + 00 -0.139E+OO0.118E + 00 -0.133E+OO
- O.825E - 02 0.206E-Ol
Denglong O.l71E+Ol -O.786E+00 - 0.212E + 00 0.240E +000.134E +00 -0.142E +000.556E - 01 -0.494E - 010.107E -01 -0.954E -02
Fubiao 0.180E + 01 -0.882E +00 -0.243E+OO 0.277E+00O.lllE +00 -0.128E+00
-0.646E-03 0.348E-020.109E -01 - O.149E - 01
Hengmen 0.184E+01 -0.906E +00 -O.769E-OI 0.102E+OO0.670E-Ol -0.734E -010.306E- 01 -0.257E -010.130E - 01 -0.178E-01
Huangbu 0.18lE +01 -O.883E + 00 -0.284E+00 0.298E+OO-0.339E-01 O.213E - 01
O.401E - 01 -0.221E - 01-0.998E - 02 0.148E - 02
Lingshan 0.185E + 01 -0.914E+00 -O.437E +00 0.454E + 00- 0.123E - 01 0.735E-02-0.276E -01 0.343E-Ol
0.392E -01 -0.383E-Ol
Nansha 0.178E+01 -0.860E+ 00 -0.240E+ 00 0.260E +000.629E - 01 -0.752E-010.164E - 01 -O.168E-Ol0.355E-02 - 0.304E -02
MSE
0.15077E - 02
0.17376E-02
0.14738E - 03
0.41302E - 03
0.53869E - 03
0.24926E - 03
0.51906E - 03
0.46794E - 03
0.3238E -03
1
Journal of Coastal Research, Vol. 7, No.4, 1991
of 1983 sea level at Daao, Denglong and Sanzaoare shown in Figure 9.
As shown in the figures, all the three step predictions are in good agreement with observeddata. The observed and predicted values of theone step predictions are in better agreement.This good agreement between the model outputs and observed data further validates themodels identified.
ESTUARINE SYSTEMS IN FREQUENCYAND TIME DOMAINS
Once it is identified and validated, the modelobtained can be used to analyze the system andprovide important insights into the system. For
multivariate systems, it is more convenient andefficient to use the state space form of the equations than the difference equations. All the following analyses were conducted using the formof continuous state space equations.
Characteristics of the System inFrequency Domain
For a linear multivariate system, we haveyes) = G(s) U'(s) where yes) and U'(s) are theLaplace transforms of the system output andinput matrices respectively. Gts) is the transfermatrix. A simple relation exists between thefrequency response and transfer function of asystem, g(jw) = g(s)Js=jw where g(jw) is the fre-
,
(
IJ

Pearl River Delta, China 1165
Table 1. Continued.
STATION MATRIX A MATRIX B MSE
Sanzao 0.178E + 01 - 0.788E +00 -0.708E-Ol 0.71IE-Ol 0.14979E - 030.234E+OO - O.245E + 00O.145E + 00 -0.171E +000.694E -02 0.961E-02
Shanbanzhou O.176E+Ol - 0.828E + 00 -O.185E+OO O.189E+OO 0.17782E - 030.402E -01 - 0.460E - 010.896E-Ol -0.878E-Ol
-0.222E-Ol 0.177E-Ol
Wanqingsha 0.185E + 01 -0.922E+00 -O.147E+OO O.176E+00 0.40616E - 03- 0.483E - 01 0.448E - 01
O.307E - 01 -O.165E-Ol0.112E -01 -0.247E-Ol
Xiaolan 0.183E+Ol -0.103E+Ol -0.433E+00 0.827E+00 0.11073E-010.417E +00 -0.443E +00
-0.412E - 01 0.634E - 01
• 0.136E +00 -0.719E-Ol
I Zhongda 0.183E + 01 - 0.895E + 00 - 0.151E + 00 0.169E+OO 0.22627E - 03
I0.964E - 01 -0.104E+00O.231E - 01 -0.214E-Ol
J
-0.13IE-01 0.822E-02
Zhuyin 0.177E+Ol - 0.892E +00 -0.158E+00 0.271E +00 0.16018E - 02
10.173E + 00 -0.179E+000.162E-02 0.221E- 01
"
0.516E - 01 -0.438E- 01
a
Table 2. Parameters of frequency response (unit of frequency-cycle/day)
Station <Un <Ur Mr Wm
Daao 0.076 0.511 0.053 1.138 0.057Zhuyin 0.049 0.128 0.048 3.954 0.048Denglong 0.040 0.165 0.039 3.082 0.040Daheng 0.040 0.592 0.019 1.044 0.032Sanzao 0.025 0.364 0.021 1.476 0.025
Journal of Coastal Research, Vol. 7 ~ No.4, 1991
It
I
\,.
I1
quency response. The frequency response characterizes the response of sea level to the fourcontrol variables in the frequency band of interest. Figure lOa is a Bode diagram showing thefrequency response at Denglong station. Table2 lists the natural frequency W n , damping ratio" resonant frequency W r , resonant amplitudeM,; and maximum gain frequency W m for thefive stations along Modaomen estuary.
The frequency response of sub-tidal sea leveldisplays the characteristics:(a) The maximum gain frequency W m to the four
control inputs is the same at any given station.
(b) The gain for ri ver discharge increasesslightly from Daao to Zhuyin and thendecreases seaward.
(c) In the frequency band from 0.04 to 0.05 cpd,the response of sea level to wind stress
increases landward, and reaches maximumvalues between Denglong and Zhuyin.
(d) Frequency response at Zhuyin and Denglong to all the control inputs exhibits astrong oscillatory nature which subsidesboth landward and seaward. This can beseen more clearly in time response discussed next.
System Simulation in Time Domain
Once a validated model for a system isobtained, it can be used to simulate the systemoutput under various hypothetical or observedinputs. This can be a help in providing valuableinformation and revealing insights concerninga real system. The input functions used in thisstudy were step functions and sinusoidal functions. The step function is defined as:

10 20 30 qO 50 60 70 80 90 100 110 120 130 lQO 150 160TIME IOAYS)
1166
Inr-a0In
aInN
0g
~£ii'"Wo
~c!>g:1n<n •
0J,r-0
I
0
Wu
SYSTEM RESPONSEDAHENG STATION, 1983 MODEL -- FREQ-O.2 CPO
----- FREQ-O.l CPO----- FREQ-O.OIB CPO-.- •••• FREQ-O.OOS CPO
Figure 11. System has the maximum response to external forcing with frequency close to its resonant frequency which is 0.019cpd for Daheng station. All inputs are sinusoid functions.
(10)_\0.5 (t>O)
U.tep(t) - ° (t""O)
The estuarine response to the control variablesin time domain can be summarized as follows:(a) All the time domain responses to step func
tions of control variables display an oscillatory nature which is most obvious at Zhuyin and Denglong and damp rapidly bothlandward and seaward.
(b) The steady response of sea level to river discharge at Daao is 70 em. It is 38 em at Zhuyin, 21 em at Denglong (Figure LOb) and 23 em at Daheng and Sanzao.
(c) The effect of wind stress is relatively smallcompared to the response to river dischargeat Daao, the most inland station. Theresponse to river also exceeds that due towinds at Zhuyin. At Daheng and Sanzao,stations in the coast, the instantaneousresponse to wind stress may reach 25 emwhile response to river discharge is only 12cm.
(d) The system has the maximum response toinputs with frequency near its resonant frequency (Figure 11).
CONCLUSIONS
(1) Spectral analysis indicates that thereexist several frequencies in the sub-tidal fre-
quency band, 0.01-0.5 cpd at which high energyfluctuations of sea level occur in the Pearl Riverestuarine complex. These fluctuations mainlyobtain energy from river inflow, wind stress,atmos tions concentrate in the frequency band0.2-0.05 cpd (5-20 days in period) and areforced mainly by river inflow. In the lower estuary wind stress supplies energy for most of thehigh frequency (>0.2 cpd) fluctuations. Disturbances in frequencies higher than 0.2 cpd propagate from coastal waters landward and subside rapidly after Denglong-Zhuyin. Highenergy fluctuations at lower frequencies cantravel further up-stream.
(2) Sub- tidal sea level subsystems in thestudy area can be described by second orderMISO CAR models. All the models identified inthis study are second order oscillatory systems.Multistep predictions of 1983 sea levels for eachof the 15 stations are made by using modelsidentified from the 1982 time series records.Model output and observed system output are invery good agreement. White noise tests alsoindicate the models are appropriate.
(3) System simulation in the time domainindicates that the steady response of sub-tidalsea level to river discharge inputs as step function decreases from 70 em at station Daao in theupstream to 2-3 cm at stations Daheng andSanzao in the coast. The system response to
Journal of Coastal Research, Vol. 7, No.4. 1991
Pearl River Delta, China 1167
wind stress, on the other hand, increases fromupstream to downsteam.
(4) The sub-tidal sea level of the estuarinecomplex has the maximum response to externalforcing with frequency close to its resonant frequency.
LITERATURE CITED
CHUANG, W.S. and WM. J. WISEMAN, JR., 1983.Coastal sea-level response to front passages on theLouisiana-Texas coast. Journal of GeophysicalResearch, 88(C4), 2615-2620.
ELLIOTT, A.J., 1978. Observations of the meteorological induced Circulation in the Potmac Estuary.Estuarine and Coastal Marine Science, 6, 285-299.
ELLIOTT, A.J. and DONG-PING WANG, 1978. The effectof meteorological forcing on the Chesapeake Bay:the coupling between an estuarine system and itsadjacent coastal waters. In: NICHOUL,J.C.J. (ed).Hydrodynamics of Estuaries and Fjords, Amsterdam: Elsvier, pp. 127-145.
LIANG, B.Q. and PENG, J.Q., 1982. A spectral analysisof the Tropical Disturbance in South China. In: Proceedings of the Symposium on the Summer Monsoonin South East Asia (Kunrnin China), People's Pressof Yunnan Province.
OLSON, P., 1986. The spectrum of subtidal variabilityin Chesapeake Bay circulation. Estuarine, Coastaland Shelf Science, 23, 527-550.
PRIESTLY, M.B., 1981. Spectral Analysis and TimeSeries, Volume 1: Univariate Series, London: Academic, 653p.
PRITCHARD, D. W., 1952. Estuarine hydrography.Advances in Geophysics, 1, 243-280.
PRITCHARD, D.W., 1954. A study of the salt balance ina coastal plain estuary. Journal ofMarine Research,13, 133-144.
PRITCHARD, D.W., 1955. Estuarine circulation patterns. Proceedings A merican Society Civil Engineers, 81,717/1-717/11.
PRITCHARD, D.W.~ 1956. The dynamic structure of acoastal plain estuary. Journal of Marine Research,15,33-42.
PRITCHARD, D.W., 1958. The equations of mass continuity and salt continuity in estuaries. Journal ofMarine Research, 17, 412-423.
WANG, D.P., 1979a. Subtidal sea level variations inthe Chesapeake Bay and relations to atmosphericforcing. Journal of Physical Oceanography, 9(2),413-421.
WANG, D.P., 1979b. Wind-driven circulation in theChesapeake Bay, Winter 1975. Journal ofPhysicalOceanography, 9, 564-572.
WEISBERG, R.H., 1976. The non-tidal flow in the Providence River of Narragansett Bay: a stochasticapproach to estuarine circulation. Journal ofPhysical Oceanography, 6(5), 721-734.
WISEMAN, WM. J., JR., 1984. Estuarine-shelf interactions. In: C.N.K. MOOERS, (ed.), Dynamics of ShelfRegime, Volume in SCOR/AGV monograph series"Coastal and Estuarine Sciences", 1986.
Wu, C. Y., 1986. A dynamics and sedimentation studyof eastern Atchafalaya Bay, Louisiana. Ph.D. dissertation of Louisiana State University, BatonRouge, Louisiana.
II
II\
III1
D RESUME 0Ce travail presente une etude extensive du niveau marin d'un syateme dynamique subtidal (terre, ocean atmosphere): Ie delta dela Pearl River (Guangdong, Chine). En 18 stations, on a recueilli pendant deux ana des donnees sur le niveau de la mer et lesforcages meteorologiques. Elles revelent de larges fluctuations d'amplitude de l'order de 0,01-0,5 em/jour. Ces fluctuations sontla reponse indirecte aux variations de debit de la riviere, au travail du vent, et a la pression atmospher-ique, compte tenu duspectre d'energie et de la coherence de son analyse.
Un modele MISO CAR est identifie sur les series d'enregistrements de 1982. En entree sont Ie debit de la ri viere, le travail duvent et la pression atmospherique, en sortie, le niveau subtidal de la mer. Le modele obtenu et val ide sert a faire une predictiona pas multiples satisfaisante du niveau de la mer. L'analyse des freqences par le modele donne un important apercu de systeme.On trouve que la reponse maximale de l'estuaire intervient aux frequences 0,025 c/jour. Une simulation montre l'importancerelative et lea variations des variables responsables du niveau de la mer dans le complexe estuarien. L'analyse en frequences eten temps des reponses montrent que le systerne non tidal A variations marines est un systeme oscillatoire. Ses effets sur la circulation estuarienne, le volume, la salinite, le transport sedimentaire, et sur la formation des maxima de turbidites, necesaitentun developpement ulterieur. -Catherine Bousquet-Bressolier, Laboratoire de Geomorphologic EPHE, Montrouge, France.
Journal of Coastal Research, Vol. 7, No.4, 1991


![((Title))livrepository.liverpool.ac.uk/3002062/1/Manuscript no... · Web viewSun Yat-Sen University Guangzhou 510275, People’s Republic of China [**] AJC gratefully acknowledges](https://static.fdocuments.in/doc/165x107/6072573205c14441f779c392/title-no-web-view-sun-yat-sen-university-guangzhou-510275-peopleas-republic.jpg)