
Zeroing In on Place and Race: Youth Disconnection in America's ...
36
KRISTEN LEWIS and SARAH BURD-SHARPS Patrick Nolan Guyer | CHIEF STATISTICIAN Bob Land | COPY EDITOR Alex Powers | RESEARCHER Rebecca Rasch | STATISTICAL ANALYST & CARTOGRAPHER Diana Tung | REPORT DESIGNER MEASURE OF AMERICA of the Social Science Research Council Zeroing In on Place and Race Youth Disconnection in America’s Cities Made possible with funding from
Transcript of Zeroing In on Place and Race: Youth Disconnection in America's ...

KRISTEN LEWIS and SARAH BURD-SHARPS
Patrick Nolan Guyer | CHIEF STATISTICIAN Bob Land | COPY EDITOR Alex Powers | RESEARCHER Rebecca Rasch | STATISTICAL ANALYST & CARTOGRAPHER Diana Tung | REPORT DESIGNER
MEASURE OF AMERICA of the Social Science Research Council
Zeroing In on Place and Race Youth Disconnection in America’s Cities
Made possible with funding from

Contents
Executive Summary....................................................……………………………………………………………….......i
Introduction......................................................………………………………………………………………...............1
Key Findings......................................................………………………………………………………………................7
Who? Youth Disconnection by Race, Ethnicity, and Gender…………………………………….........9
Where? Youth Disconnection by Place……………….…………………………...…………………….........11
Why? Factors Associated with Youth Disconnection …………………………..………………….........15
Now What? Recommendations……………………………………………………………..……..……….........19
Endnotes..................................................……………………………………….......………………………......22
Bibliography..................................................……………………………………….......………………………......22
Indicator Tables..................................................……………………………………….......………………………......23
JUNE 2015 © MEASURE OF AMERICA, CREATIvE COMMONS 3.0 LICENSE
DOWNLOAD THIS REPORT: www.MEASUREofAMERICA.oRg/yoUth-dISConnECtIon-2015
Measure of America is a nonpartisan project of the nonprofit Social Science Research Council founded in 2007 to create easy-to-use yet methodologically sound tools for understanding well-being and opportunity in America. Through reports, interactive apps, and custom-built dashboards, Measure of America works with partners to breathe life into numbers, using data to identify areas of highest need, pinpoint levers for change, and track progress over time.
The root of this work is the human development and capabilities approach, the brainchild of Harvard professor and Nobel Laureate Amartya Sen. Human development is about improving people’s well-being and expanding their choices and opportunities to live freely chosen lives of value. The period of young adulthood is critical in developing the capabilities required to live a good life: knowledge and credentials, social skills and networks, a sense of mastery and agency, an understanding of one’s strengths and preferences, and the ability to handle stressful events and regulate one’s emotions, to name just a few. Measure of America is thus concerned with addressing youth disconnection because it stunts human development, closing off some of life’s most rewarding and joyful paths and leading to a future of limited horizons and unrealized potential.
Measure of America gratefully acknowledges the financial support of Opportunity Nation and Gap Inc. for this research.

iZEROING IN ON PLACE AND RACE | Youth Disconnection in America’s Cities
Disconnected youth are teenagers and young adults between the ages of 16 and 24 who are neither working nor in school. There are 5,527,000 disconnected youth in America today, or one in seven young adults (13.8 percent)—about as many people as live in Minnesota. the national disconnected youth population is larger than the populations of thirty US states.
The good news is that the rate of youth disconnection has fallen since the great Recession. Roughly 280,000 fewer young people are disconnected today than in 2010, the peak year for youth disconnection during the last decade. Beneath the national rate of 13.8 percent, however, lies staggering variation. In some cities and among some racial and ethnic groups, young people who are neither in school nor working are few and far between. In others, youth disconnection is an everyday reality, tragically persistent and commonplace.
The costs of disconnection are high, both for individuals and for society. Disconnected youth are cut off from the people, institutions, and experiences that would otherwise help them develop the knowledge, skills, maturity, and sense of purpose required to live rewarding lives as adults. And the negative effects of youth disconnection ricochet across the economy, the social sector, the criminal justice system, and the political landscape, affecting all of us. Our analysis of a very small subset of the direct costs of youth disconnection reveals an astonishingly high cost to taxpayers: $26.8 billion in 2013 alone, or nearly the entire amount the federal government spends on science.
Zeroing In on Place and Race was written to shine a light on the nature and extent of this problem at the national level, in nearly 100 cities, and among the country’s major racial and ethnic groups. It provides practitioners and policymakers the up-to-date data necessary to target and tailor interventions and assess the effectiveness of programmatic efforts.
Of the ninety-eight major metro areas included in this report—home to two in three Americans—disconnection rates range from under 8 percent in the omaha, nebraska, and Bridgeport, Connecticut, metro areas to over 20 percent in greater Lakeland, florida; Bakersfield, California; and Memphis, tennessee.
At the national level, youth disconnection rates for blacks (21.6 percent), native Americans (27.8 percent), and Latinos (16.3 percent) are markedly higher than rates for Asian Americans (7.9 percent) or whites (11.3 percent). In nine metro areas, at least one in four black youth are disconnected. And in nine metro areas, at least one in five Latino youth are disconnected.
EX
EC
Ut
IVE
SU
MM
AR
y
ZEROING IN ON RACE AND PLACEYOUTH DISCONNECTION IN AMERICA’S CITIES

iiZEROING IN ON PLACE AND RACE | Youth Disconnection in America’s Cities
Although national patterns are generally mirrored in metro areas, important variation exists. For instance, a city can simultaneously be among the best for one racial or ethnic group and among the worst for another. The greater Boston metro area, which has a low overall disconnection rate (8.2 percent), is relatively good for white (6.8 percent) and black youth (9.8 percent), but not for Latinos (17.3 percent). In the Chicago metro area, both whites and Latinos are doing better than they are in the country as a whole (7.5 and 13.9 percent, respectively), but blacks are doing much worse (24.5 percent).
Place matters. Race matters. But our analysis shows that the combination of the two really packs a wallop. Residential segregation by race, while no longer legal, is nonetheless the de facto, on-the-ground reality for many Americans. It produces concentrations of poverty and isolation as well as islands of affluence and connection, from Ferguson and Baltimore to Los Angeles and New York. New research for this report shows that racial segregation has dramatic but very different consequences for young people depending on their race. Our research shows that in highly segregated metro areas, black youth tend to have higher-than-average rates of disconnection, whereas white youth tend to have lower-than-average rates of disconnection. In other words, residential segregation by race disproportionately harms black teenagers and young adults.
the problem is complex and highly variable. what are the solutions?
This study shows clearly that disconnected young people face challenges beyond what they can tackle alone. To alter the trajectory of his or her life, a young person needs perseverance, the ability to delay gratification, the optimism to envision a better future, and the willingness to work toward it. But these personal characteristics, while necessary, are simply not sufficient. disconnection is not a spontaneously occurring phenomenon; it is an outcome years in the making. Engaged young people from middle class neighborhoods rarely drop out or drift away from the worlds of school and work. Disconnected young people tend to come from communities that are themselves disconnected from the mainstream by segregation and concentrated disadvantage, and young people’s struggles with education and employment mirror those of their parents and neighbors. Currently, we’re spending our time, money, and effort fighting the symptoms of youth disconnection instead of addressing its root causes. Knitting disconnected, opportunity-scarce communities into the fabric of our wider society and creating meaningful pathways within them is the answer to youth disconnection.
We hope that the data and analysis contained in this report will make previously invisible groups visible and help those working to reconnect young people and prevent future disconnection succeed in their efforts. These young people deserve a meaningful shot at their own American Dreams.
EX
EC
Ut
IVE
SU
MM
AR
y

ZEROING IN ON PLACE AND RACE | Youth Disconnection in America’s Cities 1
Disconnected youth—young people between the ages of 16 and 24 who are neither working nor in school—are suddenly in the public eye. From the presidential initiative My Brother’s Keeper to the analyses of pundits and scholars on the causes of civic unrest in Ferguson and Baltimore, evidence abounds that society is finally waking up to the costs of consigning five and a half million American youth, or roughly one in every seven young adults, to lives at the margins of society. And this national crisis seems tame compared to the situation in some locales: in three major metro areas, one in five youth are out of school and work.
Adding race and ethnicity to the mix paints a still more alarming picture: in nine American cities, at least one in every four black people ages 16 to 24 are disconnected, and in nine cities, at least one in five Latino youth are disconnected. Isolated from the mainstream and cut off from the information, guidance, support, and sense of purpose that school and work provide, these young people and millions like them across the country face a rocky and uncertain transition to adulthood.
Our teens and early twenties shape our adult identities and pattern our future opportunities. Through experiences in school and work, the majority of young adults have the chance to gain skills and credentials, discover interests and talents, and move toward self-sufficiency.
Early successes in school and work foster a teenager’s self-confidence, optimism, and agency, which in turn breed future successes. High school and college provide an arena for connected young people to develop not just cognitive skills but also the social and emotional capabilities critical to a rewarding adulthood, from forming healthy, lasting relationships to regulating one’s feelings and impulses. First jobs help teens and young adults develop soft skills like punctuality and collaboration, learn the unspoken rules and behavioral norms of the workplace, and forge networks of mentors and connections. And while they may at times exercise poor judgment or take seemingly harebrained risks, connected teenagers and young adults are often cushioned from the full consequences of their immaturity by supportive, sympathetic adults and institutions.
America’s 5.5 million disconnected young people face a very different reality. Rather than laying the foundation for a productive life of choice
Introduction
One in five youth are out of school and work in three metro areas
•Lakeland–winter haven, fL
•Bakersfield, CA
•Memphis, tn–MS–AR

ZEROING IN ON PLACE AND RACE | Youth Disconnection in America’s Cities 2
and value, they find themselves unmoored from the systems and structures that confer knowledge, skills, identity, and inclusion. Too often these youth lack a sense of belonging and the feelings of worth and dignity that come with having a purpose in life. And they enjoy comparatively little protection from the adult consequences (such as prison time or very early parenthood) of the impulsivity and risk-taking that are hallmarks of the teenage and young adult years. Indeed, most will carry scars of these lost years into adulthood. People who experience long spells of youth disconnection have lower wages and marriage rates, higher incarceration and unemployment rates, worse health, less job satisfaction, and even less happiness as adults than people who did not experience youth disconnection.1 Just as early successes breed optimism, early setbacks plant the seeds of hopelessness.
For society, the consequences of youth disconnection are also grave: a labor force with too few skilled workers to compete in today’s globalized, knowledge-based economy; greater need for public assistance; the high costs of crime, incarceration, and poor physical and mental health; and a heightened risk that the next generation will be caught in the same cycle. There is no easy method for estimating how many billions of dollars the 5.5 million disconnected youth cost society. Aside from direct expenditures, such as public assistance, medical care, and incarceration expenses, there are also a host of indirect costs, among them lost tax revenues, costs to the victims of crime, and lost earnings and market productivity, to name just a few. But even focusing conservatively on a narrow set of well-documented direct costs to taxpayers yields a surprisingly high number: $26.8 billion for one year alone—2013. This figure comes from summing four direct costs recorded for disconnected youth: incarceration costs, Medicaid, public assistance payments, and Supplemental Security Income payments.2
fIgURE 1 youth disconnection since 2006
6,000,000
5,800,000
5,600,000
5,400,000
5,200,000
5,000,000
4,800,000
4,600,000
4,400,0002006 2007 2008 2009 2010 2011 2012 2013
NU
MB
ER
OF
DIS
CO
NN
EC
TE
D Y
OU
TH
YEAR
Low 4,890,000
hIgh 5,809,000

ZEROING IN ON PLACE AND RACE | Youth Disconnection in America’s Cities 3
The good news is that the national youth disconnection rate has fallen from its recession-era high (see fIgURE 1). The number of disconnected youth rose sharply after 2008 and lingered around 5.8 million in 2010 and 2011. Today’s rate of 13.8 percent represents a reduction in the number of disconnected youth of about 280,000 from the peak in 2010.
The bad news is that huge gaps by place and by race and ethnicity remain. In the Memphis, Bakersfield, and Lakeland–Winter Haven metro areas, youth disconnection rates top 20 percent. More than one in every five youth in these cities are out of school and out of work. In contrast, in the Omaha–Council Bluffs (Nebraska and Iowa) and Bridgeport–Stamford–Norwalk (Connecticut) metro areas, 7.7 percent—just one in every thirteen young people—are disconnected.
At the national level, disconnection rates for blacks (21.6 percent), Native Americans (27.8 percent), and Latinos (16.3 percent) are markedly higher than rates for Asian Americans (7.9 percent) or whites (11.3 percent) (see fIgURE 2). Racial gaps are as large or even larger within major metro areas.
Momentum has been growing across the nation to tackle the issue of youth disconnection. Policymakers, business and community leaders, philanthropists, and young people themselves have come together around the idea that the costs of leaving millions of young Americans behind are unacceptably high.
This report is designed to provide these actors the up-to-date data they need to target and tailor their interventions and assess the effectiveness of their efforts. It provides a ranking of youth disconnection rates in nearly 100 of the most populous US metro areas, identification of the top and bottom congressional districts, calculations for the major racial and
fIgURE 2 youth disconnection by Race and Ethnicity
LATINO
16.3%
NATIvE AMERICAN
27.8%BLACK
21.6%WHITE
11.3%
ASIAN AMERICAN
7.9%
whAt IS A MEtRo AREA?
This study includes youth disconnection rates for ninety-eight of America’s 100 most populous metro areas, which includes 66 percent of the US population. The country’s other metropolitan areas have populations that are too small to allow for statistically reliable calculations of the youth disconnection rate.
A metropolitan area is defined as a central city and the towns, suburbs, and exurbs that surround it; strong economic and social ties bind metro areas together. Metro areas are a particularly meaningful unit of analysis for assessing youth disconnection because of the regional nature of higher education and labor markets as well as transportation systems.
Metro-area boundaries are defined by the White House Office of Management and Budget. They often cross state lines; the Chicago metro area, for example, is a contiguous area made up of parts of Illinois, Indiana, and Wisconsin.

ZEROING IN ON PLACE AND RACE | Youth Disconnection in America’s Cities 4
BoX 1 Measure of America Addresses the data gap
Organizations working to reduce youth disconnection need high-quality, timely data and analysis about the nature and extent of this problem to target their assistance and track the impact of their interventions over time. Until 2012, such information was not readily available.
Measure of America was the first organization to calculate and make public youth disconnection rates for racial and ethnic groups nationwide as well as for metro areas with its publications One in Seven: Ranking Youth Disconnection in the 25 Largest Metro Areas, released in 2012, and Halve the Gap by 2030: Youth Disconnection in America’s Cities, released in 2013. Both reports presented disconnection rates for the twenty-five most populous metro areas overall as well as by race and ethnicity and for women and men, and Halve the Gap also presented rates by neighborhood cluster. The reports have been cited widely, and the calculations are being used by a number of nonprofit and government organizations to identify areas of need and track change over time.
Follow-up interactions with a number of organizations and networks, including the Aspen Forum for Community Solutions, Opportunity Nation, and the Opportunity Youth Network, revealed a need for disconnected youth rates for a larger number of cities as well as further exploration of the role of race, ethnicity, gender, and socioeconomic factors in the youth disconnection phenomenon. Produced to meet this demand, this report was made possible through the generous financial support of our partners, opportunity nation and gap Inc.
ethnic groups at the national and metro levels, and an exploration of how disconnected young people compare to their connected counterparts in terms of race, ethnicity, gender, parenthood status, education, poverty, and disability. Disconnected youth are not a monolithic group, and understanding the differences among them is critical for crafting effective solutions.

ZEROING IN ON PLACE AND RACE | Youth Disconnection in America’s Cities 5
tABLE 1 youth disconnection in the Most Populous US Metro Areas
RAnK MEtRo AREA
dISConnECtEd yoUth (% ages 16–24)
dISConnECtEd yoUth
(# ages 16–24)
dISConnECtEd yoUth (% ages 16–24)
BLACKS LAtInoS whItES
United States 13.8 5,527,000 21.6 16.3 11.3
1 Omaha–Council Bluffs, NE–IA 7.7 8,945 6.1
2 Bridgeport–Stamford–Norwalk, CT 7.7 8,207 5.5
3 Boston–Cambridge–Newton, MA–NH 8.2 49,229 9.8 17.3 6.8
4 Minneapolis–St. Paul–Bloomington, MN–WI 9.1 41,494 16.6 7.7
5 Ogden–Clearfield, UT 9.1 9,061 8.0
6 Spokane–Spokane valley, WA 9.3 7,247 8.7
7 Worcester, MA–CT 9.3 11,220 7.7
8 Wichita, KS 9.6 8,276 7.3
9 San Jose–Sunnyvale–Santa Clara, CA 9.7 20,242 11.9 6.7
10 Scranton–Wilkes–Barre–Hazleton, PA 9.7 5,887 9.1
11 Oxnard–Thousand Oaks–ventura, CA 9.8 10,853 11.1
12 Syracuse, NY 10.0 11,207 9.8
13 Akron, OH 10.1 9,910 10.2
14 Pittsburgh, PA 10.2 30,575 21.8 9.1
15 Raleigh, NC 10.3 15,621 12.8
16 Des Moines–West Des Moines, IA 10.3 8,194 8.8
17 Albany–Schenectady–Troy, NY 10.4 13,855 10.8
18 San Francisco–Oakland–Hayward, CA 10.4 50,593 19.4 12.2 9.2
19 Toledo, OH 10.7 9,628 7.7
20 Provo–Orem, UT 10.7 14,445 10.7
21 Milwaukee–Waukesha–West Allis, WI 10.7 20,219 19.9
22 Springfield, MA 11.0 7,932 11.7
23 Columbus, OH 11.0 30,403 13.2 10.6
24 Hartford–West Hartford–East Hartford, CT 11.1 16,909 25.0 6.6
25 Baltimore–Columbia–Towson, MD 11.3 39,864 18.4 7.8
26 Grand Rapids–Wyoming, MI 11.3 18,963 9.6
27 Austin–Round Rock, TX 11.5 27,959 17.8 14.4 8.8
28 Urban Honolulu, HI 11.7 14,834
29 Dayton, OH 11.8 12,215 9.7
30 Buffalo–Cheektowaga–Niagara Falls, NY 12.0 17,348 20.3 9.0
31 San Diego–Carlsbad, CA 12.1 54,278 13.7 11.0
32 Salt Lake City, UT 12.2 18,812 14.8 11.1
33 Kansas City, MO–KS 12.3 30,795 22.1 12.3 10.1
34 Colorado Springs, CO 12.3 11,186 12.7
35 Seattle–Tacoma–Bellevue, WA 12.4 50,593 16.8 10.8
36 Washington–Arlington–Alexandria, DC–vA–MD–Wv 12.4 93,663 20.4 10.3 9.7
37 Denver–Aurora–Lakewood, CO 12.5 40,399 16.9 10.4
38 Allentown–Bethlehem–Easton, PA–NJ 12.5 12,034 9.9
39 Chicago–Naperville–Elgin, IL–IN–WI 12.5 147,508 24.5 13.9 7.5
40 Columbia, SC 12.6 14,769 20.6 7.6
41 Los Angeles–Long Beach–Anaheim, CA 12.7 222,396 23.2 14.6 9.0
42 New Haven–Milford, CT 12.8 14,016 24.6 24.2 6.5
43 Nashville–Davidson––Murfreesboro––Franklin, TN 12.8 29,283 17.6 10.4
44 Cincinnati, OH–KY–IN 12.8 38,312 20.6 11.8
45 Providence–Warwick, RI–MA 13.0 28,340 27.2 9.2
46 virginia Beach–Norfolk–Newport News, vA–NC 13.2 35,271 19.4 10.3
47 Rochester, NY 13.4 21,701 30.8 23.0 9.8
48 New York–Newark–Jersey City, NY–NJ–PA 13.5 324,264 21.4 16.4 9.2
49 Dallas–Fort Worth–Arlington, TX 13.6 117,590 21.3 15.9 10.0
50 Orlando–Kissimmee–Sanford, FL 13.6 41,236 22.1 15.5 9.5
There is no automatic link between population size and disconnection rates. Large and small cities alike struggle with youth disconnection.

ZEROING IN ON PLACE AND RACE | Youth Disconnection in America’s Cities 6
Source: Measure of America calculations using US Census Bureau American Community Survey 2013. Note: A blank indicates that either the population size of youth ages 16 to 24 in that group and metro area is too small, or the survey response rate is too low, for reliable youth disconnection estimates. For Native Americans, the national disconnection rate is 27.8 percent. The numbers for individual metro areas are too small for reliable estimates. For Asian Americans, only four metro areas have a sufficient population of youth ages 16 to 24 for disconnection estimates: San Jose–Sunnyvale–Santa Clara, CA: 6.0 percent; Los Angeles–Long Beach–Anaheim, CA: 6.9 percent; New York–Newark–Jersey City, NY–NJ: 9.2 percent; Scranton–Wilkes-Barre–Hazleton, PA: 10.7 percent. The national Asian American rate is 7.9 percent.
RAnK MEtRo AREA
dISConnECtEd yoUth (% ages 16–24)
dISConnECtEd yoUth
(# ages 16–24)
dISConnECtEd yoUth (% ages 16–24)
BLACKS LAtInoS whItES
51 Cleveland–Elyria, OH 13.6 32,354 24.4 18.3 8.5
52 Boise City, ID 13.7 12,383 11.1
53 Harrisburg–Carlisle, PA 13.8 9,168
54 Winston–Salem, NC 13.9 10,668 13.0
55 St. Louis, MO–IL 14.0 48,903 20.7 11.6
56 Louisville/Jefferson County, KY–IN 14.0 21,750 18.5 13.3
57 Houston–The Woodlands–Sugar Land, TX 14.2 114,787 19.1 15.6 11.4
58 Philadelphia–Camden–Wilmington, PA–NJ–DE–MD 14.3 107,246 23.1 22.6 9.2
59 Deltona–Daytona Beach–Ormond Beach, FL 14.3 9,566 13.6
60 Greenville–Anderson–Mauldin, SC 14.5 17,466 14.8
61 Charlotte–Concord–Gastonia, NC–SC 14.5 45,473 19.8 13.0
62 Oklahoma City, OK 14.6 26,447 13.0
63 Cape Coral–Fort Myers, FL 14.6 9,189 12.8
64 Detroit–Warren–Dearborn, MI 14.7 77,581 24.9 20.5 9.6
65 Sacramento––Roseville––Arden–Arcade, CA 14.8 42,782 27.3 18.4 12.7
66 San Antonio–New Braunfels, TX 14.8 46,512 20.8 16.0 10.4
67 Tampa–St. Petersburg–Clearwater, FL 14.8 46,361 20.8 14.0 14.0
68 Youngstown–Warren–Boardman, OH–PA 14.9 9,155 14.1
69 Atlanta–Sandy Springs–Roswell, GA 14.9 111,423 18.3 16.9 12.3
70 Charleston–North Charleston, SC 14.9 13,650 24.4
71 El Paso, TX 14.9 20,865 14.4
72 Greensboro–High Point, NC 15.1 14,931 16.5 14.3
73 Miami–Fort Lauderdale–West Palm Beach, FL 15.1 100,937 20.7 14.9 10.8
74 Little Rock–North Little Rock–Conway, AR 15.2 17,942 13.2
75 Stockton–Lodi, CA 15.4 15,032 15.2
76 Richmond, vA 15.5 26,995 23.8 10.7
77 Tulsa, OK 15.5 27,199 28.2 13.9
78 Indianapolis–Carmel–Anderson, IN 15.8 35,539 22.3 14.0
79 Portland–vancouver–Hillsboro, OR–WA 16.1 46,657 15.0 15.5
80 Jackson, MS 16.2 12,834 16.8 16.0
81 Tucson, AZ 16.2 23,863 21.6 10.7
82 Albuquerque, NM 16.7 20,676 17.0 13.2
83 Birmingham–Hoover, AL 16.8 26,594 23.9 12.5
84 Chattanooga, TN–GA 16.8 12,226 15.7
85 Jacksonville, FL 16.9 29,551 25.6 15.3
86 Phoenix–Mesa–Scottsdale, AZ 17.3 95,586 19.1 23.9 11.3
87 Knoxville, TN 17.5 22,708 17.0
88 Riverside–San Bernardino–Ontario, CA 17.5 109,401 26.0 18.0 16.3
89 Fresno, CA 17.7 23,955 17.7 16.4
90 New Orleans–Metairie, LA 18.2 26,234 27.5 10.5
91 Baton Rouge, LA 18.6 22,273 31.1 10.4
92 Augusta–Richmond County, GA–SC 18.7 15,524 23.5 16.2
93 North Port–Sarasota–Bradenton, FL 19.0 12,913 16.5
94 Las vegas–Henderson–Paradise, Nv 19.6 47,568 33.2 19.8 15.5
95 McAllen–Edinburg–Mission, TX 19.8 23,481 20.3
96 Lakeland–Winter Haven, FL 20.4 14,612 19.5
97 Bakersfield, CA 21.2 26,411 19.9 20.7
98 Memphis, TN–MS–AR 21.6 44,928 28.6 13.2

ZEROING IN ON PLACE AND RACE | Youth Disconnection in America’s Cities 7
In America today, 13.8 percent of youth ages 16–24 are neither working nor in school—5,527,000 young people.
Disconnected young people differ in important ways from their peers who are in school or working. These differences can be both causes and consequences of disconnection.
• Theyarenearlytwiceaslikelytoliveinpoverty.
• Theyarenearlythreetimesaslikelytohaveleft high school without a diploma.
• Theyarenearlytwoandahalftimesaslikelytohaveahigh school diploma as their highest educational credential.
• Theyarehalfaslikelytoholdbachelor’s degrees. In the aftermath of the recession, the idea of a generation of college graduates living in their parents’ basements, unable to find jobs, gained currency; however, the reality is that bachelor’s degree holders represent a very small sliver of the disconnected youth population, just 4 percent.
• Disconnectedgirlsandyoungwomenaremorethanthreetimes as likely to have a child as their connected counterparts. While common sense may suggest that having a baby is what causes disconnection, another explanation is that disconnection comes first. An already tenuous connection to school and an absence of meaningful employment possibilities reduce the opportunity cost of having a baby as a teenager. Connected girls have strong incentives to delay the joys of motherhood until they have finished school, saved money, lived independently, gained a foothold in the working world, and have a committed partner; girls whose options are very limited have far fewer incentives to put off a meaningful and fulfilling marker of adulthood that is within their grasp.3 Data gaps on young fatherhood make it impossible to calculate the share of disconnected young men who are fathers.
• They are three times as likely to have a disability.
Key findings

highest degree is bachelor’s
5%
9%
48%
31%
15%
4%
29%
39%21%
who Are America’s disconnected youth?
disconnected youthConnected youth
young adults ages 16 to 24 young adults ages 16 to 24
EDUCATION
YOUNG MOTHERHOOD
POvERTY
live in a poor
household
dropped out of high school
20%highest degree is
high school diploma or equivalent
women with children
women with children
with a disabilitywith a disability
highest degree is high school diploma
or equivalent
dropped out of high school
live in a poor household
POvERTY
EDUCATION
YOUNG MOTHERHOOD
34,373,000 5,527,000
EDUCATION
EDUCATION
EDUCATION
8%highest degree
is bachelor’s
DISABILITY
11%
DISABILITYDISABILITY
EDUCATION
48% 52%51%49%

ZEROING IN ON PLACE AND RACE | Youth Disconnection in America’s Cities 9
who? Youth Disconnection by Race, Ethnicity, and Gender
The problem of youth disconnection is not borne equally by all groups; it is disproportionately shouldered by young people of color.
• The Asian American rate is 7.9 percent. Because the rate is low and the Asian American population is comparatively small, the absolute number of disconnected youth who are Asian American is only about 152,000 people.
• The white rate is 11.3 percent. Although whites have the second-lowest disconnection rate, they make up the largest group of disconnected young people, about 2.5 million, or 45 percent of all disconnected youth.
• The Latino rate is 16.3 percent. Roughly 1.4 million Latino young people ages 16–24 are disconnected.
• Black youth experience the second-highest rates of youth disconnection, 21.6 percent. Nearly 1.3 million black young people are neither working nor in school.
• native Americans have a youth disconnection rate of 27.8 percent. The Native American population is the smallest of the five major American racial and ethnic groups; therefore, even though the rate of disconnection is high, the actual number is comparatively low, around 84,000 people.
Adding gender to the mix widens the gap between the most- and least-connected youth populations. Native American boys and young men have the highest rate of disconnection, at 28.5 percent. Native American girls and young women have the next-highest rate, 27.2 percent, followed by black young men, then black young women.
Overall, young men are more likely than young women to be disconnected. This pattern holds for whites, blacks, and Native Americans, but the opposite is true among Latinos and Asian Americans. The rate of youth disconnection among Latino girls and young women is about 20 percent higher than among their male counterparts, 17.8 percent as compared with 14.9 percent. The recent attention to boys and men of color is welcome, but a focus on black and Latino young women is likewise imperative, given their high rates of disconnection.
Source: Measure of America calculations using US Census Bureau American Community Survey 2013. Note: Subsets do not include youth who answer “two or more” or “other” for race.
ALL DISCONNECTED YOUTH
13.8%5,527,000
WOMEN13.5%
2,626,000
MEN14.2%
2,901,000
ASIAN AMERICAN7.9%
152,0008.4%80,000
7.4%72,000
WHITE11.3%
2,487,00010.9%
1,178,00011.5%
1,309,000
LATINO16.3%
1,367,00017.8%715,000
14.9%652,000
BLACK21.6%
1,267,00018.4%533,000
24.9%734,000
NATIvE AMERICAN27.8%84,000
27.2%41,000
28.5%43,000

ZEROING IN ON PLACE AND RACE | Youth Disconnection in America’s Cities 10
Among Asian Americans, young women are also more likely than their male counterparts to be disconnected, though the gap between them is smaller than the gap between male and female Latino youth. Asian American boys and young men have the lowest disconnection rate, 7.4 percent, less than a third the rate of young black men.
One reason that black youth disconnection rates are so much higher than those of most other racial and ethnic groups is that black youth are the least likely to be employed, particularly boys and young men. Sixty-five percent of out-of-school young Americans are employed, but only 50.5 percent of out-of-school black young people are (see tABLE 2). The rate for black young men is lower still, just 46.9 percent, 7.7 percentage points less than the rate of their female counterparts. The share of out-of-school Latino young people who are employed, on the other hand, is only slightly below the national average, and male Latino youth are more likely to be employed than US males overall. Both black and Latino youth are less likely to be enrolled in school than the national average. Black young women outperform their male counterparts in both employment and education. Latina youth are ahead in education, but their brothers surpass them in employment.
Source: Measure of America calculations using US Census Bureau American Community Survey 2013.
EMPLoyMEnt-to- PoPULAtIon RAtIo
(% AgES 16–24 not In SChooL)
SChooL EnRoLLMEnt
(% AgES 16–24)
US 65.0 60.4
whItE 70.6 61.8
69.2 71.7 64.5 59.2
LAtIno 63.4 55.5
56.6 68.7 58.9 52.3
BLACK 50.5 56.3
54.6 46.9 59.5 53.1
tABLE 2 Employment and Enrollment by Race and Ethnicity and gender
Black young women outperform their male counterparts in both employment and education.
Best-Performing Metro Areas
1. Omaha–Council Bluffs, NE–IA 7.7%
2. Bridgeport–Stamford–Norwalk, CT 7.7%
3. Boston–Cambridge–Newton, MA 8.2%
4. Minneapolis–St. Paul–Bloomington, MN–WI 9.1%
5. Ogden–Clearfield, UT 9.1%
worst-Performing Metro Areas
94. Las vegas–Henderson–Paradise, Nv 19.6%
95. McAllen–Edinburg–Mission, TX 19.8%
96. Lakeland–Winter Haven, FL 20.4%
97. Bakersfield, CA 21.2%
98. Memphis, TN–MS–AR 21.6%
ZEROING IN ON PLACE AND RACE | Youth Disconnection in America’s Cities 11
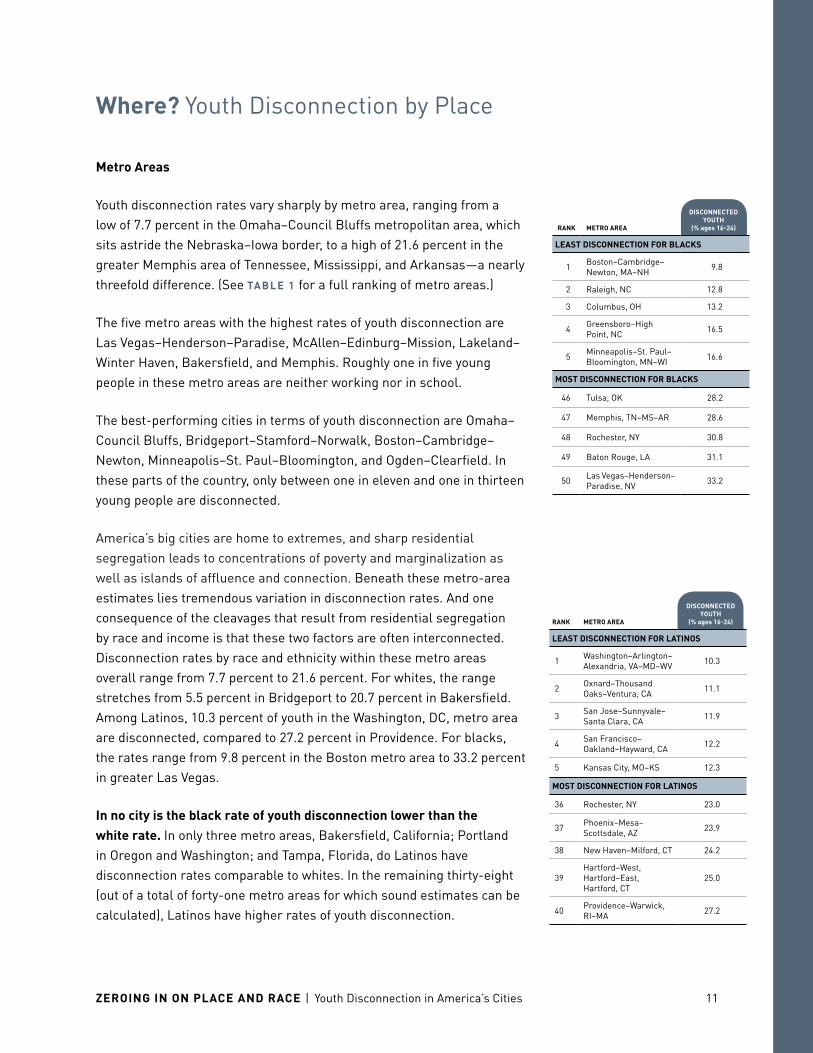
where? Youth Disconnection by Place
Metro Areas
Youth disconnection rates vary sharply by metro area, ranging from a low of 7.7 percent in the Omaha–Council Bluffs metropolitan area, which sits astride the Nebraska–Iowa border, to a high of 21.6 percent in the greater Memphis area of Tennessee, Mississippi, and Arkansas—a nearly threefold difference. (See tABLE 1 for a full ranking of metro areas.)
The five metro areas with the highest rates of youth disconnection are Las vegas–Henderson–Paradise, McAllen–Edinburg–Mission, Lakeland–Winter Haven, Bakersfield, and Memphis. Roughly one in five young people in these metro areas are neither working nor in school.
The best-performing cities in terms of youth disconnection are Omaha–Council Bluffs, Bridgeport–Stamford–Norwalk, Boston–Cambridge–Newton, Minneapolis–St. Paul–Bloomington, and Ogden–Clearfield. In these parts of the country, only between one in eleven and one in thirteen young people are disconnected.
America’s big cities are home to extremes, and sharp residential segregation leads to concentrations of poverty and marginalization as well as islands of affluence and connection. Beneath these metro-area estimates lies tremendous variation in disconnection rates. And one consequence of the cleavages that result from residential segregation by race and income is that these two factors are often interconnected. Disconnection rates by race and ethnicity within these metro areas overall range from 7.7 percent to 21.6 percent. For whites, the range stretches from 5.5 percent in Bridgeport to 20.7 percent in Bakersfield. Among Latinos, 10.3 percent of youth in the Washington, DC, metro area are disconnected, compared to 27.2 percent in Providence. For blacks, the rates range from 9.8 percent in the Boston metro area to 33.2 percent in greater Las vegas.
In no city is the black rate of youth disconnection lower than the white rate. In only three metro areas, Bakersfield, California; Portland in Oregon and Washington; and Tampa, Florida, do Latinos have disconnection rates comparable to whites. In the remaining thirty-eight (out of a total of forty-one metro areas for which sound estimates can be calculated), Latinos have higher rates of youth disconnection.
RAnK MEtRo AREA
dISConnECtEd yoUth
(% ages 16-24)
LEASt dISConnECtIon foR BLACKS
1 Boston–Cambridge–Newton, MA–NH 9.8
2 Raleigh, NC 12.8
3 Columbus, OH 13.2
4 Greensboro–High Point, NC 16.5
5 Minneapolis–St. Paul–Bloomington, MN–WI 16.6
MoSt dISConnECtIon foR BLACKS
46 Tulsa, OK 28.2
47 Memphis, TN–MS–AR 28.6
48 Rochester, NY 30.8
49 Baton Rouge, LA 31.1
50 Las vegas–Henderson–Paradise, Nv 33.2
RAnK MEtRo AREA
dISConnECtEd yoUth
(% ages 16-24)
LEASt dISConnECtIon foR LAtInoS
1 Washington–Arlington–Alexandria, vA–MD–Wv 10.3
2 Oxnard–Thousand Oaks–ventura, CA 11.1
3 San Jose–Sunnyvale–Santa Clara, CA 11.9
4 San Francisco–Oakland–Hayward, CA 12.2
5 Kansas City, MO–KS 12.3
MoSt dISConnECtIon foR LAtInoS
36 Rochester, NY 23.0
37 Phoenix–Mesa–Scottsdale, AZ 23.9
38 New Haven–Milford, CT 24.2
39Hartford–West, Hartford–East, Hartford, CT
25.0
40 Providence–Warwick, RI–MA 27.2

ZEROING IN ON PLACE AND RACE | Youth Disconnection in America’s Cities 12
A city can be simultaneously among the best for one racial or ethnic group and among the worst for another. New England is home to several metro areas in which white and Latino young adults appear to be living in different worlds. The New Haven metro area in Connecticut is the third-best-performing metro area for white youth; only 6.5 percent are disconnected. Yet this same area is third from the bottom for Latinos. A similar pattern can be seen in greater Hartford, Connecticut, which is fourth-best for whites (6.6 percent), but second from the bottom for Latinos (25.0 percent). The Providence–Warwick metro area, which encompasses parts of Rhode Island and Massachusetts, is the worst metro area for Latinos, with a disconnection rate of 27.2 percent, but in the top quarter for whites.
For blacks, Baton Rouge, Louisiana, and Rochester, New York, have the second- and third-worst youth disconnection rates, nearly one in three. But in both metro areas, the white rate (10.4 percent and 9.8 percent, respectively) is better than the rate for whites at the national level.
Some metros show a mix. Both whites and Latinos are doing better in the Chicago metro area than they are in the country as a whole (with disconnection rates of 7.5 and 13.9 percent, respectively, but blacks are doing much worse (with a rate of 24.5 percent). The greater Boston metro area, with an overall rate of 8.2 percent, is relatively good for white (6.8 percent) and black youth (9.8 percent), but not for Latinos (17.3 percent).
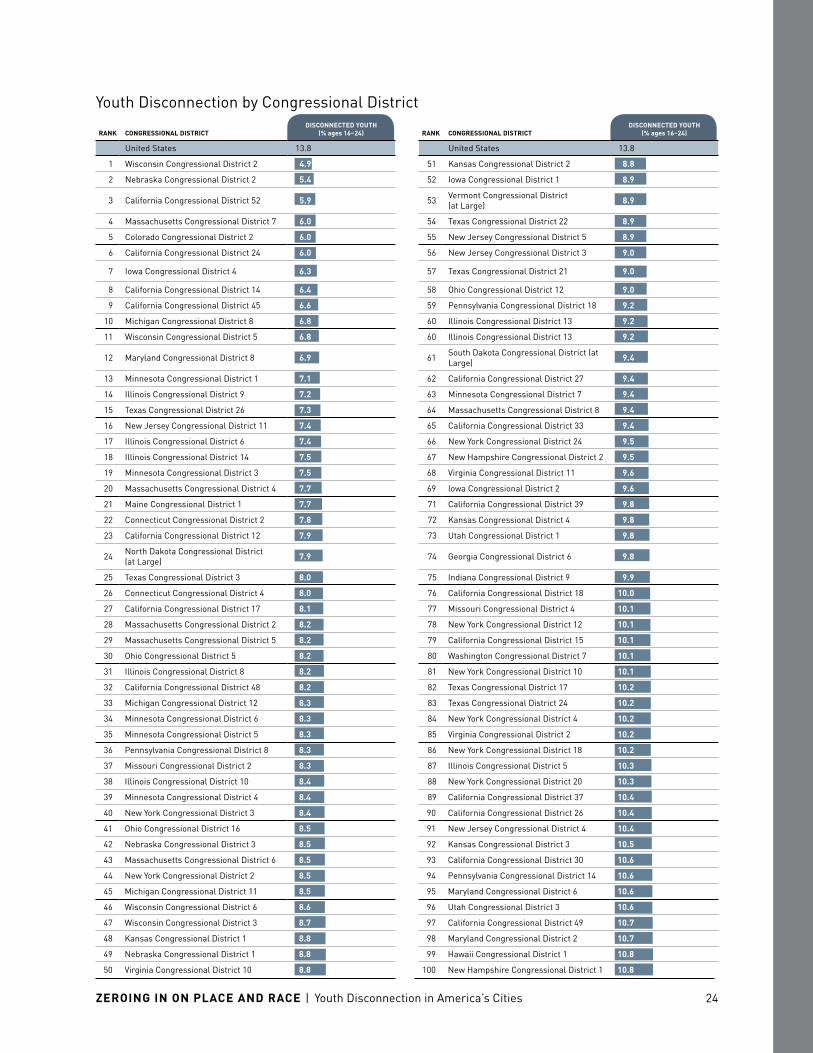
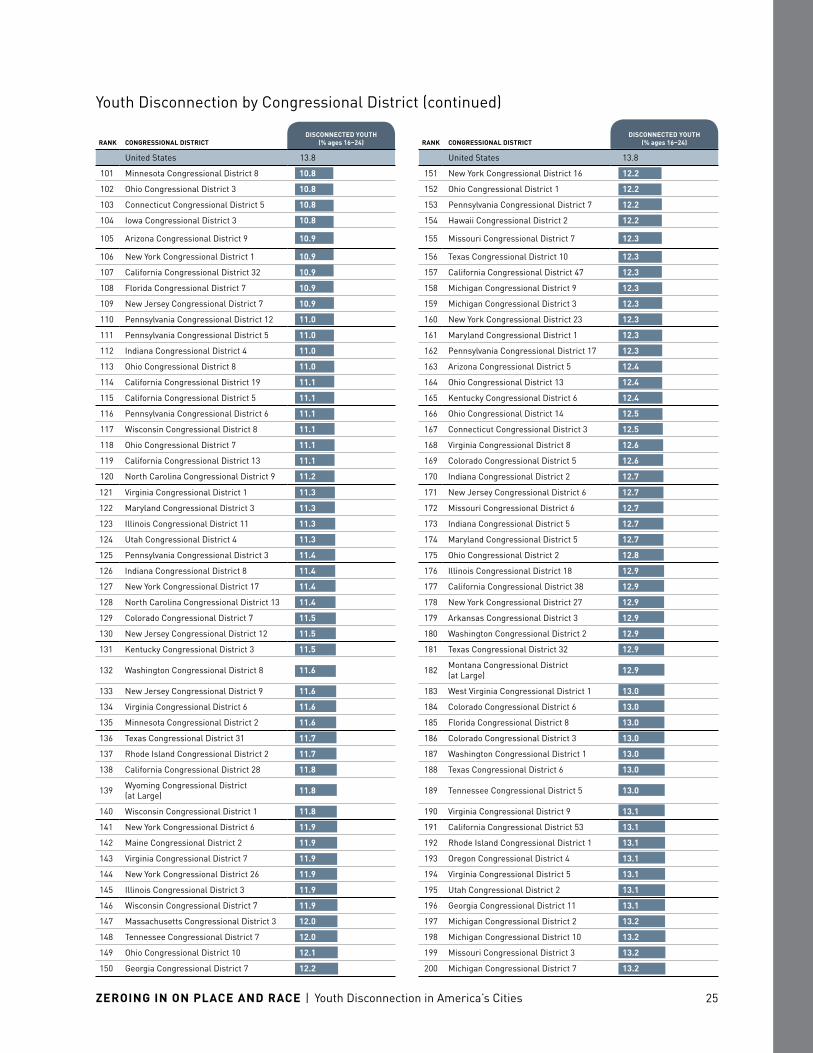
Congressional districts
Congressional districts provide a fascinating and revealing lens through which to view the US population. The 435 districts are all roughly the same size in terms of population—about 725,000 people—and each sends a representative to Congress, connecting the population to national priority-setting and policymaking. The nonvoting District of Columbia is also included in the rankings. Although gerrymandering can obscure or distort some realities, it certainly highlights the nature of political power in a state. Political power is tied to the allocation of resources and to access to opportunity, both of which tend to be in short supply in communities with high levels of youth disconnection.
The national map on page 14, with darker colors representing lower levels of youth disconnection, reveals a remarkable pattern. In some states, among them Iowa, Kansas, Minnesota, Nebraska, North Dakota, South Dakota, vermont, and Wisconsin, disconnection is fairly rare, not
RAnK CongRESSIonAL dIStRICt
dISConnECtEd yoUth
(% ages 16-24)
United States 13.8
MoSt ConnECtEd
1wisconsin district 2 Madison and surrounding counties
4.9
2 nebraska district 2 Omaha metro area 5.4
3California district 52 Coastal and Northern San Diego
5.9
4Massachusetts district 7 Some Boston suburbs and Cambridge
6.0
5Colorado district 2 Northwestern suburbs of Denver, including Boulder
6.0
LEASt ConnECtEd
432
California district 8 Eastern Desert Region, including Mono, Inyo, and San Bernardino Counties
23.3
433Louisiana district 5 Northeast and Central Louisiana
23.7
434
texas district 34 Gulf Coast between Brownsville and Corpus Christi
23.8
435 new york district 15 South Bronx 24.2
436 Arizona district 7 Phoenix and Glendale 25.6
Source: Measure of America calculations using US Census Bureau American Community Survey 2013.

ZEROING IN ON PLACE AND RACE | Youth Disconnection in America’s Cities 13
just in pockets of privilege but rather for contiguous stretches hundreds of miles long. Large swaths across inland California, the Southwest, and the Southeast experience the opposite reality: youth disconnection rates high enough that neither working nor being in school is a normative condition. In more densely populated cities along the California coast, in the DC–Boston corridor, and the Midwest, districts with high disconnection rates are often adjacent to districts with low rates.

AK
CA
WA
CO
AL
NC
OHINIL
NHVT
MA
CTNJ
MD
DCDE
HI
RI
SC
TNAR
MO
OK
SD
DISCONNECTED YOUTH4.9%–10.3%
10.4%–12.8%
12.9%–14.5%
14.6%–17.3%
17.4%–25.6%
OR
MT
ID
NV
UT
WY
ND
SD
NE
KS
NM
TX
AZ
LA
MSGA
FL
MN
IA
WIMI
KYVA
PA
NY
ME
WV
MAP 1 youth disconnection by Congressional district
4.9%–10.3%
10.4%–12.8%
12.9%–14.5%
14.6%–17.3%
17.4%–25.6%
dISConnECtEd yoUth

ZEROING IN ON PLACE AND RACE | Youth Disconnection in America’s Cities 15
why? Factors Associated with Youth Disconnection
Disconnected youth come overwhelmingly from communities that have long been isolated from the mainstream. Previous Measure of America research4 using over 2,000 Census Bureau–defined neighborhood clusters5 in the United States showed that high rates of youth disconnection in the country’s most populous metropolitan areas were strongly associated with the following six factors:
high rates of disconnection a decade ago. Rates of youth disconnection by neighborhood in 2000 were highly predictive of the rates of youth disconnection by neighborhood in 2011, even controlling for population growth and demographic change. This finding suggests that in high-disconnection neighborhoods, being out of work and school is persistent and commonplace and, as a result, almost the norm for young people. It also indicates that efforts to address the problem at scale have failed, or, in some places, not even taken place.
Low levels of human development. Human development is about improving people’s well-being and expanding their choices and opportunities; we measured this concept with the American Human Development Index, a composite of health, education, and income indicators. Neighborhoods with low scores on the Index tended to have high rates of disconnection, and high-scoring areas had relatively few disconnected young people.
high rates of poverty. In high-poverty neighborhoods, about one in five young people were disconnected, as compared with only about one in fourteen for youth in low-poverty neighborhoods.6
high rates of adult unemployment. Parents who themselves struggle with weak attachment to the labor market are less able to help their children gain a foothold in the world of work than parents with robust employment histories. This commonsense observation showed up clearly in the data: there was a strong
DIS
CO
NN
EC
TE
D
YOU
TH
YEAR

ZEROING IN ON PLACE AND RACE | Youth Disconnection in America’s Cities 16
positive relationship at the neighborhood level between adult employment and youth connection to school and work.
Low levels of adult educational attainment. As with the link between adult and youth employment, the link between adult educational levels and youth school attachment is both intuitive and supported by the evidence: at both the metro area and neighborhood levels, how much education adults had strongly predicted how likely young people were to be in school in the 16-to-24-year-old age range.
A high degree of racial segregation. A complex combination of factors related to both race and place contributes to youth disconnection. The divides between racial and ethnic groups at the national level are striking; blacks are almost three times as likely to be disconnected as Asian Americans. Worse still are the chasms that open up when analyzing race and place together between cities; black young adults in greater Las vegas (with a disconnection rate of 33.2 percent) are six times as likely to be out of school and work as white youth in greater Bridgeport, Connecticut (5.5 percent). And previous Measure of America research7 has shown the greatest gaps of all are between overwhelmingly white and overwhelmingly black neighborhoods within metro areas; in greater Chicago, Washington, DC, and Philadelphia, at least ten times as many young people living in a few predominately black neighborhoods were disconnected as youth living in a few nearly all-white neighborhoods.
Place matters. Race matters. But our analysis shows that the combination of the two really packs a wallop. Concentrated racial segregation within metro areas has dramatic but very different consequences for young people depending on their race. And this difference is based in part on the distance to opportunity—not only a physical distance but also a social and aspirational distance.
While America’s neighborhoods have become less segregated by race and more segregated by income over the past decade, the fact that blacks are disproportionately poor means that both forms of segregation have a similar end result for low-income blacks: they are likely to live in

ZEROING IN ON PLACE AND RACE | Youth Disconnection in America’s Cities 17
high-poverty, largely black neighborhoods. Segregated housing patterns, which stem directly from a pernicious web of discriminatory housing policies at the local, state, and federal levels from the 1930s through to the 1970s,8 persist, particularly in metro areas in the northern United States.9 Blacks tend to live in neighborhoods that are more racially segregated than either Asian Americans or Latinos.10
Using a statistical model to examine the relationship between place and race in the metro areas studied in this report, particularly the interaction between being black and the level of segregation in the metro area,11 we found that the more segregated blacks and whites are from one another within a metro area, the lower the likelihood of youth disconnection is among whites, but the higher the likelihood is among blacks. The significant interaction between being black and living in a segregated metropolitan area results in a higher likelihood of being disconnected.
Since the 1970s, Americans have increasingly lived separately from those in different economic strata. The result is that in metro areas today, poor people have mostly other poor people as their neighbors and the rich live primarily in communities with other rich people—insulated from the rest of society by their collective financial and social capital. This class-based trend was profoundly exacerbated by America’s history of de jure racial segregation. Government entities from the Federal Housing Authority to local municipalities fostered segregation by, among other measures, requiring that public housing be segregated by race; by zoning predominantly black neighborhoods as “mixed-use,” thus allowing undesirable businesses from liquor stores and bars to junkyards and polluting industries to set up shop there; and by making subsidized post-war loans for suburban housing available only to whites.12 The distance to opportunity for blacks was and continues to be reinforced by physical barriers (neighborhoods that are cut off from white areas by highways, train tracks, canals, roads, and public transit systems that do not connect black and white neighborhoods), as well as economic and social barriers.
The resulting concentrations of predominantly black and brown poverty and mostly white affluence have truly severed routes for upward mobility in poor communities while simultaneously creating “homogeneously privileged” communities of opportunity for those at the top of the income scale.13
What is the mechanism by which this concentration of extremes disadvantages some groups while privileging others? People living in poor communities have to contend with not only the disadvantages of
Extreme neighborhood segregation has dramatic but very different consequences for young people depending on their race.

ZEROING IN ON PLACE AND RACE | Youth Disconnection in America’s Cities 18
having low incomes but also the effects of living among others also struggling with the damaging effects of poverty in neighborhoods scarred by decades of disinvestment and neglect. And their social networks tend to be confined to others facing similar economic struggles. The affluent, on the other hand, enjoy the rewards of their own larger incomes while also benefitting from their neighbors’ advantages.14 Together they are able to create an opportunity wonderland for their children that is characterized by good schools, strong social networks, meaningful opportunities for civic engagement, extracurricular activities, a rich array of contacts for internship opportunities, and proximity to other adults with a wide range of skills, experience, and connections. To be sure, these communities can be highly competitive hothouses with levels of stress that can be harmful to teens,15 and too many choices can be overwhelming.16 But there can be little doubt about which extreme is worse for the typical young person.
Living in a place replete with the ingredients of a freely chosen, rewarding life offers a young person many avenues toward a successful adulthood. Lacking not just one or two of these key ingredients but most or all of them, on the other hand, is the recipe for disconnection.

ZEROING IN ON PLACE AND RACE | Youth Disconnection in America’s Cities 19
now what? Recommendations
This work makes clear that disconnected young people face challenges beyond what they can tackle alone. To alter the trajectory of his or her life, a young person needs perseverance, the ability to delay gratification, the optimism to envision a better future, and the willingness to work toward it. But these personal characteristics, while necessary, are simply not sufficient. disconnection is not a spontaneously occurring phenomenon; it is an outcome years in the making. Absent a family catastrophe, an addiction disorder, or the onset of mental illness, engaged young people from middle-class neighborhoods rarely drop out or drift away from the worlds of school and work; this comparatively anchored population is by and large not the one we need to worry about when it comes to youth disconnection. Disconnected young people tend to come from communities that are themselves disconnected from the mainstream by segregation and concentrated disadvantage, and their struggles with education and employment mirror those of their parents and neighbors. Connecting these communities to the wider society and creating meaningful opportunities within them is the answer to youth disconnection.
we are already paying for failure. Even leaving aside the human costs of wasted potential, a conservative estimate of a narrow range of direct financial costs associated with the country’s 5.5 million disconnected youth—including incarceration, Medicaid, public assistance, and Supplemental Security Income payments—tallies $26.8 billion for 2013 alone. Society is already paying these costs, and many more, not just in 2013, but year after year. Imagine other ways in which this sum might be spent. It is sufficient to pay for more than 800,000 young people to obtain a trade school degree, or for 2.2 million to complete community college degrees. It could fund the participation of every disconnected young person in California in the state’s successful high-school-based Linked Learning Program 6,000 times over.
we need to invest in success—which means preventing disconnection in the first place. It is almost always cheaper, and certainly more humane, to prevent problems from taking root than to wait until they are full-blown crises to respond. Rigorous evaluations suggest the following are cost-effective investments in preventing youth disconnection.
Helping at-risk parents help their children get a good start is key; proven programs like the Nurse-Family Partnership should be expanded.
Disconnection is not a spontaneously occurring phenomenon; it is an outcome years in the making.

ZEROING IN ON PLACE AND RACE | Youth Disconnection in America’s Cities 20
The expert consensus is that a quality preschool for 3- and 4-year olds, particularly for at-risk children, is one of the most worthwhile interventions available. It is not only learning to count and recite the alphabet that makes the difference. The social and emotional skills taught in these early years—learning to wait your turn, be on time, work with others— are critical ingredients for success throughout life. High-quality preschool is associated with fewer behavioral problems, higher high school graduation rates, less crime, fewer teen births, and higher wages and rates of homeownership.17
Another clear investment priority is high-quality K–12 schooling. Children growing up in disadvantaged circumstances need schools with the expertise and resources to provide high-quality academic instruction; a safe, healthy, and respectful environment; and support, both during and out of normal school hours, for at-risk children and children exhibiting dropout warning signs. In some of America’s schools, we are exceeding standards in all of these areas. In others, particularly those in high-disconnection areas, we are coming up woefully short.
Creating diverse pathways to meaningful careers through measures like apprenticeship and mentoring programs can help at-risk youth successfully navigate the school-to-work transition by providing support, relevant instruction, and a clear end goal. These include innovative high school–based programs such as Linked Learning, which provides high school students with real-world job experience and engaging experiential learning curriculum, and partnerships between high schools, community colleges, and local businesses. Lastly, evidence suggests that civic engagement makes youth disconnection less likely. A joint research project between Measure of America and Opportunity Nation found that civic engagement may help youth, particularly low-income teens and young adults, build social capital and skills that can help them find meaningful education and career pathways. Youth who volunteer are considerably less likely than their non-volunteering peers to be disconnected from work and school. In fact, the likelihood that a young person will be disconnected drops nearly in half if he or she volunteers.18
But those who are already disconnected need a second chance. Reconnecting young people who are isolated from the worlds of school and work costs more than preventing disconnection in the first place. But we cannot abandon them. They need a second chance—especially since so many didn’t really get a decent first chance. Rigorous evaluations of existing “second chance” programs reinforce the notion that a problem that took many years to develop cannot be solved quickly or simply.
High-quality preschool is associated with fewer behavioral problems, higher high school graduation rates, less crime, fewer teen births, and higher wages and rates of homeownership.

ZEROING IN ON PLACE AND RACE | Youth Disconnection in America’s Cities 21
Matching disconnected youth with one-off summer internships or low-wage jobs does not plant them firmly on the path to a productive and secure adulthood. They tend to need additional support to grapple with personal and family issues, gain credentials, develop soft skills and confidence, address health issues, deal with housing and transportation issues, and more.
More and higher-quality data are necessary regarding which approaches work with which populations. To meet this need, the Aspen Forum for Community Solutions awarded grants to twenty-one partners to test a variety of community-level approaches to connecting disconnected young people with education and employment. This effort will provide valuable evidence to inform future programming.
we need to set goals and work toward them together. Meaningful progress requires that organizations and individuals active in this area join together to establish measurable, time-bound targets for reducing youth disconnection. These targets should be ambitious, tailored to the on-the-ground realities of different cities, and based on an accelerated, but achievable, rate of progress. A meaningful starting point would be for cities to adopt the goal of cutting in half the gap between racial and ethnic groups within their metro areas. Here’s how it would work, using Chicago as an example. Chicago’s disconnection rate for black youth is 24.5 percent, and for white youth, 7.5 percent—a 17 percent gap. Narrowing the black-white gap to 8.5 percent, which would mean a black disconnection rate of 16 percent, would not be easy, but it is possible. Setting targets like this in metro areas across the country would make the plight of these young people visible at a more local level, spur community actors to get involved, and accelerate progress toward a better future.
Reconnecting young people who are isolated from the worlds of school and work costs more than preventing disconnection in the first place. But we cannot abandon them.

ZERoIng In on PLACE And RACE | Youth Disconnection in America’s Cities 22
Arai, Lisa. “Low Expectations, Sexual Attitudes and Knowledge: Explaining Teenage Pregnancy and Fertility in English Communities. Insights from Qualitative Research.” Sociological Review. 51, no. 2 (May 2003): 199–217.
Burd-Sharps, Sarah, and Kristen Lewis. One in Seven: Ranking Youth Disconnection in the 25 Largest Metro Areas. New York: Social Science Research Council, 2012.
Frey, William H. “The New Metro Minority Map: Regional Shifts in Hispanics, Asians, and Blacks from Census 2010.” Washington, DC: Brookings Institution Metropolitan Policy Program. August 2011.
Guthrie, Elisabeth. The Trouble with Perfect. New York: Broadway Books, 2002.
Heckman, James J. “The Case for Investing in Disadvantaged Young Children.” In Big Ideas: Investing in Our Nation’s Future, 49–58. Washington, DC: First Focus, 2008.
Lewis, Kristen, and Sarah Burd-Sharps. Halve the Gap by 2030: Youth Disconnection in America’s Cities. New York: Social Science Research Council, 2013.
Massey, Douglas S. “The Age of Extremes: Concentrated Affluence and Poverty in the Twenty-First Century.” Demography 33, no. 4 (November 1, 1996): 395–412.
Opportunity Nation. “Connecting Youth and Strengthening Communities: The Data Behind Civic Engagement and Economic Opportunity, “ September, 2014.
Rothstein, Richard. “The Making of Ferguson,” Washington, DC: Economic Policy Institute. 2015. http://www.epi.org/publication/making-ferguson.
Scarpetta, Stefano, Anne Sonnet, and Thomas Manfredi. “Rising Youth Unemployment during the Crisis: How to Prevent Negative Long-Term Consequences on a Generation?” Working Paper 106, Organisation for Economic Co-operation and Development, 2010. http://www.oecd.org/employment/youthforum/44986030.pdf.
Schwartz, Barry. The Paradox of Choice: Why More Is Less. New York: Harper Collins, 2009.
U.S. Census Bureau. American Community Survey. 2013, Public Use Microdata Sample.
1 Scarpetta, Sonnet, and Manfredi. “Rising Youth Unemployment during the Crisis: How to Prevent Negative Long-Term Consequences on a Generation?”
2 Tangible direct costs to taxpayers that resulted from disconnected youth were calculated using data from the 2013 American Community Survey Public Use Microdata Sample based on use of four types of assistance/costs: $11,192 million (incarceration); $12,366 million (Medicaid); $741 million (public assistance payments); and $2,490 million in Supplemental Security Income payments. For full methodological details and data sources for per-person costs, see www.measureofamerica.org/youth-disconnection-2015/methodology.
3 Arai, “Low Expectations, Sexual Attitudes and Knowledge.”
4 Lewis and Burd-Sharps, Halve the Gap.
5 Note that “neighborhoods” and “neighborhood clusters” refer to Census Bureau–defined Public Use Microdata Areas (PUMAs). The
Endnotespopulation of PUMAs typically range from 100,000 to 200,000 people.
6 Poverty thresholds were set for this exercise at one standard deviation above and below the mean for all neighborhoods. Low-poverty neighborhoods were those with a poverty rate below 5.5 percent. High-poverty neighborhoods had a poverty rate above 21.4 percent. See Burd-Sharps and Lewis, One in Seven, page 20, for further details.
7 Lewis and Burd-Sharps, Halve the Gap.
8 Rothstein, “The Making of Ferguson.”
9 Frey, “The New Metro Minority Map.”
10 Ibid.
11 This conclusion was arrived at by using multilevel logistic regression models that predict the likelihood that a young person is disconnected, taking individual and metro-area level characteristics (and their interaction) into account. Metro-area characteristics include the youth poverty rate, the percent of black youth, and William H. Frey’s
white-black Index of Dissimilarity for metro areas. See note 9. Frey calculated Index values for ninety-seven of the ninety-eight metro statistical areas that form the basis of this report. Individual characteristics accounted for in the models include race and gender.
12 Rothstein, The Making of Ferguson.
13 Massey, “The Age of Extremes.”
14 Ibid.
15 Guthrie, The Trouble with Perfect.
16 Schwartz, The Paradox of Choice.
17 Heckman, “The Case for Investing in Disadvantaged Young Children.”
18 Opportunity Nation, “Connecting Youth and Strengthening Communities: The Data Behind Civic Engagement and Economic Opportunity.”
Bibliography

ZERoIng In on PLACE And RACE | Youth Disconnection in America’s Cities 23
Source: Measure of America calculations using US Census Bureau American Community Survey 2013. To access data tables, go to www.measureofamerica.org/youth-disconnection-2015.
Note: Rates in all indicator tables have been rounded to one decimal place. The resulting values may appear to be tied but the rankings reflect the original values, not the rounded values.
Indicator tables: Youth Disconnection by State
RAnK StAtEdISConnECtEd yoUth (% ages 16–24)
dISConnECtEd yoUth (# ages 16–24)
United States 13.8 5,527,000
1 Nebraska 7.6 18,222
2 North Dakota 7.9 8,930
3 Iowa 8.8 34,655
4 Minnesota 8.9 57,352
5 vermont 8.9 7,257
6 South Dakota 9.4 10,011
7 Kansas 9.4 35,508
8 Wisconsin 9.8 68,181
9 Massachusetts 9.8 84,834
10 Maine 9.8 14,593
11 New Hampshire 10.1 16,428
12 Connecticut 10.6 46,335
13 Utah 11.2 47,522
14 Hawaii 11.5 19,470
15 Colorado 11.5 73,892
16 Wyoming 11.8 8,860
17 Maryland 11.8 85,660
18 New Jersey 12.1 124,877
19 Ohio 12.3 174,132
20 Rhode Island 12.4 18,386
21 virginia 12.5 129,665
22 Illinois 12.9 207,984
23 Montana 12.9 16,613
24 Missouri 12.9 96,721
25 Pennsylvania 13.3 208,813
26 Indiana 13.4 113,104
27 Michigan 13.7 173,899
28 California 13.8 699,150
29 New York 13.8 343,699
30 Washington 14.1 118,330
31 Alaska 14.2 14,829
32 North Carolina 14.7 182,377
33 Oregon 14.8 69,090
34 Texas 14.9 521,061
35 Idaho 14.9 30,530
36 Kentucky 15.2 81,850
37 South Carolina 15.2 94,408
38 Florida 15.3 348,366
39 Delaware 15.4 17,055
40 Oklahoma 15.9 78,557
41 Georgia 16.5 215,663
42 Arkansas 16.6 59,976
43 Tennessee 16.6 132,040
44 New Mexico 16.9 46,221
45 Arizona 17.3 146,510
46 Alabama 17.9 110,955
47 District of Columbia 18.3 16,782
48 Nevada 18.5 61,786
49 Mississippi 18.5 74,119
50 West virginia 19.4 41,838
51 Louisiana 19.8 119,846
ZERoIng In on PLACE And RACE | Youth Disconnection in America’s Cities 24
Youth Disconnection by Congressional District
RAnK CongRESSIonAL dIStRICtdISConnECtEd yoUth
(% ages 16–24) RAnK CongRESSIonAL dIStRICtdISConnECtEd yoUth
(% ages 16–24)
United States 13.8 United States 13.8
1 Wisconsin Congressional District 2 4.9 51 Kansas Congressional District 2 8.8
2 Nebraska Congressional District 2 5.4 52 Iowa Congressional District 1 8.9
3 California Congressional District 52 5.9 53 vermont Congressional District (at Large) 8.9
4 Massachusetts Congressional District 7 6.0 54 Texas Congressional District 22 8.9
5 Colorado Congressional District 2 6.0 55 New Jersey Congressional District 5 8.9
6 California Congressional District 24 6.0 56 New Jersey Congressional District 3 9.0
7 Iowa Congressional District 4 6.3 57 Texas Congressional District 21 9.0
8 California Congressional District 14 6.4 58 Ohio Congressional District 12 9.0
9 California Congressional District 45 6.6 59 Pennsylvania Congressional District 18 9.2
10 Michigan Congressional District 8 6.8 60 Illinois Congressional District 13 9.2
11 Wisconsin Congressional District 5 6.8 60 Illinois Congressional District 13 9.2
12 Maryland Congressional District 8 6.9 61 South Dakota Congressional District (at Large) 9.4
13 Minnesota Congressional District 1 7.1 62 California Congressional District 27 9.4
14 Illinois Congressional District 9 7.2 63 Minnesota Congressional District 7 9.4
15 Texas Congressional District 26 7.3 64 Massachusetts Congressional District 8 9.4
16 New Jersey Congressional District 11 7.4 65 California Congressional District 33 9.4
17 Illinois Congressional District 6 7.4 66 New York Congressional District 24 9.5
18 Illinois Congressional District 14 7.5 67 New Hampshire Congressional District 2 9.5
19 Minnesota Congressional District 3 7.5 68 virginia Congressional District 11 9.6
20 Massachusetts Congressional District 4 7.7 69 Iowa Congressional District 2 9.6
21 Maine Congressional District 1 7.7 71 California Congressional District 39 9.8
22 Connecticut Congressional District 2 7.8 72 Kansas Congressional District 4 9.8
23 California Congressional District 12 7.9 73 Utah Congressional District 1 9.8
24 North Dakota Congressional District (at Large) 7.9 74 Georgia Congressional District 6 9.8
25 Texas Congressional District 3 8.0 75 Indiana Congressional District 9 9.9
26 Connecticut Congressional District 4 8.0 76 California Congressional District 18 10.0
27 California Congressional District 17 8.1 77 Missouri Congressional District 4 10.1
28 Massachusetts Congressional District 2 8.2 78 New York Congressional District 12 10.1
29 Massachusetts Congressional District 5 8.2 79 California Congressional District 15 10.1
30 Ohio Congressional District 5 8.2 80 Washington Congressional District 7 10.1
31 Illinois Congressional District 8 8.2 81 New York Congressional District 10 10.1
32 California Congressional District 48 8.2 82 Texas Congressional District 17 10.2
33 Michigan Congressional District 12 8.3 83 Texas Congressional District 24 10.2
34 Minnesota Congressional District 6 8.3 84 New York Congressional District 4 10.2
35 Minnesota Congressional District 5 8.3 85 virginia Congressional District 2 10.2
36 Pennsylvania Congressional District 8 8.3 86 New York Congressional District 18 10.2
37 Missouri Congressional District 2 8.3 87 Illinois Congressional District 5 10.3
38 Illinois Congressional District 10 8.4 88 New York Congressional District 20 10.3
39 Minnesota Congressional District 4 8.4 89 California Congressional District 37 10.4
40 New York Congressional District 3 8.4 90 California Congressional District 26 10.4
41 Ohio Congressional District 16 8.5 91 New Jersey Congressional District 4 10.4
42 Nebraska Congressional District 3 8.5 92 Kansas Congressional District 3 10.5
43 Massachusetts Congressional District 6 8.5 93 California Congressional District 30 10.6
44 New York Congressional District 2 8.5 94 Pennsylvania Congressional District 14 10.6
45 Michigan Congressional District 11 8.5 95 Maryland Congressional District 6 10.6
46 Wisconsin Congressional District 6 8.6 96 Utah Congressional District 3 10.6
47 Wisconsin Congressional District 3 8.7 97 California Congressional District 49 10.7
48 Kansas Congressional District 1 8.8 98 Maryland Congressional District 2 10.7
49 Nebraska Congressional District 1 8.8 99 Hawaii Congressional District 1 10.8
50 virginia Congressional District 10 8.8 100 New Hampshire Congressional District 1 10.8
ZERoIng In on PLACE And RACE | Youth Disconnection in America’s Cities 25
Youth Disconnection by Congressional District (continued)
RAnK CongRESSIonAL dIStRICtdISConnECtEd yoUth
(% ages 16–24) RAnK CongRESSIonAL dIStRICtdISConnECtEd yoUth
(% ages 16–24)
United States 13.8 United States 13.8
101 Minnesota Congressional District 8 10.8 151 New York Congressional District 16 12.2
102 Ohio Congressional District 3 10.8 152 Ohio Congressional District 1 12.2
103 Connecticut Congressional District 5 10.8 153 Pennsylvania Congressional District 7 12.2
104 Iowa Congressional District 3 10.8 154 Hawaii Congressional District 2 12.2
105 Arizona Congressional District 9 10.9 155 Missouri Congressional District 7 12.3
106 New York Congressional District 1 10.9 156 Texas Congressional District 10 12.3
107 California Congressional District 32 10.9 157 California Congressional District 47 12.3
108 Florida Congressional District 7 10.9 158 Michigan Congressional District 9 12.3
109 New Jersey Congressional District 7 10.9 159 Michigan Congressional District 3 12.3
110 Pennsylvania Congressional District 12 11.0 160 New York Congressional District 23 12.3
111 Pennsylvania Congressional District 5 11.0 161 Maryland Congressional District 1 12.3
112 Indiana Congressional District 4 11.0 162 Pennsylvania Congressional District 17 12.3
113 Ohio Congressional District 8 11.0 163 Arizona Congressional District 5 12.4
114 California Congressional District 19 11.1 164 Ohio Congressional District 13 12.4
115 California Congressional District 5 11.1 165 Kentucky Congressional District 6 12.4
116 Pennsylvania Congressional District 6 11.1 166 Ohio Congressional District 14 12.5
117 Wisconsin Congressional District 8 11.1 167 Connecticut Congressional District 3 12.5
118 Ohio Congressional District 7 11.1 168 virginia Congressional District 8 12.6
119 California Congressional District 13 11.1 169 Colorado Congressional District 5 12.6
120 North Carolina Congressional District 9 11.2 170 Indiana Congressional District 2 12.7
121 virginia Congressional District 1 11.3 171 New Jersey Congressional District 6 12.7
122 Maryland Congressional District 3 11.3 172 Missouri Congressional District 6 12.7
123 Illinois Congressional District 11 11.3 173 Indiana Congressional District 5 12.7
124 Utah Congressional District 4 11.3 174 Maryland Congressional District 5 12.7
125 Pennsylvania Congressional District 3 11.4 175 Ohio Congressional District 2 12.8
126 Indiana Congressional District 8 11.4 176 Illinois Congressional District 18 12.9
127 New York Congressional District 17 11.4 177 California Congressional District 38 12.9
128 North Carolina Congressional District 13 11.4 178 New York Congressional District 27 12.9
129 Colorado Congressional District 7 11.5 179 Arkansas Congressional District 3 12.9
130 New Jersey Congressional District 12 11.5 180 Washington Congressional District 2 12.9
131 Kentucky Congressional District 3 11.5 181 Texas Congressional District 32 12.9
132 Washington Congressional District 8 11.6 182 Montana Congressional District (at Large) 12.9
133 New Jersey Congressional District 9 11.6 183 West virginia Congressional District 1 13.0
134 virginia Congressional District 6 11.6 184 Colorado Congressional District 6 13.0
135 Minnesota Congressional District 2 11.6 185 Florida Congressional District 8 13.0
136 Texas Congressional District 31 11.7 186 Colorado Congressional District 3 13.0
137 Rhode Island Congressional District 2 11.7 187 Washington Congressional District 1 13.0
138 California Congressional District 28 11.8 188 Texas Congressional District 6 13.0
139 Wyoming Congressional District (at Large) 11.8 189 Tennessee Congressional District 5 13.0
140 Wisconsin Congressional District 1 11.8 190 virginia Congressional District 9 13.1
141 New York Congressional District 6 11.9 191 California Congressional District 53 13.1
142 Maine Congressional District 2 11.9 192 Rhode Island Congressional District 1 13.1
143 virginia Congressional District 7 11.9 193 Oregon Congressional District 4 13.1
144 New York Congressional District 26 11.9 194 virginia Congressional District 5 13.1
145 Illinois Congressional District 3 11.9 195 Utah Congressional District 2 13.1
146 Wisconsin Congressional District 7 11.9 196 Georgia Congressional District 11 13.1
147 Massachusetts Congressional District 3 12.0 197 Michigan Congressional District 2 13.2
148 Tennessee Congressional District 7 12.0 198 Michigan Congressional District 10 13.2
149 Ohio Congressional District 10 12.1 199 Missouri Congressional District 3 13.2
150 Georgia Congressional District 7 12.2 200 Michigan Congressional District 7 13.2

ZERoIng In on PLACE And RACE | Youth Disconnection in America’s Cities 26
Youth Disconnection by Congressional District (continued)
RAnK CongRESSIonAL dIStRICtdISConnECtEd yoUth
(% ages 16–24) RAnK CongRESSIonAL dIStRICtdISConnECtEd yoUth
(% ages 16–24)
United States 13.8 United States 13.8
201 Colorado Congressional District 1 13.2 251 Maryland Congressional District 7 14.3
202 Florida Congressional District 21 13.2 252 Michigan Congressional District 6 14.3
203 Texas Congressional District 19 13.3 253 Missouri Congressional District 5 14.3
204 Pennsylvania Congressional District 11 13.3 254 Pennsylvania Congressional District 16 14.4
205 Illinois Congressional District 17 13.4 255 Illinois Congressional District 16 14.4
206 Michigan Congressional District 4 13.4 256 Texas Congressional District 1 14.4
207 North Carolina Congressional District 5 13.4 257 Florida Congressional District 18 14.4
208 Florida Congressional District 23 13.4 258 Texas Congressional District 16 14.4
209 Florida Congressional District 15 13.4 259 Florida Congressional District 2 14.4
210 Florida Congressional District 9 13.4 260 California Congressional District 7 14.5
211 Pennsylvania Congressional District 9 13.4 261 Wisconsin Congressional District 4 14.5
212 Florida Congressional District 26 13.5 262 Florida Congressional District 14 14.5
213 Alabama Congressional District 6 13.5 263 New York Congressional District 19 14.6
214 California Congressional District 29 13.5 264 California Congressional District 4 14.6
215 Texas Congressional District 13 13.5 265 Texas Congressional District 9 14.6
216 Colorado Congressional District 4 13.5 266 Arizona Congressional District 2 14.6
217 Texas Congressional District 2 13.5 267 North Carolina Congressional District 11 14.6
218 Pennsylvania Congressional District 15 13.6 268 Florida Congressional District 12 14.6
219 California Congressional District 20 13.6 269 Maryland Congressional District 4 14.6
220 New York Congressional District 25 13.7 270 Alabama Congressional District 3 14.7
221 Texas Congressional District 12 13.7 271 Florida Congressional District 22 14.7
222 California Congressional District 11 13.7 272 New Jersey Congressional District 1 14.7
223 North Carolina Congressional District 12 13.8 273 Oklahoma Congressional District 3 14.7
224 Ohio Congressional District 15 13.8 274 Florida Congressional District 19 14.7
225 Georgia Congressional District 10 13.8 275 Tennessee Congressional District 2 14.7
226 Idaho Congressional District 2 13.8 276 Washington Congressional District 10 14.8
227 Florida Congressional District 27 13.8 277 Arkansas Congressional District 2 14.8
228 Tennessee Congressional District 4 13.8 278 Georgia Congressional District 5 14.8
229 South Carolina Congressional District 1 13.8 279 Kentucky Congressional District 2 14.8
230 South Carolina Congressional District 4 13.9 280 Nevada Congressional District 2 14.8
231 Ohio Congressional District 4 13.9 281 Oregon Congressional District 1 14.8
232 North Carolina Congressional District 3 13.9 282 California Congressional District 41 14.8
233 Connecticut Congressional District 1 14.0 283 California Congressional District 46 15.1
234 Texas Congressional District 20 14.0 284 Pennsylvania Congressional District 4 15.1
235 Arizona Congressional District 6 14.0 285 Indiana Congressional District 1 15.1
236 South Carolina Congressional District 2 14.0 286 New York Congressional District 11 15.2
237 Texas Congressional District 7 14.0 287 Oregon Congressional District 3 15.2
238 California Congressional District 34 14.0 288 Indiana Congressional District 6 15.2
239 Indiana Congressional District 3 14.0 289 Oregon Congressional District 5 15.2
240 New York Congressional District 22 14.1 290 Texas Congressional District 25 15.4
241 Texas Congressional District 27 14.1 291 Florida Congressional District 1 15.4
242 California Congressional District 35 14.1 292 Delaware Congressional District (at Large) 15.4
243 Oklahoma Congressional District 4 14.1 293 Illinois Congressional District 15 15.4
244 North Carolina Congressional District 6 14.1 294 Kentucky Congressional District 4 15.4
245 Washington Congressional District 5 14.2 295 Massachusetts Congressional District 1 15.6
246 Ohio Congressional District 6 14.2 296 California Congressional District 9 15.6
247 Washington Congressional District 9 14.2 297 New Jersey Congressional District 2 15.6
248 Alaska Congressional District (at Large) 14.2 298 California Congressional District 51 15.7
249 California Congressional District 42 14.2 299 Oklahoma Congressional District 5 15.7
250 Massachusetts Congressional District 9 14.3 300 Florida Congressional District 4 15.7

ZERoIng In on PLACE And RACE | Youth Disconnection in America’s Cities 27
Youth Disconnection by Congressional District (continued)
RAnK CongRESSIonAL dIStRICtdISConnECtEd yoUth
(% ages 16–24) RAnK CongRESSIonAL dIStRICtdISConnECtEd yoUth
(% ages 16–24)
United States 13.8 United States 13.8
301 New Mexico Congressional District 1 15.7 351 Florida Congressional District 10 17.3
302 South Carolina Congressional District 5 15.8 352 California Congressional District 2 17.3
303 Texas Congressional District 35 15.8 353 Louisiana Congressional District 1 17.4
304 Pennsylvania Congressional District 10 15.8 354 Ohio Congressional District 11 17.5
305 New Jersey Congressional District 10 15.9 355 Georgia Congressional District 2 17.6
306 Georgia Congressional District 14 16.0 356 Tennessee Congressional District 6 17.6
307 New York Congressional District 5 16.0 357 Illinois Congressional District 2 17.7
308 Missouri Congressional District 1 16.0 358 New Mexico Congressional District 3 17.7
309 Florida Congressional District 3 16.0 359 Texas Congressional District 36 17.7
310 North Carolina Congressional District 2 16.1 360 California Congressional District 22 17.8
311 California Congressional District 43 16.1 361 Louisiana Congressional District 6 17.8
312 Mississippi Congressional District 1 16.1 362 Pennsylvania Congressional District 2 17.9
313 Oregon Congressional District 2 16.1 363 virginia Congressional District 4 17.9
314 Arizona Congressional District 8 16.1 364 North Carolina Congressional District 7 17.9
315 New Jersey Congressional District 8 16.1 365 Florida Congressional District 5 17.9
316 Nevada Congressional District 3 16.2 366 North Carolina Congressional District 10 17.9
317 New York Congressional District 7 16.2 367 Texas Congressional District 4 18.0
318 Idaho Congressional District 1 16.2 368 Georgia Congressional District 13 18.1
319 Ohio Congressional District 9 16.2 369 California Congressional District 6 18.1
320 California Congressional District 25 16.2 370 California Congressional District 31 18.1
321 South Carolina Congressional District 6 16.2 371 Tennessee Congressional District 1 18.1
322 South Carolina Congressional District 7 16.2 372 California Congressional District 16 18.1
323 New York Congressional District 21 16.3 373 Tennessee Congressional District 8 18.2
324 Washington Congressional District 6 16.3 374 Alabama Congressional District 4 18.2
325 Kentucky Congressional District 1 16.3 375 Texas Congressional District 8 18.3
326 Texas Congressional District 5 16.3 376 District of Columbia Delegate District (at Large) 18.3
327 Florida Congressional District 25 16.4 377 Texas Congressional District 29 18.3
328 Georgia Congressional District 9 16.4 378 Michigan Congressional District 1 18.4
329 California Congressional District 50 16.4 379 New York Congressional District 8 18.4
330 virginia Congressional District 3 16.5 380 Texas Congressional District 11 18.5
331 Florida Congressional District 13 16.6 381 Mississippi Congressional District 4 18.5
332 Oklahoma Congressional District 1 16.6 382 New York Congressional District 13 18.5
333 Florida Congressional District 20 16.6 383 Texas Congressional District 15 18.8
334 California Congressional District 3 16.6 384 Pennsylvania Congressional District 1 18.9
335 Alabama Congressional District 5 16.7 385 Texas Congressional District 33 18.9
336 South Carolina Congressional District 3 16.7 386 Florida Congressional District 16 18.9
337 Illinois Congressional District 1 16.8 387 California Congressional District 44 18.9
338 Michigan Congressional District 5 16.8 388 Oklahoma Congressional District 2 19.0
339 Texas Congressional District 18 16.8 389 Illinois Congressional District 12 19.1
340 New York Congressional District 14 16.9 390 Illinois Congressional District 7 19.1
341 California Congressional District 10 17.0 391 Louisiana Congressional District 3 19.2
342 North Carolina Congressional District 1 17.1 392 Illinois Congressional District 4 19.2
343 Texas Congressional District 23 17.2 393 Tennessee Congressional District 3 19.3
344 California Congressional District 40 17.2 394 Alabama Congressional District 7 19.4
345 Missouri Congressional District 8 17.2 395 Florida Congressional District 24 19.5
346 New Mexico Congressional District 2 17.2 396 Texas Congressional District 14 19.5
347 Arkansas Congressional District 1 17.2 397 Mississippi Congressional District 2 19.5
348 Florida Congressional District 6 17.3 398 Texas Congressional District 28 19.6
349 Georgia Congressional District 4 17.3 399 Georgia Congressional District 12 19.6
350 Pennsylvania Congressional District 13 17.3 400 Florida Congressional District 11 19.6

ZERoIng In on PLACE And RACE | Youth Disconnection in America’s Cities 28
Youth Disconnection by Congressional District (continued)
RAnK CongRESSIonAL dIStRICtdISConnECtEd yoUth
(% ages 16–24) RAnK CongRESSIonAL dIStRICtdISConnECtEd yoUth
(% ages 16–24)
United States 13.8 United States 13.8
401 Indiana Congressional District 7 19.7 421 Georgia Congressional District 1 21.2
402 Arizona Congressional District 4 19.7 422 North Carolina Congressional District 8 21.5
403 California Congressional District 1 19.8 423 Nevada Congressional District 4 21.6
404 West virginia Congressional District 2 20.0 424 Florida Congressional District 17 21.7
405 Mississippi Congressional District 3 20.1 425 Alabama Congressional District 1 21.8
406 Louisiana Congressional District 4 20.3 426 Kentucky Congressional District 5 22.0
407 Arizona Congressional District 3 20.3 427 California Congressional District 36 22.1
408 Texas Congressional District 30 20.3 428 New York Congressional District 9 22.2
409 Georgia Congressional District 3 20.3 429 Arkansas Congressional District 4 22.3
410 Nevada Congressional District 1 20.4 430 Michigan Congressional District 13 22.4
411 Louisiana Congressional District 2 20.5 431 Tennessee Congressional District 9 22.9
412 Washington Congressional District 4 20.6 432 California Congressional District 8 23.3
413 Georgia Congressional District 8 20.6 433 Louisiana Congressional District 5 23.7
414 California Congressional District 21 20.7 434 Texas Congressional District 34 23.8
415 Washington Congressional District 3 20.7 435 New York Congressional District 15 24.2
416 West virginia Congressional District 3 20.8 436 Arizona Congressional District 7 25.6
417 California Congressional District 23 20.9
418 Alabama Congressional District 2 21.0
419 Arizona Congressional District 1 21.1
420 Michigan Congressional District 14 21.2
Source: Measure of America calculations using US Census Bureau American Community Survey 2013. To access data tables, go to: www.measureofamerica.org/youth-disconnection-2015.

ZERoIng In on PLACE And RACE | Youth Disconnection in America’s Cities 29
Youth Disconnection by Metro Area
RAnK MEtRo AREA
dISConnECtEd yoUth (% ages 16–24)
dISConnECtEd yoUth
(# ages 16–24)
dISConnECtEd yoUth (% ages 16–24)
BLACKS LAtInoS whItES
United States 13.8 5,527,000 21.6 16.3 11.3
1 Omaha–Council Bluffs, NE–IA 7.7 8,945 6.1
2 Bridgeport–Stamford–Norwalk, CT 7.7 8,207 5.5
3 Boston–Cambridge–Newton, MA–NH 8.2 49,229 9.8 17.3 6.8
4 Minneapolis–St. Paul–Bloomington, MN–WI 9.1 41,494 16.6 7.7
5 Ogden–Clearfield, UT 9.1 9,061 8.0
6 Spokane–Spokane valley, WA 9.3 7,247 8.7
7 Worcester, MA–CT 9.3 11,220 7.7
8 Wichita, KS 9.6 8,276 7.3
9 San Jose–Sunnyvale–Santa Clara, CA 9.7 20,242 11.9 6.7
10 Scranton–Wilkes–Barre–Hazleton, PA 9.7 5,887 9.1
11 Oxnard–Thousand Oaks–ventura, CA 9.8 10,853 11.1
12 Syracuse, NY 10.0 11,207 9.8
13 Akron, OH 10.1 9,910 10.2
14 Pittsburgh, PA 10.2 30,575 21.8 9.1
15 Raleigh, NC 10.3 15,621 12.8
16 Des Moines–West Des Moines, IA 10.3 8,194 8.8
17 Albany–Schenectady–Troy, NY 10.4 13,855 10.8
18 San Francisco–Oakland–Hayward, CA 10.4 50,593 19.4 12.2 9.2
19 Toledo, OH 10.7 9,628 7.7
20 Provo–Orem, UT 10.7 14,445 10.7
21 Milwaukee–Waukesha–West Allis, WI 10.7 20,219 19.9
22 Springfield, MA 11.0 7,932 11.7
23 Columbus, OH 11.0 30,403 13.2 10.6
24 Hartford–West Hartford–East Hartford, CT 11.1 16,909 25.0 6.6
25 Baltimore–Columbia–Towson, MD 11.3 39,864 18.4 7.8
26 Grand Rapids–Wyoming, MI 11.3 18,963 9.6
27 Austin–Round Rock, TX 11.5 27,959 17.8 14.4 8.8
28 Urban Honolulu, HI 11.7 14,834
29 Dayton, OH 11.8 12,215 9.7
30 Buffalo–Cheektowaga–Niagara Falls, NY 12.0 17,348 20.3 9.0
31 San Diego–Carlsbad, CA 12.1 54,278 13.7 11.0
32 Salt Lake City, UT 12.2 18,812 14.8 11.1
33 Kansas City, MO–KS 12.3 30,795 22.1 12.3 10.1
34 Colorado Springs, CO 12.3 11,186 12.7
35 Seattle–Tacoma–Bellevue, WA 12.4 50,593 16.8 10.8
36 Washington–Arlington–Alexandria, DC–vA–MD–Wv 12.4 93,663 20.4 10.3 9.7
37 Denver–Aurora–Lakewood, CO 12.5 40,399 16.9 10.4
38 Allentown–Bethlehem–Easton, PA–NJ 12.5 12,034 9.9
39 Chicago–Naperville–Elgin, IL–IN–WI 12.5 147,508 24.5 13.9 7.5
40 Columbia, SC 12.6 14,769 20.6 7.6
41 Los Angeles–Long Beach–Anaheim, CA 12.7 222,396 23.2 14.6 9.0
42 New Haven–Milford, CT 12.8 14,016 24.6 24.2 6.5
43 Nashville–Davidson––Murfreesboro––Franklin, TN 12.8 29,283 17.6 10.4
44 Cincinnati, OH–KY–IN 12.8 38,312 20.6 11.8
45 Providence–Warwick, RI–MA 13.0 28,340 27.2 9.2
46 virginia Beach–Norfolk–Newport News, vA–NC 13.2 35,271 19.4 10.3
47 Rochester, NY 13.4 21,701 30.8 23.0 9.8
48 New York–Newark–Jersey City, NY–NJ–PA 13.5 324,264 21.4 16.4 9.2
49 Dallas–Fort Worth–Arlington, TX 13.6 117,590 21.3 15.9 10.0
50 Orlando–Kissimmee–Sanford, FL 13.6 41,236 22.1 15.5 9.5
Source: Measure of America calculations using US Census Bureau American Community Survey 2013. To access data tables, go to: www.measureofamerica.org/youth-disconnection-2015.
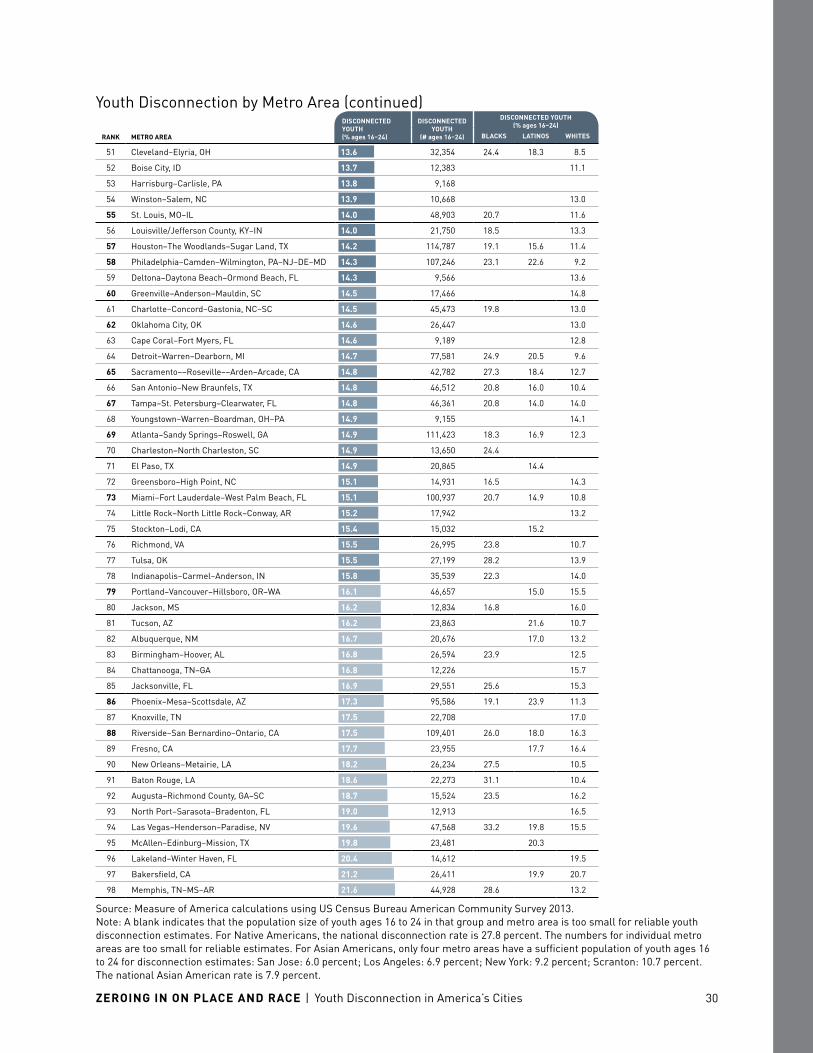
ZERoIng In on PLACE And RACE | Youth Disconnection in America’s Cities 30
Source: Measure of America calculations using US Census Bureau American Community Survey 2013. Note: A blank indicates that the population size of youth ages 16 to 24 in that group and metro area is too small for reliable youth disconnection estimates. For Native Americans, the national disconnection rate is 27.8 percent. The numbers for individual metro areas are too small for reliable estimates. For Asian Americans, only four metro areas have a sufficient population of youth ages 16 to 24 for disconnection estimates: San Jose: 6.0 percent; Los Angeles: 6.9 percent; New York: 9.2 percent; Scranton: 10.7 percent. The national Asian American rate is 7.9 percent.
RAnK MEtRo AREA
dISConnECtEd yoUth (% ages 16–24)
dISConnECtEd yoUth
(# ages 16–24)
dISConnECtEd yoUth (% ages 16–24)
BLACKS LAtInoS whItES
51 Cleveland–Elyria, OH 13.6 32,354 24.4 18.3 8.5
52 Boise City, ID 13.7 12,383 11.1
53 Harrisburg–Carlisle, PA 13.8 9,168
54 Winston–Salem, NC 13.9 10,668 13.0
55 St. Louis, MO–IL 14.0 48,903 20.7 11.6
56 Louisville/Jefferson County, KY–IN 14.0 21,750 18.5 13.3
57 Houston–The Woodlands–Sugar Land, TX 14.2 114,787 19.1 15.6 11.4
58 Philadelphia–Camden–Wilmington, PA–NJ–DE–MD 14.3 107,246 23.1 22.6 9.2
59 Deltona–Daytona Beach–Ormond Beach, FL 14.3 9,566 13.6
60 Greenville–Anderson–Mauldin, SC 14.5 17,466 14.8
61 Charlotte–Concord–Gastonia, NC–SC 14.5 45,473 19.8 13.0
62 Oklahoma City, OK 14.6 26,447 13.0
63 Cape Coral–Fort Myers, FL 14.6 9,189 12.8
64 Detroit–Warren–Dearborn, MI 14.7 77,581 24.9 20.5 9.6
65 Sacramento––Roseville––Arden–Arcade, CA 14.8 42,782 27.3 18.4 12.7
66 San Antonio–New Braunfels, TX 14.8 46,512 20.8 16.0 10.4
67 Tampa–St. Petersburg–Clearwater, FL 14.8 46,361 20.8 14.0 14.0
68 Youngstown–Warren–Boardman, OH–PA 14.9 9,155 14.1
69 Atlanta–Sandy Springs–Roswell, GA 14.9 111,423 18.3 16.9 12.3
70 Charleston–North Charleston, SC 14.9 13,650 24.4
71 El Paso, TX 14.9 20,865 14.4
72 Greensboro–High Point, NC 15.1 14,931 16.5 14.3
73 Miami–Fort Lauderdale–West Palm Beach, FL 15.1 100,937 20.7 14.9 10.8
74 Little Rock–North Little Rock–Conway, AR 15.2 17,942 13.2
75 Stockton–Lodi, CA 15.4 15,032 15.2
76 Richmond, vA 15.5 26,995 23.8 10.7
77 Tulsa, OK 15.5 27,199 28.2 13.9
78 Indianapolis–Carmel–Anderson, IN 15.8 35,539 22.3 14.0
79 Portland–vancouver–Hillsboro, OR–WA 16.1 46,657 15.0 15.5
80 Jackson, MS 16.2 12,834 16.8 16.0
81 Tucson, AZ 16.2 23,863 21.6 10.7
82 Albuquerque, NM 16.7 20,676 17.0 13.2
83 Birmingham–Hoover, AL 16.8 26,594 23.9 12.5
84 Chattanooga, TN–GA 16.8 12,226 15.7
85 Jacksonville, FL 16.9 29,551 25.6 15.3
86 Phoenix–Mesa–Scottsdale, AZ 17.3 95,586 19.1 23.9 11.3
87 Knoxville, TN 17.5 22,708 17.0
88 Riverside–San Bernardino–Ontario, CA 17.5 109,401 26.0 18.0 16.3
89 Fresno, CA 17.7 23,955 17.7 16.4
90 New Orleans–Metairie, LA 18.2 26,234 27.5 10.5
91 Baton Rouge, LA 18.6 22,273 31.1 10.4
92 Augusta–Richmond County, GA–SC 18.7 15,524 23.5 16.2
93 North Port–Sarasota–Bradenton, FL 19.0 12,913 16.5
94 Las vegas–Henderson–Paradise, Nv 19.6 47,568 33.2 19.8 15.5
95 McAllen–Edinburg–Mission, TX 19.8 23,481 20.3
96 Lakeland–Winter Haven, FL 20.4 14,612 19.5
97 Bakersfield, CA 21.2 26,411 19.9 20.7
98 Memphis, TN–MS–AR 21.6 44,928 28.6 13.2
Youth Disconnection by Metro Area (continued)

ZERoIng In on PLACE And RACE | Youth Disconnection in America’s Cities 31
Youth Disconnection by County: Seventy Least Disconnected Counties
RAnK CoUntydISConnECtEd yoUth
(% ages 16–24) RAnK CoUntydISConnECtEd yoUth
(% ages 16–24)
United States 13.8 United States 13.8
1 Logan County, North Dakota 0.0 23 Dunn County, Wisconsin 5.0
1 Cheyenne County, Kansas 0.0 24 Benton County, Oregon 5.0
1 Deuel County, Nebraska 0.0 25 Charlottesville city, virginia 5.0
1 Greeley County, Kansas 0.0 26 St. Croix County, Wisconsin 5.0
1 Garfield County, Montana 0.0 27 Brazos County, Texas 5.1
1 McCone County, Montana 0.0 28 Stearns County, Minnesota 5.1
1 Treasure County, Montana 0.0 29 Washtenaw County, Michigan 5.1
1 Garfield County, Nebraska 0.0 30 Tippecanoe County, Indiana 5.1
1 Grant County, Nebraska 0.0 31 Madison County, Idaho 5.3
1 Wheeler County, Nebraska 0.0 32 Carver County, Minnesota 5.3
1 Oliver County, North Dakota 0.0 33 Athens County, Ohio 5.3
1 Slope County, North Dakota 0.0 34 Buffalo County, Nebraska 5.4
1 Campbell County, South Dakota 0.0 35 McLean County, Illinois 5.4
1 Story County, Iowa 2.3 36 Dane County, Wisconsin 5.4
2 Potter County, South Dakota 2.4 37 Boulder County, Colorado 5.4
3 Montgomery County, virginia 2.4 38 Oktibbeha County, Mississippi 5.5
4 Hampshire County, Massachusetts 3.1 39 Isabella County, Michigan 5.6
5 Douglas County, Kansas 3.2 40 Ozaukee County, Wisconsin 5.6
6 Riley County, Kansas 3.3 41 Payne County, Oklahoma 5.6
7 McDonough County, Illinois 3.5 42 Cass County, North Dakota 5.7
8 Pierce County, Wisconsin 3.6 43 Boone County, Missouri 5.7
9 Champaign County, Illinois 3.8 44 Lancaster County, Nebraska 5.9
10 Harrisonburg city, virginia 3.9 45 Portage County, Wisconsin 5.9
11 Johnson County, Iowa 4.0 46 Bristol County, Rhode Island 5.9
12 Tompkins County, New York 4.0 47 Burleigh County, North Dakota 5.9
13 Blue Earth County, Minnesota 4.1 48 Greene County, Ohio 5.9
14 Monroe County, Indiana 4.1 49 Clarke County, Georgia 5.9
15 Centre County, Pennsylvania 4.2 50 Coles County, Illinois 6.0
16 Wood County, Ohio 4.2 51 Lafayette County, Mississippi 6.1
17 Grand Forks County, North Dakota 4.3 52 Tolland County, Connecticut 6.1
18 Orange County, North Carolina 4.4 53 Cheshire County, New Hampshire 6.2
19 Latah County, Idaho 4.4 54 Waukesha County, Wisconsin 6.2
20 La Crosse County, Wisconsin 4.4 55 Leon County, Florida 6.3
21 Chittenden County, vermont 4.7 56 DeKalb County, Illinois 6.3
22 Washington County, Rhode Island 4.9 57 Cache County, Utah 6.4
Source: Custom tabulations provided by special arrangement with the US Census Bureau and Opportunity Nation for 2008–2012. Note: Estimates are available for 2,034 of the 3,143 US counties and county equivalents due to the small population size of 16–24 year olds in the remaining counties. For all county-level estimates, go to: www.measureofamerica.org/youth-disconnection-2015.

ZERoIng In on PLACE And RACE | Youth Disconnection in America’s Cities 32
Youth Disconnection by County: Seventy Most Disconnected Counties
RAnK CoUntydISConnECtEd yoUth
(% ages 16–24) RAnK CoUntydISConnECtEd yoUth
(% ages 16–24)
United States 13.8 United States 13.8
1,965 Wade Hampton Census Area, Alaska 37.0 2,000 Todd County, South Dakota 41.7
1,966 Lee County, Arkansas 37.0 2,001 Telfair County, Georgia 41.8
1,967 Choctaw County, Alabama 37.0 2,002 Sierra County, New Mexico 41.9
1,968 Chicot County, Arkansas 37.1 2,003 Dawson County, Texas 42.4
1,969 Winn Parish, Louisiana 37.3 2,004 Forest County, Pennsylvania 42.5
1,970 Jack County, Texas 37.3 2,005 Reynolds County, Missouri 42.9
1,971 Caldwell County, Texas 37.5 2,006 Northwest Arctic Borough, Alaska 42.9
1,972 Wolfe County, Kentucky 37.5 2,007 Dodge County, Georgia 43.0
1,973 Phillips County, Arkansas 37.6 2,008 Catahoula Parish, Louisiana 43.3
1,974 Dillon County, South Carolina 37.6 2,009 McDowell County, West virginia 43.5
1,975 Bent County, Colorado 37.6 2,010 Noble County, Ohio 43.5
1,976 Greene County, Mississippi 37.7 2,011 Karnes County, Texas 43.7
1,977 Roosevelt County, Montana 38.0 2,012 Union County, Kentucky 43.7
1,978 Yukon-Koyukuk Census Area, Alaska 38.0 2,013 Menominee County, Wisconsin 44.7
1,979 Shannon County, South Dakota 38.0 2,014 Lincoln County, Arkansas 45.1
1,980 Greene County, New York 38.1 2,015 Emporia city, virginia 45.8
1,981 Wilcox County, Alabama 38.1 2,016 East Carroll Parish, Louisiana 45.9
1,982 Buckingham County, virginia 38.3 2,017 Jones County, Texas 46.4
1,983 Beckham County, Oklahoma 38.3 2,018 Sabine County, Texas 47.2
1,984 Jefferson County, Georgia 38.5 2,019 Allendale County, South Carolina 47.4
1,985 Morgan County, Kentucky 38.7 2,020 Martin County, Kentucky 47.8
1,986 Tallahatchie County, Mississippi 38.8 2,021 Wilcox County, Georgia 48.4
1,987 Madison Parish, Louisiana 38.8 2,022 Wilkinson County, Mississippi 48.4
1,988 van Buren County, Arkansas 39.4 2,023 Haskell County, Texas 48.9
1,989 Crowley County, Colorado 39.5 2,024 Lassen County, California 48.9
1,990 Hardeman County, Tennessee 40.3 2,025 Childress County, Texas 51.4
1,991 Greensville County, virginia 40.4 2,026 Lafayette County, Florida 51.4
1,992 McCreary County, Kentucky 40.4 2,027 Lawrence County, Illinois 52.0
1,993 Gilchrist County, Florida 40.8 2,028 Clay County, Georgia 53.5
1,994 Lee County, Kentucky 40.9 2,029 Hamilton County, Florida 53.7
1,995 Calhoun County, Florida 41.0 2,030 Rolette County, North Dakota 55.0
1,996 Corson County, South Dakota 41.1 2,031 Issaquena County, Mississippi 55.8
1,997 Mitchell County, Texas 41.4 2,032 Lake County, Tennessee 56.1
1,998 Bracken County, Kentucky 41.4 2,033 Hancock County, Georgia 56.8
1,999 Lincoln County, West virginia 41.6 2,034 Wheeler County, Georgia 82.0
To access data tables, go to: www.measureofamerica.org/youth-disconnection-2015.


