Zephyr Textiles Limitedzephyr.com.pk/wp-content/uploads/2016/11/final2016.pdfLahore: Abdul Jabbar...
57
Zephyr Textiles Limited ANNUAL REPORT 2016
-
Upload
truongdien -
Category
Documents
-
view
213 -
download
0
Transcript of Zephyr Textiles Limitedzephyr.com.pk/wp-content/uploads/2016/11/final2016.pdfLahore: Abdul Jabbar...
Zephyr Textiles LimitedA N N U A L R E P O R T 2 0 1 6

02Zephyr Textiles Limited
03.
04.
05.
08.
09.
10.
11.
12.
14.
15.
17.
Company Information
Notice of Annual General Meeting
Directors' Report
Horizontal Analysis
Vertical Analysis
Statement of Value Addition
Financial Highlights.
Pattern of Holding of the Shares
Graphical Representation
DuPont Analysis
Statement of Compliance with the Code of Corporate Governance
Review Report to the Members on Statement of Compliance with Best Practices of Code of Corporate Governance
Auditors' Report to the Members
Balance Sheet
Profit and Loss Account
Statement of Comprehensive Income
Cash Flow Statement
Statement of Changes in Equity
Note to the Financial Statements
Proxy Form
19.
20.
21.
22.
23.
24.
25.
26.
57.
Contents

Com
pany
Info
rmat
ion
Note: Zephyr’s Company Information & Financial Statements are also available at the above website.
Mr. Mussaid HanifMr. Burhan Muhammad KhanMr. Arbab Muhammad KhanMs. Tehniyat MussaidMs. Sabah BurhanMs. Sarah MussaidMs. Nuzhat Kamran
Ms. Tehniyat MussaidMr. Arbab Muhammad KhanMs. Sabah Burhan
Mr. Naveed Aleem
Mr. Abdul Jabbar
Azhar Zafar & Company
Cornelius Lane & MuftiAdvocate and SolicitorsNawa-e-Waqt House, 4 Shahrah-e-Fatima Jinnah,Lahore - 54000, Pakistan
Habib Bank LimitedAllied Bank LimitedAskari Bank LimitedUnited Bank LimitedHabib Metropolitan Bank LimitedBank Al Habib Limited
1 km, Balloki Bhai Pheru RoadBhai Pheru.Phone : 0494 - 512007-9, 513103-5Fax : 0494 - 51201163 km, Gulshan Adda,Jumber Khurd, District Kasur.
3rd Floor, IEP Building,97 B/D-I, Gulberg III, Lahore.E-mail: [email protected]: www.zephyr.com.pk
Phone : 042 35782905 - 15Fax : 042 35753202
BOARD OF DIRECTORS:
AUDIT COMMITTEE:
CHIEF FINANCIAL OFFICER:
COMPANY SECRETARY:
AUDITORS:
LEGAL ADVISOR:
BANKERS TO THE COMPANY
MILLS:
REGISTERED & HEAD OFFICE:
CEO
Chairperson/MemberMemberMember
Chartered Accountants
National Bank of PakistanNIB Bank LimitedThe Bank Of PunjabFaysal Bank LimitedMeezan Bank LimitedSilk Bank Limited
(Weaving unit & Power plant)
(Towel Unit)
03 Annual Report 2016

Lahore: Abdul JabbarOctober 07, 2016 Company Secretary
By Order of the Board
Notice is hereby given that the 18th Annual General Meeting of the shareholders of Zephyr Textiles Limited will be held at the Registered Office of the Company, 3rd Floor IEP Building, 97 B/D-I, Gulberg III, Lahore on Monday, October 31, 2016, at 10:30 AM to transact the following business:
• To confirm the minutes of the last Annual General Meeting dated October 31, 2015.• To receive, consider and adopt the audited accounts of the company for the year ended June 30, 2016
together with the Directors' and Auditor's report thereon.
• To appoint auditors for the year ending June 30, 2017 and to fix their remuneration. The present Auditors M/S Azhar Zafar & Company, Chartered Accountants, retire and being eligible offer themselves for reappointment.
• To transact any other business with the permission of the Chair.
NOTES:
• BOOK CLOSURE NOTICE: Share transfer books of the company will remain closed from October 24, 2016 to October 31, 2016 (both
days inclusive) and no transfer will be accepted during this period.
• A Shareholder entitled to attend and vote at this meeting may appoint another shareholder as his/her proxy to attend and vote as his/her proxy to attend and vote on his/her behalf. The instrument appointing a proxy and the power of attorney or other authority under which it is signed or a notarially certified copy of the power of attorney must be received at the registered office of the company, duly stamped, signed and witnessed not later than 48 hours before the meeting.
• Shareholders whose shares are deposited with Central Depository Company (CDC) are requested to bring their Computerized National Identity Card (CNIC) along with their Account Number in CDC for verification. In case of corporate entity, the Board of Directors resolution/power of attorney with specimen signatures of the nominee shall be produced (unless it has been provided earlier) at the time of meeting.
• In case of proxy for and individual beneficial owner of CDC attested copies of beneficial owner's CNIC or passport, account and participants ID numbers must be deposited along with the form of proxy. Representatives of corporate members should bring the usual documents required for such purpose.
• Shareholders are requested to notify any change in their addresses immediately.
04Zephyr Textiles Limited
Notice of Annual G
eneral Meeting

Financial highlights
2016RUPESS
Net sales
Gross Profit
EBITDA
Depreciation
Finance Cost
Pre-tax profit
After tax profit
EPS
3,932,856,870
397,214,552
283,261,357
150,931,686
126,333,632
132,329,671
107,034,539
1.80
3,756,906,768
327,863,609
380,971,500
155,458,285
166,340,523
225,513,201
203,066,728
3.42
04
The directors of the Company are pleased to present the audited financial statements for the year ended June 30, 2016. These financial statements are presented in accordance with the requirements of the Companies Ordinance, 1984.
Operating and Financial ResultsFinancial Review
Net sales increased by 4.68% and gross profit increased by 21.15% as compared to the corresponding last year. The increase in gross profit is much greater than sales revenue because of additional export sales of value added products this year. Export sales increased by 25.93% as compared to corresponding period and recorded at Rs. 1.4 billion as compared to Rs.1.1 billion last year. Finance cost reduced by 24.05% in the period under review as compare to the corresponding period ended June, 2015.
Towel export business have seen significant improvement during the year under review. Lower yarn prices helped in achieving better margin and increased sales. We have plans in place to continue the emphasis on the sales of value added goods going forward.
Although, the government managed to provide LNG to the industry in absence of electricity and natural gas but the cost of LNG is detrimentally high which mitigated the profitability.
Textile Industry Overview
The textile sector has a crucial role in the economy of Pakistan. The industry had a hope that the grant of GSP Plus status from European Union will boost the export performance of the country. However, overall export performance of the country has shown dismal performance and the trend is continuing. Expensive power, excessive taxation and overvalued exchange rate has eroded our competiveness during last few years.
In today’s highly competitive global environment, the textile sector needs to upgrade its supply chain, improve productivity, and maximize value-addition to be able to survive. This sector needs cheap and subsidized credit facilities, uninterrupted supply of gas and electricity at low rates, consistent and industry friendly tax policies to create growth.
The government has announced a scheme of Long Term Financing Facility (LTFF) to kick start the investment for the replacement of dated plants and equipment and addition of new facilities. Hopefully it will bear results in coming years.
05 Annual Report 2016
Dire
ctor
s’ R
epor
t
During the financial year ended June 30, 2016, the Company earned a gross profit of Rs.397.215 million on sales of Rs.3,933 million as compared to gross profit of Rs.327.864 million on sales of Rs.3,757 million in the previ-ous year 2014-2015. The Company recorded net profit of Rs.107.035 million as compared to Rs.203.067 million in the corresponding period. The decline in net profit after increased gross profit is due to mark up waiver and notional income incorporated as per IAS:39 due to restructuring with The Bank of Punjab in the previous year.
2016RUPESS

05
Future arrangement
To enhance the sales of value added products, the company has initiated investment plan of Rs.390 Million out of which Rs.300 Million is being financed by Bank of Punjab. The financing arrangement is based on concessionary interest rate fixed at 5% to be repaid in five years (LTFF). The investment in terry production will increase our dyeing and weaving capacity to 450 Tons per day. The process of replacement of old fabric weaving machines has started. In the first phase 16 machines will be shipped by Feb 2017. With the induction of new technology productivity will increase and labour and power cost will reduce. This new project of enhanced capacity will hopefully start commercial production in May, 2017.
Working capital management
Company’s current ratio remained stable at 1.25 in the current year as compared to 1.26 in preceding period. The Company reduced the burden of long term finances by Rs.117.72 million along with finance cost of RS. 116.58 million during the period under review. Further, the Company is continuously striving to improve further its working capital cycle by better management of receivable and inventory.
Capital structure
Leverage of the Company recorded further improvement from 1.16 last year to 1.11 as at June 30, 2016. The management of the Company is committed to increase share holders’ wealth with its proactive approach.
Corporate matters
Dividend
Owing to significant expansion in production facility of the Company, the directors have regrettably decided to omit dividend this year.
Directors’ training program
Three directors of the Company completed the Directors Training Program this year as per new CCG compliance. Two directors have exemptions while the remaining two will be completing this program in current year.
Compliance of corporate and financial reporting frameworkWe are committed to good corporate governance and do comply with the requirements of Code of Corporate Governance included in the listing regulations of Pakistan Stock Exchanges (PSX). The statement of compliance with the CCG is also enclosed.
Board committees
Audit committee
The audit committee is performing its duties in line with its terms of reference as determined by the Board of Direc-tors. Composition of the committee is as follows:
Ms. Tehniyat Mussaid Chairperson/MemberMs. Sabah Burhan Member Mr. Arbab Muhammad Khan Member
06Zephyr Textiles Limited

04
Human resource & remuneration committee
The Human Resource & Remuneration Committee is performing its duties in line with its terms of reference as determined by the Board of Directors. Composition of the Committee is as follows:
Mr. Burhan Muhammad Khan Chairman/MemberMs. Nuzhat Kamran MemberMs. Sarah Mussaid Member
Meetings of the Board of Directors
During the year under review, four meetings of the Board of Directors of the Company were held and the atten-dance position is as follows:
Directors’ Statement
In compliance of the Code of Corporate Governance, we give below statements on Corporate and Financial report-ing framework:
1. The financial statements, prepared by the management of the Company, present fairly its state of affairs, the result of its operations, cash flows and changes in equity.
2. Proper books of account of the Company have been maintained. 3. Appropriate accounting policies have been consistently applied in preparation of the financial statements and
accounting estimates are based on reasonable and prudent judgment. 4. International Financial Reporting Standards, as applicable in Pakistan, have been followed in preparation of
financial statements and any departure there from has been adequately disclosed. 5. The system of internal control is sound in design and has been effectively implemented and monitored. 6. There are no significant doubts upon the Company’s ability to continue as a going concern. 7. There has been no material departure from the best practices of corporate governance, as detailed in the
listing regulations.
Auditors
The present auditors of the Company M/s Azhar Zafar & Company, Chartered Accountants have completed the annual audit for the year ended June 30, 2016, and have issued an unqualified audit report. The existing auditors will retire on conclusion of the Annual General Meeting of the Company, and being eligible; have offered them-selves for reappointment for the year ending June 30, 2017.
The Board has recommended the appointment of M/s Azhar Zafar & Company, Chartered Accountants as auditors for the next year according to the recommendation of Audit Committee, subject to approval of the share-holders in the AGM.
For and on behalf of the Board of Directors
Lahore Mussaid HanifSeptember 21, 2016 Chief Executive
1.2.3.4.5.6.7.
4444442
Mr. Mussaid HanifMr. Burhan Muhammad KhanMr. Arbab Muhammad KhanMs. Nuzhat KamranMs. Tehniyat MussaidMs. Sabah BurhanMs. Sarah Mussaid
Sr. No. Name of directors No. of meetings attended
07 Annual Report 2016

(Rupees in million)
Year 2015 Year 2014Amount Rs. % Amount Rs. %
Horizontal Analysis2016
Variance vsLastYear
Increase/(Decrease)
2015
Variance vsLastYear
Increase/(Decrease)
2014
Variance vsLastYear
Increase/(Decrease)
2013
Variance vsLastYear
Increase/(Decrease)
2012
OPERATING RESULTS
Sales - net 3,932.86 4.68 3,756.91 (10.53) 4,199.16 9.33 3,840.91 22.49 3,135.63
Cost of sales 3,535.64 3.11 3,429.04 (9.61) 3,793.81 8.97 3,481.67 23.48 2,819.59
Gross Profit 397.21 21.15 327.86 (19.12) 405.35 12.84 359.23 13.67 316.04
Distribution cost 73.89 (4.95) 77.74 1.42 76.65 (3.08) 79.08 10.51 71.56
Administrative expenses 63.49 11.29 57.05 9.33 52.18 (16.54) 62.52 19.17 52.47
Other operating expenses 11.94 201.83 3.96 (41.83) 6.80 22.36 5.56 58.15 3.52
Financial cost 126.33 (24.05) 166.34 (13.86) 193.11 (18.41) 236.68 20.71 196.08
Other operating income 10.77 (94.69) 202.73 1,554.96 12.25 (91.69) 147.40 243.08 42.96
Profit/(Loss) before taxation 132.33 (41.32) 225.51 153.81 88.85 (27.64) 122.78 247.03 35.38
Provision for taxation 25.30 12.69 22.45 (11.61) 25.40 197.95 8.52 (58.32) 20.45
PROFIT/(LOSS) FOR THE YEAR 107.03 (47.29) 203.07 220.04 63.45 (44.47) 114.26 665.36 14.93
BALANCE SHEET
NON-CURRENT ASSETS
Property, plant and equipment 1,797.52 (2.11) 1,836.22 (4.72) 1,927.08 (4.29) 2,013.55 15.21 1,747.74
Capital work in progress - (100.00) 10.86 - - (100.00) 58.84 - -
Long term deposits 7.82 (0.64) 7.87 0.03 7.87 138.54 3.30 9.97 3.00
TOTAL NON-CURRENT ASSETS 1,805.34 (2.67) 1,854.96 (4.13) 1,934.95 (6.78) 2,075.68 18.56 1,750.75
CURRENT ASSETS
Stores, spare parts and loose tools 112.26 3.57 108.39 0.61 107.73 2.50 105.10 10.54 95.08
Stock in trade 775.09 8.42 714.91 (2.34) 732.05 9.24 670.16 (7.10) 721.38
Trade debts 446.75 19.88 372.66 10.16 338.29 2.72 329.32 32.89 247.81
Loans and advances 35.36 (14.01) 41.12 46.33 28.10 (35.58) 43.62 22.62 35.58
Trade deposits and short term prepayments 150.68 32.73 113.52 (8.90) 124.62 24.40 100.18 44.19 69.47
Other receivables 27.09 29.76 20.88 40.68 14.84 16.19 12.77 (22.71) 16.52
Investments 1.60 4.73 1.53 (85.65) 10.64 (73.61) 40.31 (29.63) 57.28
Cash and bank balances 64.79 74.26 37.18 (53.95) 80.73 87.89 42.97 262.81 11.84
TOTAL CURRENT ASSETS 1,613.61 14.43 1,410.18 (1.87) 1,437.00 6.89 1,344.43 7.13 1,254.97
TOTAL ASSETS 3,418.94 4.71 3,265.14 (3.17) 3,371.95 (1.41) 3,420.12 13.79 3,005.72
CURRENT LIABILITIES
Trade and other payables 387.54 8.76 356.31 17.86 302.33 8.23 279.34 28.55 217.29
Accrued mark-up 14.32 213.83 4.56 (98.13) 243.93 22.15 199.70 (4.57) 209.27
Short term borrowings 710.42 17.44 604.90 (36.62) 954.37 (0.98) 963.81 (7.01) 1,036.48
Current portion of long term financing 176.35 16.34 151.59 (57.54) 357.02 (9.29) 393.57 (41.61) 674.06
TOATL CURRENT LIABILITIES 1,288.63 15.33 1,117.36 (39.85) 1,857.64 1.16 1,836.42 (14.07) 2,137.10
WORKING CAPITAL 324.98 10.98 292.82 (169.61) (420.64) (14.50) (491.98) (44.23) (882.13)
TOTAL CAPITAL EMPLOYED 2,130.31 (0.81) 2,147.78 41.83 1,514.31 (4.38) 1,583.70 82.32 868.62
NON-CURRENT LIABILITIES
Long term financing 570.45 (15.72) 676.85 240.54 198.76 (38.40) 322.64 335.09 74.16
Liabilities against assets subject to finance lease - - - - - - - - -
Deferred liabilities 231.62 (0.41) 232.58 (1.52) 236.18 (4.34) 246.90 96.17 125.86
TOTAL NON-CURRENT LIABILITIES 802.07 (11.81) 909.43 109.09 434.94 (23.63) 569.54 184.75 200.02
NET WORTH 1,328.25 7.26 1,238.35 14.73 1,079.37 6.43 1,014.16 51.68 668.60
NET WORTH REPRESENTED BY
Issued, subscribed and paid-up capital 594.29 - 594.29 - 594.29 - 594.29 - 594.29
Accumulated Profit / (Loss) 369.71 45.96 253.30 286.65 65.51 (309.03) (31.34) (81.07) (165.55)
Surplus on revaluation of property, plant and equipment 364.25 (6.79) 390.76 (6.87) 419.57 (7.01) 451.22 88.11 239.87
1,328.25 7.26 1,238.35 14.73 1,079.37 6.43 1,014.16 51.68 668.60
TOTAL LIABILITIES 3,418.94 4.71 3,265.14 (3.17) 3,371.95 (1.41) 3,420.12 13.79 3,005.72
Directors’ Statement
In compliance of the Code of Corporate Governance, we give below statements on Corporate and Financial report-ing framework:
1. The financial statements, prepared by the management of the Company, present fairly its state of affairs, the result of its operations, cash flows and changes in equity.
2. Proper books of account of the Company have been maintained. 3. Appropriate accounting policies have been consistently applied in preparation of the financial statements and
accounting estimates are based on reasonable and prudent judgment. 4. International Financial Reporting Standards, as applicable in Pakistan, have been followed in preparation of
financial statements and any departure there from has been adequately disclosed. 5. The system of internal control is sound in design and has been effectively implemented and monitored. 6. There are no significant doubts upon the Company’s ability to continue as a going concern. 7. There has been no material departure from the best practices of corporate governance, as detailed in the
listing regulations.
Auditors
The present auditors of the Company M/s Azhar Zafar & Company, Chartered Accountants have completed the annual audit for the year ended June 30, 2016, and have issued an unqualified audit report. The existing auditors will retire on conclusion of the Annual General Meeting of the Company, and being eligible; have offered them-selves for reappointment for the year ending June 30, 2017.
The Board has recommended the appointment of M/s Azhar Zafar & Company, Chartered Accountants as auditors for the next year according to the recommendation of Audit Committee, subject to approval of the share-holders in the AGM.
For and on behalf of the Board of Directors
Lahore Mussaid HanifSeptember 21, 2016 Chief Executive
08Zephyr Textiles Limited

09 Annual Report 2016
(Rupees in million)
Year 2015 Year 2014Amount Rs. % Amount Rs. %
Vertical Analysis2016 % of Total
Value2015 % of Total
Value2014 % of Total
Value2013 % of Total
Value2012
OPERATING RESULTS
Sales - net 3,932.86 100.00 3,756.91 100.00 4,199.16 100.00 3,840.91 100.00 3,135.63
Cost of sales 3,535.64 89.90 3,429.04 91.27 3,793.81 90.35 3,481.67 90.65 2,819.59
Gross Profit 397.21 10.10 327.86 8.73 405.35 9.65 359.23 9.35 316.04
Distribution cost 73.89 1.88 77.74 2.07 76.65 1.83 79.08 2.06 71.56
Administrative expenses 63.49 1.61 57.05 1.52 52.18 1.24 62.52 1.63 52.47
Other operating expenses 11.94 0.30 3.96 0.11 6.80 0.16 5.56 0.14 3.52
Financial cost 126.33 3.21 166.34 4.43 193.11 4.60 236.68 6.16 196.08
Other operating income 10.77 0.27 202.73 5.40 12.25 0.29 147.40 3.84 42.96
Profit/(Loss) before taxation 132.33 3.36 225.51 6.00 88.85 2.12 122.78 2.12 35.38
Provision for taxation 25.30 0.64 22.45 0.60 25.40 0.60 8.52 0.60 20.45
PROFIT/(LOSS) FOR THE YEAR 107.03 2.72 203.07 5.41 63.45 1.51 114.26 1.51 14.93
BALANCE SHEET
NON-CURRENT ASSETS
Property, plant and equipment 1,797.52 52.58 1,836.22 56.24 1,927.08 57.15 2,013.55 57.15 1,747.74
Capital work in progress - - 10.86 0.33 - - 58.84 - -
Long term deposits 7.82 0.23 7.87 0.24 7.87 0.23 3.30 0.23 3.00
TOTAL NON-CURRENT ASSETS 1,805.34 52.80 1,854.96 56.81 1,934.95 57.38 2,075.68 57.38 1,750.75
CURRENT ASSETS
Stores, spare parts and loose tools 112.26 3.28 108.39 3.32 107.73 3.19 105.10 3.19 95.08
Stock in trade 775.09 22.67 714.91 21.90 732.05 21.71 670.16 21.71 721.38
Trade debts 446.75 13.07 372.66 11.41 338.29 10.03 329.32 10.03 247.81
Loans and advances 35.36 1.03 41.12 1.26 28.10 0.83 43.62 0.83 35.58
Trade deposits and short term prepayments 150.68 4.41 113.52 3.48 124.62 3.70 100.18 3.70 69.47
Other receivables 27.09 0.79 20.88 0.64 14.84 0.44 12.77 0.44 16.52
Investments 1.60 0.05 1.53 0.05 10.64 0.32 40.31 0.32 57.28
Cash and bank balances 64.79 1.89 37.18 1.14 80.73 2.39 42.97 2.39 11.84
TOTAL CURRENT ASSETS 1,613.61 47.20 1,410.18 43.19 1,437.00 42.62 1,344.43 42.62 1,254.97
TOTAL ASSETS 3,418.94 100.00 3,265.14 100.00 3,371.95 100.00 3,420.12 100.00 3,005.72
CURRENT LIABILITIES
Trade and other payables 387.54 11.34 356.31 10.91 302.33 8.97 279.34 8.97 217.29
Accrued mark-up 14.32 0.42 4.56 0.14 243.93 7.23 199.70 7.23 209.27
Short term borrowings 710.42 20.78 604.90 18.53 954.37 28.30 963.81 28.30 1,036.48
Current portion of long term financing 176.35 5.16 151.59 4.64 357.02 10.59 393.57 10.59 674.06
TOATL CURRENT LIABILITIES 1,288.63 37.69 1,117.36 34.22 1,857.64 55.09 1,836.42 55.09 2,137.10
WORKING CAPITAL 324.98 9.51 292.82 8.97 (420.64) (12.47) (491.98) (12.47) (882.13)
TOTAL CAPITAL EMPLOYED 2,130.31 62.31 2,147.78 65.78 1,514.31 44.91 1,583.70 44.91 868.62
NON-CURRENT LIABILITIES
Long term financing 570.45 16.68 676.85 20.73 198.76 5.89 322.64 5.89 74.16
Liabilities against assets subject to finance lease - - - - - - - - -
Deferred liabilities 231.62 6.77 232.58 7.12 236.18 7.00 246.90 7.00 125.86
TOTAL NON-CURRENT LIABILITIES 802.07 23.46 909.43 27.85 434.94 12.90 569.54 12.90 200.02
NET WORTH 1,328.25 38.85 1,238.35 37.93 1,079.37 32.01 1,014.16 32.01 668.60
NET WORTH REPRESENTED BY
Issued, subscribed and paid-up capital 594.29 17.38 594.29 18.20 594.29 17.62 594.29 17.62 594.29
Accumulated Profit / (Loss) 369.71 10.81 253.30 7.76 65.51 1.94 (31.34) 1.94 (165.55)
Surplus on revaluation of property, plant and equipment 364.25 10.65 390.76 11.97 419.57 12.44 451.22 12.44 239.87
1,328.25 38.85 1,238.35 37.93 1,079.37 32.01 1,014.16 32.01 668.60
TOTAL LIABILITIES 3,418.94 100.00 3,265.14 100.00 3,371.95 100.00 3,420.12 100.00 3,005.72
100.00
90.65
9.35
2.06
1.63
0.14
6.16
3.84
3.20
0.22
2.97
52.42
1.53
0.09
54.04
3.07
19.59
9.63
1.28
2.93
0.37
1.18
1.26
39.31
100.00
8.17
5.84
28.18
11.51
53.69
(14.38)
46.31
9.43
-
7.22
16.65
29.65
17.38
(0.92)
13.19
29.65
100.00

10Zephyr Textiles Limited
Wealth Generated Year 2016 Year 2015Amount Rs. %
100%100%
Amount Rs. %
Distribution of wealth 2016 Distribution of wealth 2015
Statement of Value Addition
Sales Revenue 3,932,856,870 3,756,906,768 Other Income 10,769,529 202,733,175 3,943,626,399 3,959,639,943 Less:
Material & Services Material & Factory Costs 3,093,930,080 3,019,064,957
Administrative Costs 31,565,502 25,340,512 Distribution Costs 61,921,679 65,640,811 3,187,417,261 3,110,046,280
Total Wealth Generated 756,209,138 849,593,663
Wealth Distributed Year 2016 Year 2015Amount Rs. % %Amount Rs.
To Employees Salaries & Benefits 336,806,683 44.54% 298,528,107 35.17%
To Government
Tax 25,295,133 3.34% 22,446,473 2.64% Worker Profit Participation Fund 71,06,856 0.94% 2,229,640 0.26% Worker Welfare Fund 2,700,605 0.36% 847,263 0.10%To Providers of Capital
Dividends to Share Holders - - - - Mark Up/Interest on Borrowed Funds 126,333,632 16.71% 166,340,523 19.59%
To Poviders for Maintenance & Expansion of Assets Depreciation 150,931,693 19.96% 155,458,278 18.31% Profit Retained 107,034,535 14.15% 203,066,729 23.92% Total Wealth Distributed 756,209,138 848,917,013
34.11%
44.54%
To Employees 44.54%To Government 4.64%To Providers of Capital 16.71% To Providers for Maintenance &Expansion of Assets 34.11%
42.23%
35.17%
3.01%19.59%
16.71%
To Employees 35.17%To Government 3.01%To Providers of Capital 19.59% To Providers for Maintenance &Expansion of Assets 42.23%
4.64%

11 Annual Report 2016
Key Operating and Financial Data of Last Six Years
Year 2015 Year 2014Amount Rs. % Amount Rs. %
June, 30 June, 30June, 30 June, 302014
(Rupees in thousand)
20122013 2011
PROFIT AND LOSS
Sales 3,932,857 3,756,907 4,199,161 3,840,907 3,135,629 3,573,505
Cost of Sales 3,535,642 3,429,043 3,793,808 3,481,673 2,819,589 3,149,998
Gross Profit 397,215 327,864 405,353 359,234 316,041 423,507
Operating Profit plus other income 258,663 391,854 281,962 359,468 231,462 331,858
Financial & Other charges 126,334 166,341 193,112 236,684 196,080 217,027
Taxation 25,295 22,446 25,396 8,524 20,452 26,183
NET PROFIT AFTER TAX 107,035 203,067 63,454 114,260 14,929 88,648
BALANCE SHEET
Capital 594,287 594,287 594,287 594,287 594,287 594,287
Share subscription money - - - - - -
Reserves 369,712 253,297 65,509 (31,341) (165,554) (192,134)
Surplus on revaluation of fixed assets 364,247 390,762 419,572 451,216 239,867 260,174
NET WORTH 1,328,246 1,238,347 1,079,368 1,014,163 668,600 662,328
Long Term Liabilities 570,447 676,849 198,760 322,644 74,156 262,255
Deferred liabilities 231,622 232,580 236,179 246,895 125,860 131,124
Current Liabilities 1,288,630 1,117,362 1,857,645 1,836,415 2,137,103 2,139,020
TOTAL LIABILITIES 2,090,698 2,026,790 2,292,584 2,405,955 2,337,119 2,532,399
TOTAL EQUITY & LIABILITIES 3,418,944 3,265,137 3,371,953 3,420,119 3,005,720 3,194,727
Fixed Assets 1,797,516 1,836,218 1,927,075 2,013,546 1,747,742 1,897,172
Capital Work in Progress - 10,865 - 58,840 - -
Long Term Deposits 7,823 7,873 7,873 3,299 3,004 3,004
Current Assets 1,613,606 1,410,181 1,437,004 1,344,433 1,254,973 1,294,551
TOTAL ASSETS 3,418,944 3,265,137 3,371,953 3,420,119 3,005,720 3,194,727
INVESTOR INFORMATION
Break up value per share (Rs.) 22.35 20.84 18.16 17.07 11.25 11.14
Bonus/Cash dividend (Rs. In '000) - - - - - -
Earning Per Share (Rs.) 1.80 3.42 1.07 1.92 0.25 1.49
Return on Equity (%) 8.06 16.40 5.88 11.27 2.23 13.38
Return on Assets (%) 3.13 6.22 1.88 3.34 0.50 2.77
FINANCIAL RATIOS
Gross Margin (%) 10.10 8.73 9.65 9.35 10.08 11.85
Net Margin (%) 2.72 5.41 1.51 2.97 0.48 2.48
Current Ratio 1.25 1.26 0.77 0.73 0.59 0.61
Leverage 1.11 1.16 1.63 1.85 2.98 3.25
Long Term Debt : Equity 37:63 44:56 23:77 64:36 85:15 39:61
June, 30 June, 302016 2015

12Zephyr Textiles Limited
PROFIT AND LOSS
Sales 3,932,857 3,756,907 4,199,161 3,840,907 3,135,629 3,573,505
Cost of Sales 3,535,642 3,429,043 3,793,808 3,481,673 2,819,589 3,149,998
Gross Profit 397,215 327,864 405,353 359,234 316,041 423,507
Operating Profit plus other income 258,663 391,854 281,962 359,468 231,462 331,858
Financial & Other charges 126,334 166,341 193,112 236,684 196,080 217,027
Taxation 25,295 22,446 25,396 8,524 20,452 26,183
NET PROFIT AFTER TAX 107,035 203,067 63,454 114,260 14,929 88,648
BALANCE SHEET
Capital 594,287 594,287 594,287 594,287 594,287 594,287
Share subscription money - - - - - -
Reserves 369,712 253,297 65,509 (31,341) (165,554) (192,134)
Surplus on revaluation of fixed assets 364,247 390,762 419,572 451,216 239,867 260,174
NET WORTH 1,328,246 1,238,347 1,079,368 1,014,163 668,600 662,328
Long Term Liabilities 570,447 676,849 198,760 322,644 74,156 262,255
Deferred liabilities 231,622 232,580 236,179 246,895 125,860 131,124
Current Liabilities 1,288,630 1,117,362 1,857,645 1,836,415 2,137,103 2,139,020
TOTAL LIABILITIES 2,090,698 2,026,790 2,292,584 2,405,955 2,337,119 2,532,399
TOTAL EQUITY & LIABILITIES 3,418,944 3,265,137 3,371,953 3,420,119 3,005,720 3,194,727
Fixed Assets 1,797,516 1,836,218 1,927,075 2,013,546 1,747,742 1,897,172
Capital Work in Progress - 10,865 - 58,840 - -
Long Term Deposits 7,823 7,873 7,873 3,299 3,004 3,004
Current Assets 1,613,606 1,410,181 1,437,004 1,344,433 1,254,973 1,294,551
TOTAL ASSETS 3,418,944 3,265,137 3,371,953 3,420,119 3,005,720 3,194,727
INVESTOR INFORMATION
Break up value per share (Rs.) 22.35 20.84 18.16 17.07 11.25 11.14
Bonus/Cash dividend (Rs. In '000) - - - - - -
Earning Per Share (Rs.) 1.80 3.42 1.07 1.92 0.25 1.49
Return on Equity (%) 8.06 16.40 5.88 11.27 2.23 13.38
Return on Assets (%) 3.13 6.22 1.88 3.34 0.50 2.77
FINANCIAL RATIOS
Gross Margin (%) 10.10 8.73 9.65 9.35 10.08 11.85
Net Margin (%) 2.72 5.41 1.51 2.97 0.48 2.48
Current Ratio 1.25 1.26 0.77 0.73 0.59 0.61
Leverage 1.11 1.16 1.63 1.85 2.98 3.25
Long Term Debt : Equity 37:63 44:56 23:77 64:36 85:15 39:61
Graphical RepresentationNet Margin (%)
2.72
1.51
2.97
0.48
2.48
2016 2015 2014 2013 2012 2011
5.41
0
1
2
3
4
5
6
-
5.00
10.00
15.00
20.00
25.00
30.00
2016 2015 2014 2013 2012 2011
Taxation
25
.30
22
.45
25
.40
8.5
2
20
.45
26
.18
20.8
4
18.1
6
11.1
4
17.0
7
11.2
5
22.3
5
5.00
10.00
15.00
20.00
25.00
2016 2015 2014 2013 2012 2011
Break up value per share (Rs.)
Earning Per Share (Rs.)
0.50
0
1.00
1.50
2.00
2.50
3.00
3.50
4.00
2016 2015 2014 2013 2012 2011
1.491.80
3.42
1.07
1.92
0.25
1.25
1.26
0.77
0.73
0.59
0.61
0
0.2
0.4
0.6
0.8
1
1.2
1.4
2016 2015 2014 2013 2012 2011
Current Ratio
1.111.16
1.63
1.85
2.98 3.25
0
0.5
1
1.5
2
2.5
3
3.5
4
2016 2015 2014 2013 2012 2011
Leverage

3932
.85
3756
.90
4199
.161
3840
.90
3135
.62
3573
.50
500
0
1500
2000
2500
3500
4000
4500
2016 2015 2014 2013 2012 2011
Sales (Rupees in Million)
13 Annual Report 2016
50
100
150
250
300
350
400
450
2016 2015 2014 2013 2012 2011
Gross Profit (Rupees in Million)
0
397.
21
327.
86
405.
35
359.
23
316.
04
423.
50
Raw material Is consumed 62.52
Stores consumed 2.58
Packing Sizing and lubricants consumed 7.13
Fuel and power 10.62
Salaries, wages and other benefits 8.27
Processing charger 3.93
Insurance 0.15
Repairs and maintenance 0.23
Travelling & Conveyance 0.07 Depreciation 4.04
Other production overheads 0.46
Cost of Sales
0.46
62.52
2.58
10.62
7.13
3.93
8.27
0.15
0.23 0.074.04
Net Profit / Loss after tax
50
0
100
150
200
250
2016 2015 2014 2013 2012 2011
107.03
203.06
63.45
114.26
14.92
88.64

14Zephyr Textiles Limited
DuPont Analysis
Gross Revenues
Cost of Sales
Admin & Selling Exp
Interest Expense
Other Income
Total Assets
Total Debts
Operating Profit Margin
Asset Turnover Ratio
Return on Assets
Spread
Debt-to-Equity Ratio
Return on Equity
*Spread = ROA - Cost of Debt
0.066
1.150
7.566%
1.52%
1.57
9.963%
3,932,857
3,535,642
149,321
126,334
10,770
3,418,945
2,090,698
Data Input Area Amount in "000"
1 Operating Profit Margin
Gross Revenue (-) Admin & Selling Exp (-) Cost of Sales (=) Net Operating Income3,932,857 149,321 3,535,642 247,894
Net Oprt Income (+) Other Income (-) Interest Expense (=) Net Income247,894 10,770 126,334 132,330
Net Income (+) Interest Expense ( ) Gross Revenue (=) Operating Profit Margin132,330 126,334 3,932,857 0.066
Gross Revenue ( ) Total Asset (=) Turnover Ratio3,932,857 3,418,945 1.150
2 Asset Turnover Ratio
3 Return on Assets (ROA)
4 Return on Equity (ROE)
Oprt. Profit Margin (x) Turnover Ratio (=) Oprt. Return on Assets0.066 1.150 0.076
Total Debts ( ) Total Equity (=) Debt/Equity Ratio2,090,698 1,328,246 1.57
Interest Expense ( ) Total Liabilities (=) Interest Cost126,334 2,090,698 6.04%
Return on Assets (+) Return on Assets (-) Interest Cost (x) Debt/Equity Ratio (=) Return on Equity7.57% 7.57% 6.04% 1.57 0.0996
Leverage Ratio
Cost of Debt or Average Interest Rate
( (

Total Shares held
Pattern of Share Holding As on June 30, 2016
Incorporation Number 0039902
The Companies Ordinance, 1984 (Section 236 (1) & 464) Form 34
Number of Shareholders From To
69 1 100 1,060 148 101 500 72,733 67 501 1000 66,999 116 1001 5000 336,313 29 5001 10000 250,339 17 10001 15000 208,000 14 15001 20000 254,298 5 20001 25000 117,500 8 25001 30000 230,500 1 30001 35000 32,000 1 35001 40000 35,500 3 40001 45000 132,500 5 45001 50000 248,500 2 55001 60000 115,500 1 60001 65000 60,500 2 65001 70000 138,000 3 70001 75000 219,000 2 75001 80000 158,500 1 85001 90000 90,000 3 95001 100000 298,500 1 100001 105000 102,000 1 120001 125000 125,000 2 135001 140000 274,000 1 155001 160000 160,000 1 195001 200000 200,000 1 200001 205000 201,000 1 530001 535000 532,000 1 1560001 1565000 1,561,000 1 2165001 2170000 2,166,800 1 2465001 2470000 2,465,300 1 2855001 2860000 2,857,300 1 4460001 4465000 4,460,651 1 4485001 4490000 4,485,151 1 4835001 4840000 4,839,556 1 15105001 15110000 15,109,364 1 16820001 16825000 16,823,365
514 59,428,729
Shareholding
15 Annual Report 2016
16Zephyr Textiles Limited
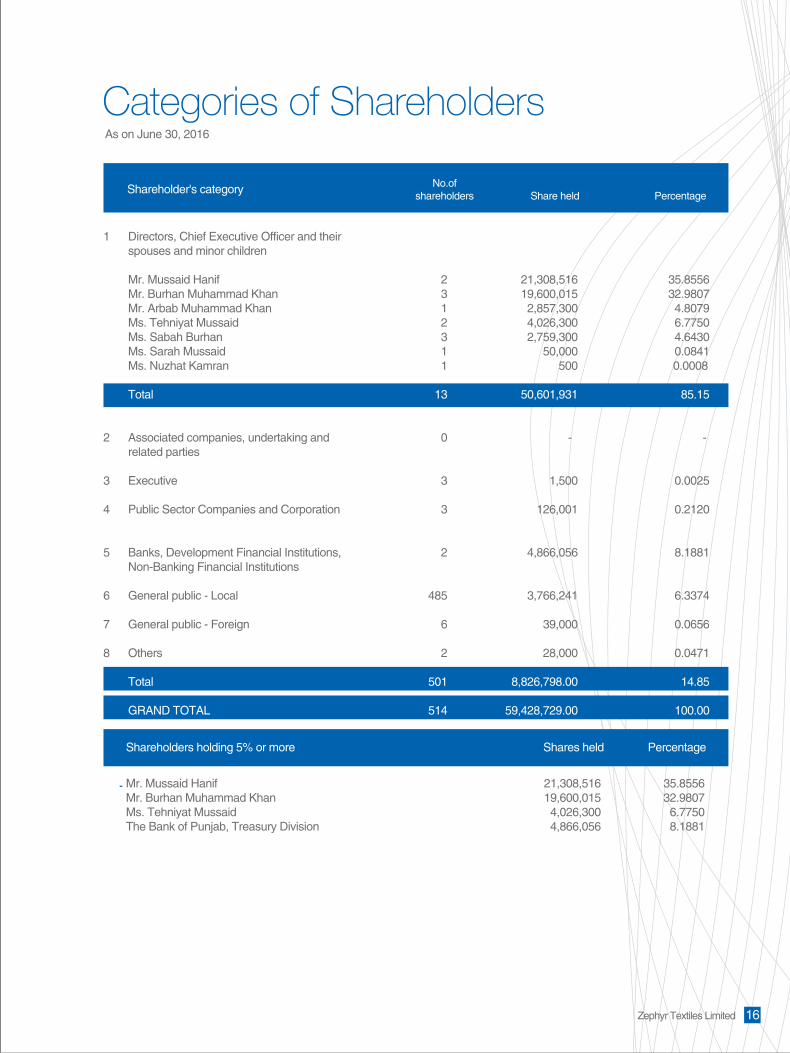
Categories of ShareholdersAs on June 30, 2016
No.of shareholders Share held Percentage
Shareholder's category
1 Directors, Chief Executive Officer and their spouses and minor children
Mr. Mussaid Hanif 2 21,308,516 35.8556 Mr. Burhan Muhammad Khan 3 19,600,015 32.9807 Mr. Arbab Muhammad Khan 1 2,857,300 4.8079 Ms. Tehniyat Mussaid 2 4,026,300 6.7750 Ms. Sabah Burhan 3 2,759,300 4.6430 Ms. Sarah Mussaid 1 50,000 0.0841 Ms. Nuzhat Kamran 1 500 0.0008
Total 13 50,601,931 85.15
2 Associated companies, undertaking and 0 - - related parties 3 Executive 3 1,500 0.0025 4 Public Sector Companies and Corporation 3 126,001 0.2120 5 Banks, Development Financial Institutions, 2 4,866,056 8.1881 Non-Banking Financial Institutions 6 General public - Local 485 3,766,241 6.3374 7 General public - Foreign 6 39,000 0.0656 8 Others 2 28,000 0.0471
Total 501 8,826,798.00 14.85 GRAND TOTAL 514 59,428,729.00 100.00
Shareholders holding 5% or more Shares held Percentage
Mr. Mussaid Hanif 21,308,516 35.8556 Mr. Burhan Muhammad Khan 19,600,015 32.9807 Ms. Tehniyat Mussaid 4,026,300 6.7750 The Bank of Punjab, Treasury Division 4,866,056 8.1881

17 Annual Report 2016
This statement is being presented to comply with the Code of Corporate Governance contained in Regulations No. 5.19 of Listing Regulations of the Pakistan Stock Exchange Limited for the purpose of establishing a framework of good governance, whereby a listed company is managed in compliance with the best practice of corporate governance.
The company has applied the principles contained in the CCG in the following manner:
The company encourages representation of non-executive directors and executive directors representing minority interests on its Board of Directors. At present the Board includes:
Category
Independent Director:Executive Directors:
Non-Executive Directors:
Names
Ms. Nuzhat KamranMr. Mussaid Hanif (CEO)Mr. Burhan Muhammad Khan
Mr. Arbab Muhammad KhanMs. Tehniat MussaidMs. Sabah BurhanMs. Sarah Mussaid
Sta
tem
ent o
f Com
plia
nce
With
The
Cod
e of
Cor
pora
te
Gov
erna
nce
For T
he Y
ear E
nded
Jun
e 30
, 201
6
The above named independent director meets the criteria of independence under clause 5.19.1(b)of the CCG.
The directors have confirmed that none of them is serving as a director on more than seven listed companies, including this company.
All the resident directors of the company are registered as taxpayers and none of them has defaulted in payment of any loan to a banking company, a DFI or an NBFI or, being a member of stock exchange, has been declared as a defaulter by that stock exchange.
A Casual vacancy occurred on the Board was filled up by directors within stipulated time period.
The company has prepared a “Code of Conduct” and has ensured that appropriate steps have been taken to dissemi-nate it throughout the company along with its supporting policies and procedures.
The board has developed a vision/mission statement, overall corporate strategy and significant policies of the compa-ny. A complete record of particulars of significant policies along with the dates on which they were approved or amend-ed has been maintained.
All the powers of the board have been duly exercised and decisions on material transactions, including appointment and determination of remuneration and terms and conditions of employment of the CEO, other executive and non-ex-ecutive directors, have been taken by the board.
The meetings of the board were presided over by the CEO and, in his absence, by a director elected by the board for this purpose and the board met at least once in every quarter, written notices of the board meetings, along with agenda and working papers, were circulated at least seven days before the meetings. The minutes of the meetings were appro-priately recorded and circulated.
The board arranged in –house training program for its directors during the year.
The directors’ report for this year has been prepared in compliance with the requirements of the CCG and fully describes the salient matters required to be disclosed.
The financial statements of the company were duly endorsed by CEO and CFO before approval of the board.
The directors, CEO and executives do not hold any interest in the shares of the company other than that disclosed in the pattern of shareholding.
The company has complied with all the corporate and financial reporting requirements of the CCG.

18Zephyr Textiles Limited
Designation
Chairperson / Member Member Member
Names
Ms. Tehniat MussaidMs. Sabah BurhanMr. Arbab Muhammad Khan
Category
Members of Audit Committee:
Designation
Chairperson / Member Member Member
Names
Mr. Burhan Muhammad KhanMs. Nuzhat KamranMs. Sarah Mussaid
Category
Human Resource & remuneration committee:
Status
Exempted AboveExempted AboveCertified from ICAPCertified from ICAPCertified from ICAPWill acquire certificationWill acquire certification
Names
Mr. Mussaid Hanif (CEO)Mr. Burhan Muhammad KhanMs. Tehniat MussaidMs. Sabah BurhanMs. Nuzhat KamranMs. Sarah MussaidMr. Arbab Muhammad Khan
Category
Exempted / Certified Directors of Directors’
Training Program:
The meetings of the Audit Committee were held at least once every quarter prior to approval of interim and final results of the company and as required by the CCG. The terms of reference of the Committee have been formed and advised to the commit-tee for compliance.
The board has formed an HR and Remuneration committee. It comprises 03 members, of whom one is Executive director while two are Non-Executive directors.
The Board has set up an effective internal audit function and the persons involved are considered suitably qualified and experi-enced for the purpose and are conversant with the policies and procedures of the Company.
The statutory auditors of the company have confirmed that they have been given a satisfactory rating under the quality control review programme of the ICAP, that they or any of the partners of the firm, their spouses and minor children do not hold shares of the Company and that the firm and all its partners are in compliance with International Federation of Accountants (IFAC) guidelines on code of ethics as adopted by the ICAP.
The statutory auditors or the persons associated with them have not been appointed to provide other services except in accor-dance with the listing regulations and the auditors have confirmed that they have observed IFAC guidelines in this regard.
The ‘closed period’, prior to the announcement of interim/final results, and business decisions, which may materially affect the market price of company’s securities, was determined and intimated to directors, employees and stock exchange(s).
Material/Price sensitive information has been disseminated among all market participants at once through stock exchange(s). We confirm that all other material principles enshrined in the CCG have been complied with the following status of certification of director under Directors’ Training Programme (DTP):
On behalf of the Board of Directors
September 21, 2016 Mussaid Hanif Chief Executive
The board has formed an audit committee. It comprises 03 members, Following are non-executive directors.
19 Annual Report 2016
Rev
iew
Rep
ort t
o th
e M
embe
rs o
n S
tate
men
t of C
ompl
ianc
e w
ith B
est P
ract
ices
of C
ode
of C
orpo
rate
Gov
erna
nce
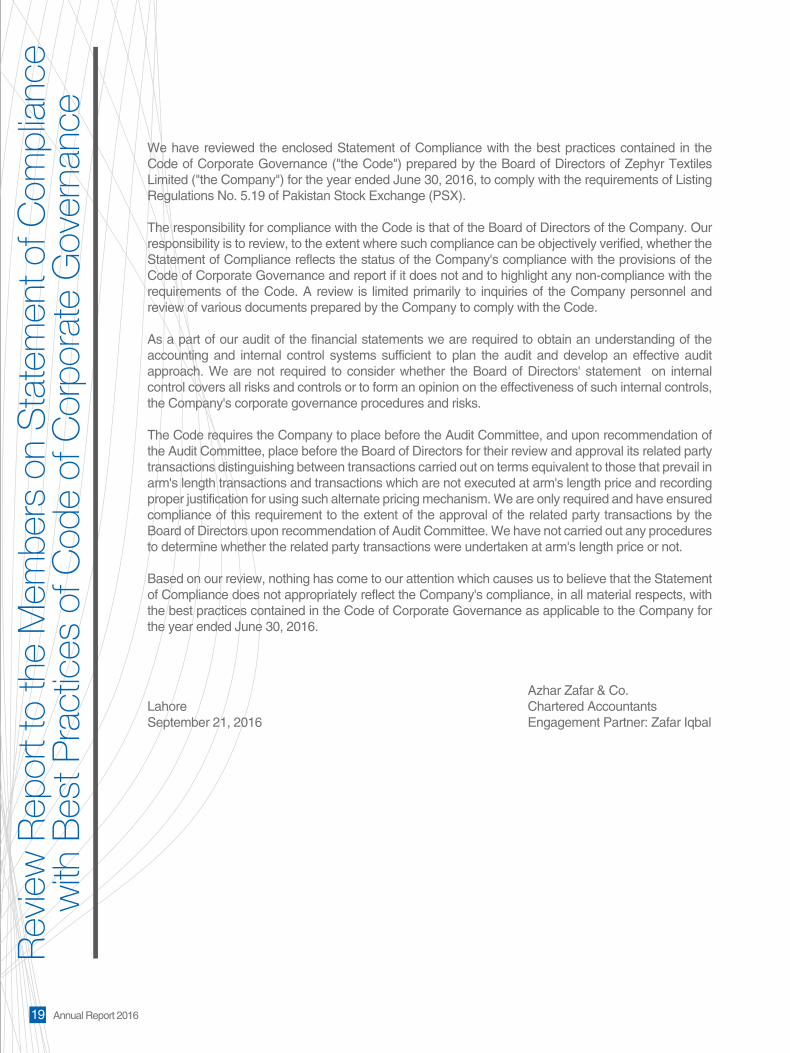
We have reviewed the enclosed Statement of Compliance with the best practices contained in the Code of Corporate Governance ("the Code") prepared by the Board of Directors of Zephyr Textiles Limited ("the Company") for the year ended June 30, 2016, to comply with the requirements of Listing Regulations No. 5.19 of Pakistan Stock Exchange (PSX). The responsibility for compliance with the Code is that of the Board of Directors of the Company. Our responsibility is to review, to the extent where such compliance can be objectively verified, whether the Statement of Compliance reflects the status of the Company's compliance with the provisions of the Code of Corporate Governance and report if it does not and to highlight any non-compliance with the requirements of the Code. A review is limited primarily to inquiries of the Company personnel and review of various documents prepared by the Company to comply with the Code. As a part of our audit of the financial statements we are required to obtain an understanding of the accounting and internal control systems sufficient to plan the audit and develop an effective audit approach. We are not required to consider whether the Board of Directors' statement on internal control covers all risks and controls or to form an opinion on the effectiveness of such internal controls, the Company's corporate governance procedures and risks. The Code requires the Company to place before the Audit Committee, and upon recommendation of the Audit Committee, place before the Board of Directors for their review and approval its related party transactions distinguishing between transactions carried out on terms equivalent to those that prevail in arm's length transactions and transactions which are not executed at arm's length price and recording proper justification for using such alternate pricing mechanism. We are only required and have ensured compliance of this requirement to the extent of the approval of the related party transactions by the Board of Directors upon recommendation of Audit Committee. We have not carried out any procedures to determine whether the related party transactions were undertaken at arm's length price or not. Based on our review, nothing has come to our attention which causes us to believe that the Statement of Compliance does not appropriately reflect the Company's compliance, in all material respects, with the best practices contained in the Code of Corporate Governance as applicable to the Company for the year ended June 30, 2016.
Azhar Zafar & Co.Lahore Chartered AccountantsSeptember 21, 2016 Engagement Partner: Zafar Iqbal

We have audited the annexed balance sheet of Zephyr Textiles Limited ('the Company') as at June 30, 2016 and the related profit and loss account, statement of comprehensive income, cash flow statement and state-ment of changes in equity together with the notes forming part thereof, for the year then ended and we state that we have obtained all the information and explanations which, to the best of our knowledge and belief, were necessary for the purposes of our audit.
It is the responsibility of the Company’s management to establish and maintain a system of internal control, and prepare and present the above said statements in conformity with the approved accounting standards and the requirements of the Companies Ordinance, 1984. Our responsibility is to express an opinion on these state-ments based on our audit.
We conducted our audit in accordance with the auditing standards as applicable in Pakistan. These standards require that we plan and perform the audit to obtain reasonable assurance about whether the above said state-ments are free of any material misstatement. An audit includes examining, on a test basis, evidence supporting the amounts and disclosures in the above said statements. An audit also includes assessing the accounting policies and significant estimates made by management, as well as, evaluating the overall presentation of the above said statements. We believe that our audit provides a reasonable basis for our opinion and, after due verification, we report that:
a) in our opinion, proper books of account have been kept by the Company as required by the Companies Ordinance, 1984;
b) in our opinion:
i) the balance sheet and profit and loss account together with the notes thereon have been drawn up in conformity with the Companies Ordinance, 1984, and are in agreement with the books of account and are further in accordance with accounting policies consistently applied;
ii) the expenditure incurred during the year was for the purpose of the Company's business; and
iii) the business conducted, investments made and the expenditure incurred during the year were in accordance with the objects of the Company;
c) in our opinion and to the best of our information and according to the explanations given to us, the balance sheet, profit and loss account, statement of comprehensive income, cash flow statement and statement of changes in equity together with the notes forming part thereof conform with approved accounting standards as applicable in Pakistan, and, give the information required by the Companies Ordinance, 1984, in the manner so required and respectively give a true and fair view of the state of the Company’s affairs as at June 30, 2016 and of the profit, its comprehensive income, its cash flows and changes in equity for the year then ended; and
d) in our opinion, Zakat deductible at source under the Zakat and Ushr Ordinance, 1980 (XVIII of 1980), was deducted by the Company and deposited in the Central Zakat Fund established under Section 7 of that Ordinance.
Azhar Zafar & Co.Lahore Chartered AccountantsSeptember 21, 2016 Engagement Partner: Zafar Iqbal
Auditors’ Report To The M
embers
20Zephyr Textiles Limited

Note2016
(Rupees) (Rupees)2015
Balance SheetAs at June 30, 2016
Equity and liabilities Share capital and reserves Authorized capital 62,500,000 ordinary shares of Rs. 10/- each 625,000,000 625,000,000 Issued, subscribed and paid up share capital 6 594,287,290 594,287,290 Accumulated profit 369,712,295 253,296,747 Total equity 963,999,585 847,584,037 Surplus on revaluation of property, plant and equipment 7 364,246,726 390,762,487 Liabilities Non-current Long term financing 8 570,446,790 676,848,872 Deferred liabilities 10 231,621,837 232,579,733 Total non-current liabilities 802,068,627 909,428,605 Current Trade and other payables 11 387,537,976 356,313,163 Accrued mark-up 12 14,321,758 4,563,593 Short term borrowings 13 710,417,398 604,897,441 Current portion of long term borrowings 9 176,352,671 151,587,487 Total current liabilities 1,288,629,803 1,117,361,684 Contingencies and commitments 14 - - Total liabilities 2,090,698,430 2,026,790,289 Total equity and liabilities 3,418,944,741 3,265,136,813
Assets Non-current Property, plant and equipment 15 1,797,515,632 1,836,218,130 Capital work in progress 16 - 10,864,816 Long term deposits 17 7,822,686 7,872,686 Total non-current assets 1,805,338,318 1,854,955,632 Current Stores, spare parts and loose tools 112,258,545 108,392,442 Stock in trade 18 775,086,565 714,910,914 Trade debts 19 446,750,654 372,657,546 Loans and advances 20 35,357,461 41,117,557 Trade deposits, prepayments and balances with statutory authorities 21 150,680,773 113,523,230 Other receivables 22 27,088,511 20,876,283 Investments 23 1,598,895 1,526,654 Cash and bank balances 24 64,785,019 37,176,555 Total current assets 1,613,606,423 1,410,181,181 Total assets 3,418,944,741 3,265,136,813 The annexed notes 1 to 43 form an integral part of these financial statements.
CHIEF EXECUTIVE DIRECTOR
21 Annual Report 2016

Note2016
(Rupees) (Rupees)2015
Sales - net 25 3,932,856,870 3,756,906,768 Cost of sales 26 (3,535,642,318) (3,429,043,159)Gross profit 397,214,552 327,863,609 Distribution cost 27 (73,891,128) (77,740,425)Administrative expenses 28 (63,487,124) (57,045,867)Other operating expenses 29 (12,079,769) (3,956,768)Operating profit 247,756,531 189,120,549 Other operating income 30 10,906,772 202,733,175 Operating profit before finance cost 258,663,303 391,853,724 Finance cost 31 (126,333,632) (166,340,523)Profit before tax 132,329,671 225,513,201 Taxation 32 (25,295,132) (22,446,473)Profit after taxation 107,034,539 203,066,728 Earnings per share:
Basic and diluted earnings per share 33 1.80 3.42 The annexed notes 1 to 43 form an integral part of these financial statements.
Profit and Loss AccountFor the year ended June 30, 2016
CHIEF EXECUTIVE DIRECTOR
22Zephyr Textiles Limited

Statement of Comprehensive Income For the year ended June 30, 2016
Profit after taxation 107,034,539 203,066,728 Other comprehensive income Loss on remeasurement of staff retirement benefit plan 5.1 & 10 (2,780,362) (832,580) Total comprehensive income for the year 104,254,177 202,234,148 The annexed notes 1 to 43 form an integral part of these financial statements.
Note2016
(Rupees) (Rupees)2015
CHIEF EXECUTIVE DIRECTOR
23 Annual Report 2016

Cash flows from operating activities Cash generated from operations 34 311,465,503 359,892,244 Finance cost paid (116,575,467) (104,263,081)Taxes paid (42,173,331) (35,237,348)Staff retirement benefits - gratuity paid (9,977,950) (9,476,000)Net cash flow from operating activities 142,738,755 210,915,815 Cash flows from investing activities Proceeds from sale of property, plant and equipment 982,800 3,601,864 Purchase of property, plant and equipment (104,023,420) (76,939,214)Long term deposits 50,000 - Dividends, capital gains and income from investments 55,728 61,686 Short term investments - 9,117,281 Net cash flow from investing activities (102,934,892) (64,158,383) Cash flows from financing activities Availed short term borrowings - net 105,519,957 17,069,661 Repayment of long term financing - net (117,715,356) (207,379,594)
Net cash flow from financing activities (12,195,399) (190,309,933) Net (decrease)/ increase in cash and cash equivalents 27,608,464 (43,552,501) Cash and cash equivalents at beginning of the year 37,176,555 80,729,056 Cash and cash equivalents at end of the year 64,785,019 37,176,555 The annexed notes 1 to 43 form an integral part of these financial statements.
Cash Flow StatementFor the year ended June 30, 2016
Note2016
(Rupees) (Rupees)2015
CHIEF EXECUTIVE DIRECTOR
24Zephyr Textiles Limited
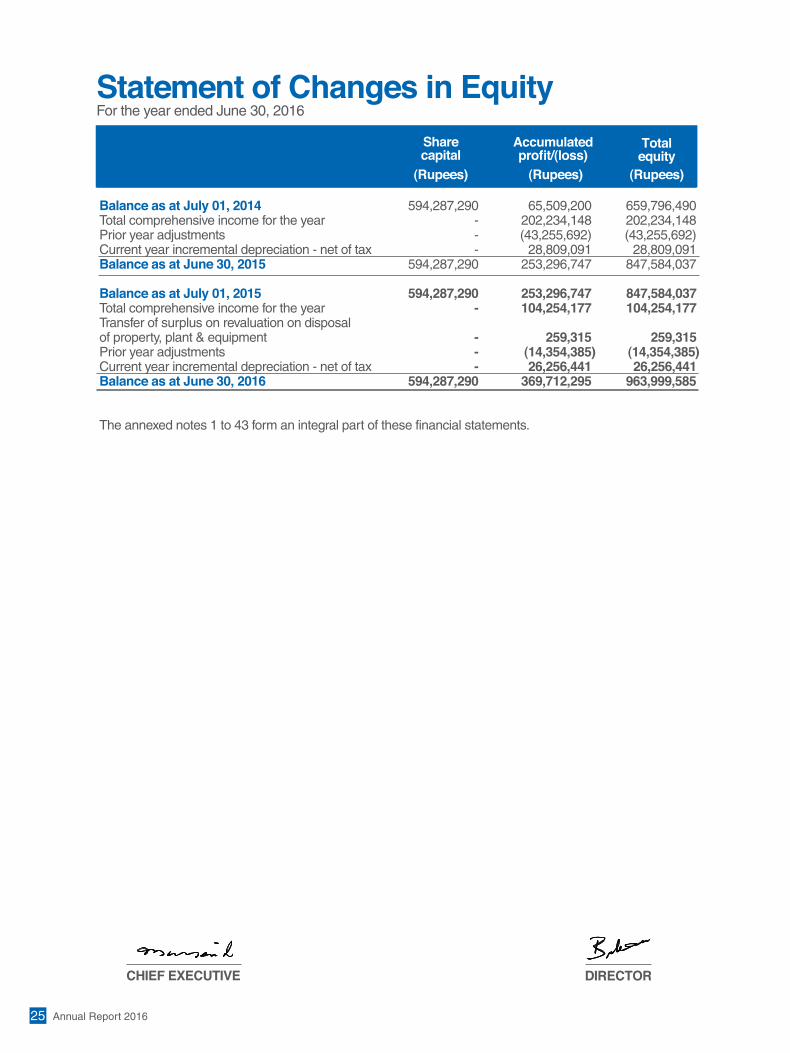
Statement of Changes in Equity For the year ended June 30, 2016
Sharecapital
Accumulatedprofit/(loss)
(Rupees)(Rupees) (Rupees)
Totalequity
Balance as at July 01, 2014 594,287,290 65,509,200 659,796,490 Total comprehensive income for the year - 202,234,148 202,234,148 Prior year adjustments - (43,255,692) (43,255,692)Current year incremental depreciation - net of tax - 28,809,091 28,809,091 Balance as at June 30, 2015 594,287,290 253,296,747 847,584,037
Balance as at July 01, 2015 594,287,290 253,296,747 847,584,037 Total comprehensive income for the year - 104,254,177 104,254,177 Transfer of surplus on revaluation on disposal of property, plant & equipment - 259,315 259,315 Prior year adjustments - (14,354,385) (14,354,385)Current year incremental depreciation - net of tax - 26,256,441 26,256,441 Balance as at June 30, 2016 594,287,290 369,712,295 963,999,585
The annexed notes 1 to 43 form an integral part of these financial statements.
CHIEF EXECUTIVE DIRECTOR
25 Annual Report 2016

Notes to the Financial StatementsFor the year ended June 30, 2016
1 LEGAL STATUS AND NATURE OF BUSINESS
Zephyr Textiles Limited (“the Company”) was incorporated in Pakistan on February 26, 1999 as a private limited Company under the Companies Ordinance, 1984. Subsequently on October 04, 2004 it was converted into a public limited Company and its shares are quoted in Pakistan Stock Exchange Limited (PSX). The Company is principally engaged in the manufacturing, dying and trading of woven cloth which also includes towels. The registered office of the Company is situated at 3rd Floor, IEP Building, 97B/D-1, Gulberg III, Lahore, Punjab and the manufacturing facilities are located at Bhai Pheru and Jumber.
2 STATEMENT OF COMPLIANCE
These financial statements have been prepared in accordance with approved accounting standards as applicable in Pakistan. Approved accounting standards comprise of such International Financial Reporting Standards (IFRSs) issued by the International Accounting Standards Board (IASB) as are notified under the Companies Ordinance, 1984, provisions of and directives issued under the Companies Ordinance, 1984. In case requirements differ, the provisions of and directives issued under the Companies Ordinance, 1984 shall prevail.
3 BASIS OF PREPARATION
3.1 Accounting convention
These financial statements have been prepared under the historical cost convention except for cash flow information and the following:
- staff retirement benefits which are measured at present value of defined benefit obligation plus/(less) any unrecognized actuarial gains/(unrecognized actuarial losses and past service cost) (refer note 5.1);
- free hold land, buildings and plant & machinery which are measured at revalued amount (refer note 5.2); and
- financial assets and financial liabilities which are measured at fair value (refer note 5.11).
3.2 Standards that are effective in current year and are relevant to the company
The following standards are mandatory for the Company’s accounting periods beginning on or after July 01, 2015:
IFRS 12 ‘Disclosures of Interests in Other Entities’ (effective for annual periods beginning on
or after 01 January 2015). This standard includes the disclosure requirements for all forms of interests in other entities, including joint arrangements, associates, special purpose vehicles and other off-balance sheet vehicles. This standard does not have significant impact on these financial statements, except for certain additional disclosures.
26Zephyr Textiles Limited

Notes to the Financial StatementsFor the year ended June 30, 2016
IFRS 13 ‘Fair value Measurement’ (effective for annual periods beginning on or after 01 January 2015). This standard aims to improve consistency and reduce complexity by providing a precise definition of fair value and a single source of fair value measurement and disclosure requirements for use across IFRSs. The requirements, which are largely aligned between IFRSs and US GAAP, do not extend the use of fair value accounting but provide guidance on how it should be applied where its use is already required or permitted by other standards within IFRSs or US GAAP. This standard does not have significant impact on these financial statements, except for certain additional disclosures.
3.3 Amendments to published standards that are effective in current year but not relevant to the company
There are amendments to published standards that are mandatory for accounting periods beginning on or after 01 July 2015 but are considered not to be relevant or do not have any significant impact on the Company’s financial statements and are therefore not detailed in these financial statements.
3.4 Standards and amendments to published approved accounting standards that are not yet
effective but relevant to the Company
The following standards and amendments to existing standards have been published and are mandatory for the Company’s accounting periods beginning on or after 01 July 2016 or later periods:
IFRS 9 ‘Financial Instruments’ (effective for annual periods beginning on or after 01 January 2018).
A finalized version of IFRS 9 which contains accounting requirements for financial instruments, replacing IAS 39 ‘Financial Instruments: Recognition and Measurement’. Financial assets are classified by reference to the business model within which they are held and their contractual cash flow characteristics. The 2014 version of IFRS 9 introduces a ‘fair value through other comprehensive income’ category for certain debt instruments. Financial liabilities are classified in a similar manner as under IAS 39, however there are differences in the requirements applying to the measurement of an entity’s own credit risk. The 2014 version of IFRS 9 introduces an ‘expected credit loss’ model for the measurement of the impairment of financial assets, so it is no longer necessary for a credit event to have occurred before a credit loss is recognized. It introduces a new hedge accounting model that is designed to be more closely aligned with how entities undertake risk management activities when hedging financial and non-financial risk exposures. The requirements for the derecognition of financial assets and liabilities are carried forward from IAS 39. The management of the Company is in the process of evaluating the impacts of the aforesaid standard on the Company’s financial statements.
IFRS 15 ‘Revenue from Contracts with Customers’ (effective for annual periods beginning on or after 01 January 2018). IFRS 15 provides a single, principles based five-step model to be applied to all contracts with customers. The five steps in the model are: identify the contract with the customer; identify the performance obligations in the contract; determine the transaction price; allocate the transaction price to the performance obligations in the contracts; and recognize revenue when (or as) the entity satisfies a performance obligation. Guidance is provided on topics such as the point in which revenue is recognized, accounting for variable consideration, costs of fulfilling and obtaining a contract and various related matters. New disclosures about revenue are also introduced. The aforesaid standard is not expected to have a material impact on the Company’s financial statements
27 Annual Report 2016
Notes to the Financial StatementsFor the year ended June 30, 2016
IFRS 15 (Amendments), ‘Revenue from Contracts with Customers’ (effective for annual periods beginning on or after 01 January 2018). Amendments clarify three aspects of the standard (identifying performance obligations, principal versus agent considerations, and licensing) and to provide some transition relief for modified contracts and completed contracts. The aforesaid amendments are not expected to have a material impact on the Company’s financial statements.
IAS 7 (Amendments), ‘Statement of Cash Flows’ (effective for annual periods beginning on or after 01 January 2017). Amendments have been made to clarify that entities shall provide disclosures that enable users of financial statements to evaluate changes in liabilities arising from financing activities. The aforesaid amendments will result in certain additional disclosures in the Company’s financial statements.
IAS 16 (Amendments) ‘Property, Plant and Equipment’ (effective for annual periods beginning on or after 01 January 2016). The amendments clarify that a depreciation method which is based on revenue, generated by an activity by using of an asset is not appropriate for property, plant and equipment; and add guidance that expected future reductions in the selling price of an item that was produced using an asset could indicate the expectation of technological or commercial obsolescence of the asset, which, in turn, might reflect a reduction of the future economic benefits embodied in the asset. However, the amendments are not expected to have a material impact on the Company’s financial statements.
IAS 27 (Amendments) ‘Separate Financial Statements’ (effective for annual periods beginning on or after 01 January 2016). The amendments have been made to permit investments in subsidiaries, joint ventures and associates to be optionally accounted for using the equity method in separate financial statements. The management of the Company is in the process of evaluating the impacts of the aforesaid amendments on the Company’s financial statements.
Amendments to IFRS 10 and IAS 28 (deferred indefinitely) to clarify the treatment of the sale or contribution of assets from an investor to its associates or joint venture, as follows: require full recognition in the investor’s financial statements of gains and losses arising on the sale or contribution of assets that constitute a business (as defined in IFRS 3 ‘Business Combinations’); require the partial recognition of gains and losses where the assets do not constitute a business, i.e. a gain or loss is recognized only to the extent of the unrelated investors’ interests in that associate or joint venture. These requirements apply regardless of the legal form of the transaction, e.g. whether the sale or contribution of assets occur by an investor transferring shares in a subsidiary that holds the assets (resulting in loss of control of the subsidiary), or by the direct sale of the assets themselves. The management of the Company is in the process of evaluating the impacts of the aforesaid amendments on the Company’s financial statements.
On 25 September 2014, IASB issued Annual Improvements to IFRSs: 2012 – 2014 Cycle, incorporating amendments to four IFRSs more specifically in IAS 34 ‘Interim Financial Reporting’, which is considered relevant to the Company’s financial statements. These amendments are effective for annual periods beginning on or after 01 January 2016. This amendment is unlikely to have a significant impact on the Company’s financial statements and has therefore not been analyzed in detail.
28Zephyr Textiles Limited

3.5 Standards and amendments to published approved accounting standards that are not yet effective but relevant to the Company
There are other standard and amendments to published standards that are mandatory for accounting periods beginning on or after 01 July 2016 but are considered not to be relevant or do not have any significant impact on the Company’s financial statements and are therefore not detailed in these financial statements
3.6 Accounting convention
These accounts have been prepared under the historical cost convention, except for revaluation of freehold land, building on freehold land and plant & machinery.
3.7 Functional and presentation currency
These financial statements are presented in Pakistan Rupee which is the Company’s functional and presentation currency. Figures in the financial statements have been rounded off to the nearest Rupee unless otherwise stated.
4 SIGNIFICANT ACCOUNTING ESTIMATES AND JUDGMENTS
The preparation of financial statements in conformity with approved accounting standards requires management to make judgments, estimates and assumptions that affect the application of policies and reported amounts of assets and liabilities, income and expenses. Actual results may differ from these estimates. These estimates and underlying assumptions are recognized in the period in which the estimate is revised and in any future periods affected. Following are the significant estimates and judgments made by the management:
4.1 Useful lives and residual values of property, plant and equipment
The Company reviews the useful lives of property, plant and equipment on a regular basis. Any change in the estimates in the future years might affect the carrying amount of the respective items of property, plant and equipment with a corresponding effect on the depreciation charge and impairment. Revaluation is carried with sufficient regularity to ensure that the carrying amounts of assets does not differ materially from the fair value.
4.2 Staff retirement benefits
Certain actuarial assumptions have been adopted as disclosed in note 5.1 to the financial statements for the valuation of present value of defined benefit obligation. Any changes in these assumptions in future years might affect unrecognized gains and losses in those years.
4.3 Income taxes
The Company takes into account the current income tax law and decisions taken by appellate authorities. Instances where the Company’s view differs from the view taken by the income tax department at the assessment stage and where the Company considers that its view on items of material nature is in accordance with law, the amounts are shown as contingent liabilities.
Notes to the Financial StatementsFor the year ended June 30, 2016
29 Annual Report 2016

30Zephyr Textiles Limited
4.4 Stock in trade and stores, spare parts and loose tools
The Company reviews the net realizable value (NRV) and impairment of stock in trade and stores, spare parts and loose tools to assess any diminution in the respecting carrying values and whenever required provisions for NRV impairment is made.
5 SUMMARY OF SIGNIFICANT ACCOUNTING POLICIES
5.1 Staff retirement benefits
Defined benefit plan _ gratuity
The Company operates an unfunded gratuity scheme (defined benefit plan) covering all eligible employees, payable at the cessation of employment. Contribution is made in accordance with actuarial recommendations. Actuarial valuation is conducted by an independent actuary, annually using projected unit credit method related details of which are given in note 10 to the financial statements. The obligation at the balance sheet date is measured at the present value of the estimated future cash outflows. All contributions are charged to profit or loss for the year.
Principal actuarial assumptions used in the actuarial valuation carried out as at June 30, 2016 are as follows:
- Discount rate 7.25% (2015: 9%) - Expected rate of salary increase in future 6.25% (2015: 8%) - Average expected remaining working life time of employees 9 years (2015: 7 years)
5.2 Property, plant and equipment
- Owned assets
Property, plant and equipment are initially recognized at acquisition cost. Subsequently, property, plant and equipment, except for free hold land are stated at cost less accumulated depreciation and impairment, if any. Free - hold land, building on free - hold land and plant & machinery are stated at revalued amounts less subsequently accumulated depreciation and impairment, if any.
Cost of property, plant and equipment consists of historical cost, borrowing costs pertaining to the erection and other directly attributable costs of bringing the assets to their working condition or for commencement of commercial production.
Depreciation on all the items of property, plant and equipment except for free - hold land is charged to income applying the reducing balance method at the rates specified in Note 15.
Depreciation on additions to property, plant and equipment is charged from the month in which asset become available for use, while on disposals depreciation is charged up to the month of disposal.
The assets’ residual values and useful lives are reviewed at each financial year end, and adjusted if impact on depreciation is significant.
Notes to the Financial StatementsFor the year ended June 30, 2016

Gain/loss on disposal of property, plant and equipment is credited or charged to income in the year
of disposal. Normal repairs and maintenance are charged to income as and when incurred. Major renewals and improvements are capitalized.
Any surplus arising on revaluation of property, plant and equipment is credited to the surplus on revaluation of property, plant and equipment account. Revaluation is carried with sufficient regularity to ensure that the carrying amount of assets does not differ materially from the fair value. To the extent of incremental depreciation charged on the revalued assets, the related surplus on revaluation of property, plant and equipment (net of deferred tax) is transferred directly to accumulated (loss)/profit.
5.3 Investments Classification of an investment is made on the basis of intended purpose for holding such
investment. Management determines the appropriate classification of its investments at the time of purchase and re-evaluates such designation on regular basis.
Investments are initially measured at fair value plus transaction costs directly attributable to acquisition, except for ‘Investment at fair value through profit or loss’ which is initially measured at fair value.
The Company assesses at the end of each reporting period whether there is any objective evidence that investments are impaired. If any such evidence exists, the Company applies the provisions of IAS 39 ‘Financial Instruments: Recognition and Measurement’ to all investments.
Investment at fair value through profit and loss
Investments classified as held-for-trading and those designated as such are included in this category. Investments are classified as held-for-trading if these are acquired for the purpose of selling in the short term. Gains or losses on investments held-for-trading are recognized in profit and loss account.
Held-to-maturity
Investments with fixed or determinable payments and fixed maturity are classified as held-to-maturity when the Company has the positive intention and ability to hold to maturity. Investments intended to be held for an undefined period are not included in this classification. Other long-term investments that are intended to be held to maturity are subsequently measured at amortized cost. This cost is computed as the amount initially recognized minus principal repayments, plus or minus the cumulative amortization, using the effective interest method, of any difference between the initially recognized amount and the maturity amount. For investments carried at amortized cost, gains and losses are recognized in profit and loss account when the investments are de-recognized or impaired, as well as through the amortization process.
Notes to the Financial StatementsFor the year ended June 30, 2016
31 Annual Report 2016

32Zephyr Textiles Limited
Available-for-sale
Investments intended to be held for an indefinite period of time, which may be sold in response to need for liquidity, or changes to interest rates or equity prices are classified as available-for-sale. After initial recognition, investments which are classified as available-for-sale are measured at fair value. Gains or losses on available-for-sale investments are recognized directly in statement of other comprehensive income until the investment is sold, de-recognized or is determined to be impaired, at which time the cumulative gain or loss previously reported in statement of other comprehensive income is included in profit and loss account. These are sub-categorized as under:
a) Quoted
For investments that are actively traded in organized capital markets, fair value is determined by reference to stock exchange quoted market bids at the close of business on the balance sheet date. Fair value of investments in open-end mutual funds is determined using redemption price.
b) Unquoted
Fair value of unquoted investments is determined on the basis of appropriate valuation techniques as allowed by IAS 39 ‘Financial Instruments: Recognition and Measurement’.
5.4 Stores, spare parts and loose tools
Useable stores, spare parts and loose tools are valued principally at lower of moving average cost, or net realizable value (NRV), while items considered obsolete are carried at nil value. Goods in transit are stated at cost comprising invoice value plus other charges paid thereon.
5.5 Stock in trade
Stock in trade is valued at lower of cost and net realizable value (NRV), except waste which is valued at net realizable value. Materials in transit are stated at cost comprising invoice value plus other charges paid thereon.
Cost of major components of stock in trade is determined as follows:-
Raw material - at weighted average cost Work in process and finished goods - at prime cost plus appropriate production overheads determined on weighted average basis.
Net realizable value signifies the estimated selling price in the ordinary course of business less costs necessarily to be incurred to make the sale.
5.6 Trade and other receivables
Trade debts and other receivables are carried at original invoice value less an estimate made for doubtful debts based on a review of all outstanding amounts at the year end. Bad debts are written off when identified.
Notes to the Financial StatementsFor the year ended June 30, 2016

5.7 Borrowings Borrowings are recognized initially at fair value and are subsequently stated at amortized cost.
Any difference between the proceeds and the redemption value is recognized in the profit and loss account over the period of the borrowings using the effective interest method.
5.8 Borrowing cost
Interest, markup and other charges on finances are capitalized up to the date of commissioning of respective qualifying asset acquired out of the proceeds of such finances. All other interest, markup and other charges are recognized in profit and loss account.
5.9 Trade and other payables
Liabilities for trade and other amounts payable are initially recognized at fair value, which is normally the transaction cost.
5.10 Financial instruments
Financial instruments carried on the balance sheet include investments, deposits, trade debts, loans and advances, other receivables, cash and bank balances, long term financing, short term borrowings, accrued mark up and trade and other payables etc. Financial assets and liabilities are recognized when the Company becomes a party to the contractual provisions of instruments. Initial recognition is made at fair value plus transaction costs directly attributable to acquisition, except for ‘financial instruments at fair value through profit or loss’ which are initially measured at fair value.
Financial assets are de-recognized when the Company loses control of the contractual rights that comprise the financial asset. The Company loses such control if it realizes the rights to benefits specified in contract, the rights expire or the Company surrenders those rights. Financial liabilities are de-recognized when the obligation specified in the contract is discharged, cancelled or expired. Any gain or loss on subsequent measurement (except available for sale investments) and de-recognition is charged to the profit or loss currently. The particular measurement methods adopted are disclosed in the individual policy statements associated with each item.
5.11 Capital work in progress
Capital work in progress is stated at cost less impairment, if any. Cost of property, plant and equipment consists of historical cost, borrowing costs pertaining to the erection/construction period and other directly attributable costs of bringing the assets to their working condition or for commencement of commercial production. All expenditure connected with specific assets incurred during installation and construction period are carried under capital work in progress. These are transferred to specific assets as and when these assets are available for use.
Notes to the Financial StatementsFor the year ended June 30, 2016
33 Annual Report 2016
34Zephyr Textiles Limited
5.12 Foreign currency translation
These financial statements are presented in Pak Rupees, which is the Company’s functional currency. All monetary assets and liabilities denominated in foreign currencies are translated into Pak Rupees at the rates of exchange prevailing at the balance sheet date, while the transactions in foreign currencies during the year are initially recorded in functional currency at the rates of exchange prevailing at the transaction date. All non-monetary items are translated into Pak Rupees at exchange rates prevailing on the date of transaction or on the date when fair values are determined. Exchange gains and losses are recorded in the profit and loss account.
5.13 Revenue recognition
Revenue from different sources is recognized as under:
Export sales are accounted for on shipment basis. Local sales are recorded on dispatch of goods to customers.
Export rebates are accounted for on accrual basis. Investment and interest income is recognized on time proportion basis.
Dividend income on ordinary shares is recognized when the right to receive dividend has been established.
Capital gains or losses arising on sale of investments are taken to income in the period in which they arise.
Rebate income is recognized on accrual basis. 5.14 Taxation
Current
Provision for current tax is based on the taxable income for the year determined in accordance with the prevailing law for taxation of income. The charge for current tax is calculated using prevailing tax rates or tax rates expected to apply to the profit for the year, if enacted. The charge for current tax also includes adjustments, where considered necessary, to provision for tax made in previous years arising from assessments framed during the year for such years.
Deferred
Deferred tax is provided using the balance sheet liability method for all temporary differences at the balance sheet date between tax bases of assets and liabilities and their carrying amount for financial reporting purposes. In this regard the effects on deferred taxation of the portion of income subject to final tax regime is also considered in accordance with the requirement of ‘Technical Release - 27’ issued by the Institute of Chartered Accountants of Pakistan.
Deferred income tax asset is recognized for all deductible temporary differences and carry forward of unused tax losses, if any, to the extent that it is probable that taxable profit will be available against which such temporary differences and tax losses can be utilized. Deferred tax liabilities are recognized for all major taxable temporary differences.
Notes to the Financial StatementsFor the year ended June 30, 2016

Deferred income tax assets and liabilities are measured at the tax rates that are expected to apply to the period when the asset is realized or the liability is settled, based on tax rates that have been enacted or substantively enacted at the balance sheet date. Deferred tax is charged or credited to the income statements, except in the case of items credited or charged to equity in which case it is included in equity.
5.15 Impairment
Financial assets
A financial asset is considered to be impaired if objective evidence indicate that one or more events had a negative effect on the estimated future cash flows of that asset.
An impairment loss in respect of a financial asset measured at amortized cost is calculated as a difference between its carrying amount and the present value of estimated future cash flows discounted at the original effective interest rate. An impairment loss in respect of available for sale financial asset is calculated with reference to its current fair value.
Individually significant financial assets are tested for impairment on an individual basis. The remaining financial assets are assessed collectively in groups that share similar credit risk characteristics.
Non-financial assets
The carrying amounts of the Company’s non-financial assets are reviewed at each balance sheet date to determined whether there is any indication of impairment. If such indication exists, the recoverable amount of such asset is estimated. An impairment loss is recognized wherever the carrying amount of the asset exceeds its recoverable amount. Impairment losses are recognized in profit and loss account. A previously recognized impairment loss is reversed only if there has been a change in the estimates used to determined the asset’s recoverable amount since the last impairment loss was recognized. If that is the case, the carrying amount of the asset is increased to its recoverable amount. That increased amount cannot exceed the carrying amount that would have been determined, net of depreciation, had no impairment loss been recognized for the asset in prior years. Such reversal is recognized in profit and loss account.
5.16 Provisions
Provisions are recognized when the Company has a present legal or constructive obligation as a result of past events and it is probable that out flow of resources embodying economic benefits will be required to settle the obligation and a reliable estimate of the amount can be made. However, provisions are reviewed at each balance sheet date and adjusted to reflect the current best estimate.
5.17 Cash and cash equivalents
Cash and cash equivalents comprise cash in hand, cash at banks on current, saving and deposit accounts and other short term highly liquid instruments that are readily convertible into known amounts of cash and which are subject to insignificant risk of changes in values.
Notes to the Financial StatementsFor the year ended June 30, 2016
35 Annual Report 2016

36Zephyr Textiles Limited
5.18 Related party transactions
Transactions with related parties are priced on arm’s length basis. Prices for these transactions are determined on the basis of comparable uncontrolled price method, which sets the price by reference to comparable goods and services sold in an economically comparable market to a buyer unrelated to the seller.
5.19 Dividend and other appropriations
Dividend distribution to the Company’s shareholders is recognized as a liability in the Company’s financial statements in the period in which the dividends are declared and other appropriations are recognized in the period in which these are approved by the Board of Directors.
2016 2015 2016 2015 (Number of shares) (Rupees) (Rupees)
6 ISSUED, SUBSCRIBED AND PAID UP SHARE CAPITAL
Ordinary shares of Rs. 10 each fully paid up in cash 51,901,483 51,901,483 519,014,830 519,014,830
Ordinary shares of Rs. 10 each issued as fully paid bonus shares 7,527,246 7,527,246 75,272,460 75,272,460 59,428,729 59,428,729 594,287,290 594,287,290
2016 2015 (Rupees) (Rupees)
7 SURPLUS ON REVALUATION OF PROPERTY, PLANT AND EQUIPMENT
Surplus arising on revaluation 7.1 529,433,946 570,227,424 Less: Deferred tax arising on surplus on revaluation 7.2 165,187,220 179,464,937 364,246,726 390,762,487 7.1 Surplus on revaluation of property plant and equipment
Opening surplus on revaluation of property plant and equipment 570,227,424 614,549,102 Surplus arising on revaluation - - 570,227,424 614,549,102 Incremental depreciation on :
Plant and machinery (30,730,378) (34,148,893) Building (9,664,146) (10,172,785) (40,394,524) (44,321,678) Adjustment on disposal of property, plant and equipment (398,954) - (40,793,478) (44,321,678) 529,433,946 570,227,424 This represents surplus over book value resulting from the revaluation of free - hold land, buildings
on free - hold land and plant and machinery. The valuation was carried out by independent valuer as on March 31, 2013 considering the market value.
Notes to the Financial StatementsFor the year ended June 30, 2016
Note

2016 2015 (Rupees) (Rupees)
7.2 Relating deferred tax liability
Relating deferred tax liability as on July 1, 2015 179,464,937 194,977,524 Deferred tax relating to surplus arising on revaluation - - Tax effect on incremental depreciation (14,277,717) (15,512,587) 165,187,220 179,464,937
8 LONG TERM FINANCING- SECURED
Facility Note Repayment Mark up Sanctioned Number of 2016 2015 commencement limit (Rs. installments (Rupees) (Rupees) in million) Demand Finance - I BOP 8.1 May-13 3 months Kibor 196.780 54 monthly 69,405,755 110,772,755 Demand Finance - II BOP 8.1 Oct-17 Interest free 204.379 31 monthly 129,520,021 105,955,124 Subtotal - BOP 198,925,776 216,727,879 Demand Finance - III NBP 8.1 & 8.2 Sep-15 3 months Kibor + 1% 327.502 28 Quarterly 311,539,927 327,501,663 Frozen Markup NBP 8.1 & 8.3 Sep-15 Interest free 13.747 28 Quarterly - 9,448,085 Frozen Markup NBP 8.1 & 8.3 Sep-15 Interest free 219.977 28 Quarterly 151,750,419 151,181,325 Subtotal - NBP 463,290,346 488,131,073 Term Finance NIB 8.1 & 8.4 Sep-14 3 months Kibor + 0.75% 145 48 Monthly 84,583,339 121,216,568 Subtotal - NIB 84,583,339 121,216,568 Demand Finance - III ABL 8.1 Oct-12 6.00% 125 36 Monthly - 2,360,839 Subtotal - ABL - 2,360,839 Total 746,799,461 828,436,359 Current portion 9 (153,204,595) (148,183,422) Overdue portion 9 (23,148,076) (3,404,065) Total current portion (176,352,671) (151,587,487) Total long term portion 570,446,790 676,848,872
8.1 It represents long term financing from commercial banks (stated above) and the amounts claimed by such institutions. Markup is leviable along with installment (except interest free loans) as per schedule stated above. These loans are secured against first ranking pari passu charge over current and fixed assets of the Company executed through the joint pari passu agreement with the lenders of the Company and joint memorandum of deposit of title deeds, equitable mortgage charge on land and personal guarantees of the directors of the Company.
8.2 It represents loan from National Bank of Pakistan which was restructured on terms agreed between the parties.
8.3 It represents restructured loan converted from mark up payable on the facilities from National Bank of Pakistan till June 30, 2015.
8.4 It represents running finance facility from NIB Bank Limited converted into term finance facility.15
Notes to the Financial StatementsFor the year ended June 30, 2016
37 Annual Report 2016
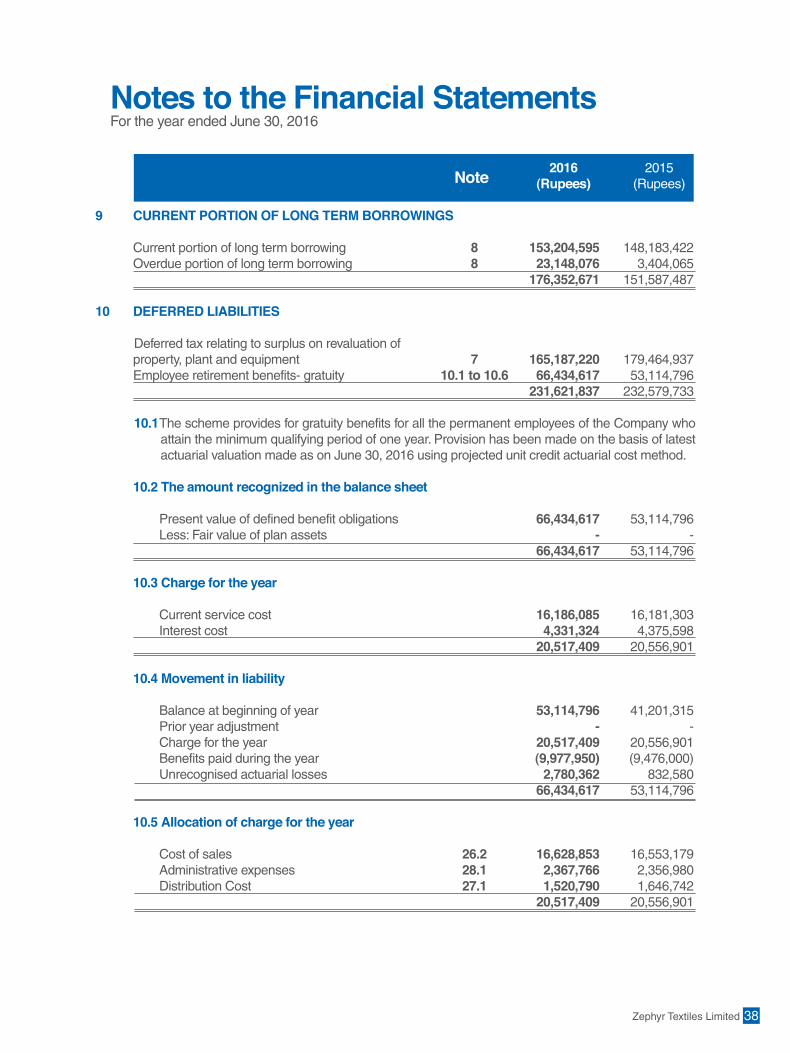
Notes to the Financial StatementsFor the year ended June 30, 2016
2016 2015 (Rupees) (Rupees)
9 CURRENT PORTION OF LONG TERM BORROWINGS
Current portion of long term borrowing 8 153,204,595 148,183,422 Overdue portion of long term borrowing 8 23,148,076 3,404,065 176,352,671 151,587,487
10 DEFERRED LIABILITIES
Deferred tax relating to surplus on revaluation of property, plant and equipment 7 165,187,220 179,464,937 Employee retirement benefits- gratuity 10.1 to 10.6 66,434,617 53,114,796 231,621,837 232,579,733 10.1 The scheme provides for gratuity benefits for all the permanent employees of the Company who
attain the minimum qualifying period of one year. Provision has been made on the basis of latest actuarial valuation made as on June 30, 2016 using projected unit credit actuarial cost method.
10.2 The amount recognized in the balance sheet
Present value of defined benefit obligations 66,434,617 53,114,796 Less: Fair value of plan assets - - 66,434,617 53,114,796
10.3 Charge for the year
Current service cost 16,186,085 16,181,303 Interest cost 4,331,324 4,375,598 20,517,409 20,556,901 10.4 Movement in liability
Balance at beginning of year 53,114,796 41,201,315 Prior year adjustment - - Charge for the year 20,517,409 20,556,901 Benefits paid during the year (9,977,950) (9,476,000) Unrecognised actuarial losses 2,780,362 832,580 66,434,617 53,114,796 10.5 Allocation of charge for the year
Cost of sales 26.2 16,628,853 16,553,179 Administrative expenses 28.1 2,367,766 2,356,980 Distribution Cost 27.1 1,520,790 1,646,742 20,517,409 20,556,901
38Zephyr Textiles Limited
Note

Notes to the Financial StatementsFor the year ended June 30, 2016
39 Annual Report 2016
Year Value (Rupees)
10.6 Historical information
Present value of defined benefit obligation 2016 66,434,617 2015 53,114,796 2014 41,201,315 2013 34,878,145 2012 27,333,893
2016 2015 (Rupees) (Rupees)
11 TRADE AND OTHER PAYABLES
Creditors 231,025,926 182,408,572 Advances from customers 14,167,148 29,119,278 Accrued liabilities 84,961,370 91,252,488 With holding tax 8,769,359 11,023,187 Retention money payable 5,700,000 500,000 Workers’ funds 11.1 & 11.2 42,488,171 41,583,636 Dividend payable 426,002 426,002 387,537,976 356,313,163
11.1 Workers’ funds
Workers’ profit participation fund
Opening balance 36,269,340 30,528,879 Provision for the year 7,106,857 2,229,640 Payment during the year (12,228,826) - Interest on funds utilized in Company’s business 31 3,325,898 3,510,821 34,473,269 36,269,340 Workers’ welfare fund
Opening balance 5,314,296 4,467,033 Provision for the year 2,700,606 847,263 8,014,902 5,314,296 42,488,171 41,583,636 11.2 Mark up on Workers’ Profit Participation Fund has been provided @ 9.17 % per annum (2015:
11.50% per annum).
12 ACCRUED MARK-UP
Long term financing 6,615,839 1,846,264 Short term borrowings 7,705,919 2,717,329 14,321,758 4,563,593
Note

Notes to the Financial StatementsFor the year ended June 30, 2016
13 SHORT TERM BORROWINGS- SECURED
Sanctioned limit Markup rate Facility Note Rupees (M) (Matching KIBOR/ LIBOR+) Mark-up/ 2016 2015 Repayment terms (Rupees) (Rupees)
Pre - shipment 13.1 & 13.4 507.00 7.36% to 8.48% Half yearly 318,373,000 587,396,800 Post - shipment 13.1 & 13.4 437.00 3.50% to 4.50% Half yearly 305,000,000 - Running finance 13.3 & 13.4 87.477 7.35% to 8.01% Half yearly 87,044,398 17,500,641
710,417,398 604,897,441
13.1 The Company has aggregate sanctioned limits of finance against packing credit (FAPC) and
export refinance facilities (ERF) of Rs. 944 million. The company has availed limits of finance against packing credit (FAPC) & export refinance facilities (ERF) amounting to Rs. 28.373 million from United Bank Limited, Rs. 70 million from Habib Bank Limited, Rs. 220 million from National Bank of Pakistan Limited, Rs. 105 million from Habib Bank Limited and Rs. 200 million from Bank of Punjab.
13.2 The Company has aggregate sanctioned limits of finance against foreign bill (FAFB) of Rs. 325 million. The Company has availed limits of finance against foreign bill (FAFB) amounting to Rs. 7.541 million from United Bank Limited and Rs. 29.064 million from Habib Bank Limited.
13.3 The Company has sanctioned limits of running finance of Rs. 87.477 million from Faysal Bank Limited and Rs. 23 million from Habib Bank Limited. The Company has availed limits of running finances amounting to Rs. 87.044 million from Faysal Bank Limited.
13.4 These facilities are secured against first ranking pari passu charge over current assets of the Company executed through joint pari passu agreement with the lenders of the Company, hypothecation of stocks, lien on confirmed export orders and personal guarantees of the directors.
14 CONTINGENCIES AND COMMITMENTS
Contingencies
14.1 The Company has filed a recovery suit against the Punjab Cotton Mills Limited for Rs. 5.107 million along with interest. The execution was filed which is still pending. The next date of hearing in the execution in October 07, 2016.
14.2 M/s. M. J. Industries had filed a suit against the Company for declaration for Rs. 0.545 million. The case was dismissed by the Honorable Civil Judge, Lahore. M/s. M. J. Industries had filed an application for the restoration of the suit which was also rejected by the Civil Judge, Lahore. The Company has filed a recovery suit against the M/s M. J. Industries for Rs. 0.545 million. The summon and notices have been issued to the defendant and the case is pending due to non appearance of the defendant before the Honorable Civil Judge, Lahore. The Company is hopeful of settlement of the case in its favor.
14.3 The Company has filed a recovery suit against the M/s. Amtex Limited for Rs. 2.917 million. The case is decreed in favour of Zephyr Textiles Limited by the Honorable Judge, high Court, Lahore. The case is pending for execution.
40Zephyr Textiles Limited

Notes to the Financial StatementsFor the year ended June 30, 2016
14.4 M/s. Sitara Textiles has filed a suit against the Company for recovery of damages against non performance of contract no. LO417 for supply of fabric. According to legal confirmation status, suit is pending for framing of issues.
The Company has filed a suit against M/s. Sitara Textiles Limited for financial loss, cost of sales loss, loss of business and loss due to breach of contract for Rs. 37.680 million. Company is hopeful of settlement of the case in its favor.
M/s. Sitara Textiles has filed an other suit against the Company for financial loss and loss due to breach of contract for Rs. 65.724 million. The case is pending before Supreme Court of Pakistan.
The Company has again fieled an other suit against M/s. Sitara Textiles for financial loss and loss
due to breach of contract for Rs. 65.724 million . The case is pending before Supreme Court of Pakistan.
14.5 The Company has filed suit for Recovery of Rs. 34.027 million for unauthorized sale of shares by
First Pakistan Capital Limited. The case is pending before Senior Civil Judge Lahore.
14.6 The Company has filed suit for Recovery along with damages of Rs. 31.350 million against M/s Al-Abid Silk Ltd. (Suit No. 494 of 2014) in the Sindh High Court. The case is pending before Sindh High Court.
14.7 The Company has filed a suit against old tenants for vacation of property purchased by the Company situated at Ek Moria Pull Lahore. The matter is pending for adjudication. Certain suits were filed against the Company regarding the said property which are as under:
- Muhammad Sajid (the plaintiff) has filed a suit for permanent injunctions and declaration against interfering the possession of plaintiff property by pretending that the suit property has been purchased by Zephyr Textiles Limited (the defendant) through registered sales deed bearing distavez no. 2775 dated 01-09-2010, whereas the purchased property of the defendant is separate and different from the suit property of the plaintiff. The case is dismiss by the Court during the year.
- Sh. Zafar Iqbal v/s. M/s Zephyr Textiles Limited. Sh. Zafar Iqbal has filed a suit for cancelation of registry with respect to the said property purchased by the Company. The case is pending for adjudication.
The Company is hopeful for settlement of the above stated suits in its favor. 14.8 Guarantees issued by various commercial banks, in respect of financial and operational obligations
of the Company, to various institutions and corporate bodies aggregate to Rs. 43.508 million (2015: Rs. 43.508 million).
14.9 Foreign bills purchased by banks amounting to Rs. 68.422 million (2015: Rs. 174.816 million).
Commitments 14.10 Contracts for capital expenditure are Rs. 48.874 million (2015: Rs. Nil million).
14.11 Letters of credit other than for capital expenditure are Rs. 3.743 million (2015: Rs. 13.414 million). 14.12 Outstanding foreign currency forward contracts of Rs. 285.099 million (2015: Rs. 276.04 million).
41 Annual Report 2016

Notes to the Financial StatementsFor the year ended June 30, 2016
15 PROPERTY, PLANT AND EQUIPMENT
Particulars Land - Buildings on Link road Non factory Plant and Furniture Vehicles Electrical Office Total
freehold free - hold land building machinery and fittings installation equipment
COST Balance as at July 01, 2014 176,505,000 470,300,001 29,702,478 59,494,334 1,369,248,143 5,663,390 31,439,504 60,443,741 21,867,306 2,224,663,896 Additions during the year - 3,111,982 - - 50,419,109 83,000 8,350,471 3,449,905 659,931 66,074,398 Disposals - - - - - - (5,071,741) (750,000) - (5,821,741)
Balance as at June 30, 2015 176,505,000 473,411,983 29,702,478 59,494,334 1,419,667,252 5,746,390 34,718,234 63,143,646 22,527,237 2,284,916,553 Additions during the year - - - - 102,145,486 27,900 10,024,607 1,200,354 1,489,889 114,888,236 Disposals - - - - (3,373,626) - (1,168,655) - - (4,542,281)Balance as at June 30, 2016 176,505,000 473,411,983 29,702,478 59,494,334 1,518,439,112 5,774,290 43,574,186 64,344,000 24,017,126 2,395,262,508 DEPRECIATION Balance as at July 01, 2014 - 29,099,812 9,330,232 32,607,958 163,821,034 2,787,003 16,820,246 31,991,338 11,131,200 297,588,822 Accumulated depreciation eliminated on disposal - - - - - - (3,794,613) (554,065) - (4,348,678)Depreciation expense - 22,072,974 1,018,608 2,688,636 121,380,559 292,472 3,953,448 2,948,077 1,103,506 155,458,279
Balance as at June 30, 2015 - 51,172,786 10,348,840 35,296,594 285,201,593 3,079,475 16,979,081 34,385,350 12,234,706 448,698,423
Accumulated depreciation eliminated on disposal - - - - (953,535) - (929,698) - - (1,883,233) Depreciation expense - 21,111,960 967,680 2,419,776 117,533,954 267,165 4,623,360 2,914,082 1,093,709 150,931,686
Balance as at June 30, 2016 - 72,284,746 11,316,520 37,716,370 401,782,012 3,346,640 20,672,743 37,299,432 13,328,415 597,746,876
Written down value as at June 30, 2016 176,505,000 401,127,237 18,385,958 21,777,964 1,116,657,100 2,427,650 22,901,443 27,044,568 10,688,711 1,797,515,632 Written down value as at June 30, 2015 176,505,000 422,239,197 19,353,638 24,197,740 1,134,465,659 2,666,915 17,739,153 28,758,296 10,292,531 1,836,218,130
Rate of depreciation 0% 5% 5% 10% 10% 10% 20% 10% 10%
2016 2015 (Rupees) (Rupees)
15.1 Depreciation for the year has been allocated as under :
Cost of sales 26 144,947,452 150,108,854 Distribution cost 27 2,992,117 2,674,712 Administrative expenses 28 2,992,117 2,674,712 150,931,686 155,458,279
15.2 The Company has revalued its free - hold land, building on free - hold land and plant and machinery by an independent valuer Unicorn International Surveyors on the basis of market value. There is no significant change in the carrying amount of free - hold land, building on free - hold land and plant and machinery due to revaluation made during the year.
Free-hold land, buildings on free-hold land and plant and machinery represents values subsequent to revaluation as at March 31, 2013. Had there been no revaluation, the cost, accumulated depreciation, and book value of the revalued property, plant and equipment as on June 30, 2016 would have been as follows:
Cost as at June 30, depreciation as at Book value as at Book value as at
42Zephyr Textiles Limited
Note

Notes to the Financial StatementsFor the year ended June 30, 2016
Accumulated Cost as at June 30, depreciation as at Book value as at Book value as at 2016 June 30, 2016 June 30, 2016 June 30, 2015
Free - hold land 106,864,276 - 106,864,276 102,242,676 Buildings on free - hold land 360,775,899 146,317,313 214,458,586 225,745,880 Plant and machinery 1,668,260,689 1,064,653,108 603,607,581 672,900,196 2,135,900,864 1,210,970,421 924,930,443 1,000,888,752
15.3 Disposal of Property, Plant and Equipment
The following is the detail of disposals during the year:
Cost/ Gain / Mode of Name and Address Particulars Assessed value Book value Sale proceed (loss) disposal of buyers
Vehicles
Honda City LEF 08-7308 1,168,155 238,958 600,000 361,042 Negotiation Mr. Syed Ibrar Hussain Shah s/o Syed Sajjad Hussain Shah,Suok
Kallah Dakkahana Khas, District Gujrat.
Plant and Machinery
Sewing Machine Joki 485,395 361,421 82,800 (278,621) Negotiation SM Traders, 34 Ittefaq Market, Mcload Road, Lahore.
Generator 2,888,231 2,119,790 300,000 (1,819,790) Negotiation Subhan Enterprises, 154-E, Mominpura, Daroghawala,Opposite PTCL Exchange, G.T. Road, Lahore.
2016 Rupees 4,541,781 2,720,169 982,800 (1,737,369) 2015 Rupees 5,821,741 1,473,063 3,601,864 2,128,801
2016 2015 (Rupees) (Rupees)
16 CAPITAL WORK IN PROGRESS
Plant and machinery - 10,864,816 Building - - 16.1 - 10,864,816 16.1 Movement in the account is as follows
Opening balance as at July 01, 2015 10,864,816 - Addition made during the year:
- Plant and machinery 2,510,074 40,645,514 - Building 12,398,796 3,111,982 14,908,870 43,757,496 Capitalized during the year: - Plant and machinery 13,374,890 29,780,698 - Building 12,398,796 3,111,982 25,773,686 32,892,680 - 10,864,816
43 Annual Report 2016
Note

2016 2015 (Rupees) (Rupees) 17 LONG TERM DEPOSITS
Security deposits - WAPDA 6,593,152 6,593,152 Security deposits - OTHERS 1,229,534 1,279,534 7,822,686 7,872,686
18 STOCK IN TRADE
Raw material 163,005,504 155,647,351 Work in process 142,034,763 141,720,387 Finished goods 470,046,298 417,543,176 775,086,565 714,910,914 18.1 Finished goods includes stock in transit amounting to Rs. 46.830 million (2015: Rs.
34.833 million). 18.2 Finished goods includes stock held by third parties amounting to Rs. 32.796 million (2015: Rs. 16.541 million).
19 TRADE DEBTS
Considered good Export - Secured against letters of credit 64,476,601 54,402,352
Local - Unsecured 382,274,053 318,255,194 446,750,654 372,657,546
20 LOANS AND ADVANCES
Considered good: Loan due from employees - interest free 14,488,783 11,232,602 Advances to: Suppliers 19,600,564 22,889,666
Suppliers against letters of credit 1,268,114 6,995,289 35,357,461 41,117,557
21 TRADE DEPOSITS, PREPAYMENTS AND BALANCES WITH STATUTORY AUTHORITIES
Prepayments 3,456,543 2,318,354 Advance income tax 4,262,067 1,661,586
Margin deposits 24,730,580 10,105,000 Sales tax refundable 108,205,074 90,202,771 Export rebate receivable 10,026,509 9,235,519 150,680,773 113,523,230
22 OTHER RECEIVABLES
Other receivables 27,088,511 20,876,283 27,088,511 20,876,283
Notes to the Financial StatementsFor the year ended June 30, 2016
44Zephyr Textiles Limited
Note

2016 2015 2016 2015 Number of shares/ units ( Rupees ) ( Rupees )
23 SHORT TERM INVESTMENTS
Investment in Funds 23.1
Atlas Money Market Fund 9 9 4,734 4,534 Faysal Money Market Fund 8,790 8,474 888,895 856,250 8,799 8,483 893,629 860,784 Investments at fair value through profit or loss - listed securities
Pak Electron Limited 944 944 61,029 78,106 JS Growth Fund Limited 37,132 37,132 450,410 450,410 Attock Refinery Limited 11 11 3,082 2,513 Samba Bank Limited 24,500 24,500 187,425 131,075 Summit Bank Limited 1,111 1,111 3,320 3,766 63,698 63,698 705,266 665,870
Un-quoted Securities:
Innovative Investment Bank Limited - - - - - - - - 72,497 72,181 1,598,895 1,526,654 23.1 Atlas Money Market Fund and Faysal Money Market Fund is an open ended money market mutual
funds managed by Atlas Asset Management Company Limited and Faysal Asset Management Company Limited. The said investment is valued at fair value and any gain or loss resulting from fair value adjustment is charged to profit or loss.
Note 2016 2015 (Rupees) (Rupees)
24 CASH AND BANK BALANCES
Cash in hand 1,521,252 662,370 Cash at banks
- current accounts 24.1 62,752,821 35,894,535 - saving account 24.2 18,294 17,631 Cash at banks - foreign currency 492,652 602,019 64,785,019 37,176,555 24.1 This includes amount held in Habib Metropolitan Bank escrow account against dividend payable
amounting to Rs. 445,096 (2015: Rs.445,096).
24.2 The balances in saving accounts carry rate of profit ranging from 3.12% to 3.76% (2015: 4% to 6%).
Notes to the Financial StatementsFor the year ended June 30, 2016
45 Annual Report 2016
Note

2016 2015 (Rupees) (Rupees) 25 SALES - NET
Export 1,389,379,934 1,110,990,280 Exchange (loss)/gain 10,998,804 1,013,540 Total export sales 1,400,378,738 1,112,003,820 Local 2,567,905,021 2,684,915,784 Total sales 3,968,283,759 3,796,919,604 Export rebate 14,851,687 15,587,601 3,983,135,446 3,812,507,205 Commission and claims (42,736,004) (50,242,958) Trade discount (7,542,572) (5,357,479) 3,932,856,870 3,756,906,768
26 COST OF SALES Raw material consumed 26.1 2,243,624,807 2,227,857,818 Stores, spare parts and loose tools consumed 92,408,787 96,420,489 Packing, sizing and lubricants consumed 255,752,176 213,459,273 Fuel and power 381,264,905 388,078,216 Salaries, wages and other benefits 26.2 296,764,786 259,869,348 Processing charges 140,995,750 66,895,373 Insurance 5,549,041 5,211,204 Repairs and maintenance 8,076,042 8,151,908 Traveling and conveyance 2,550,538 2,346,683 Depreciation 15.1 144,947,452 150,108,854 Other production overheads 16,525,532 12,837,787 3,588,459,816 3,431,236,953 Adjustment of work-in-process
Opening stock 141,720,387 156,166,104 Closing stock (142,034,763) (141,720,387) (314,376) 14,445,717 3,588,145,440 3,445,682,670
Adjustment of finished goods and waste
Opening stock 417,543,176 400,903,665 Closing stock (470,046,298) (417,543,176) (52,503,122) (16,639,511) 3,535,642,318 3,429,043,159
Notes to the Financial StatementsFor the year ended June 30, 2016
46Zephyr Textiles Limited
Note

2016 2015 (Rupees) (Rupees)
26.1 Raw material consumed
Opening stock 155,647,351 174,982,116 Purchases 2,275,847,492 2,224,518,286 Return / discount on purchases (40,030,762) (26,634,758) 2,235,816,730 2,197,883,528 Freight 15,166,230 10,639,525 2,406,630,311 2,383,505,169 Closing stock (163,005,504) (155,647,351) 2,243,624,807 2,227,857,818 26.2 This includes employee benefits amounting to Rs. 16.629 million (2015: Rs. 16.553 million).
27 DISTRIBUTION COST Salaries, wages and other benefits 27.1 11,112,392 9,628,116 Traveling and conveyance 1,137,792 425,762 Sales promotion 1,280,417 485,140 Communication 4,249,457 4,305,810 Vehicles running and maintenance 640,173 813,398 Freight 38,662,018 51,748,408 Clearing and forwarding 4,753,642 3,611,594 Depreciation 15.1 2,992,117 2,674,712 Others 9,063,120 4,047,485 73,891,128 77,740,425 27.1 This includes employee benefits amounting to Rs. 1.521 million (2015: Rs. 1.647 million).
28 ADMINISTRATIVE EXPENSES Directors’ remuneration 6,110,200 6,810,000 Salaries and other benefits 28.1 22,819,305 22,220,643 Traveling and conveyance 7,643,081 6,603,755 Rent, rates and taxes 4,068,372 2,870,358 Printing and stationery 1,561,018 1,335,457 Communication 2,314,808 2,487,553 Vehicle running and maintenance 3,610,379 3,876,938 Repairs and maintenance 4,821,926 673,619 Auditors’ remuneration 28.2 880,000 880,000 Fee and subscription 2,090,481 1,281,606 Legal and professional 1,134,100 2,283,667 Electricity, gas and water 1,736,378 1,744,441 Insurance 983,329 990,209 Advertisement 78,450 36,100 Depreciation 15.1 2,992,117 2,674,712 Others 643,180 276,809 63,487,124 57,045,867
Notes to the Financial StatementsFor the year ended June 30, 2016
47 Annual Report 2016
Note

28.1 This includes employee benefits amounting to Rs. 2.368 million (2015: Rs.2.357 million). 2016 2015 (Rupees) (Rupees) 28.2 Auditors’ remuneration
Audit fee 660,000 660,000 Half yearly review 137,500 137,500 Code of corporate governance review 82,500 82,500 880,000 880,000
29 OTHER OPERATING EXPENSES
Exchange loss 522,704 - Loss on disposal of property, plant and equipment 15.3 1,737,369 - Loss on investments at fair value - 203,214 Provision for workers’ profit participation fund 7,106,857 2,229,640 Provision for workers’ welfare fund 2,700,606 847,263 Others 12,234 676,651 12,079,769 3,956,768 30 OTHER OPERATING INCOME
Profit on investments at fair value 37,940 - Gain on sale of investments 30,565 1,339,966 Dividend income 55,728 61,686 Profit on bank deposits 19,656 20,485 Gain on disposal of property, plant and equipment - 2,128,801 Amortization of interest free loan - 183,997,305 Other Income - fair price shop 4,857,263 5,557,103 Others 5,905,620 9,627,829 10,906,772 202,733,175
Notes to the Financial StatementsFor the year ended June 30, 2016
48Zephyr Textiles Limited
Note

2016 2015 (Rupees) (Rupees) 31 FINANCE COST Mark-up on long term financing 38,817,384 44,350,853 Mark-up on short term borrowings 34,504,736 80,478,971 Interest on Workers’ Profit Participation Fund 11.1 3,325,898 3,510,821 Bank charges and others 9,838,957 14,434,981 Unwinding of discount 39,846,657 23,564,897 126,333,632 166,340,523
32 TAXATION
Provision for taxation- current 32.1 39,572,850 37,959,061 Deferred taxation 32.2 (14,277,717) (15,512,587) 25,295,132 22,446,473
32.1 The Company is under the ambit of final tax up to the extent of export sales under Section 169 of Income Tax Ordinance 2001. Provision for income tax is made accordingly. Income tax provision for income which is not subject to final tax under Section 169 of Income Tax Ordinance, 2001 has been calculated in accordance with Section 113 of the Income Tax Ordinance, 2001. No provision for deferred tax has been charged except as explained in note 10.
32.2 This represents deferred tax associated with surplus on revaluation of property, plant and equipment transferred to retained earnings on account of incremental depreciation.
32.3 Reconciliation of tax expense and product of accounting profit multiplied by the applicable tax rate is not required in view of presumptive taxation.
33 EARNING/(LOSS) PER SHARE - BASIC AND DILUTED
Earnings attributable to ordinary shareholders 107,034,539 203,066,728 Weighted average number of ordinary shares 6 59,428,729 59,428,729 1.80 3.42
33.1 There is no dilutive effect on the basic earning per share.
Notes to the Financial StatementsFor the year ended June 30, 2016
49 Annual Report 2016
Note
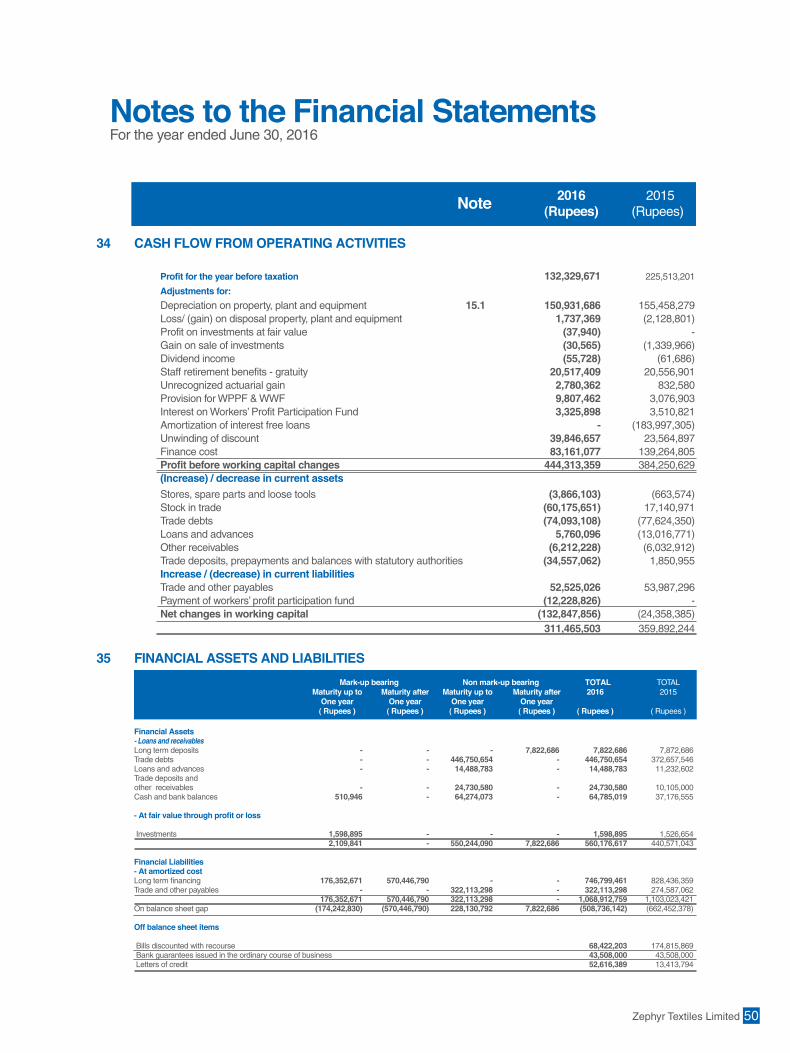
Notes to the Financial StatementsFor the year ended June 30, 2016
2016 2015 (Rupees) (Rupees)
34 CASH FLOW FROM OPERATING ACTIVITIES
Profit for the year before taxation 132,329,671 225,513,201
Adjustments for:
Depreciation on property, plant and equipment 15.1 150,931,686 155,458,279 Loss/ (gain) on disposal property, plant and equipment 1,737,369 (2,128,801) Profit on investments at fair value (37,940) - Gain on sale of investments (30,565) (1,339,966) Dividend income (55,728) (61,686) Staff retirement benefits - gratuity 20,517,409 20,556,901 Unrecognized actuarial gain 2,780,362 832,580 Provision for WPPF & WWF 9,807,462 3,076,903 Interest on Workers’ Profit Participation Fund 3,325,898 3,510,821 Amortization of interest free loans - (183,997,305) Unwinding of discount 39,846,657 23,564,897 Finance cost 83,161,077 139,264,805 Profit before working capital changes 444,313,359 384,250,629 (Increase) / decrease in current assets Stores, spare parts and loose tools (3,866,103) (663,574) Stock in trade (60,175,651) 17,140,971 Trade debts (74,093,108) (77,624,350) Loans and advances 5,760,096 (13,016,771) Other receivables (6,212,228) (6,032,912) Trade deposits, prepayments and balances with statutory authorities (34,557,062) 1,850,955 Increase / (decrease) in current liabilities
Trade and other payables 52,525,026 53,987,296 Payment of workers’ profit participation fund (12,228,826) - Net changes in working capital (132,847,856) (24,358,385) 311,465,503 359,892,244 35 FINANCIAL ASSETS AND LIABILITIES
Mark-up bearing Non mark-up bearing TOTAL TOTAL Maturity up to Maturity after Maturity up to Maturity after 2016 2015 One year One year One year One year ( Rupees ) ( Rupees ) ( Rupees ) ( Rupees ) ( Rupees ) ( Rupees )
Financial Assets - Loans and receivables Long term deposits - - - 7,822,686 7,822,686 7,872,686 Trade debts - - 446,750,654 - 446,750,654 372,657,546 Loans and advances - - 14,488,783 - 14,488,783 11,232,602 Trade deposits and other receivables - - 24,730,580 - 24,730,580 10,105,000 Cash and bank balances 510,946 - 64,274,073 - 64,785,019 37,176,555 - At fair value through profit or loss
Investments 1,598,895 - - - 1,598,895 1,526,654 2,109,841 - 550,244,090 7,822,686 560,176,617 440,571,043 Financial Liabilities
- At amortized cost Long term financing 176,352,671 570,446,790 - - 746,799,461 828,436,359
Trade and other payables - - 322,113,298 - 322,113,298 274,587,062 176,352,671 570,446,790 322,113,298 - 1,068,912,759 1,103,023,421 On balance sheet gap (174,242,830) (570,446,790) 228,130,792 7,822,686 (508,736,142) (662,452,378) Off balance sheet items
Bills discounted with recourse 68,422,203 174,815,869 Bank guarantees issued in the ordinary course of business 43,508,000 43,508,000 Letters of credit 52,616,389 13,413,794
50Zephyr Textiles Limited
Note

36 FINANCIAL RISK MANAGEMENT
Effective interest rates
Financial liabilities
Long term financing 6.35% to 8.01% (2015: 6% to 11.69%) per annum Short term borrowings 3.50% to 8.48% (2015: 6% to 12.21%) per annum 36.1 Financial risk factors
The Company has exposures to the following risks from its use of financial instruments: - Credit risk - Liquidity risk
- Market risk (Currency risk, other price risk and interest rate risk)
The Board of Directors has overall responsibility for the establishment and oversight of Company’s risk management framework. The Board is also responsible for developing and monitoring the Company’s risk management policies.
Concentration and management of credit risk
Credit risk represents the accounting loss that would be recognized at the reporting date if counter parties fail completely to perform as contracted.
Credit risk from cash and cash equivalents, derivative financial instruments and deposits with banks and financial institution, as well as credit exposures to customers, including trade receivables and committed transactions. Out of total financial assets of Rs. 560.177 million (2015: Rs. 440.571 million), the financial assets that are subject to credit risk amounted to Rs. 493.793 million (2015: Rs. 401.868 million).
For trade receivables, internal risk assessments process determines the credit quality of the customer, taking into account its financial position, past experience and other factors. Individual risk limits are set based on internal and external ratings in accordance with the limits set by the management. The utilization of credit limit is regularly monitored. Accordingly, the credit risk is minimal and the Company also believes that it is not exposed to major concentration of credit risk.
Concentration of the credit risk arises when the number of counter parties engaged in similar business activities or have similar economic features that would cause their abilities to meet contractual obligation to be similarly effected by the changes in economic, political or other conditions. The Company believes that it is not exposed to major concentration risk.
The Company monitors the credit quality of the financial assets with reference to the historical performance of such assets and available external credit ratings. The carrying value of financial assets which are neither past due nor impaired are as under: 2016 2015
(Rupees) (Rupees)
Long term deposits 7,822,686 7,872,686 Trade debts 446,750,654 372,657,546 Loans and advances 14,488,783 11,232,602 Trade deposits and other receivables 24,730,580 10,105,000 Bank balances 63,263,767 36,514,185 557,056,470 438,382,019
Notes to the Financial StatementsFor the year ended June 30, 2016
51 Annual Report 2016
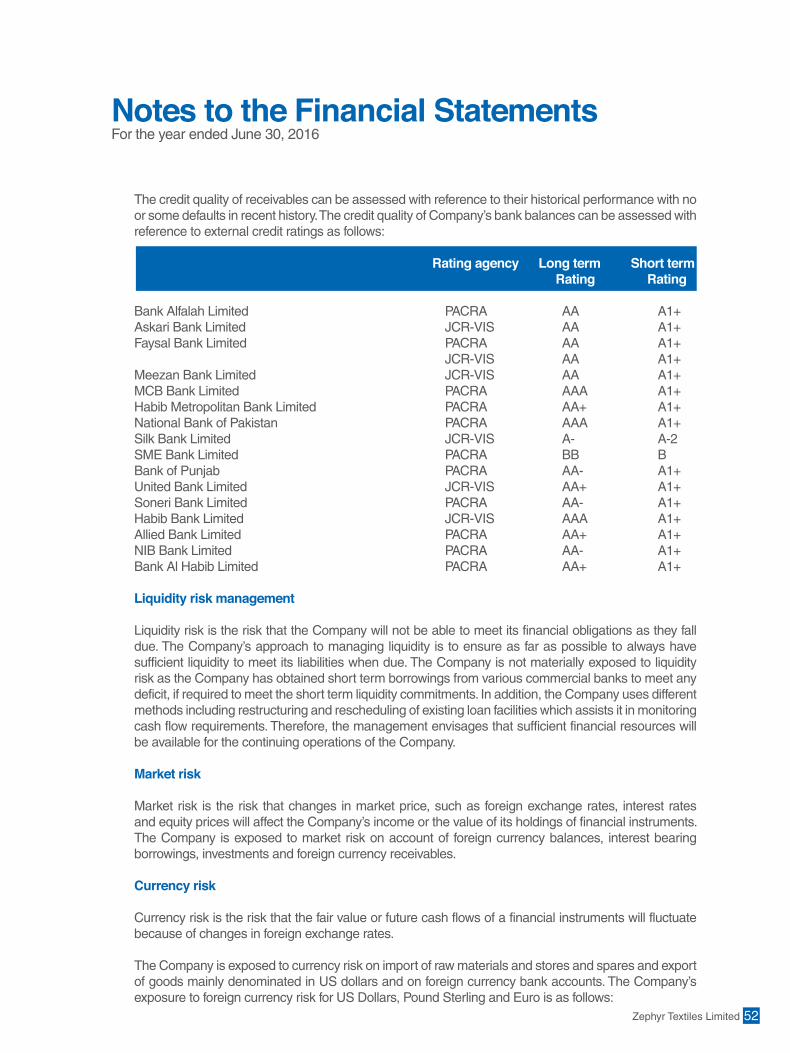
The credit quality of receivables can be assessed with reference to their historical performance with no or some defaults in recent history. The credit quality of Company’s bank balances can be assessed with reference to external credit ratings as follows:
Rating agency Long term Short term Rating Rating
Bank Alfalah Limited PACRA AA A1+ Askari Bank Limited JCR-VIS AA A1+ Faysal Bank Limited PACRA AA A1+ JCR-VIS AA A1+ Meezan Bank Limited JCR-VIS AA A1+ MCB Bank Limited PACRA AAA A1+ Habib Metropolitan Bank Limited PACRA AA+ A1+ National Bank of Pakistan PACRA AAA A1+ Silk Bank Limited JCR-VIS A- A-2 SME Bank Limited PACRA BB B Bank of Punjab PACRA AA- A1+ United Bank Limited JCR-VIS AA+ A1+ Soneri Bank Limited PACRA AA- A1+ Habib Bank Limited JCR-VIS AAA A1+ Allied Bank Limited PACRA AA+ A1+ NIB Bank Limited PACRA AA- A1+ Bank Al Habib Limited PACRA AA+ A1+
Liquidity risk management Liquidity risk is the risk that the Company will not be able to meet its financial obligations as they fall
due. The Company’s approach to managing liquidity is to ensure as far as possible to always have sufficient liquidity to meet its liabilities when due. The Company is not materially exposed to liquidity risk as the Company has obtained short term borrowings from various commercial banks to meet any deficit, if required to meet the short term liquidity commitments. In addition, the Company uses different methods including restructuring and rescheduling of existing loan facilities which assists it in monitoring cash flow requirements. Therefore, the management envisages that sufficient financial resources will be available for the continuing operations of the Company.
Market risk
Market risk is the risk that changes in market price, such as foreign exchange rates, interest rates and equity prices will affect the Company’s income or the value of its holdings of financial instruments. The Company is exposed to market risk on account of foreign currency balances, interest bearing borrowings, investments and foreign currency receivables.
Currency risk
Currency risk is the risk that the fair value or future cash flows of a financial instruments will fluctuate because of changes in foreign exchange rates.
The Company is exposed to currency risk on import of raw materials and stores and spares and export of goods mainly denominated in US dollars and on foreign currency bank accounts. The Company’s exposure to foreign currency risk for US Dollars, Pound Sterling and Euro is as follows:
Notes to the Financial StatementsFor the year ended June 30, 2016
52Zephyr Textiles Limited

Notes to the Financial StatementsFor the year ended June 30, 2016
2016 2015 (Rupees) (Rupees)
Foreign debtors 64,476,601 54,402,352 Foreign currency bank account 492,652 602,019 Gross balance sheet exposure 64,969,253 55,004,371 Letters of credit 52,616,389 13,413,794 117,585,642 68,418,165
Average rate Reporting date rate 2016 2015 2016 2015 Rupees per USD 104.08 101.31 104.29 101.50
Rupees per Euro 115.16 120.86 115.85 113.57 Rupees per Pound Sterling 153.22 159.50 139.83 159.59
As at reporting date, had the exchange of USD, Euro and Pound Sterling depreciated or appreciated
by 10% against the currency with all other variables held constant, the change in post tax profit/(loss), mainly as a result of foreign exchange gain/(loss) on translation of foreign currency denominated payables, would have been as follows:
30-Jun-16 30-Jun-15 % Change (+ -)̀ Impact (+ -) % Change (+ -) Impact (+ -)
Effect on profit or loss
USD 10 1,461,639 10 580,732 Euro 10 4,983,495 10 4,362,051 Pound Sterling 10 2,526 10 497,452
The sensitivity analysis prepared is not necessarily indicative of the effects on profit/(loss) for the year
and assets/liabilities of the Company. Interest rate risk
Interest rate risk is the risk that the value of a financial instrument will fluctuate due to changes in the market interest rate.
At the reporting date the variable interest rate profile of the Company’s significant interest bearing financial instruments was as follows:
2016 2015 2016 2015 Effective interest rate % Carrying value in Rupees
Long term financing 6.35% to 8.01% 6% to 11.69% 746,799,461 828,436,359 Short term financing 3.50% to 8.48% 6% to 12.21% 710,417,398 604,897,441
53 Annual Report 2016

Cash flow sensitivity analysis for variable rate instruments
A change of 100 basis points in interest rates at the reporting date would have decreased/(increased) loss for the year by the amounts shown below. This analysis assumes that all other variables, in particular foreign currency rates, remain constant. The analysis is performed on the same basis for 2015. Profit and loss 100 bps
Increase decrease
As at 30 June 2016 Cash flow sensitivity-Variable rate financial liabilities 14,572,169 (14,572,169)
As at 30 June 2015 Cash flow sensitivity-Variable rate financial liabilities 14,333,338 (14,333,338)
The sensitivity analysis prepared is not necessarily indicative of the effects on loss for the year and assets/ liabilities of the Company.
Past due balances 2016 2015 (Rupees) (Rupees) The aging of trade receivable at the reporting date is:
Past due 1-30 days 404,470,534 342,368,302 Past due 30-150 days 32,587,868 11,837,463 Past due 150 days 9,692,252 18,451,781 446,750,654 372,657,546
36.2 Capital risk management
The Company’s objectives when managing capital are to safeguard the entity’s ability to continue as a going concern, so that it can continue to provide adequate returns for shareholders and benefits for other stakeholders, and to maintain a strong capital base to support the sustained development of its business.
The Company manages its capital structure which comprises capital and reserves by monitoring return on net assets and makes adjustments to it in the light of changes in economic conditions. In order to maintain or adjust the capital structure, the Company may adjust the amount of dividend paid to shareholders, appropriation of amounts to capital reserves or/and issue new shares, as the case may be.
Consistent with others in the industry, the Company manages its capital risk by monitoring its debt
levels and liquid assets and keeping in view future investment requirements and expectations of the shareholders. Debt is calculated as total borrowings (“long term financing” and “short term borrowings” as shown in the balance sheet). Total capital comprises shareholders’ equity as shown in the balance sheet under “share capital and reserves” and net debt.
Notes to the Financial StatementsFor the year ended June 30, 2016
54Zephyr Textiles Limited

The salient information relating to capital risk management of the Company as of June 30, 2016 and 2015 were as follows:
2016 2015 (Rupees) (Rupees)
Total borrowings 1,457,216,859 1,433,333,800 Cash and bank balances (64,785,019) (37,176,555) 1,392,431,840 1,396,157,245 Total equity 963,999,585 847,584,037 2,356,431,425 2,243,741,282 Gearing ratio % 59.09 62.22
37 REMUNERATION OF CHIEF EXECUTIVE, DIRECTORS AND EXECUTIVES
2016 2015 Description Chief Executive Directors Executives Chief Executive Directors Executives
Managerial remuneration 2,000,000 2,110,200 17,039,329 2,000,000 2,540,000 12,592,267 House rent allowance 800,000 800,000 6,815,732 800,000 1,016,000 5,036,907 Utilities 200,000 200,000 1,703,933 200,000 254,000 1,259,227 3,000,000 3,110,200 25,558,994 3,000,000 3,810,000 18,888,401 No. of persons 1 2 27 1 3 22
37.1 Some of the Directors and the Executives are provided with free use of Company cars as
per rules. 37.2 No meeting fee was paid to the Directors for attending the meetings of the Board. 37.3 Gratuity expense related to Directors is classified under note 28.
38 TRANSACTIONS WITH RELATED PARTIES
There were no related parties other than those as disclosed in note # 37 above.
2016 2015 (Number) (Number)
39 PLANT CAPACITY AND PRODUCTION Grieg fabric unit No. of looms installed 251 251
No. of looms worked 251 251 Shifts per day 3 3 No. of days actually worked 366 365 Installed capacity (square meters in millions @ 50 picks) 95.51 95.51 Actual production (square meters in millions @ 50 picks) 77.80 70.50
Notes to the Financial StatementsFor the year ended June 30, 2016
55 Annual Report 2016

2016 2015 (Number) (Number)
Towel unit
No. of looms installed 30 30 No. of looms worked 30 30 Shifts per day 3 3 No. of days actually worked 366 365 Installed capacity (Tons) 4,074 4,074 Actual production (Tons) 2,782 2,386
Towel dyeing and processing unit
Installed capacity (Tons) 3,600 3,600 Actual production (Tons) 2,525 2,448
39.1 It is difficult to determine precisely the production capacity in textile weaving mills since it fluctuates widely depending on various factors such as speed, width and construction of cloth woven etc.
40 NUMBER OF EMPLOYEES Number of employees as on June 30, 1,104 1,026
Average number of employees during the year 1,064 1,028
41 AUTHORIZATION OF FINANCIAL STATEMENTS
These financial statements have been approved by the Board of Directors of the Company and authorised for issue on September 21, 2016.
42 CORRESPONDING FIGURES
Previous year figures have been re-arranged and re-classified, wherever, necessary for the purpose of comparison.
43 FIGURES
Figures have been rounded off to the nearest Rupee.
Notes to the Financial StatementsFor the year ended June 30, 2016
CHIEF EXECUTIVE DIRECTOR
56Zephyr Textiles Limited

AffixRevenueStamps of
Rs. 5/-
6
57Zephyr Textiles Limited
6 0
8