zebris FDM 1 - hpcosmos.com · Foreword Textrelease R2 zebris FDM 1.12 8 18/06/2015 Software User...
178
zebris FDM 1.12 Software User Manual Textrelease R2, 18/06/2015 zebris Medical GmbH | Max-Eyth-Weg 43 | D-88316 Isny im Allgäu Telefon: +49 (0)7562 9726 - 0 | Telefax: +49 (0)7562 9726 - 50 | eMail: [email protected] Telefon Support: +49 (0)7562 9726 - 300 | Fax Support: +49 (0)7562 9726 - 50 | eMail: [email protected]
-
Upload
nguyennhan -
Category
Documents
-
view
225 -
download
0
Transcript of zebris FDM 1 - hpcosmos.com · Foreword Textrelease R2 zebris FDM 1.12 8 18/06/2015 Software User...
zebris FDM 1.12
Software User Manual
Textrelease R2, 18/06/2015
zebris Medical GmbH | Max-Eyth-Weg 43 | D-88316 Isny im Allgäu
Telefon: +49 (0)7562 9726 - 0 | Telefax: +49 (0)7562 9726 - 50 | eMail: [email protected]
Telefon Support: +49 (0)7562 9726 - 300 | Fax Support: +49 (0)7562 9726 - 50 | eMail: [email protected]

Foreword
Textrelease R2 zebris FDM 1.12 2 18/06/2015 Software User Manual
1 Contents
2 Foreword ........................................................................................................................ 7
2.1 Manufacture ............................................................................................................ 8
2.2 Sales ....................................................................................................................... 8
2.3 Support ................................................................................................................... 8
2.4 Conventions and symbols used ............................................................................... 9
3 Installation .....................................................................................................................10
3.1 System requirements .............................................................................................10
3.2 Installing the zebris FDM software ..........................................................................11
3.2.1 Step-by-step installation ..................................................................................11
3.3 Activating the software ...........................................................................................13
3.3.1 Entering the license code ................................................................................13
3.3.2 Activation ........................................................................................................13
3.4 Installing the zebris device drivers ..........................................................................14
3.4.1 zebris USB driver ............................................................................................14
3.4.2 SYNCCam driver .............................................................................................15
4 The Patient Database ....................................................................................................18
4.1 Data Backup...........................................................................................................18
4.2 Information and Navigation .....................................................................................19
4.3 Patients ..................................................................................................................19
4.4 About zebris FDM ..................................................................................................21
4.5 Recordings .............................................................................................................21
4.6 Functions ...............................................................................................................22
4.7 Patient file / New patient .........................................................................................23
4.7.1 Properties ........................................................................................................24
4.7.2 Labels .............................................................................................................24
4.7.3 Comments & Clips ..........................................................................................27
4.7.4 Inserting the text clip .......................................................................................28
4.8 Details of the recording ..........................................................................................29
4.9 Import of data .........................................................................................................30
4.9.1 Data formats ...................................................................................................31
4.10 Data Export ............................................................................................................32
4.11 Program settings ....................................................................................................33
4.11.1 Smartcard (Card reader) .................................................................................34

Foreword
Textrelease R2 zebris FDM 1.12 3 18/06/2015 Software User Manual
4.11.2 Export (Always export to the same location) ....................................................35
5 Module selection ...........................................................................................................37
6 Hardware setup (device settings) ..................................................................................38
6.1 Force measuring platforms, instrumented treadmills ..............................................40
6.2 Cameras ................................................................................................................40
6.2.1 DV-Camcorder (FireWire) ...............................................................................41
6.2.2 SYNCCam (USB) ............................................................................................42
7 Gait Analysis .................................................................................................................44
7.1 Preparing the measurement (Measurement settings) .............................................44
7.2 Carry out measurement (Measuring mode) ............................................................45
7.3 Processing the measurement (View mode) ............................................................48
7.3.1 Basics .............................................................................................................48
7.3.2 Functions ........................................................................................................51
7.3.3 Visualization of the load distribution ................................................................52
7.3.4 Selecting a certain interval for analysis in the Report ......................................53
7.4 Gait Analysis Report (Report mode) .......................................................................55
7.4.1 Functions ........................................................................................................57
7.4.2 Description of the Report contents ..................................................................58
7.4.3 Explanation of gait parameters ........................................................................60
7.4.4 Explanation of the butterfly diagram ................................................................63
7.4.5 Force & Pressure ............................................................................................65
7.4.6 Three foot zone analysis .................................................................................66
7.4.7 Video ...............................................................................................................67
7.4.8 Comments .......................................................................................................67
7.4.9 Comparing two measurements ........................................................................68
7.4.10 Help for evaluating the data acquired ..............................................................68
8 Stance analysis .............................................................................................................69
8.1 Carry out measurement (Measuring mode) ............................................................69
8.2 Processing the measurement (View mode) ............................................................73
8.2.1 Visualization of the pressure distribution .........................................................74
8.2.2 Selecting an interval for analysis in the Report ................................................75
8.2.3 Functions ........................................................................................................78
8.3 Stance Analysis Report (Report mode) ..................................................................80
8.3.1 Functions ........................................................................................................81
8.3.2 Description of the Report contents ..................................................................82
8.3.3 Comparing two measurements ........................................................................85

Foreword
Textrelease R2 zebris FDM 1.12 4 18/06/2015 Software User Manual
8.3.4 Help for evaluating the data acquired ..............................................................86
9 Visual Cueing ................................................................................................................87
9.1 Preparation ............................................................................................................87
9.1.1 Setting the screen output ................................................................................87
9.1.2 Static calibration ..............................................................................................88
9.2 Carrying out the training (Measuring mode) ...........................................................91
9.2.1 Preparation for training ....................................................................................93
9.3 Processing the measurement (View mode) ............................................................99
9.3.1 Basics .............................................................................................................99
9.3.2 Functions ...................................................................................................... 102
9.3.3 Visualization of the load distribution .............................................................. 103
9.3.4 Selecting a certain interval for analysis in the Report .................................... 104
9.4 Visual Cueing Report (Report mode) .................................................................... 107
9.4.1 Functions ...................................................................................................... 108
9.4.2 Description of the Report contents ................................................................ 109
9.4.3 Explanation of gait parameters ...................................................................... 110
9.4.4 Comparing two measurements ...................................................................... 111
10 Roll-off analysis ....................................................................................................... 112
10.1 Preparing the measurement (Measurement settings) ........................................... 112
10.2 Carry out measurement (Measuring mode) .......................................................... 113
10.3 Processing the measurement (View mode) .......................................................... 115
10.3.1 Basics ........................................................................................................... 115
10.3.2 Functions ...................................................................................................... 117
10.3.3 Visualization of the load distribution .............................................................. 119
10.3.4 Selecting a certain interval for analysis in the Report .................................... 119
10.4 Roll-off analysis Report (Report mode) ................................................................. 122
10.4.1 Functions ...................................................................................................... 123
10.4.2 Description of the Report contents ................................................................ 124
10.4.3 Force & Pressure .......................................................................................... 126
10.4.4 Three foot zone analysis ............................................................................... 127
10.4.5 Video ............................................................................................................. 128
10.4.6 Comments ..................................................................................................... 128
10.4.7 Comparing two measurements ...................................................................... 129
10.4.8 Help for evaluating the data acquired ............................................................ 129
11 Virtual Training......................................................................................................... 130
11.1.1 Carrying out the Virtual Training (Measuring Mode) ...................................... 130

Foreword
Textrelease R2 zebris FDM 1.12 5 18/06/2015 Software User Manual
11.1.2 Explanation of the obstacles .......................................................................... 133
11.2 Processing the measurement (View mode) .......................................................... 134
11.2.1 Basics ........................................................................................................... 134
11.2.2 Functions ...................................................................................................... 137
11.2.3 Visualization of the load distribution .............................................................. 138
11.2.4 Selecting a certain interval for analysis in the Report .................................... 139
11.3 Gait Analysis Report (Report mode) ..................................................................... 142
11.3.1 Functions ...................................................................................................... 143
11.3.2 Description of the Report contents ................................................................ 144
11.3.3 Explanation of gait parameters ...................................................................... 146
11.3.4 Explanation of the butterfly diagram .............................................................. 149
11.3.5 Force & Pressure .......................................................................................... 151
11.3.6 Three foot zone analysis ............................................................................... 152
11.3.7 Video ............................................................................................................. 153
11.3.8 Comments ..................................................................................................... 153
11.3.9 Comparing two measurements ...................................................................... 154
11.3.10 Help for evaluating the data acquired ........................................................ 154
11.4 Level Editor .......................................................................................................... 155
11.4.1 Automatic setting of a Level .......................................................................... 157
11.4.2 Basic information on the Level Editor ............................................................ 157
11.5 Setup ................................................................................................................... 159
12 Troubleshooting ....................................................................................................... 160
12.1 SYNCCam ........................................................................................................... 160
12.2 Forceplate/Treadmill ............................................................................................. 160
12.3 General ................................................................................................................ 162
12.4 FDM-T System ..................................................................................................... 163
13 Import Interfaces ...................................................................................................... 164
13.1 GDT ..................................................................................................................... 165
13.2 PAEDUS .............................................................................................................. 166
13.3 Rothballer ............................................................................................................. 167
14 Export Interfaces ...................................................................................................... 169
14.1 zebris-own formats ............................................................................................... 169
14.1.1 CSV .............................................................................................................. 169
14.2 JPG ...................................................................................................................... 169
14.2.1 Video export .................................................................................................. 170
14.2.2 XML .............................................................................................................. 171
Foreword
Textrelease R2 zebris FDM 1.12 6 18/06/2015 Software User Manual
14.2.3 XML (raw data) .............................................................................................. 173
14.3 Formats of third-party providers............................................................................ 174
14.3.1 APD-Export ................................................................................................... 174

Foreword
Textrelease R2 zebris FDM 1.12 7 18/06/2015 Software User Manual
2 Foreword
Welcome to the User Manual of the zebris FDM Software.
This User Manual provides you the basic knowledge for operating the Software. It explains
the installation and gives suggestions for preparing the measuring procedure and data
recording.
Please additionally note the information relating to safety in the Technical Manual and please
ensure to keep all the manuals directly next to the measuring system. The Operating Manual
is an integral part of the product and will help you to operate the measuring system in
accordance with the instructions.
The zebris Medical GmbH does not assume any liability whatsoever for injury to personnel or
patients, or damage to the system, caused by non-observance of the information contained
in the manuals, or improper use of the Measuring System.
Should you become aware of any errors when using this User Manual, or should you have
any suggestions, we would be most grateful to receive your feedback at any time.
Registered trademarks
Different brand names are referred to in this Manual. All these product names are used only
for clarity’s sake, or for editorial reasons and are trademarks belonging to the respective
companies. When using brand names, the trademarks themselves and also the rights of the
respective proprietors shall remain unaffected thereby.
zebris is a registered trademark and FDM denotes a feature of the company zebris Medical
GmbH.
Copyright
This document and extracts taken from it may on no account be duplicated without the
explicit consent of zebris Medical GmbH. The content of this document may on no account
be used for purposes that have not undergone approval. An infringement of the copyright will
be prosecuted.
© zebris Medical GmbH, all rights reserved.

Foreword
Textrelease R2 zebris FDM 1.12 8 18/06/2015 Software User Manual
2.1 Manufacture
zebris Medical GmbH Max-Eyth-Weg 43 D-88316 Isny im Allgäu Germany
Telefon Telefax
eMail Internet
+49 (0)7562 9726 - 0 +49 (0)7562 9726 - 50 [email protected] www.zebris.de
2.2 Sales
zebris Medical GmbH Max-Eyth-Weg 43 D-88316 Isny im Allgäu Germany
Telefon Telefax
eMail Internet
+49 (0)7562 9726 - 0 +49 (0)7562 9726 - 50 [email protected] www.zebris.de
2.3 Support
zebris Medical GmbH Max-Eyth-Weg 43 D-88316 Isny im Allgäu Germany
Telefon Telefax
eMail Internet
+49 (0)7562 9726 - 300 +49 (0)7562 9726 - 50 [email protected] www.zebris.de
Foreword
Textrelease R2 zebris FDM 1.12 9 18/06/2015 Software User Manual
2.4 Conventions and symbols used
In this User Manual the foIlowing conventions are used.
Warnings are shown as follows:
Warnings indicate a potential hazard to the health and safety of the users and/or patients. The warnings describe the danger involved and how this can be avoided.
Important information is shown in the following way:
The warnings denote a potential hazard that can cause damage to, or destroy the device. The warnings describe the danger involved and how this can be avoided.
These warnings denote information that is relevant for taking measurements.
This User Manual is to be kept within easy reach so that the information it contains is
available to the user at all times.
Note on modifications
In order to guarantee the quality of our products, we continually endeavor to improve our
product line. It is possible that by the time this User Manual has been printed, the software
and hardware configuration have undergone a further update. Therefore it is possible that
some of the figures deviate from the product you have actually been supplied with.
Please note that there is not a new version of this manual for every new software release, as often new software releases have technical modifications invisible to the user.. The up-to-date version of the software manual can be obtained from the service area of our homepage.

Installation
Textrelease R2 zebris FDM 1.12 10 18/06/2015 Software User Manual
3 Installation
3.1 System requirements
Processor Intel Core i5 or equivalent
Working memory at least 4GB RAM
Hard drive at least 750GB of free space on the system drive
(required for the database, especially when recording video)
3D graphic card at least 1GB GDDR RAM, OpenGL 3.3, DirectX 9.0c
Display Color monitor with at least 1024x768 pixels resolution.
Your graphic card must be able to operate at the native
resolution of your display.
Ports 1 free USB port per zebris device
Operating system Windows 7 64bit/32bit or 8.1 64bit
System drivers .NET 4.0 or higher
DirectX 9.0c or higher
latest driver for your graphic card
Windows XP is not longer supported since zebris FDM version 1.12.
Installation
Textrelease R2 zebris FDM 1.12 11 18/06/2015 Software User Manual
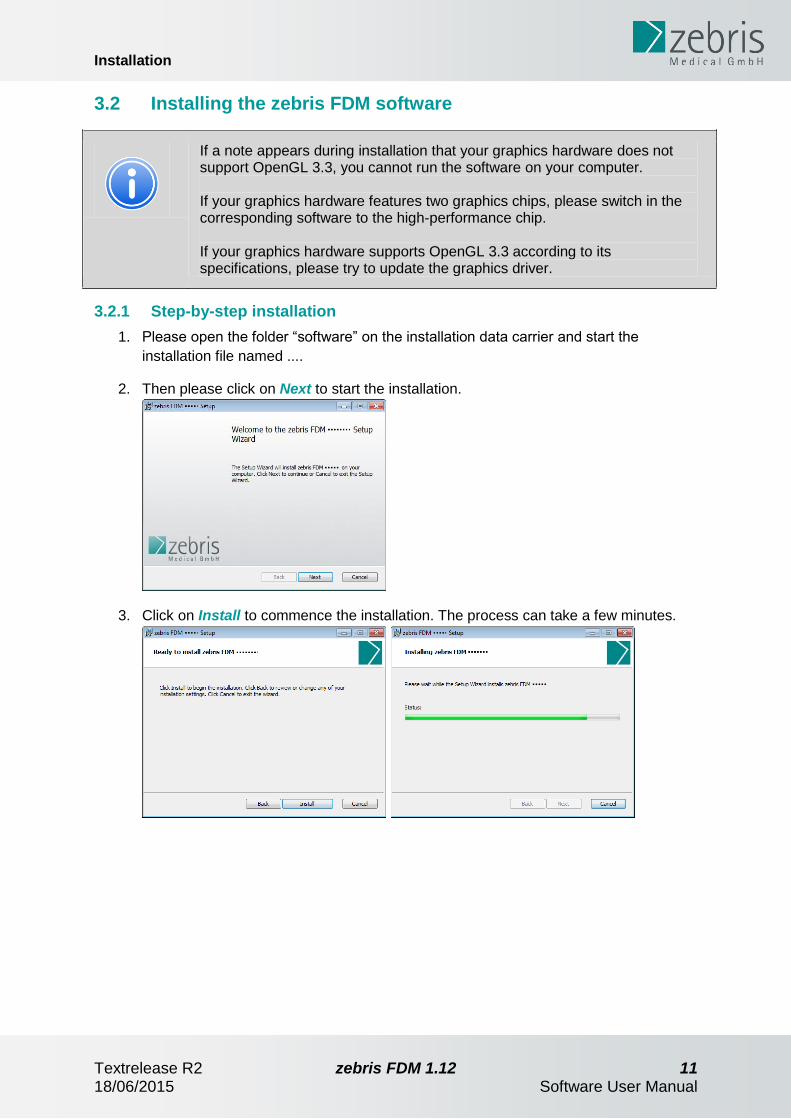
3.2 Installing the zebris FDM software
If a note appears during installation that your graphics hardware does not support OpenGL 3.3, you cannot run the software on your computer. If your graphics hardware features two graphics chips, please switch in the corresponding software to the high-performance chip. If your graphics hardware supports OpenGL 3.3 according to its specifications, please try to update the graphics driver.
3.2.1 Step-by-step installation
1. Please open the folder “software” on the installation data carrier and start the
installation file named ....
2. Then please click on Next to start the installation.
3. Click on Install to commence the installation. The process can take a few minutes.

Installation
Textrelease R2 zebris FDM 1.12 12 18/06/2015 Software User Manual
4. Once the installation has been set up, the following display appears. Click on Finish
to complete the installation.
The software is now installed. A symbol with the designation zebris FDM has been created
on the desktop. To start the software you can either double-click on this symbol, or start
using the program group Start >> Programs >> Zebris >> zebris FDM.

Installation
Textrelease R2 zebris FDM 1.12 13 18/06/2015 Software User Manual
3.3 Activating the software
The installation file comprises a module selection for the unlimited use of 30 starts,
afterwards the software has to be activated.
The activation of the software can either be done by internet or via phone/fax/email.
3.3.1 Entering the license code
First the license code (eight-digit, e.g. 1234-5678) must be entered, which you purchased
together with the software.
3.3.2 Activation
Afterwards you have two possibilities of activation as described in the following.

Installation
Textrelease R2 zebris FDM 1.12 14 18/06/2015 Software User Manual
Via internet
The activation is done completely automatically after verification of the activation ID that has
been transmitted through the software before and comparison with the registered licenses. In
case a negative verification occurs, a corresponding note appears.
Offline
Activation is done offline via transmitting the activation ID that is displayed by the software
through phone/fax/email/mail.
1. A 20-digit activation code (see figure above) is displayed. Please transmit this code to
your qualified zebris dealer.
2. Afterwards you receive a license file, which you make available for example using a
USB stick on the computer that shall be activated.
3. Afterwards you click on „load license file“ in the dialog window displayed above,
select the received license file and confirm. After an automatic restart of the software,
the activation is complete.
Please note that the activation is done per computer (work station) and that the number of activations is restricted to 3 work stations. Further activations can be purchased upon request at your qualified zebris dealer.
3.4 Installing the zebris device drivers
Drivers are available on the installation file carrier in the file Drivers. When required, please start the installation as described in the following paragraphs.
3.4.1 zebris USB driver
The zebris USB driver required for the measuring platform is installed in the background.
Please only install the USB driver separately when your PC cannot find the device resp. on
demand of our support staff.

Installation
Textrelease R2 zebris FDM 1.12 15 18/06/2015 Software User Manual
3.4.2 SYNCCam driver
The installation of the driver is only recommended in case you have problems with standard Windows drivers (e.g. display failures, speed problems) or when you are using two and more SYNCCams at the same time.
1. The installation files are automatically transferred to your computer. The process can
take a few minutes.
2. Select the language and then click on Next to continue the installation.
3. Connect your SYNCCam using a free USB port and then click on Next

Installation
Textrelease R2 zebris FDM 1.12 16 18/06/2015 Software User Manual
4. To continue the installation click on Next
5. The installation of the driver software can take a few minutes.
6. After successful installation you will see a live display of the connected camera. If the
live display does not appear, please install the driver again.
7. Once the installation has been set up, the following display appears. Click on Finish
to complete the installation. If you are asked to re-start your computer, please do so
accordingly.

Installation
Textrelease R2 zebris FDM 1.12 17 18/06/2015 Software User Manual
When using several cameras, the driver installation does not, as a rule, have to be carried out again. If problems arise for displaying the cameras in the program, please then carry out this driver installation once again to ensure the correct function of the cameras.

The Patient Database
Textrelease R2 zebris FDM 1.12 18 18/06/2015 Software User Manual
4 The Patient Database
After starting the program you are in the Patient Database.
Here you can manage the patients as well as previous measurements and have access to
import and export functions. In the following you will also find a detailed description on the
user interface.
4.1 Data Backup
The manufacturer zebris Medical GmbHexplicitly states, that the user is responsible for backing up his/her data and furthermore recommends to create a regular backup of the patient data base. The zebris FDMdatabase can be found in the user data folder
Windows 7 C:\ProgramData\zebris \zebris.fdm.data#
Windows XP C:\Documents and settings\All Users\application data\zebris \zebris.fdm.data#

The Patient Database
Textrelease R2 zebris FDM 1.12 19 18/06/2015 Software User Manual
4.2 Information and Navigation
Information
Help and instructions for using the software.
Navigation
Here you can see the section of the program you are actually in. The active section is marked in color, respectively.
4.3 Patients
List of patients
Here, the names of the patients are listed. The patient currently selected is marked in color.
Deleting a patient
After a separate confirmation, the patient is irretrievably deleted together with all the measurements assigned to him.
Searching the database for a patient
Using the function search the patient database can be searched for a specific patient through the input line. The search window can be faded out through pressing Esc or clicking again on “Search”.
Processing the patient file
With a single click on properties the patient file opens (see Patient file / New patient patient).
Selecting the filter function
By using the filter function, you determine which patients are shown in the list. Click on Set filter to call up the filter settings. Click on Cancel filter to display all patients (standard setting)
The Patient Database
Textrelease R2 zebris FDM 1.12 20 18/06/2015 Software User Manual
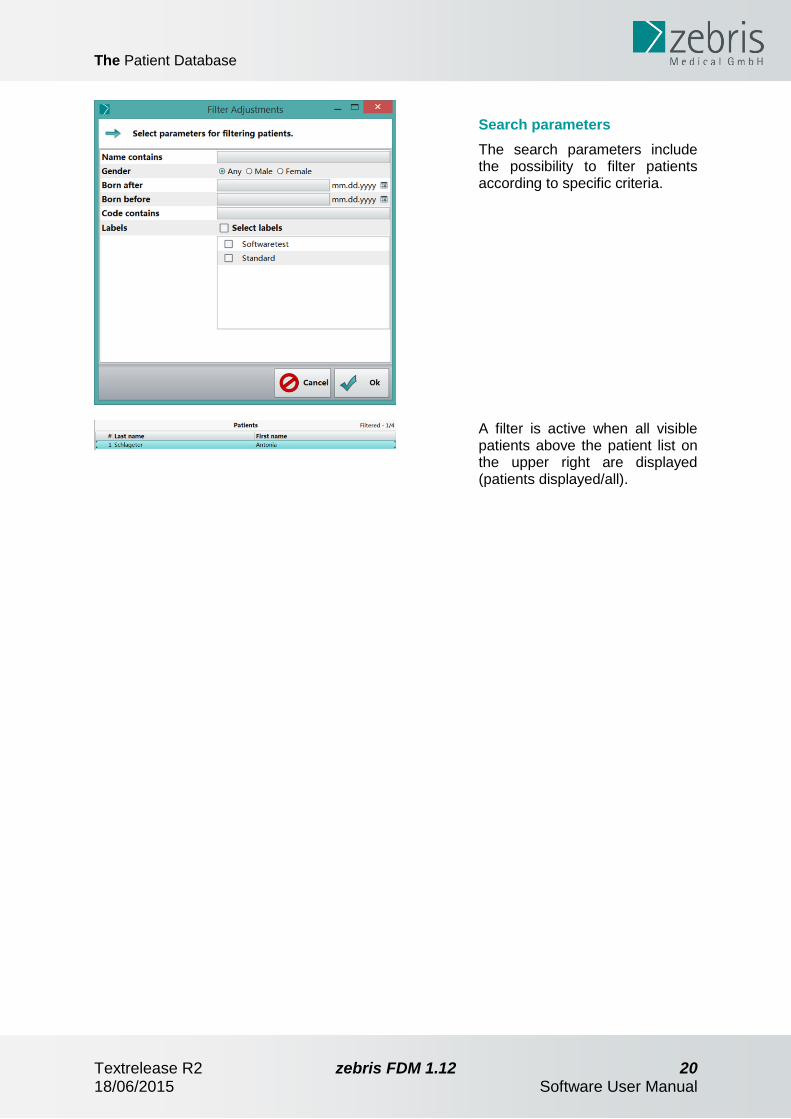
Search parameters
The search parameters include the possibility to filter patients according to specific criteria.
A filter is active when all visible patients above the patient list on the upper right are displayed (patients displayed/all).

The Patient Database
Textrelease R2 zebris FDM 1.12 21 18/06/2015 Software User Manual
4.4 About zebris FDM
View „About zebris FDM“
A click on the question mark opens
the window
Functional description
The functioning and the application of
the software are briefly described.
Software-related data
The software’s name, version and the
date of installation resp. the last
update as well as information on the
used operating system, the graphic
hardware and the active license are
displayed.
Manufacturer’s information
This field contains all relevant data on the software manufacturer
4.5 Recordings
List of recordings
Here all recordings of the patient are listed who has just been selected. The selected recording is marked in color.
Deleting a recording
After a separate confirmation, the selected measurement is irretrievably deleted.
Details of the recording
Here you can edit the description and comments on the recording (see Details of the recording).

The Patient Database
Textrelease R2 zebris FDM 1.12 22 18/06/2015 Software User Manual
4.6 Functions
Begin new measurement
With a single click you can select the measurement application.
Displaying the measurement & editing
The currently selected measurement is opened for viewing and editing.
Showing the measurement results
The measuring results of the measurement selected now are shown clearly. The report provides a print function and PDF export.
New patient
Click here to create an entry for a new patient.

The Patient Database
Textrelease R2 zebris FDM 1.12 23 18/06/2015 Software User Manual
4.7 Patient file / New patient
When you create a new patient or edit the file of an existing patient (button New or.
Properties), the following dialog appears:
In the following the individual fields and their function are briefly explained.

The Patient Database
Textrelease R2 zebris FDM 1.12 24 18/06/2015 Software User Manual
4.7.1 Properties
Patientdata
Please enter the patient data here: Obligatory fields are the first name and the surname as well as gender and date of birth. The box Code gives you the possibility of allocating the patient entry a unique identifying designation.
4.7.2 Labels
With this field you can allocate the patient to a group.
You will then have the possibility of showing only the patients of a certain group in the
database. Therefore, please select this/these group(s) in the filter settings (see Selecting the
filter function, p.19).
Creating a new label
Enter the name for the new group to be created here and click on Add.

The Patient Database
Textrelease R2 zebris FDM 1.12 25 18/06/2015 Software User Manual
The newly created group appears in the list. The tick to the left of it shows that the patient is allocated to this group.

The Patient Database
Textrelease R2 zebris FDM 1.12 26 18/06/2015 Software User Manual
Allocating a patient to several labels
By clicking on the tick you can carry out or cancel the allocation. Groups to which no patients are allocated any longer disappear automatically after closing the dialog.
The Patient Database
Textrelease R2 zebris FDM 1.12 27 18/06/2015 Software User Manual
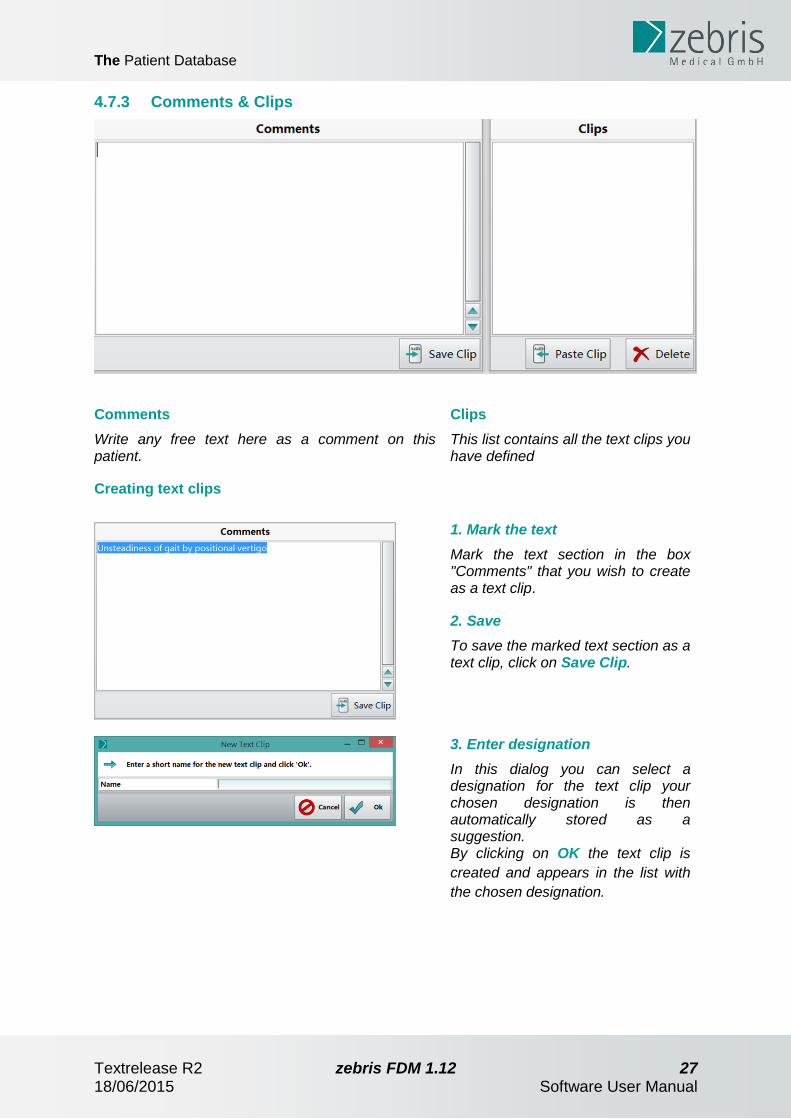
4.7.3 Comments & Clips
Comments
Write any free text here as a comment on this patient.
Clips
This list contains all the text clips you have defined
Creating text clips
1. Mark the text
Mark the text section in the box "Comments" that you wish to create as a text clip.
2. Save
To save the marked text section as a text clip, click on Save Clip.
3. Enter designation
In this dialog you can select a designation for the text clip your chosen designation is then automatically stored as a suggestion. By clicking on OK the text clip is
created and appears in the list with
the chosen designation.

The Patient Database
Textrelease R2 zebris FDM 1.12 28 18/06/2015 Software User Manual
4.7.4 Inserting the text clip
1. Determining the cursor position
Set the cursor by left-clicking at the position where
your text clip is to be inserted.
2. Inserting the selected text clip
Select a clip from the list with a left
click. This clip is then taken over to
its new position in the Comment box
by clicking on Paste Clip

The Patient Database
Textrelease R2 zebris FDM 1.12 29 18/06/2015 Software User Manual
4.8 Details of the recording
Call up this dialog by clicking on Properties on the right under the list of recordings.
You can change the description of the recording and also add a recording comment (see
Comments & Clips , p.27). Text modules are stored separately from those in the Patient File.

The Patient Database
Textrelease R2 zebris FDM 1.12 30 18/06/2015 Software User Manual
4.9 Import of data
You can import existing patient and measuring data of different formats into the database.
The exact procedure in doing so is explained below:
1. Import...
Click on the button Store/Restore at the bottom right in the toolbar.
2. Restore
Select Restore backup in order to import the desired data to your database.
3. Browsing for & selecting data
Search for data records, that you would like to import, on your hard disk resp. other storage media connected to your computer. It depends on the format which files you have to select. More information (see Data formats, p.31).
4. Select data records
Place ticks in front of all data records, that you would like to import.. In order to import all patients of a group or a project, place the tick in the first column. If you would like to import all measurements of a patient, simply click on the tick in front of the patient's name. When clicking in a line with the patient name, all measurements of the patient are displayed on the right. You can then select them individually.

The Patient Database
Textrelease R2 zebris FDM 1.12 31 18/06/2015 Software User Manual
5. Results
After a successful data import the dialog shows you a summary of how many patients and measurements have been imported. Incorrect data records are shown in the list, as well as patients and measurements that have already been created and were therefore not imported Project names from the old software are allocated to the patients as a group with the prefix "Project".
Errors/Duplicates
If any errors occur while importing or if you would like to import data records, which already exist in your data base, a summary will be displayed informing you on the corresponding information.
4.9.1 Data formats
zebris' own data formats (.zebdb/.data)
If you would like to import data from older or new software packages, simply select the
corresponding file with the ending .zebdb resp. .data.
Old data (WinFDM/Win FDM-T)
You can import old measuring data from the software packages WinFDM and WinFDM-T into
this patient database.
The default paths to the database are
...for WinFDM-T „C:\Programs\zebris\WinFDM-T\Data\Database.db“
...for WinFDM „C:\Programs\zebris\WinFDM\Data\Database.db“
Alternatively you can also copy the whole folder "Data" from the old software, e.g. onto a
USB memory stick, and then import the data from this stick.

The Patient Database
Textrelease R2 zebris FDM 1.12 32 18/06/2015 Software User Manual
4.10 Data Export
You can export patient and measuring data from the database into the zebris' own format
„zebdb“. This offers you the opportunity to exchange single data records with colleagues also
working with the zebris software. Exported data can be imported again by using the Restore
function (see : Old data (WinFDM/Win FDM-T), page.31). Furthermore you can create
backups of the database by doing so.
1. Export...
Click on the button at the bottom Store/Restore right in the toolbar. If several export formats are available, select one from the appearing list.
2. Store
Select Create backup in order to export the desired data out of your database.
3. Select data records
Place ticks in front of all data records that are to be exported. If you would like to export all measurements of a patient, simply click on the tick in front of the patient's name. When clicking in a line with patient name, all measurements of the patient are displayed on the right. You can then also select them individually.
4. Select data records
Place ticks in front of all data records, that you would like to import.. In order to import all patients of a group or a project, place the tick in the first column. If you would like to import all measurements of a patient, simply click on the tick in front of the patient's name. When clicking in a line with the patient name, all measurements of the patient are displayed on the right. You can then select them individually.

The Patient Database
Textrelease R2 zebris FDM 1.12 33 18/06/2015 Software User Manual
Errors/Duplicates
If any errors occur while importing or if you would like to import data records, that already exist in your data base, a summary will be displayed informing you on the corresponding information.
4.11 Program settings
Here you can amongst others change the language and the settings concerning the card
reader.
Program settings
Click the button at the bottom right in the toolbar.
Click on Common on the left-hand side.
Language
Select the desired translation of the program surface from the list.
Screen font DPI (Zoom factor)
This factor determines the size of all displayed elements in the software. Select user-defined in order to enter your own value in dpi. Ratio of screen height can be used as alternative to the dpi setting. Using the system setting resets the value to Windows-Standard.
Logo in Reports
By clicking on Change, you can select a logo graphic which then is displayed in all reports in the header. Click clear in order if you do not wish a logo graphic to be displayed.

The Patient Database
Textrelease R2 zebris FDM 1.12 34 18/06/2015 Software User Manual
4.11.1 Smartcard (Card reader)
Here you can set up your card reader for the use of KVK resp. eGK.
This requires a Smartcard-Reader with the eGK resp. special reading devices for the KVK,
like e.g. chip card keyboards of the German manufacturer Cherry.
The electronic health card (eGK) works in combination with the card reader that is integrated
in the zebris HP notebooks (right-hand side) without any further installation (Standard
setting).
The old insurance card (KVK) only works with installed CT-API drivers.
1. Program settings
Click the button at the bottom right in the toolbar.
2. Card reader
Select the entry cardreader on the left hand side.
3. Select interface
Select the interface resp. the device with which you read in the KVK resp. EGK on the right-hand side:
PC/SC for eGK
CT-API for KVK and eGK If you have selected PC/SC, confirm afterwards with Close.
4. CT-API
CT-API can read both KVK and eGK. The preset proposition is the driver of the EHEALTH-BCS keyboardG87-1504 of the manufacturer Cherry. Click on Browse afterwards in order to choose the corresponding dll file of your CT-API-drivers.
5. Select dll drivers
Select on your hard disc the corresponding CT-API driver. Please find details in the manual of the cardreader manufacturer.

The Patient Database
Textrelease R2 zebris FDM 1.12 35 18/06/2015 Software User Manual
6. Insert card
Insert a card into the reading device.
7. Create new patient
Click on New Patient and the data from the card is pasted automatically.
4.11.2 Export (Always export to the same location)
You can set a fixed storage location in Program Settings at the database window. When
this setting is active, the save dialog will not come up. Instead the export files will
automatically be saved to the location you have defined.
To set a fixed location, go to Program Settings, section Import/Export and mark the checkbox in the column Fixed path after the text ”APD”. You can select another location in your storage by pressing …. Press Ok to confirm your changes. No save dialog (“Enter File Name”) will be shown as long as the checkbox is marked.
If you do not set fixed paths, a file save dialog comes up. Select the location to save the
export files and enter another filename or just hit save if you want to confirm the proposal.

The Patient Database
Textrelease R2 zebris FDM 1.12 36 18/06/2015 Software User Manual

Module selection
Textrelease R2 zebris FDM 1.12 37 18/06/2015 Software User Manual
5 Module selection
By clicking on Measure, you leave the database and the module selection is displayed.
Here you can select the module on the left that you would like to start. Then you can make
settings on the right-hand side, according to the respective module. Details on the settings
can be found in the respective section on the module.

Hardware setup (device settings)
Textrelease R2 zebris FDM 1.12 38 18/06/2015 Software User Manual
6 Hardware setup (device settings)
Before using for the first time, some modules need a device profile setup (i.e. one or more
devices as a group). This is the case for those modules for which, after selecting the module,
the button „Hardware Setup" is shown at the bottom, right-hand side (see Module selection,
p. 37).
Automatic hardware detection
On first start of the hardware setup, an automatic detection will be performed that inserts all currently connected zebris devices into one profile. To benefit from this automatic process, please plug in the devices you want to use and click OK
If automatic detection fails
No devices could be recognized. If you already plugge in your devices, please check the cable connections and power supply. After clicking on Close you can add the devices manually to a profile or trigger the automatic detection again by cancelling and starting the hardware setup again.

Hardware setup (device settings)
Textrelease R2 zebris FDM 1.12 39 18/06/2015 Software User Manual
Select devices manually
1. Open device selection
Click on "Add device". A new window opens.
2. Select device
In this dialog box, all the known devices are shown to you (and enabled according to your license). Please select the device that you would like to add to your profile and click on OK. If this should be a camera, its settings dialog will be displayed. Repeat this step until you have added all the devices that you would like to take your measurements with.
3. Finished profile
After you have added all the devices to the profile that you want to take measurements with, you are able to assign a further designation in the input field next to "Hardware profile". Finally click on OK.

Hardware setup (device settings)
Textrelease R2 zebris FDM 1.12 40 18/06/2015 Software User Manual
6.1 Force measuring platforms, instrumented treadmills
You leave the Hardware setup by clicking on Configure device, and the Setting dialog
appears.
Name
If necessary change the designation for your device here. It is not permissible to give several devices the same name.
Hardware synchronization
If you wish to synchronize your device with cameras, select the mechanism used here according to your camera system. This must similarly be set in the camera settings for the correct function.
Please note that for synchronizing using camera systems, ONLY the cable enclosed with the cameras may be used.
6.2 Cameras
In the following, the settings necessary for using and synchronizing the connected cameras
are explained. You must carry out these settings once for each camera that is added.
Additional settings are not necessary for the functioning and could, under certain
circumstances, have an influence on the picture quality and measuring rate/synchronization.
Please only change these if you are very experienced at handling the system.
Please note that the simultaneous use of two different modes for hardware synchronization is not possible (e.g. microphone input and flash).

Hardware setup (device settings)
Textrelease R2 zebris FDM 1.12 41 18/06/2015 Software User Manual
6.2.1 DV-Camcorder (FireWire)
Settings dialog
On the right you can see a live picture of the camera and on the left, the possible settings.
Recommended settings
Name
Enter a unique designation here for your camera. It is not permissible to give several cameras the same name.
Rotate
If necessary you are able to rotate the picture in steps of 90°.
Hardware-sync
For using the synchronization via the microphone jack on the camera, set here to "Audio". Please note that you have to set this also in the device settings of your FDM hardware.
Saving the settings
If you have made all the settings according to the recommendation, close the dialog and save it by clicking on OK.

Hardware setup (device settings)
Textrelease R2 zebris FDM 1.12 42 18/06/2015 Software User Manual
6.2.2 SYNCCam (USB)
Settings dialog
On the right you can see a live picture of the camera and on the left, the possible settings.
Name
Customize the name of the camera (does not appear anywhere in zebris FDM
Rotate
If necessary you are able to rotate the picture in steps of 90°.
Exposure
Adjust the exposure intensity here.
Hardware-sync
For using the synchronization via the microphone jack on the camera, set here to "Flash".
FPS
Set the desired number of images per second here.
White balance
Here you can change the color tint of the camera image.
Saturation
Here you can adjust the colour saturation.
Focus
Set the focus here. The automatic focussing is deactivated through a setting here.

Hardware setup (device settings)
Textrelease R2 zebris FDM 1.12 43 18/06/2015 Software User Manual
Saving the settings
If you have made all the settings according to the recommendation, close the dialog and save it by clicking on OK.
For recording of fast movements, use a seperate light source, e.g. the zebris SYNClight. Drag the Exposure slider until the picture appears darkest, then move the Gain slider to make the picture lighter again.
The camera provides automatic focus and white balance (for natural colors), but if a tick is set in one of these lines, the function is controlled manually by the slider.

Gait Analysis
Textrelease R2 zebris FDM 1.12 44 18/06/2015 Software User Manual
7 Gait Analysis
With this module you carry out the gait analyses using a zebris FDM-T System. The single
steps of a gait analysis are exemplarily described here on the treadmill (FDM-T), yet function
in the exact same manner when using a platform.
7.1 Preparing the measurement (Measurement settings)
Measurement settings
Under Common Settings you can specify the measuring duration individually in advance. 30 seconds are given by default. In addition you can change the maximum of the pressure scale and the measuring frequency of the sensors. By clicking on Ok your changes are saved and you will return to the module selection.
Acquisition of analog data
In addition to the gait analysis, analog signals of an external device can be recorded. Described in the following on the example of EMG: Prerequisite is that an EMG device has been added to the device settings
EMG settings
Set a tick per channel you would like to use on the left-hand side. As many channels are displayed as are available in the device. Select per channel, which side of the body you would like to use and on which muscles you would like to record the EMG signal . The graphic shows the anatomic allocation of the abbreviations used. By clicking Ok the settings are

Gait Analysis
Textrelease R2 zebris FDM 1.12 45 18/06/2015 Software User Manual
7.2 Carry out measurement (Measuring mode)
1. Database
Click on Measure in the toolbar on the right.
2. Module selection
Select the module Gait Analysis and then click on Start.
3. Preparation
Please ask your test person to stand next to the treadmill or on the side bar, so that a zero measurement can be taken in an unloaded state. Then change to the Preview mode by clicking on Next. By clicking on Back you will return to the module selection.
saved and you will be redirected to the module selection.

Gait Analysis
Textrelease R2 zebris FDM 1.12 46 18/06/2015 Software User Manual
4. Preview/recording
In the Preview mode, the screen alongside appears. Start the treadmill. The patient ought to walk on the treadmill for a few minutes to get used to the feeling. After this familiarization phase the measurement can be started by clicking on the Record button. By clicking Back you will return to the module selection.
5. Measurement
After Start the recording the measureing signals are recorded over the preset measuring duration. The green progress bar shows the elapsed measuring time. The measurement can be stopped at any time by clicking on the Stop button. If a video camera is connected, a video display is shown in the upper right-hand part of the measurement screen. In the lower, right-hand part of the measurement screen, the force and pressure curves are shown in chronological sequence.
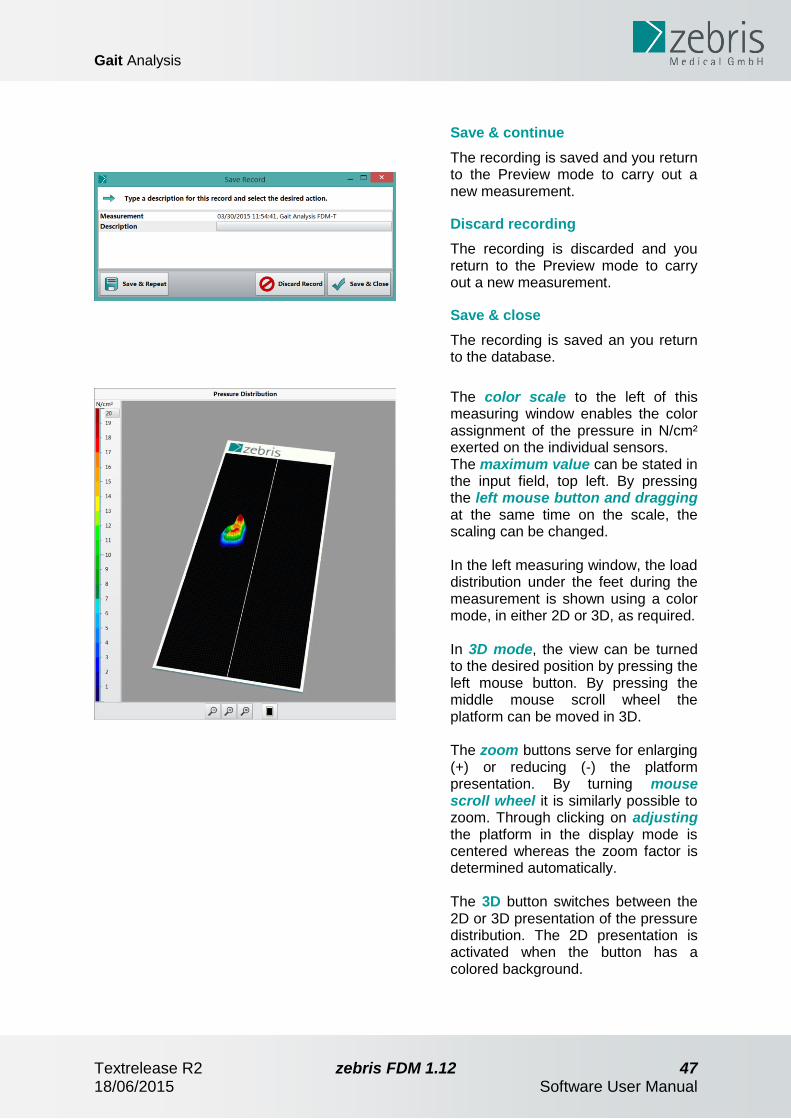
6. Save
After clicking on the Stop button, a dialog box appears.
Gait Analysis
Textrelease R2 zebris FDM 1.12 47 18/06/2015 Software User Manual
Save & continue
The recording is saved and you return to the Preview mode to carry out a new measurement.
Discard recording
The recording is discarded and you return to the Preview mode to carry out a new measurement.
Save & close
The recording is saved an you return to the database.
The color scale to the left of this measuring window enables the color assignment of the pressure in N/cm² exerted on the individual sensors. The maximum value can be stated in the input field, top left. By pressing the left mouse button and dragging at the same time on the scale, the scaling can be changed. In the left measuring window, the load distribution under the feet during the measurement is shown using a color mode, in either 2D or 3D, as required. In 3D mode, the view can be turned to the desired position by pressing the left mouse button. By pressing the middle mouse scroll wheel the platform can be moved in 3D. The zoom buttons serve for enlarging (+) or reducing (-) the platform presentation. By turning mouse scroll wheel it is similarly possible to zoom. Through clicking on adjusting the platform in the display mode is centered whereas the zoom factor is determined automatically. The 3D button switches between the 2D or 3D presentation of the pressure distribution. The 2D presentation is activated when the button has a colored background.

Gait Analysis
Textrelease R2 zebris FDM 1.12 48 18/06/2015 Software User Manual
7.3 Processing the measurement (View mode)
In the "View mode" you can view and play the measurements, limit the measuring interval.
And when using a camera system, mark single images for the report as well as draw in
angles. In the following, the individual functions of the View mode are explained in detail.
7.3.1 Basics
Opening the measuring dataset
Select a measuring dataset in the database and click on View in the toolbar on the right.
Play the measurement
Click on Play in the toolbar on the right. The time display above the Play button shows the actual time of the measurement in seconds. Click on the box to enter a value By clicking on Back you will return to the database.
Export...
Here you can export a pressure image per foot as jpg graphic. After having selected the desired image, you are asked to assign a saving destination and a name.
1:1 Report
Opens the Report for the 1:1 printout. The data basis is the averaged stance phase of all the steps taken within the marked interval. The average, maximum resp. medium stance phase can be selected.

Gait Analysis
Textrelease R2 zebris FDM 1.12 49 18/06/2015 Software User Manual
The manual step definition for the gait analysis FDM is momentarily not available.
Automatic step definition
By clicking on the corresponding button, the following dialog window opens (see below).
When clicking Ok, all previously defined steps are deleted and the automatic step definition is carried out again.
Manual step definition
In case that the automatic step definition has not recognized the test person's gait pattern, you can also define the steps manually. Therefore, click on Manual Step Definition. All steps are deleted and you are redirected to the mode of manual definition.
By holding down the left mouse button you can navigate over the timeline with the help of the vertical dashed line (cursor). By pressing Undo/Repeat you can jump back and forth in the work process.
1. Navigate to the footprint
Navigate in the time course to the left

Gait Analysis
Textrelease R2 zebris FDM 1.12 50 18/06/2015 Software User Manual
footprint, with which you would like to start. If you prefer to start with the right footprint, then click on Next.
2. Click on the footprint
Click on a part of the footprint that is to be defined. A frame around the footprint is then generated automatically.
Now the displayed frame can be adjusted by using the displayed points. If required, shift the points into another position inside the frame by dragging with the left mouse button. After having finished the manual step definition, click the button Finish and your changes are saved.
You will have to define at least five steps, as this number is necessary for the evaluation of the report. If you have defined fewer steps, a note appears after clicking Finish. Close it and define more steps.

Gait Analysis
Textrelease R2 zebris FDM 1.12 51 18/06/2015 Software User Manual
7.3.2 Functions
Playing the measurement
Automatic playing of the measurement by clicking on the Play button. The measurement recording is played and repeated until the Pause button is pressed.
Image forw./backwards
The arrows with the line directly next to them take you one image forwards, or backwards, resp.
Playing speed
A single click on this button opens a list for selecting the playing speed.
Zoom
Enlarging or reducing the platform display or the signal curves in the force/time diagram. The magnifying glass with a minus sign reduces the display by 20% The magnifying glass with a plus sign enlarges the display by 20% Adjusting The 3D depiction is centered in the view mode and the zoom factor is automatically determined, so that the model becomes completely visible.
MPP
Display of the maximum pressure (Maximum Pressure Plot).
Gait line
Display of the COP pattern in the gait phase.
Roll-off line
Display of the roll-off line during the stance phase.
Swapping left/right side
Here you can swap the side assignment of the foot prints.
3D presentation
Switches the load distribution between the 2D and 3D presentation. The 2D presentation is activated when the button has a colored background.

Gait Analysis
Textrelease R2 zebris FDM 1.12 52 18/06/2015 Software User Manual
Single images
Single images can be marked or deleted with this function. Marked pictures are transferred to the report. (see 7.3.4)
Selecting a video sequence of a gait cycle
Select automatically the video sequence of the gait cycle at the current playing position. (see 7.3.4)
7.3.3 Visualization of the load distribution
Numerical display of the pressure values
In the 2D presentation, the pressure values of the roll-off pattern can be shown numerically. To do this, deactivate the 3D mode by clicking on 3D (if the button is not highlighted in color, the 3D presentation is active.) By enlarging with the middle mouse button or magnifier tool the pressure values of the individual sensors and the limiting frame are displayed.

Gait Analysis
Textrelease R2 zebris FDM 1.12 53 18/06/2015 Software User Manual
Please note that the presentation here has been smoothed, which can cause inaccuracies and rounding errors in the area at the edges of the pressure image displayed.
Recordings that are carried out with with visual cueing, the projected footprints are shown as a gray shadow. In this way, it is possible to make a visual assessment of the training in advance.
7.3.4 Selecting a certain interval for analysis in the Report
With zebris FDM it is possible to analyze either the total data volume recorded or only a
certain interval.
Select measuring data
Two blue limitation lines in the the force/- time diagram mark the area for analysis. For the Report the area with the blue background is discarded and only the data in the white area is evaluated.
Customizing the area for analysis
Move the cursor over the limitation line from blue to white. The cursor changes to a double arrow. With the left mouse button pressed you can now restrict the area for analysis by dragging the limitation lines.
Selecting video sequences
Please note, that the use of video cameras is not available with all modules.

Gait Analysis
Textrelease R2 zebris FDM 1.12 54 18/06/2015 Software User Manual
1. Define a position
In order to transfer video images to the report, click on the desired position in the time-force diagram. The dotted line (cursor) is shifted to the clicked position. You can shift the cursor with the left mouse button resp. the image back/forth button to the desired position.
2. Define the video interval
By clicking on the movie symbol, the gait cycle around the marked position is selected (each one step before/one step after). In order to select a larger section, move the mouse cursor on a limitation line of the violet section, until it becomes a double cursor. While keeping the left mouse button pressed, you can now change the length of the video sequence by drawing the limitation line. Delete the marking by pulling the limitations together until the marking disappears completely.
Marking single images in the video, angles and length ratios
Using the magnifying glass, the displayed image section can be enlarged or minimized. By clicking with the right mouse button on the image section, the following functions in the context menu open: “Copy current image in the clipboard” as well as “Save video under”. When it comes to recordings with several cameras, a colored frame marks the currently selected video image.
Marking a single image
Click on the desired position in the force-time diagram. The dotted line (cursor) is set at the clicked position.

Gait Analysis
Textrelease R2 zebris FDM 1.12 55 18/06/2015 Software User Manual
Then click on the camera symbol under the video image. The marking appears as blue line in the bar „single images and video sequences“.
Deleting a single image
Click on the single image marking in the bar „Single images and video sequence“ (blue line). Then, click on the crossed out video symbol. In doing so, the marking is deleted. Of course, you can set the marking any time again.
Angles and Length ratios
Draw two straight lines with the left mouse button directly in the video mode. Then the angles between the straight lines as well as the length ratio to one another are displayed automatically at the right bottom edge of the video image. The drawn in angles and the length ratios are saved with the single image and displayed in the report.
7.4 Gait Analysis Report (Report mode)
In the "Report" mode, the gait parameters are assessed and shown which had previously
been defined in the "View" mode.
Selecting the data set
First mark a data set and then click on Report.
Gait Analysis
Textrelease R2 zebris FDM 1.12 56 18/06/2015 Software User Manual
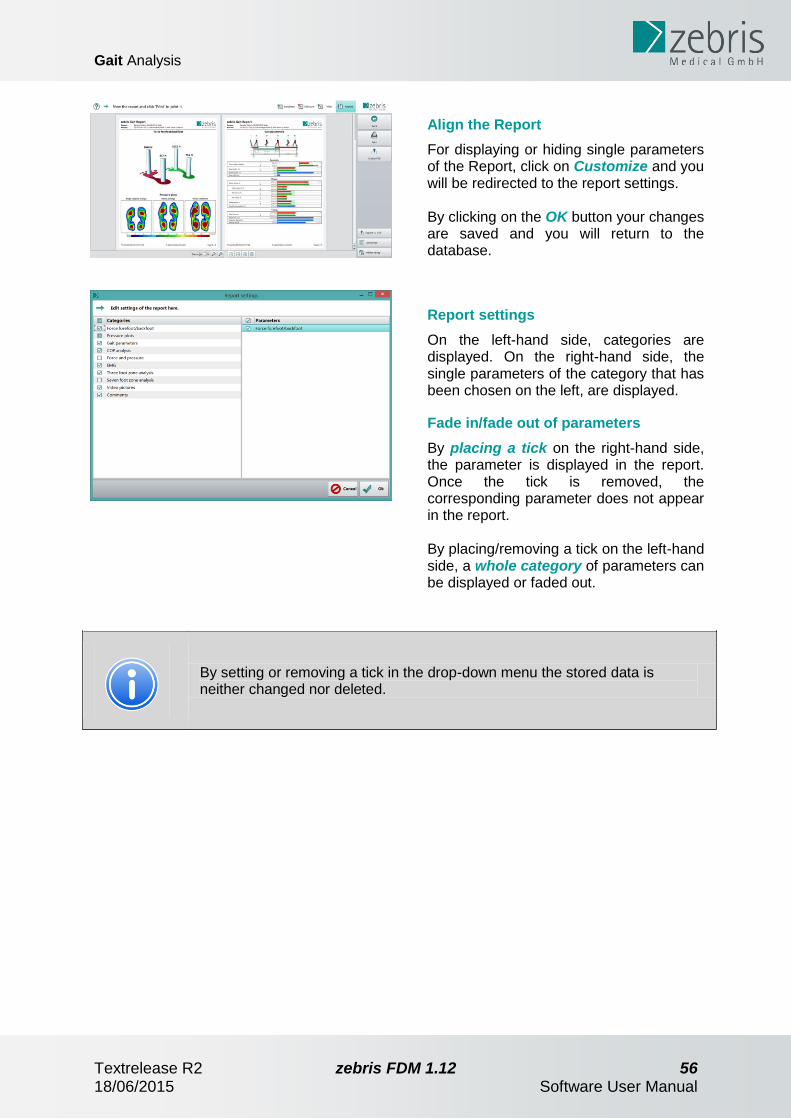
Align the Report
For displaying or hiding single parameters of the Report, click on Customize and you will be redirected to the report settings. By clicking on the OK button your changes are saved and you will return to the database.
Report settings
On the left-hand side, categories are displayed. On the right-hand side, the single parameters of the category that has been chosen on the left, are displayed.
Fade in/fade out of parameters
By placing a tick on the right-hand side, the parameter is displayed in the report. Once the tick is removed, the corresponding parameter does not appear in the report. By placing/removing a tick on the left-hand side, a whole category of parameters can be displayed or faded out.
By setting or removing a tick in the drop-down menu the stored data is neither changed nor deleted.
Gait Analysis
Textrelease R2 zebris FDM 1.12 57 18/06/2015 Software User Manual
7.4.1 Functions
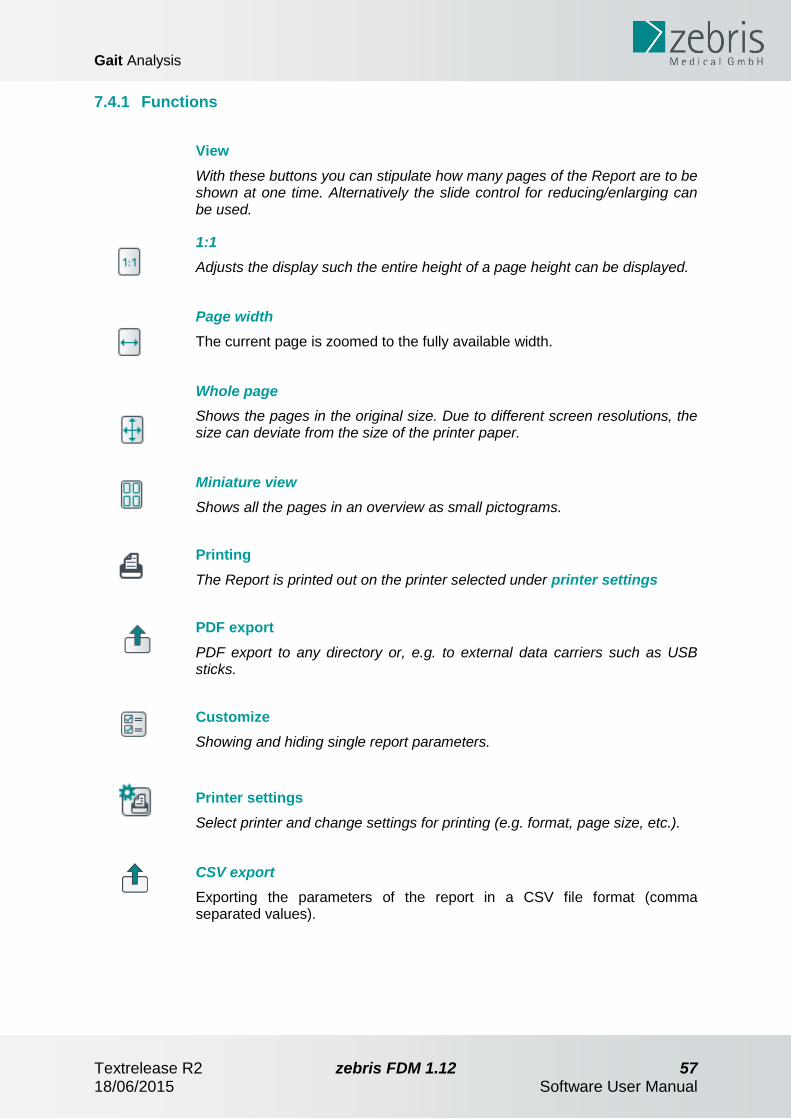
View
With these buttons you can stipulate how many pages of the Report are to be shown at one time. Alternatively the slide control for reducing/enlarging can be used.
1:1
Adjusts the display such the entire height of a page height can be displayed.
Page width
The current page is zoomed to the fully available width.
Whole page
Shows the pages in the original size. Due to different screen resolutions, the size can deviate from the size of the printer paper.
Miniature view
Shows all the pages in an overview as small pictograms.
Printing
The Report is printed out on the printer selected under printer settings
PDF export
PDF export to any directory or, e.g. to external data carriers such as USB sticks.
Customize
Showing and hiding single report parameters.
Printer settings
Select printer and change settings for printing (e.g. format, page size, etc.).
CSV export
Exporting the parameters of the report in a CSV file format (comma separated values).

Gait Analysis
Textrelease R2 zebris FDM 1.12 58 18/06/2015 Software User Manual
7.4.2 Description of the Report contents
The Report comprises the elements described in the following:
Header
Title, project name, patient name, date of the measurement and the company logo are in the header.
Force fore foot/rear foot
In this 3D depiction the maximum force for the fore and rear foot is displayed.
Maximum pressure pictures
In this diagram the maximum pressure pictures are displayed in color. Each maximum pressure picture (MPP) contains the highest pressure values of a complete roll-off pattern.
Mid-stance phase, average
This diagram shows the average maximum pressure picture of the mid-stance phase of all the maximum pressure pictures recorded.
Stance phase average
This diagram shows the average of all the maximum pressure pictures recorded.
Stance phase maximum
This diagram shows the absolute maximum pressure picture of all the maximum pressure pictures recorded.

Gait Analysis
Textrelease R2 zebris FDM 1.12 59 18/06/2015 Software User Manual
Color scale
The color scale enables the load distribution to be quantified.
Gait line
The line of the force application points are displayed in the pressure pictures for each foot separately.

Gait Analysis
Textrelease R2 zebris FDM 1.12 60 18/06/2015 Software User Manual
Gait phases
Here you see the individual gait phases illustrated.
Geometry
Here the local gait parameters, i.e. foot rotation, step length, stride length and step width are displayed.
Phases
Here, the step phases in the two main phases, i.e. the stance phase and swing phase, are shown. The stance phase is divided into the two double-standing phases, i.e. loading response phase and roll-off phase and also the mid-stance phase. The sections marked in bright green are reference values.
Timing
Includes the time-dependent gait parameters, i.e. step time, stride time, cadence and the average speed of the interval analyzed.
7.4.3 Explanation of gait parameters
Foot rotation, degree
Describes the angle between the longitudinal axis of the foot and the running direction.
Negative value = inward rotation, positive value = outward rotation
Step width, cm
Describes the distance between the right and left foot.
Step length, cm
Describes the distance between the heel contact of one side of the body and the heel contact
of the contralateral side.
Step time, sec.
Describes the phase within a gait cycle between the heel contact of one side of the body and
the heel contact of the contralateral side.

Gait Analysis
Textrelease R2 zebris FDM 1.12 61 18/06/2015 Software User Manual
Stance phase, %
Describes the phase of a gait cycle in which the foot has contact with the ground.
Loading response phase, %
Describes the phase between the initial ground contact and contralateral toe off.
Mid-stance phase, %
Describes the contralateral toe-off phase and the transfer of the body's center of gravity over
the weight-bearing foot.
Pre-swing phase, %
Describes the phase during a gait cycle that begins at contralateral initial contact (when the
heel of the contralateral side touches the ground) and ends at toe off of the viewed side of
the body.
Swing phase, %
Describes the phase of a gait cycle during which the foot has no contact with the ground.
Double-standing phase, %
Sum of the loading response phase and the pre-swing phase.
Double-stride length, cm
Describes the distance between two heel contacts on the same side of the body.
Double-stride time, sek
Time span of a stride.
Cadence, steps/minute
Step frequency
Speed, km/hr
Measured average gait speed during the analyzed measuring interval.
Gait Analysis
Textrelease R2 zebris FDM 1.12 62 18/06/2015 Software User Manual
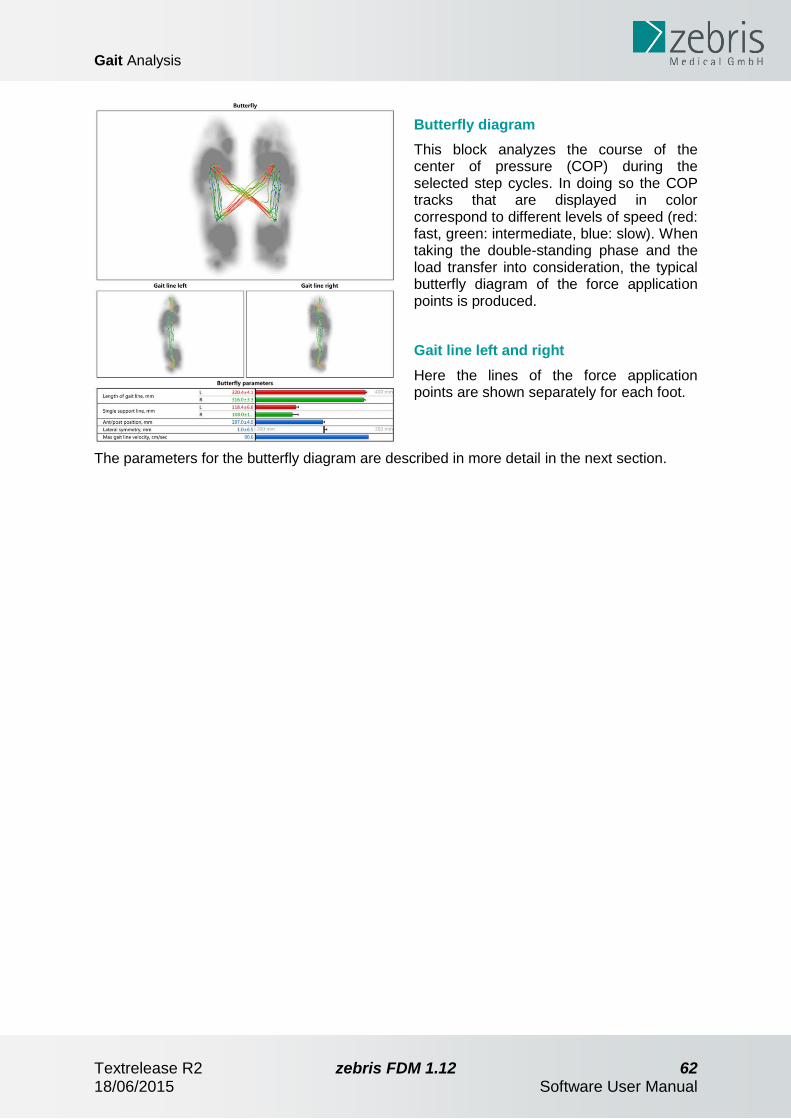
Butterfly diagram
This block analyzes the course of the center of pressure (COP) during the selected step cycles. In doing so the COP tracks that are displayed in color correspond to different levels of speed (red: fast, green: intermediate, blue: slow). When taking the double-standing phase and the load transfer into consideration, the typical butterfly diagram of the force application points is produced.
Gait line left and right
Here the lines of the force application points are shown separately for each foot.
The parameters for the butterfly diagram are described in more detail in the next section.

Gait Analysis
Textrelease R2 zebris FDM 1.12 63 18/06/2015 Software User Manual
7.4.4 Explanation of the butterfly diagram
Length of the gait line
The parameter "Length of the gait line" is characterized by the position of the center of pressure (COP). Only the ground contacts of one side of the body are taken into account. This parameter covers the progression of the COP of all the steps recorded of one side of the body. All the other parameters can be seen in the cyclograms.
Mid-stance phase
This parameter corresponds to the average length of the lines that show the progression of the COP of one side of the body, when all the ground contacts are taken into consideration.
Anterior/Posterior Position
This parameter describes the shift forwards or backwards of the COP intersection point in chronological sequence in the cyclogram display, taking all the steps into consideration. The initial or zero position is the rearmost place where the heel contacts the ground.

Gait Analysis
Textrelease R2 zebris FDM 1.12 64 18/06/2015 Software User Manual
Anterior/posterior variability
This describes the standard deviation in the anterior/posterior position that results when taking all the steps into consideration.
Lateral shift
This parameter describes the left /right shift of the COP intersection point in chronological sequence in the cyclogram display, taking all the steps into consideration. A negative value indicates a shift to the left, and a positive value, a shift to the right. The initial or zero position is shown as the central point of the illustration.
Lateral deviation
This describes the standard deviation in the lateral shift, which results when taking all the steps into consideration.

Gait Analysis
Textrelease R2 zebris FDM 1.12 65 18/06/2015 Software User Manual
7.4.5 Force & Pressure
Average maximum pressure
Presentation of the averaged and
normalized pressure curves. The standard
deviation is shown as a shaded area, and
the dotted line represents the maximum
values. The vertical line separates the
stance and swing phase.
Average force
Diagram of the average vertical reaction force. The area of the standard deviation is indicated as a shadowed area. The height of the maximum force and its localization related to the gait cycle are given for the heel and forefoot for the left and right side, respectively. The vertical line separates the stance and swing phase.
Force parameters
Shown here are the amplitudes recorded in the force curve together with their position in the gait cycle.
Gait Analysis
Textrelease R2 zebris FDM 1.12 66 18/06/2015 Software User Manual
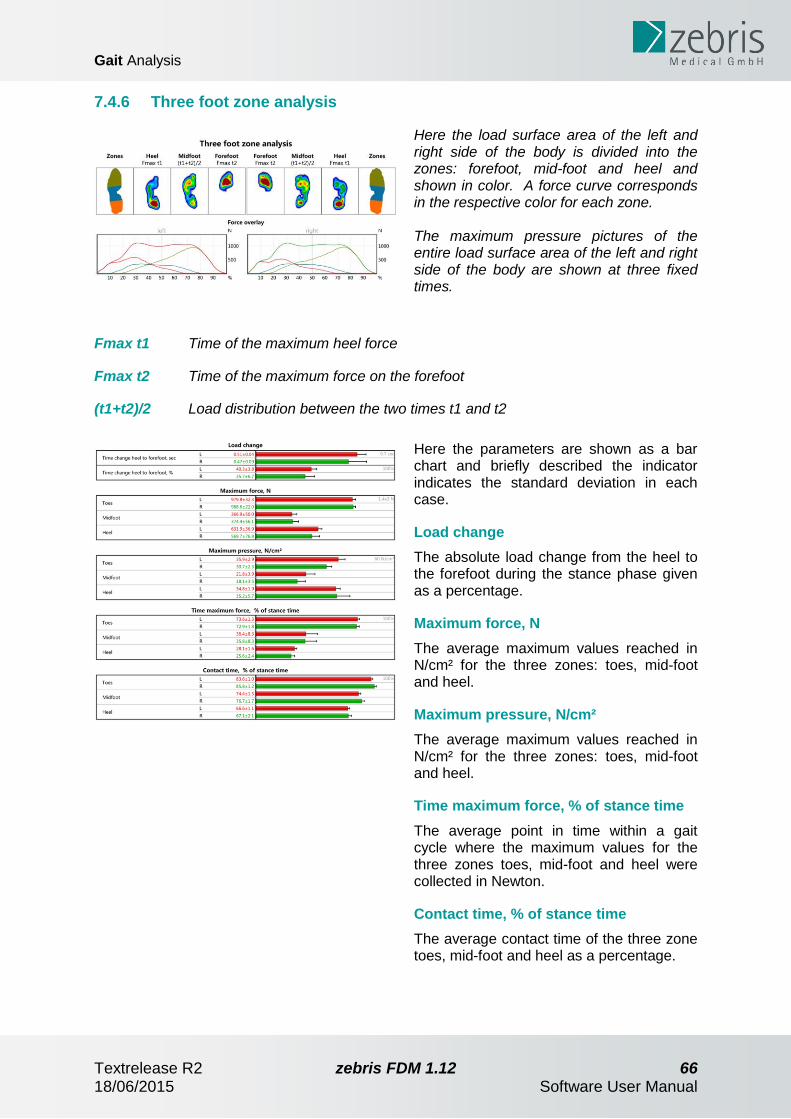
7.4.6 Three foot zone analysis
Here the load surface area of the left and right side of the body is divided into the zones: forefoot, mid-foot and heel and shown in color. A force curve corresponds in the respective color for each zone. The maximum pressure pictures of the entire load surface area of the left and right side of the body are shown at three fixed times.
Fmax t1 Time of the maximum heel force
Fmax t2 Time of the maximum force on the forefoot
(t1+t2)/2 Load distribution between the two times t1 and t2
Here the parameters are shown as a bar chart and briefly described the indicator indicates the standard deviation in each case.
Load change
The absolute load change from the heel to the forefoot during the stance phase given as a percentage.
Maximum force, N
The average maximum values reached in N/cm² for the three zones: toes, mid-foot and heel.
Maximum pressure, N/cm²
The average maximum values reached in N/cm² for the three zones: toes, mid-foot and heel.
Time maximum force, % of stance time
The average point in time within a gait cycle where the maximum values for the three zones toes, mid-foot and heel were collected in Newton.
Contact time, % of stance time
The average contact time of the three zone toes, mid-foot and heel as a percentage.

Gait Analysis
Textrelease R2 zebris FDM 1.12 67 18/06/2015 Software User Manual
7.4.7 Video
Camera - Video sequence
Here, the stride phase defined in the View module, is shown as a video sequence of ten images with the same time interval (given in seconds).
Camera – Marked pictures
Shows the individual images marked in the "View" module, including all the angles and lines defined there. Underneath the image the recording time is shown in seconds.
7.4.8 Comments
Patient comment
Shows the patient comment stored in the database. For notes on setting up a patient comment see Comments & Clips , p. 27.
Comment on the recording
Shows the comment on the recording, stored in the database. For notes on setting up a recording comment see Details of the recording, p. 29.
Gait Analysis
Textrelease R2 zebris FDM 1.12 68 18/06/2015 Software User Manual
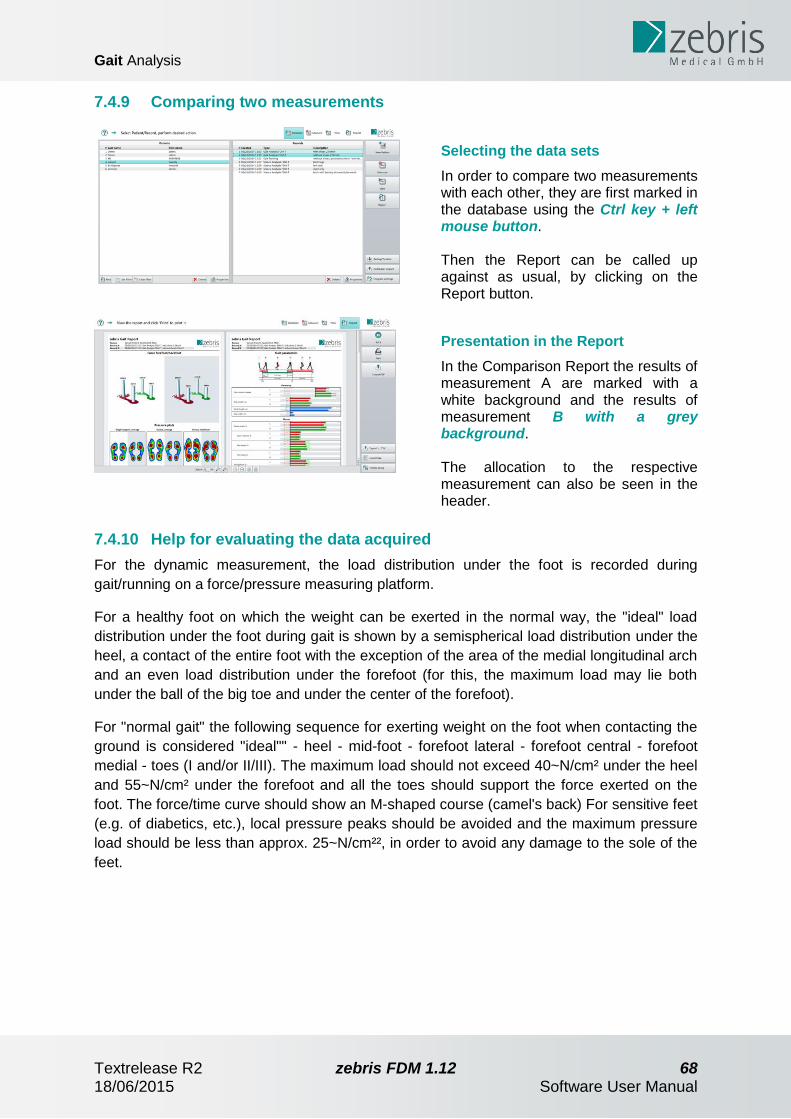
7.4.9 Comparing two measurements
Selecting the data sets
In order to compare two measurements with each other, they are first marked in the database using the Ctrl key + left mouse button. Then the Report can be called up against as usual, by clicking on the Report button.
Presentation in the Report
In the Comparison Report the results of measurement A are marked with a white background and the results of measurement B with a grey background. The allocation to the respective measurement can also be seen in the header.
7.4.10 Help for evaluating the data acquired
For the dynamic measurement, the load distribution under the foot is recorded during
gait/running on a force/pressure measuring platform.
For a healthy foot on which the weight can be exerted in the normal way, the "ideal" load
distribution under the foot during gait is shown by a semispherical load distribution under the
heel, a contact of the entire foot with the exception of the area of the medial longitudinal arch
and an even load distribution under the forefoot (for this, the maximum load may lie both
under the ball of the big toe and under the center of the forefoot).
For "normal gait" the following sequence for exerting weight on the foot when contacting the
ground is considered "ideal"" - heel - mid-foot - forefoot lateral - forefoot central - forefoot
medial - toes (I and/or II/III). The maximum load should not exceed 40~N/cm² under the heel
and 55~N/cm² under the forefoot and all the toes should support the force exerted on the
foot. The force/time curve should show an M-shaped course (camel's back) For sensitive feet
(e.g. of diabetics, etc.), local pressure peaks should be avoided and the maximum pressure
load should be less than approx. 25~N/cm²², in order to avoid any damage to the sole of the
feet.

Stance analysis
Textrelease R2 zebris FDM 1.12 69 18/06/2015 Software User Manual
8 Stance analysis
With this module you can carry out the stance analyses using a zebris FDM System. The
procedure of a stance analysis measurement is explained here exemplarily on a treadmill
(FDM-T, yet functions in the exact same manner when using a platform (FDM).
8.1 Carry out measurement (Measuring mode)
1. Database
Click on Measure in the toolbar on the right to start taking a measurement.
2. Module selection
Select the module Stance Analysis and then click on the Start button. Under Settings you can specify the measuring duration individually in advance. 30 seconds are given by default.
In addition you can change the maximum value of the pressure scale and the measuring frequency of the sensors. By clicking on OK you will return to the database.

Stance analysis
Textrelease R2 zebris FDM 1.12 70 18/06/2015 Software User Manual
3. Preparation
Please ask your test person to stand next to the treadmill or on the side bar, so that a zero measurement can be taken in an unloaded state. Then change to the Preview mode by clicking on Next. By clicking on Back you will return to the module selection.
4. Preview/Recording
In the preview mode, the screen alongside appears. The patient should now stand in the middle of the treadmill facing the arrow that is positioned beside the platform logo. The arrow that stipulates the patient’s standing direction can be turned by 90° each through clicking on it. Subsequently, the green cross for the division of left/right side and fore/back foot is fixed by clicking on Next. Thus it is for example possible, to do a one leg stand when the test person only lifts one leg.
5. Measurement
When the recording is started, the measuring signals are recorded over the preset measuring duration. The green progress bar shows the elapsed measuring time. The measurement can be stopped at any time by clicking on the Stop button. If a video camera is connected, a video display is shown in the upper right-hand part of the measurement screen. In the lower, right-hand part of the measurement screen, the force and pressure curves are shown in chronological sequence. Below the section 3D of the measuring plate is the vertical ground reaction force of the left and right forefoot shown. Below vertical ground reaction force of the left and right heel is displayed.

Stance analysis
Textrelease R2 zebris FDM 1.12 71 18/06/2015 Software User Manual
The color scale to the left of this measuring window enables the color assignment of the pressure in N/cm² exerted on the individual sensors. The maximum value can be stated in the input field, top left. By dragging on the scale, its scaling can be changed. In the left measuring window, the pressure distribution under the feet during the measurement is shown using a color code, in either 2D or 3D, as required. In 3D mode, the view can be turned to the desired position by pressing the left mouse button. By pressing the middle mouse button (scroll wheel), the platform can be shifted. The definition of the forefoot/heel and the left/right contact area is corrected automatically.The green crosshair is automatically positioned as soon as the patient moves. You can shift the crosshair later in the mode view manually. The zoom buttons serve for enlarging (+) or reducing (-) the platform presentation. It is also possible to zoom by turning the mouse scroll wheel. The 3D button enables switching between the 2D or 3D presentation of the pressure distribution. The 2D mode is activated when the button has a colored background.
Load distribution During the measurement, the bar chart shows the distribution of the relative forces as a percentage, divided between the left foot (red)/right foot (green), and between the forefoot (upper bar) and heel (lower bar)

Stance analysis
Textrelease R2 zebris FDM 1.12 72 18/06/2015 Software User Manual
6. Save
After clicking on the Stop button, a dialog box appears.
Discard recording The recording is discarded and you return to the Preview mode to carry out a new measurement. Save & Close The recording is saved and you return to the database. Save & Continue The recording is saved and you return to the Preview mode to carry out a new measurement.
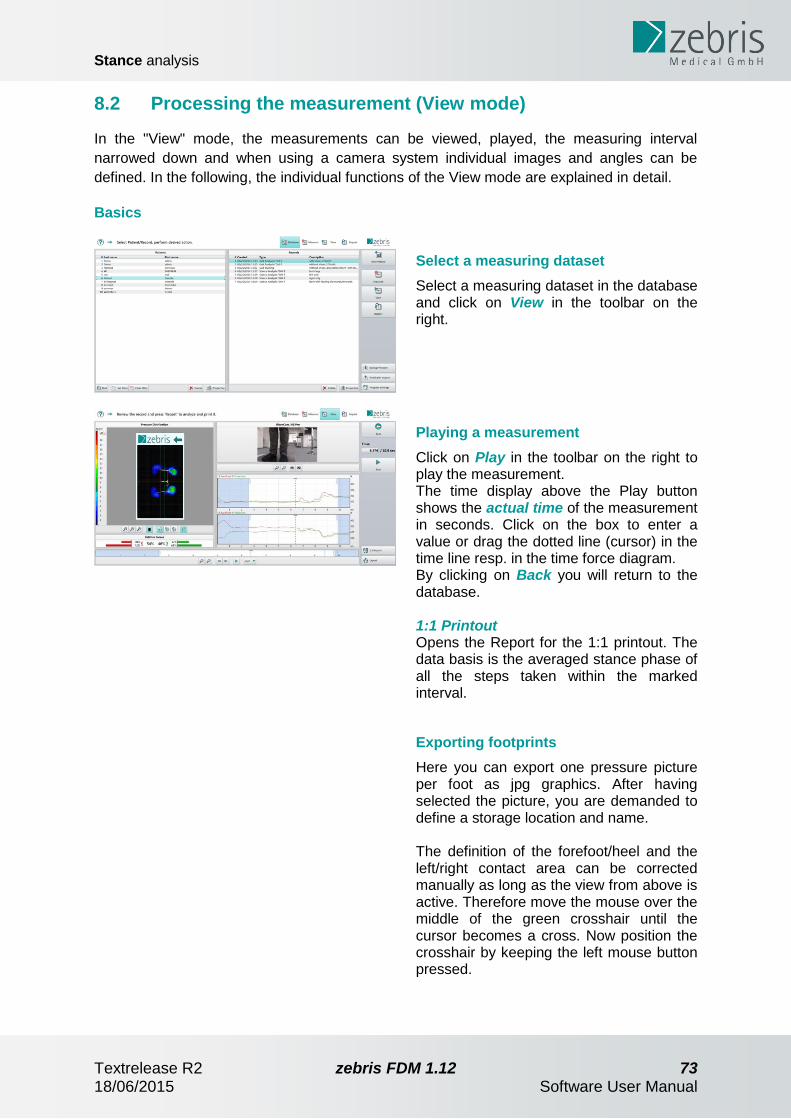
Stance analysis
Textrelease R2 zebris FDM 1.12 73 18/06/2015 Software User Manual
8.2 Processing the measurement (View mode)
In the "View" mode, the measurements can be viewed, played, the measuring interval
narrowed down and when using a camera system individual images and angles can be
defined. In the following, the individual functions of the View mode are explained in detail.
Basics
Select a measuring dataset
Select a measuring dataset in the database and click on View in the toolbar on the right.
Playing a measurement
Click on Play in the toolbar on the right to play the measurement. The time display above the Play button shows the actual time of the measurement in seconds. Click on the box to enter a value or drag the dotted line (cursor) in the time line resp. in the time force diagram. By clicking on Back you will return to the database. 1:1 Printout Opens the Report for the 1:1 printout. The data basis is the averaged stance phase of all the steps taken within the marked interval.
Exporting footprints
Here you can export one pressure picture per foot as jpg graphics. After having selected the picture, you are demanded to define a storage location and name. The definition of the forefoot/heel and the left/right contact area can be corrected manually as long as the view from above is active. Therefore move the mouse over the middle of the green crosshair until the cursor becomes a cross. Now position the crosshair by keeping the left mouse button pressed.

Stance analysis
Textrelease R2 zebris FDM 1.12 74 18/06/2015 Software User Manual
8.2.1 Visualization of the pressure distribution
Numerical display of the pressure values
In the 2D presentation, the pressure values of the roll-off pattern can be shown numerically. To do this, deactivate the 3D mode by clicking on 3D (when the button is highlighted in color, the 2D presentation is active). By enlarging with the middle mouse button (scroll wheel) or the magnifier tool the pressure values of the individual sensors and the sensor grid is displayed. Please note that the presentation here has been smoothed, which can cause inaccuracies and rounding errors in the area at the edges of the pressure image displayed.

Stance analysis
Textrelease R2 zebris FDM 1.12 75 18/06/2015 Software User Manual
8.2.2 Selecting an interval for analysis in the Report
With zebris FDM it is possible either to analyze the total data volume recorded or only a
certain interval.
Selecting measuring data
Two blue limitation lines in the force/time diagram mark the area for analysis. For the Report the area with the blue background is discarded and only the data in the white area is evaluated. After each measurement, the entire duration of the measurement is selected automatically.
Customizing the area for analysis
Move the cursor over the limitation line from blue to white. The cursor changes to a double arrow. With the left mouse button pressed you can now restrict the area for analysis by dragging the limitation line.
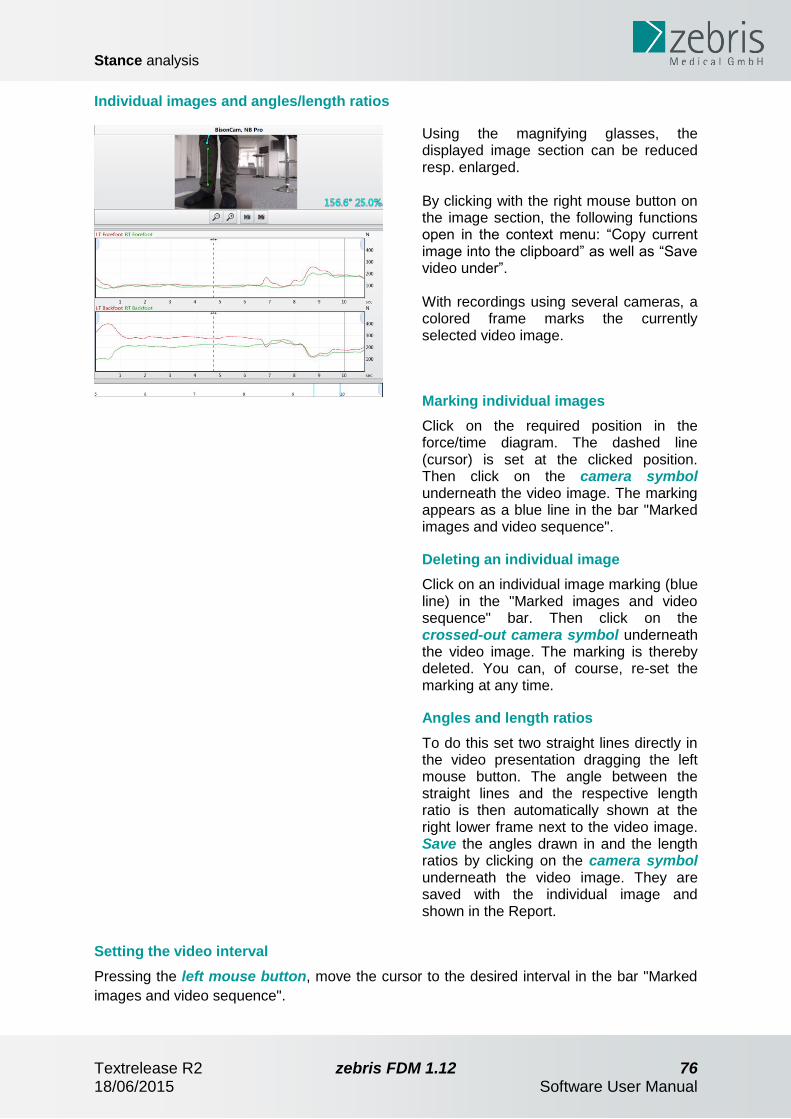
Stance analysis
Textrelease R2 zebris FDM 1.12 76 18/06/2015 Software User Manual
Individual images and angles/length ratios
Using the magnifying glasses, the displayed image section can be reduced resp. enlarged. By clicking with the right mouse button on the image section, the following functions open in the context menu: “Copy current image into the clipboard” as well as “Save video under”. With recordings using several cameras, a colored frame marks the currently selected video image.
Marking individual images
Click on the required position in the force/time diagram. The dashed line (cursor) is set at the clicked position. Then click on the camera symbol underneath the video image. The marking appears as a blue line in the bar "Marked images and video sequence".
Deleting an individual image
Click on an individual image marking (blue line) in the "Marked images and video sequence" bar. Then click on the crossed-out camera symbol underneath the video image. The marking is thereby deleted. You can, of course, re-set the marking at any time.
Angles and length ratios
To do this set two straight lines directly in the video presentation dragging the left mouse button. The angle between the straight lines and the respective length ratio is then automatically shown at the right lower frame next to the video image. Save the angles drawn in and the length ratios by clicking on the camera symbol underneath the video image. They are saved with the individual image and shown in the Report.
Setting the video interval
Pressing the left mouse button, move the cursor to the desired interval in the bar "Marked
images and video sequence".
Stance analysis
Textrelease R2 zebris FDM 1.12 77 18/06/2015 Software User Manual
To change the interval, move the cursor to a limitation line in the purple area until it
becomes a double arrow. With the left mouse button pressed you can now change the length
of the video sequence by dragging the limitation line.
Delete the marking by drawing the limitation lines together until the marking completely
disappears.

Stance analysis
Textrelease R2 zebris FDM 1.12 78 18/06/2015 Software User Manual
8.2.3 Functions
Playing the measurement
Automatic playing of the measurement by clicking on the Play button. The measurement recording is played and repeated until the Pause button is pressed.
Image fore/back
The arrows with the line directly next to them take you one image forwards, or backwards, resp.
Playing speed
A single click on this button opens a list for selecting the playing speed.
Zoom
Enlarging or reducing the platform display or the signal curves in the force/time diagram. The magnifying glass with a minus sign reduces the display by 20% The magnifying glass with a plus sign enlarges the display by 20%
Customizing
The platform presentation is centered in the view mode, whereby the zoom factor is determined automatically.
3D presentation
Switches the pressure distribution between the 2D and 3D presentation. The 2D presentation is activated when the button has a colored background.
Momentary pressure distribution
Shows the pressure distribution at the momentary cursor position. The cursor position is depicted through a dotted line in the timeline.
Maximum pressure picture
By clicking on this button, the maximum pressure picture is displayed. This setting is only active as long as the measurement is not played. Once the button Play is pressed, the setting jumps back to the momentary pressure distribution.
Average pressure distribution
This setting displays the average pressure distribution. The setting is only active as long as the measurement is not played. Once the button Play is pressed, the setting jumps back to Current Pressure Distribution.

Stance analysis
Textrelease R2 zebris FDM 1.12 79 18/06/2015 Software User Manual
Fading in/out of COP
Shows the Centre of Pressure as white blend line, at the same time, the pressure centre of every individual foot is displayed.
Individual images
In this way, individual images can be marked or deleted. Marked individual images are taken over into the Report. For details see “Selecting an interval for analysis in the Report “, p. 75.

Stance analysis
Textrelease R2 zebris FDM 1.12 80 18/06/2015 Software User Manual
8.3 Stance Analysis Report (Report mode)
In the "Report" mode, the stance analysis parameters which had previously been defined in
the "View" mode are assessed and shown.
Selecting the data set
First mark a data set and then click on Report.
Customize the Report
For displaying or hiding pages of the Report, click on Customize and you will be redirected to the report settings. By clicking on the OK button you will return to the database.
Report settings
On the left-hand side the categories are displayed. On the right-hand side the single parameters of the categories selected on the left-hand side are displayed.
Showing/Hiding parameters
By setting a tick on the right-hand side, the parameter is shown in the report. By removing the tick, the corresponding parameter does not appear in the report. By setting/removing a tick on the left-hand side, a whole category of parameters can be shown or hidden.
By setting or removing a tick in the customization menu Customize the stored data is neither changed nor deleted.

Stance analysis
Textrelease R2 zebris FDM 1.12 81 18/06/2015 Software User Manual
8.3.1 Functions
View
With these buttons you can stipulate how many pages of the Report are to be shown at one time. Alternatively the slide control for reducing/enlarging can be used.
Miniature view
Shows all the pages in an overview as small pictograms.
1:1
Shows the pages in the original size. Due to different screen resolutions, the size can deviate from the size of the printer paper.
Whole page
Adjusts the display such that the entire height of a page height can be shown.
Page width
The current page is zoomed to the fully available width.
Printing
The Report is printed out on the printer selected under printer settings.
PDF export
PDF export to any directory or, e.g. to external data carriers such as USB sticks.
Customizing
Showing and hiding individual pages of the report.
Printer settings
Select printer and change settings for printing (e.g. format, page size, etc.).
CSV export
Exporting the report parameters into a CSV file format (Comma separated values).

Stance analysis
Textrelease R2 zebris FDM 1.12 82 18/06/2015 Software User Manual
8.3.2 Description of the Report contents
The Report comprises the elements described in the following:
Header
Title, project name, patient name, date of the measurement and the company logo are in the header.
Stance phase, average
In this diagram the average load distribution under the feet is displayed in color. The color scale enables the load distribution to be quantified. The central point’s show the centers of pressure (COP) over the time. The left and right points are the respective centers of pressure of the left and right contact areas. The area of the displayed confidence ellipse contains 95% of the COP’s measuring points.

Stance analysis
Textrelease R2 zebris FDM 1.12 83 18/06/2015 Software User Manual
Force (N)
In the four "force versus time" diagrams, the chronological order of the vertical ground reaction forces of the left/right contact areas and of the forefoot and heel are shown.
Average forces (%)
The bar chart shows the averaged load distribution of the left and right forefoot or heel, as well as the load distribution of the left and right contact surface in per cent.
Camera - Video sequence
Here, the stride phase defined in the View mode is shown as a video sequence of seven images with the same time interval (given in seconds).
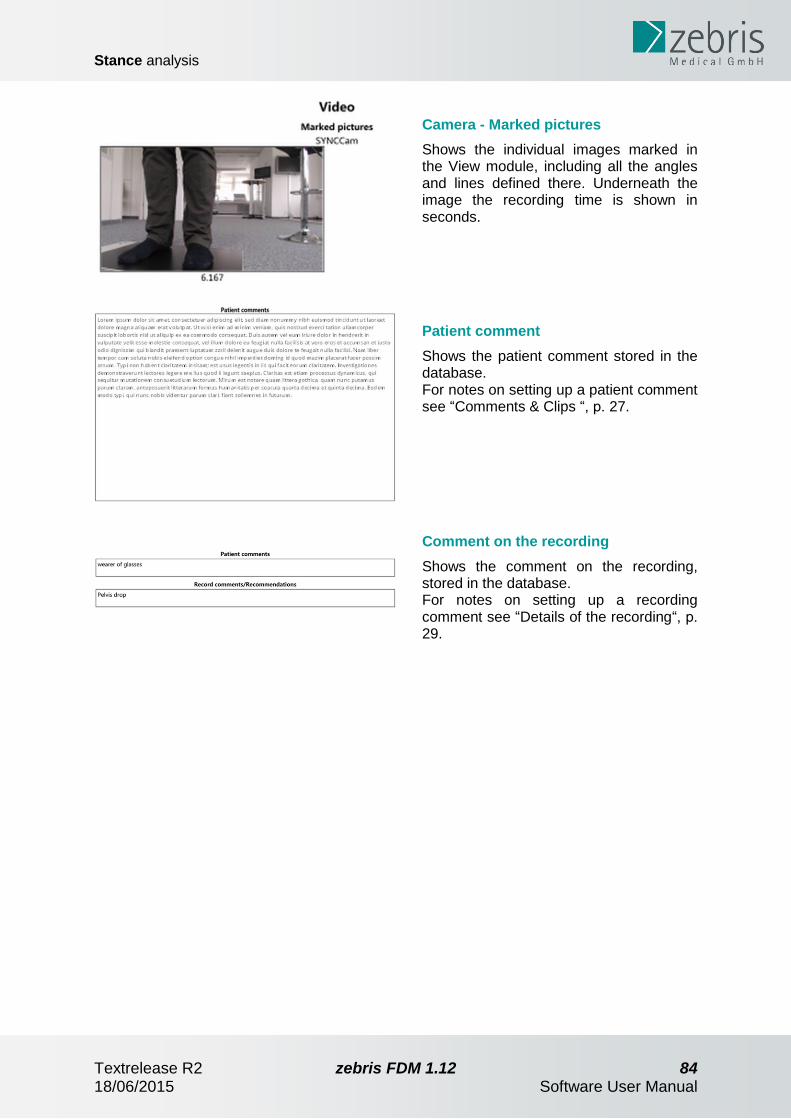
Stance analysis
Textrelease R2 zebris FDM 1.12 84 18/06/2015 Software User Manual
Camera - Marked pictures
Shows the individual images marked in the View module, including all the angles and lines defined there. Underneath the image the recording time is shown in seconds.
Patient comment
Shows the patient comment stored in the database. For notes on setting up a patient comment see “Comments & Clips “, p. 27.
Comment on the recording
Shows the comment on the recording, stored in the database. For notes on setting up a recording comment see “Details of the recording“, p. 29.
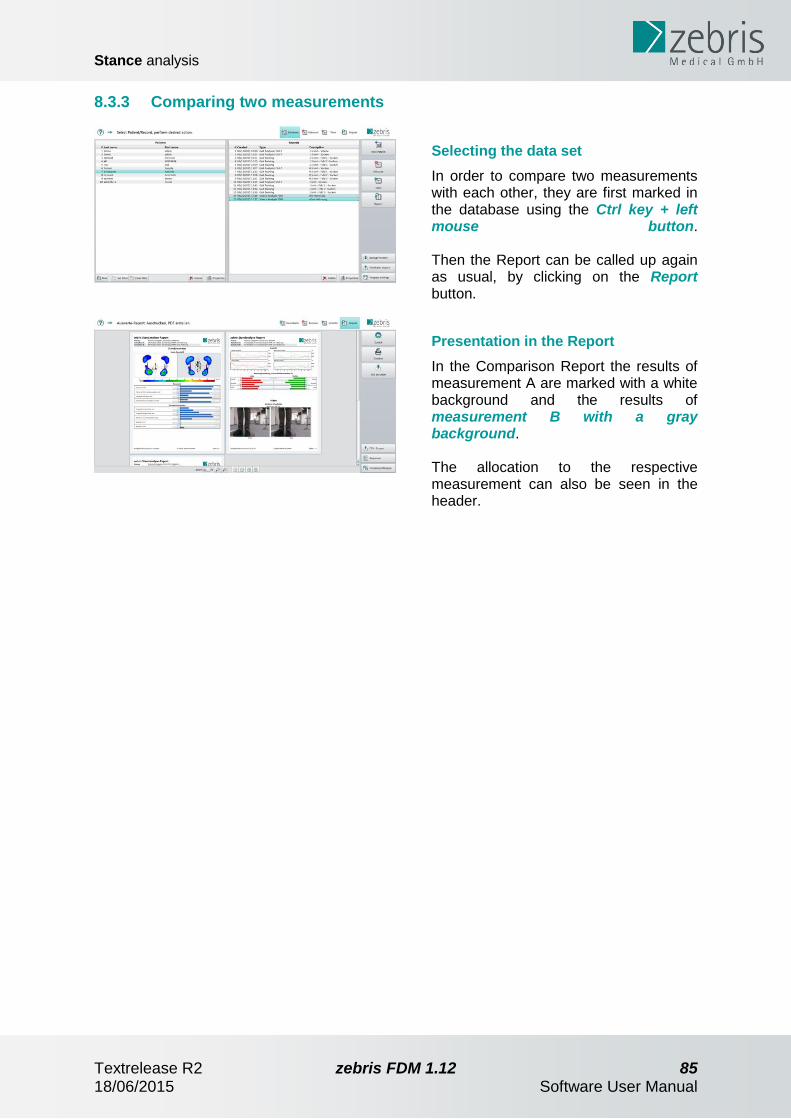
Stance analysis
Textrelease R2 zebris FDM 1.12 85 18/06/2015 Software User Manual
8.3.3 Comparing two measurements
Selecting the data set
In order to compare two measurements with each other, they are first marked in the database using the Ctrl key + left mouse button. Then the Report can be called up again as usual, by clicking on the Report button.
Presentation in the Report
In the Comparison Report the results of measurement A are marked with a white background and the results of measurement B with a gray background. The allocation to the respective measurement can also be seen in the header.

Stance analysis
Textrelease R2 zebris FDM 1.12 86 18/06/2015 Software User Manual
8.3.4 Help for evaluating the data acquired
In the following a pressure distribution is shown that is considered as ideal.
These values are valid for a normal load distribution, during stance, barefoot.
Ideal load distribution
An even load distribution of 50% each between the left and right standing surface is
considered as ideal.
Distribution between the forefoot and heel
There should be a load of approx. 1/3 (33%) on the forefoot and approx. 2/3 (66%) on the
heel.
Maximum pressure load
Between the forefoot and heel, the pressure should be approx. 1/3 (33%) on the forefoot and
approx. 2/3 (66%) on the heel. In the case of sensitive feet (e.g of diabetics, etc.) the
pressure ought not, if possible, to exceed 11~N/cm², to avoid any injury to the foot.

Visual Cueing
Textrelease R2 zebris FDM 1.12 87 18/06/2015 Software User Manual
9 Visual Cueing
With this module you can carry out gait training using a zebris FDM System and the
extension "Visual Stimulation". For installing and setting up the device, or the projection unit
(beamer), please see the enclosed Hardware Manual.
Please make sure the beamer is switched off in all other applications than gait training to not endanger the patient with confusing non-moving lights on the running belt.
9.1 Preparation
Before training can start, you must first configure the screen output and carry out a one-time,
static and dynamic calibration of the system.
9.1.1 Setting the screen output
For implementing the gait training, set your screen output as follows:
Windows 7
Press and hold down the Windows key. By pressing the P key again you set the selection to "Double" and then you let go of both keys. All the display units connected should now show the same display. Alternatively, make a right click on the desktop (Windows background) and click on "Screen resolution". Now from the list for multiple displays select the entry "Duplicate displays" and click on OK.
Windows XP
Please find the necessary settings on duplicating, or cloning the display in the manual of your
graphics card.
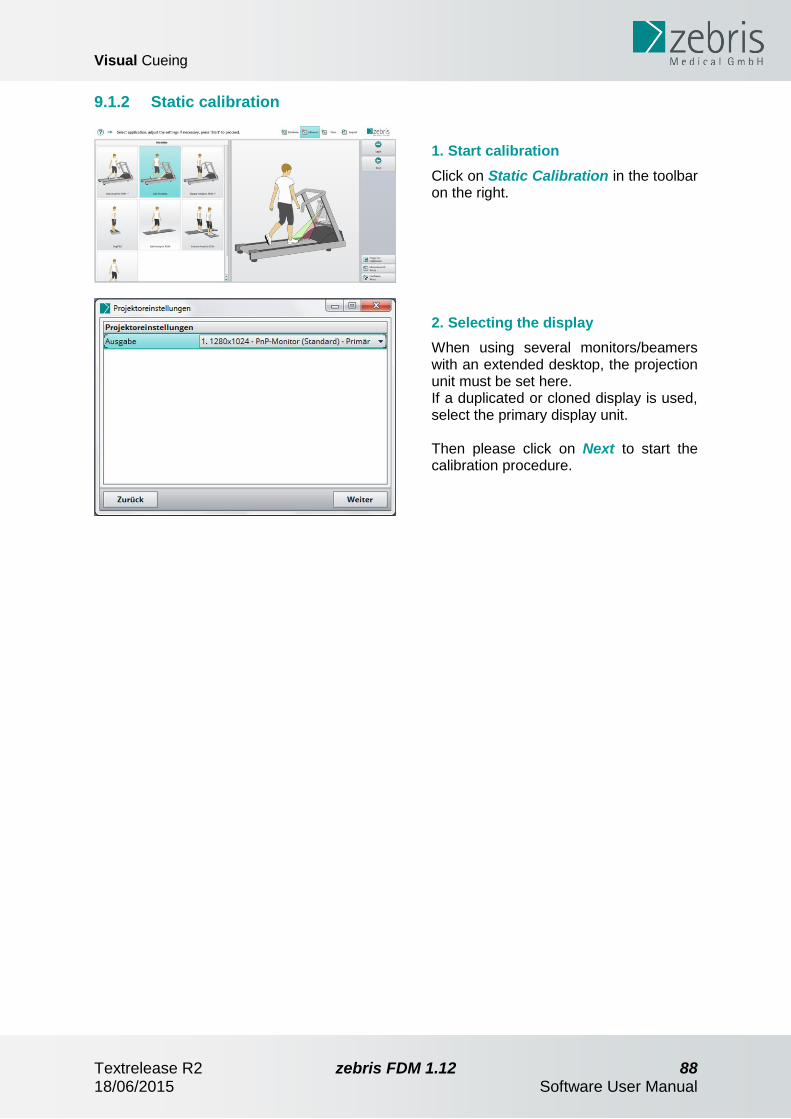
Visual Cueing
Textrelease R2 zebris FDM 1.12 88 18/06/2015 Software User Manual
9.1.2 Static calibration
1. Start calibration
Click on Static Calibration in the toolbar on the right.
2. Selecting the display
When using several monitors/beamers with an extended desktop, the projection unit must be set here. If a duplicated or cloned display is used, select the primary display unit. Then please click on Next to start the calibration procedure.

Visual Cueing
Textrelease R2 zebris FDM 1.12 89 18/06/2015 Software User Manual
Calibration procedure
A green point appears on the screen that can be shifted by pressing the left mouse button.
1. Focus your eye on the treadmill and shift the point to a corner of the running surface.
2. Once you have placed the point, press with one finger on the center of the white
cross without touching any other part of the running surface. The point disappears
now and the next appears for positioning. (If the point does not disappear during
printing, shift it slightly out of the corner towards the middle and press once more in
the middle of the white cross).
Repeat these steps for all four points in the four corners of the running surface. You do
not have to keep to any specific order.
Please note that for reasons of stability, the force measuring platform does not stretch underneath the entire running platform. There is a rim running along all the sides, particularly however at the sides in the running direction.
After the fourth point, the result is displayed.

Visual Cueing
Textrelease R2 zebris FDM 1.12 90 18/06/2015 Software User Manual
After the calibration, a green rectangle appears on the treadmill as a control, with a diagonal cross and four red points. The four red points show the places you have pressed on the force measuring platform.
Checking the calibration
The green rectangle plays back the position calculated by the calibration of the force measuring platform on the treadmill. Please check whether the edges of the rectangle run more or less parallel to the outside rims of the treadmill (the presentation on the monitor appears distorted). If this is not the case, please repeat the calibration once again.
You can finish the static calibration by clicking on Next.
The static calibration must be carried out again if the screen resolution or the position of the projector has been changed.
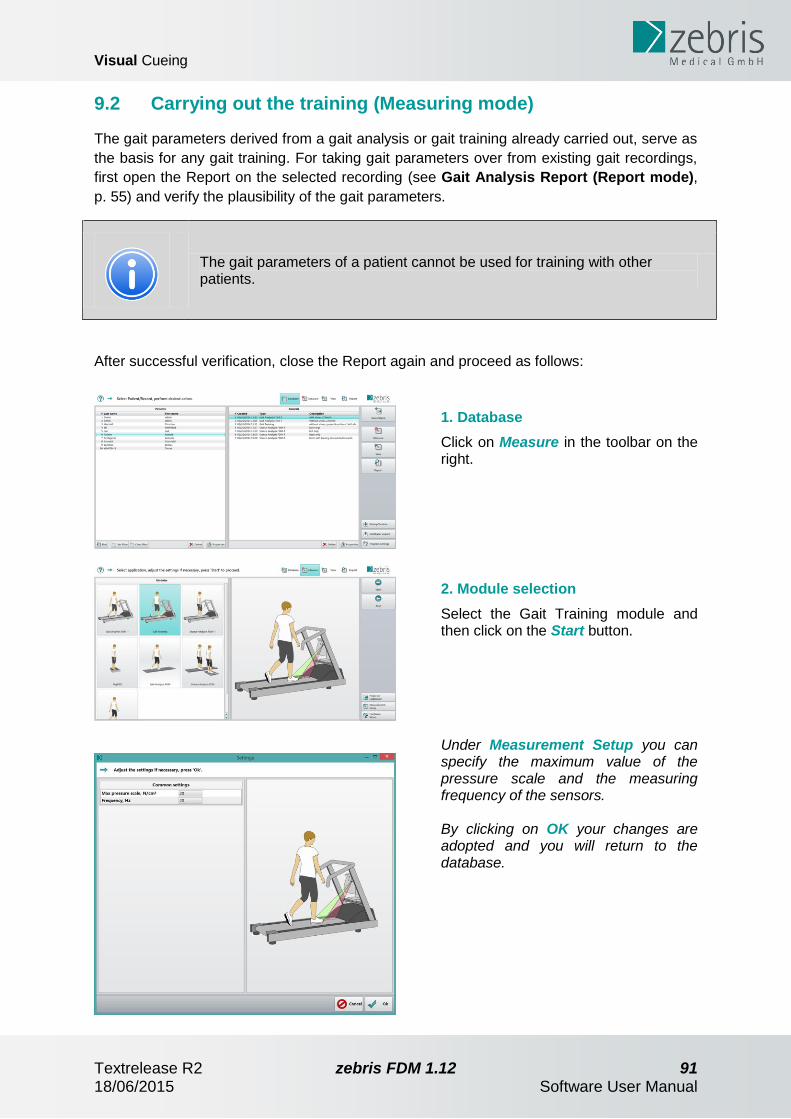
Visual Cueing
Textrelease R2 zebris FDM 1.12 91 18/06/2015 Software User Manual
9.2 Carrying out the training (Measuring mode)
The gait parameters derived from a gait analysis or gait training already carried out, serve as
the basis for any gait training. For taking gait parameters over from existing gait recordings,
first open the Report on the selected recording (see Gait Analysis Report (Report mode),
p. 55) and verify the plausibility of the gait parameters.
The gait parameters of a patient cannot be used for training with other patients.
After successful verification, close the Report again and proceed as follows:
1. Database
Click on Measure in the toolbar on the right.
2. Module selection
Select the Gait Training module and then click on the Start button.
Under Measurement Setup you can specify the maximum value of the pressure scale and the measuring frequency of the sensors. By clicking on OK your changes are adopted and you will return to the database.

Visual Cueing
Textrelease R2 zebris FDM 1.12 92 18/06/2015 Software User Manual
The duration of the training and the duration of the gait pattern adaptation can be changed on the left-hand side.
3. Loading the gait parameters
Load the gait parameters and foot contours from the Report last opened by clicking on Load patient data. You can alternatively load pre-defined sample data. For more details on setting the training parameters, please read in Preparation for training, p. 93

Visual Cueing
Textrelease R2 zebris FDM 1.12 93 18/06/2015 Software User Manual
9.2.1 Preparation for training
You can define the total duration of the training by using the slide control total training time.
The projections appear at the beginning of the training in the setting Initial gait pattern. After
starting the training, the gait parameters are continuously adapted to the setting under
Target gait pattern. How long this procedure takes, can be defined under Time to target.
Before starting the training, you should decide whether the foot rotation, the step width and
length are to remain the same during the training or whether they should be aligned:
The parameters should stay the same
Option a: Adjust the desired gait parameters under Target gait pattern and reset the
Time to target on the left-hand side to zero. You can disregard the settings under
Initial gait pattern. Please note that the target gait pattern is only displayed after
having started the recording.
Option b: Set the same gait parameters under Initial gait pattern and Target gait
pattern. The adjustment for the Time to target can be disregarded.
Parameters are to undergo a linear adjustment.
With Initial gait pattern, you define the parameters that are active at the beginning,
and under Target gait pattern the parameters at the end of the training. Then you
define the duration of the gait pattern adjustment in minutes at the lower left. A linear
transition takes place throughout the entire measuring duration.

Visual Cueing
Textrelease R2 zebris FDM 1.12 94 18/06/2015 Software User Manual
Patient Information and display of the footprints
Information
Shows patient data, description of the recording and the average speed of the downloaded gait analysis.
Changing projection patterns
Display of the target areas as rectangle Display as original footprints. The projection is inverted, so that the displayed area appears bigger, thus making it easier to step on the inside of the footprint.
Helper arrow
In the preview mode, the arrow indication can be faded in or out with the checkbox under the Start Recording button.
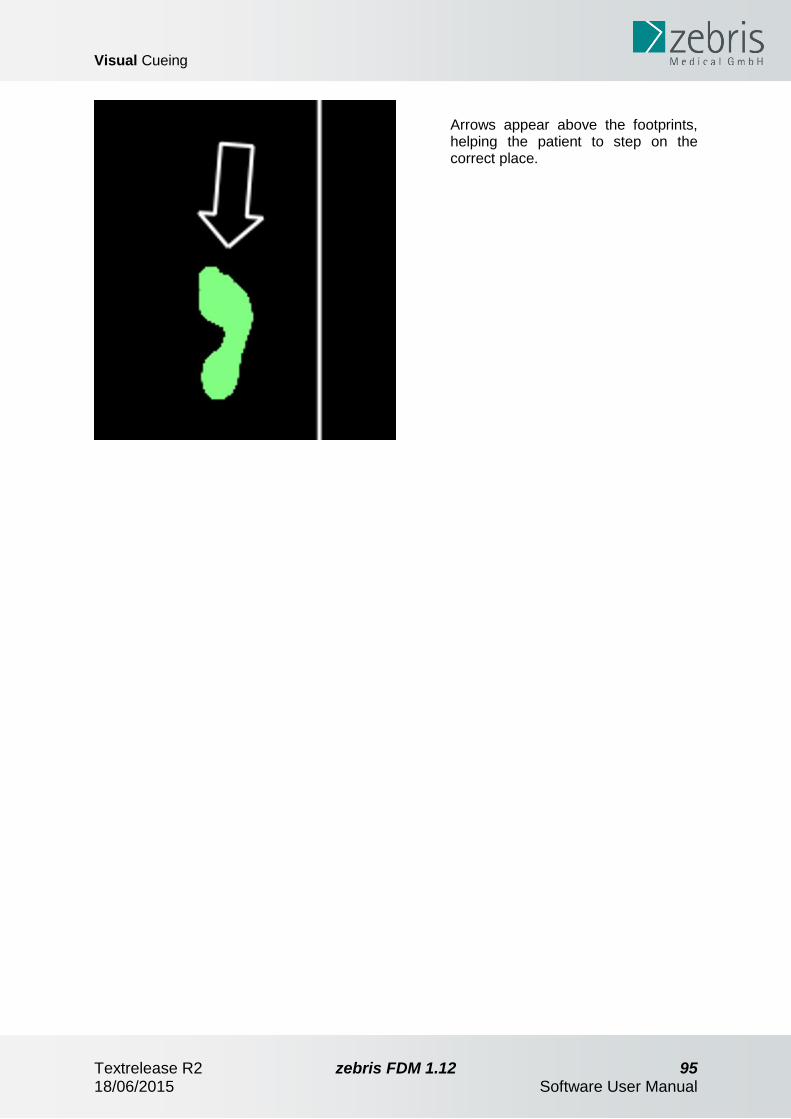
Visual Cueing
Textrelease R2 zebris FDM 1.12 95 18/06/2015 Software User Manual
Arrows appear above the footprints, helping the patient to step on the correct place.
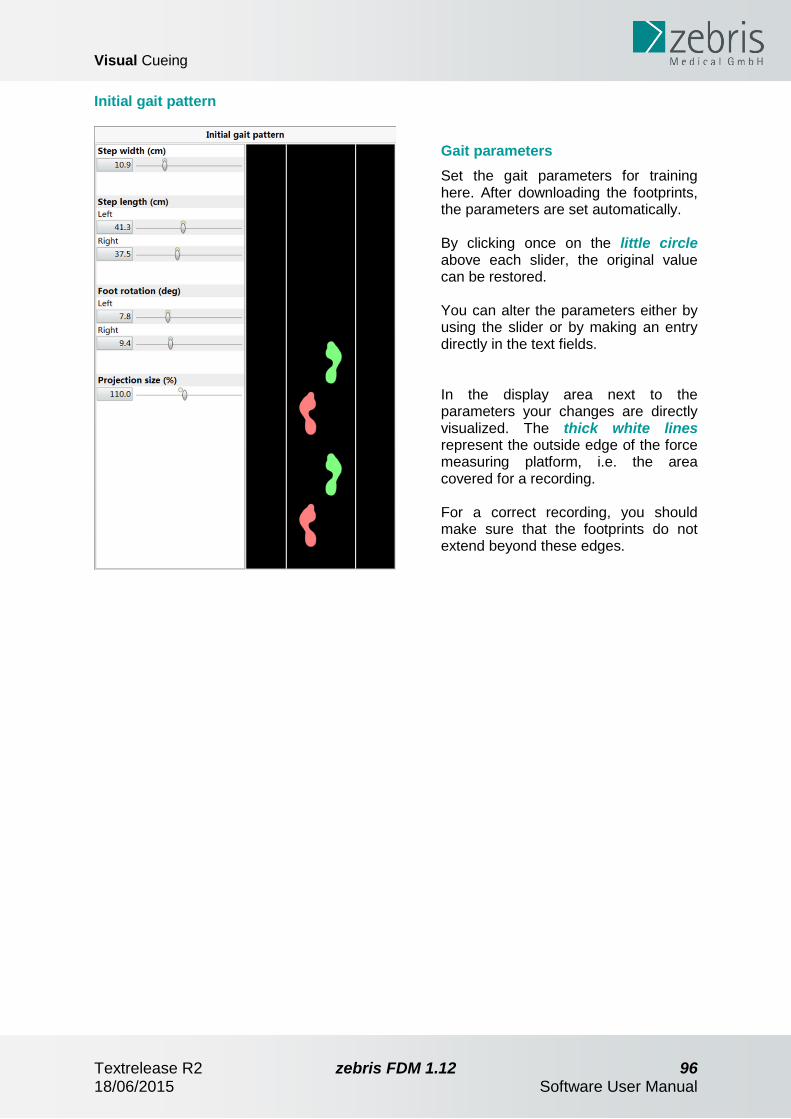
Visual Cueing
Textrelease R2 zebris FDM 1.12 96 18/06/2015 Software User Manual
Initial gait pattern
Gait parameters
Set the gait parameters for training here. After downloading the footprints, the parameters are set automatically. By clicking once on the little circle above each slider, the original value can be restored. You can alter the parameters either by using the slider or by making an entry directly in the text fields. In the display area next to the parameters your changes are directly visualized. The thick white lines represent the outside edge of the force measuring platform, i.e. the area covered for a recording. For a correct recording, you should make sure that the footprints do not extend beyond these edges.

Visual Cueing
Textrelease R2 zebris FDM 1.12 97 18/06/2015 Software User Manual
Target gait pattern
The setting of the parameters works analog to the section “Start Training” described before.
Only the setting of the projection size always has effects on both sections.
4. Start
After defining the training settings, click on Start. The display switches over to the Preview mode. By clicking on Back you will return to the module selection.
5. Preview mode
Now start the treadmill at the desired speed and allow your patients some time to get used to the projected footprints. The pressure distribution is displayed in real time for better control. At the beginning of the training, click on Start recording. Now, at this point the training time starts and the parameters undergo a linear adjustment, depending on the setting. By clicking on Back you will return to Preparation for training.
6. Measurement
To stop the recording prematurely, click on Stop recording. By clicking on Back you will return to the Preview mode.
7. Save
After clicking on the Stop button, a dialog box appears with the functions: save, continue or discard the measurement.

Visual Cueing
Textrelease R2 zebris FDM 1.12 98 18/06/2015 Software User Manual
Discard Record The recording is discarded and you return to the Preview mode to carry out a new measurement. Save & Close The recording is saved an you return to the database. Save & Repeat The recording is saved and you return to the Preview mode to carry out a new measurement.

Visual Cueing
Textrelease R2 zebris FDM 1.12 99 18/06/2015 Software User Manual
9.3 Processing the measurement (View mode)
In the "View mode" you can view and play the measurements, limit the measuring interval.
And when using a camera system, mark single images for the report as well as draw in
angles. In the following, the individual functions of the View mode are explained in detail.
9.3.1 Basics
Opening the measuring dataset
Select a measuring dataset in the database and click on View in the toolbar on the right.
Play the measurement
Click on Play in the toolbar on the right. The time display above the Play button shows the actual time of the measurement in seconds. Click on the box to enter a value By clicking on Back you will return to the database.
Export...
Here you can export a pressure image per foot as jpg graphic. After having selected the desired image, you are asked to assign a saving destination and a name.
1:1 Report
Opens the Report for the 1:1 printout. The data basis is the averaged stance phase of all the steps taken within the marked interval. The average, maximum resp. medium stance phase can be selected.

Visual Cueing
Textrelease R2 zebris FDM 1.12 100 18/06/2015 Software User Manual
The manual step definition for the gait analysis FDM is momentarily not available.
Automatic step definition
By clicking on the corresponding button, the following dialog window opens (see below).
When clicking Ok, all previously defined steps are deleted and the automatic step definition is carried out again.
Manual step definition
In case that the automatic step definition has not recognized the test person's gait pattern, you can also define the steps manually. Therefore, click on Manual Step Definition. All steps are deleted and you are redirected to the mode of manual definition.
By holding down the left mouse button you can navigate over the timeline with the help of the vertical dashed line (cursor). By pressing Undo/Repeat you can jump back and forth in the work process.
1. Navigate to the footprint
Navigate in the time course to the left

Visual Cueing
Textrelease R2 zebris FDM 1.12 101 18/06/2015 Software User Manual
footprint, with which you would like to start. If you prefer to start with the right footprint, then click on Next.
2. Click on the footprint
Click on a part of the footprint that is to be defined. A frame around the footprint is then generated automatically.
Now the displayed frame can be adjusted by using the displayed points. If required, shift the points into another position inside the frame by dragging with the left mouse button. After having finished the manual step definition, click the button Finish and your changes are saved.
You will have to define at least five steps, as this number is necessary for the evaluation of the report. If you have defined fewer steps, a note appears after clicking Finish. Close it and define more steps.
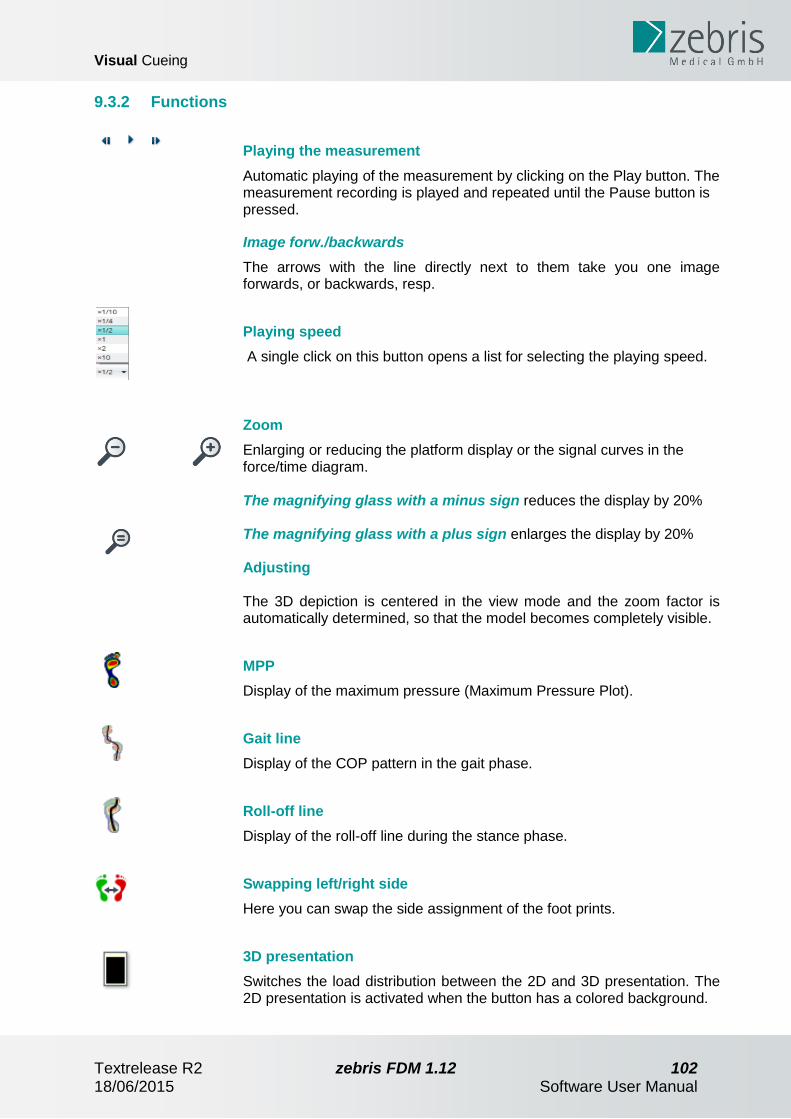
Visual Cueing
Textrelease R2 zebris FDM 1.12 102 18/06/2015 Software User Manual
9.3.2 Functions
Playing the measurement
Automatic playing of the measurement by clicking on the Play button. The measurement recording is played and repeated until the Pause button is pressed.
Image forw./backwards
The arrows with the line directly next to them take you one image forwards, or backwards, resp.
Playing speed
A single click on this button opens a list for selecting the playing speed.
Zoom
Enlarging or reducing the platform display or the signal curves in the force/time diagram. The magnifying glass with a minus sign reduces the display by 20% The magnifying glass with a plus sign enlarges the display by 20% Adjusting The 3D depiction is centered in the view mode and the zoom factor is automatically determined, so that the model becomes completely visible.
MPP
Display of the maximum pressure (Maximum Pressure Plot).
Gait line
Display of the COP pattern in the gait phase.
Roll-off line
Display of the roll-off line during the stance phase.
Swapping left/right side
Here you can swap the side assignment of the foot prints.
3D presentation
Switches the load distribution between the 2D and 3D presentation. The 2D presentation is activated when the button has a colored background.

Visual Cueing
Textrelease R2 zebris FDM 1.12 103 18/06/2015 Software User Manual
Single images
Single images can be marked or deleted with this function. Marked pictures are transferred to the report. (see 7.3.4)
Selecting a video sequence of a gait cycle
Select automatically the video sequence of the gait cycle at the current playing position. (see 7.3.4)
9.3.3 Visualization of the load distribution
Numerical display of the pressure values
In the 2D presentation, the pressure values of the roll-off pattern can be shown numerically. To do this, deactivate the 3D mode by clicking on 3D (if the button is not highlighted in color, the 3D presentation is active.) By enlarging with the middle mouse button or magnifier tool the pressure values of the individual sensors and the limiting frame are displayed.

Visual Cueing
Textrelease R2 zebris FDM 1.12 104 18/06/2015 Software User Manual
Please note that the presentation here has been smoothed, which can cause inaccuracies and rounding errors in the area at the edges of the pressure image displayed.
Recordings that are carried out with with visual cueing, the projected footprints are shown as a gray shadow. In this way, it is possible to make a visual assessment of the training in advance.
9.3.4 Selecting a certain interval for analysis in the Report
With zebris FDM it is possible to analyze either the total data volume recorded or only a
certain interval.
Select measuring data
Two blue limitation lines in the the force/- time diagram mark the area for analysis. For the Report the area with the blue background is discarded and only the data in the white area is evaluated.
Customizing the area for analysis
Move the cursor over the limitation line from blue to white. The cursor changes to a double arrow. With the left mouse button pressed you can now restrict the area for analysis by dragging the limitation lines.
Selecting video sequences
Please note, that the use of video cameras is not available with all modules.

Visual Cueing
Textrelease R2 zebris FDM 1.12 105 18/06/2015 Software User Manual
1. Define a position
In order to transfer video images to the report, click on the desired position in the time-force diagram. The dotted line (cursor) is shifted to the clicked position. You can shift the cursor with the left mouse button resp. the image back/forth button to the desired position.
2. Define the video interval
By clicking on the movie symbol, the gait cycle around the marked position is selected (each one step before/one step after). In order to select a larger section, move the mouse cursor on a limitation line of the violet section, until it becomes a double cursor. While keeping the left mouse button pressed, you can now change the length of the video sequence by drawing the limitation line. Delete the marking by pulling the limitations together until the marking disappears completely.
Marking single images in the video, angles and length ratios
Using the magnifying glass, the displayed image section can be enlarged or minimized. By clicking with the right mouse button on the image section, the following functions in the context menu open: “Copy current image in the clipboard” as well as “Save video under”. When it comes to recordings with several cameras, a colored frame marks the currently selected video image.
Marking a single image
Click on the desired position in the force-time diagram. The dotted line (cursor) is set at the clicked position.
Visual Cueing
Textrelease R2 zebris FDM 1.12 106 18/06/2015 Software User Manual
Then click on the camera symbol under the video image. The marking appears as blue line in the bar „single images and video sequences“.
Deleting a single image
Click on the single image marking in the bar „Single images and video sequence“ (blue line). Then, click on the crossed out video symbol. In doing so, the marking is deleted. Of course, you can set the marking any time again.
Angles and Length ratios
Draw two straight lines with the left mouse button directly in the video mode. Then the angles between the straight lines as well as the length ratio to one another are displayed automatically at the right bottom edge of the video image. The drawn in angles and the length ratios are saved with the single image and displayed in the report.

Visual Cueing
Textrelease R2 zebris FDM 1.12 107 18/06/2015 Software User Manual
9.4 Visual Cueing Report (Report mode)
In the "Report" mode, the gait parameters are assessed and shown which had previously
been defined in the "View" mode.
Selecting the data set
First mark a data set and then click on Report.
Align the Report
For displaying or hiding single parameters of the Report, click on Customize and you will be redirected to the report settings. By clicking on the Ok button your changes are saved and you will return to the database.
Report settings
On the left-hand side, categories are displayed. On the right-hand side, the single parameters of the category that has been chosen on the left, are displayed
Fade in /fade out of parameters
By placing a tick on the right-hand side, the parameter is displayed in the report. Once the tick is removed, the corresponding parameter does not appear in the report. By setting/removing a tick on the left-hand side, a whole category of parameters can be displayed or faded out.
By setting or removing a tick in the drop-down menu the stored data is neither changed nor deleted.
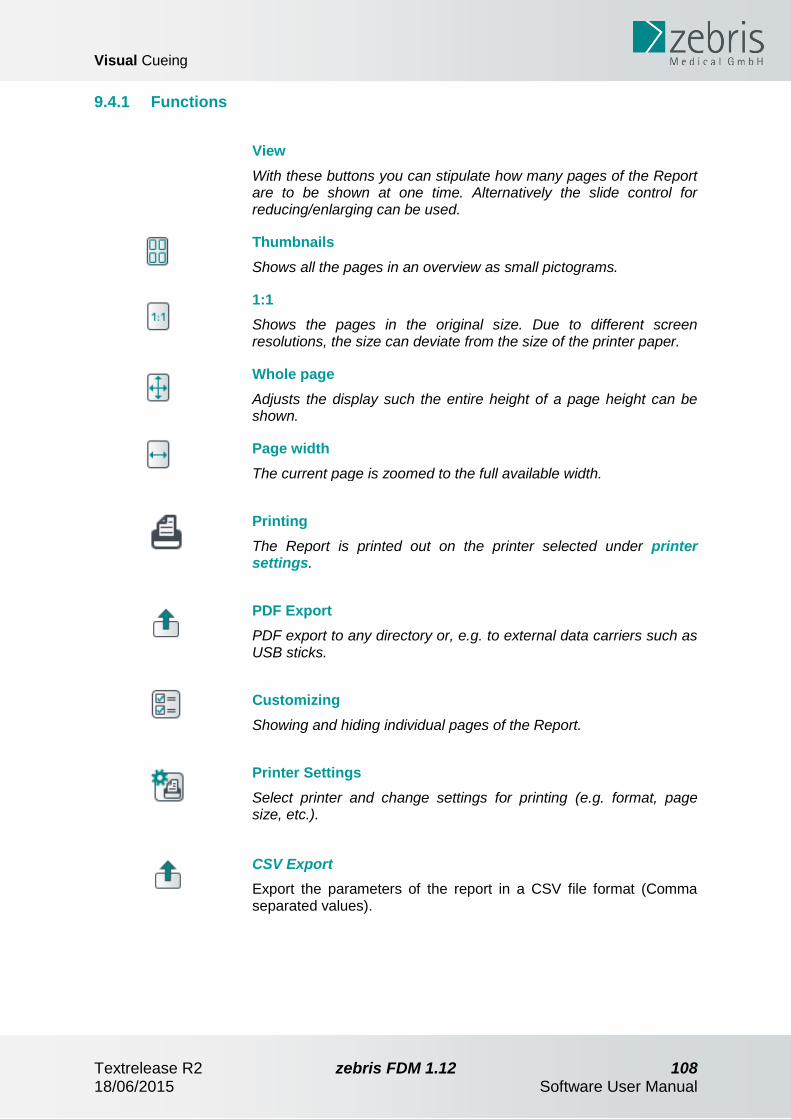
Visual Cueing
Textrelease R2 zebris FDM 1.12 108 18/06/2015 Software User Manual
9.4.1 Functions
View
With these buttons you can stipulate how many pages of the Report are to be shown at one time. Alternatively the slide control for reducing/enlarging can be used.
Thumbnails
Shows all the pages in an overview as small pictograms.
1:1
Shows the pages in the original size. Due to different screen resolutions, the size can deviate from the size of the printer paper.
Whole page
Adjusts the display such the entire height of a page height can be shown.
Page width
The current page is zoomed to the full available width.
Printing
The Report is printed out on the printer selected under printer settings.
PDF Export
PDF export to any directory or, e.g. to external data carriers such as USB sticks.
Customizing
Showing and hiding individual pages of the Report.
Printer Settings
Select printer and change settings for printing (e.g. format, page size, etc.).
CSV Export
Export the parameters of the report in a CSV file format (Comma separated values).

Visual Cueing
Textrelease R2 zebris FDM 1.12 109 18/06/2015 Software User Manual
9.4.2 Description of the Report contents
The Report comprises the elements described in the following:
Header
Title, project name, patient name, date of the measurement and the company logo are in the header.
Training success
Overview of the training parameters you set before. In doing so, a difference is made between the gait pattern and the training objective.
Success statistics
In this diagram, the hit rate is shown for each step as a percentage, i.e. the percentage of the patient's footprint that is positioned inside the projected area.
Success rate
Presentation of the hit rate as a percentage of all the steps for the left and right foot.
Foot rotation
Here the foot rotation to the left and right is shown for each step.
Step length
Presentation of the step length of each step.

Visual Cueing
Textrelease R2 zebris FDM 1.12 110 18/06/2015 Software User Manual
Step width
In this diagram the step width is displayed for each step.
9.4.3 Explanation of gait parameters
Foot rotation, degree
Describes the angle between the longitudinal axis of the foot and the running direction.
(Negative value = inward rotation, positive value = outward rotation)
Step width, cm
Describes the distance between the right and left foot.
Step length, cm
Describes the distance between the heel contact of one side of the body and the heel contact
of the contralateral side.

Visual Cueing
Textrelease R2 zebris FDM 1.12 111 18/06/2015 Software User Manual
9.4.4 Comparing two measurements
Selecting the data set
In order to compare two measurements with each other, they are first marked in the database using the Ctrl-key + left mouse button. Then the Report can be called up as usual, by clicking on the Report button.
Presentation in the Report
In the Comparison Report the results of measurement A are marked with a white background and the results of measurement B with a grey background. The allocation to the respective measurement can also be seen in the header.
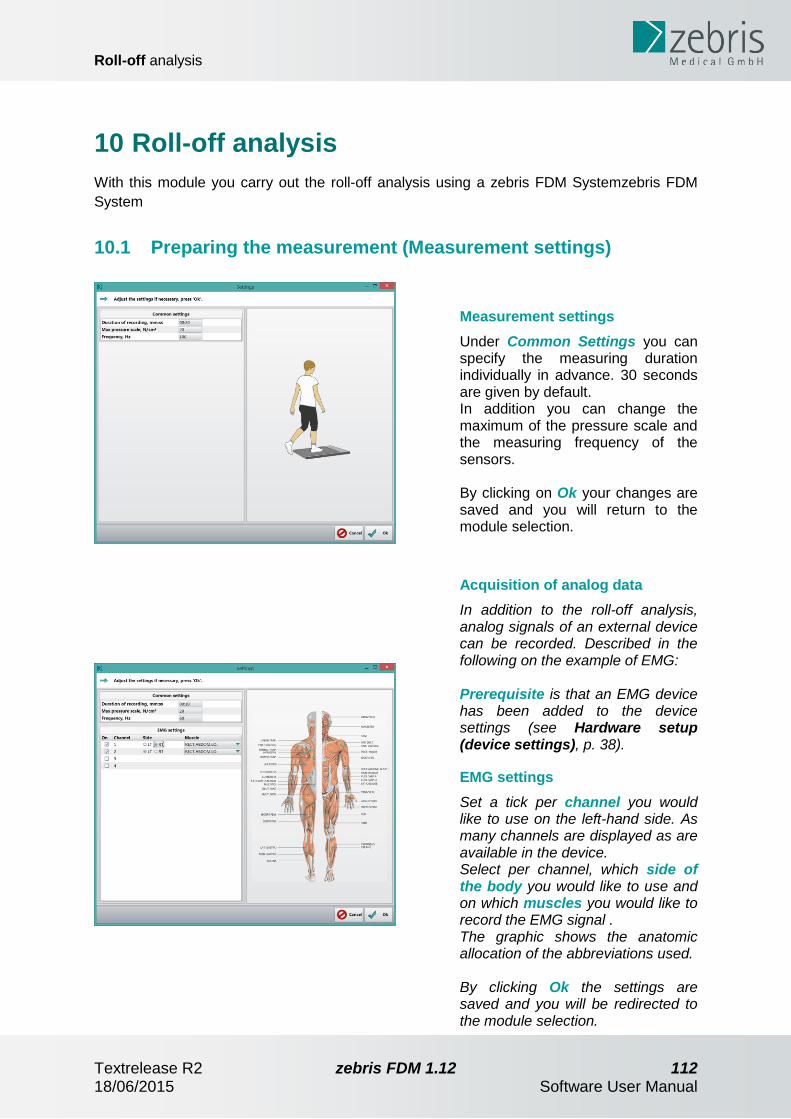
Roll-off analysis
Textrelease R2 zebris FDM 1.12 112 18/06/2015 Software User Manual
10 Roll-off analysis
With this module you carry out the roll-off analysis using a zebris FDM Systemzebris FDM
System
10.1 Preparing the measurement (Measurement settings)
Measurement settings
Under Common Settings you can specify the measuring duration individually in advance. 30 seconds are given by default. In addition you can change the maximum of the pressure scale and the measuring frequency of the sensors. By clicking on Ok your changes are saved and you will return to the module selection.
Acquisition of analog data
In addition to the roll-off analysis, analog signals of an external device can be recorded. Described in the following on the example of EMG: Prerequisite is that an EMG device has been added to the device settings (see Hardware setup (device settings), p. 38).
EMG settings
Set a tick per channel you would like to use on the left-hand side. As many channels are displayed as are available in the device. Select per channel, which side of the body you would like to use and on which muscles you would like to record the EMG signal . The graphic shows the anatomic allocation of the abbreviations used. By clicking Ok the settings are saved and you will be redirected to the module selection.

Roll-off analysis
Textrelease R2 zebris FDM 1.12 113 18/06/2015 Software User Manual
10.2 Carry out measurement (Measuring mode)
1. Database
Click on Measure in the toolbar on the right.
2. Module selection
Select the module Roll-off Analysis and then click on Start.
3. Preparation Please ask your test person to stand next to the treadmill or on the side bar, so that a zero measurement can be taken in an unloaded state. Then change to the Preview mode by clicking on Next. By clicking on Back you will return to the module selection.
4. Preview/recording
In the Preview mode, the screen alongside appears. The test person can walk over the platform for test purposes, data is only displayed, yet not stored. The measurement can be started by clicking on Record. By clicking Back you will return to the module selection.

Roll-off analysis
Textrelease R2 zebris FDM 1.12 114 18/06/2015 Software User Manual
5. Measurement
After Start the recording the measuring signals are recorded over the preset measuring duration. Your test person can arbitrarily often walk over the plate in the outlined directions with one foot each. Ideally you start with the left foot, the recommendation changes after each step to the other foot. The green progress bar shows the elapsed measuring time. The measurement can be stopped at any time by clicking on the Stop button. In the lower, right-hand part of the measurement screen, the force and pressure curves are shown in chronological sequence.
6. Save
After clicking on the Stop button, a dialog box appears.
Save & continue
The recording is saved and you return to the Preview mode to carry out a new measurement.
Discard recording
The recording is discarded and you return to the Preview mode to carry out a new measurement.
Save & close
The recording is saved an you return to the database.

Roll-off analysis
Textrelease R2 zebris FDM 1.12 115 18/06/2015 Software User Manual
The color scale to the left of this measuring window enables the color assignment of the pressure in N/cm² exerted on the individual sensors. The maximum value can be stated in the input field, top left. By pressing the left mouse button and dragging at the same time on the scale, the scaling can be changed. In the left measuring window, the load distribution under the feet during the measurement is shown using a color mode, in either 2D or 3D, as required. In 3D mode, the view can be turned to the desired position by pressing the left mouse button. By pressing the middle mouse scroll wheel the platform can be moved in 3D. The zoom buttons serve for enlarging (+) or reducing (-) the platform presentation. By turning mouse scroll wheel it is similarly possible to zoom. With customize the platform presentation is centered whereby the zoom factor is determined automatically. The 3D button switches between the 2D or 3D presentation of the load distribution. The 2D presentation is activated when the button has a colored background.
10.3 Processing the measurement (View mode)
In the "View mode" you can view and play the measurements, limit the measuring interval.
And when using a camera system, mark single images for the report as well as draw in
angles. In the following, the individual functions of the View mode are explained in detail.
10.3.1 Basics
Opening the measuring dataset
Select a measuring dataset in the database and click on View in the toolbar on the right.

Roll-off analysis
Textrelease R2 zebris FDM 1.12 116 18/06/2015 Software User Manual
Play the measurement
Click on Play in the toolbar on the right. The time display above the Play button shows the actual time of the measurement in seconds. Click on the box to enter a value By clicking on Back you will return to the database.
Export...
Here you can select between different export possibilities. For example, you can export a pressure picture per foot as jpg graphics (JPG).
1:1 Report
Opens the Report for the 1:1 printout. The data basis is the averaged stance phase of all the steps taken within the marked interval. You can select between the average resp. maximum stance phase.
Automatic step definition
By clicking on the corresponding button all previous steps are deleted and the automatic step definition for recognizing the steps of the test persons’s gait pattern is carried out again.

Roll-off analysis
Textrelease R2 zebris FDM 1.12 117 18/06/2015 Software User Manual
10.3.2 Functions
Playing the measurement
Automatic playing of the measurement by clicking on the Play button. The measurement recording is played and repeated until the Pause button is pressed.
Image forw./backwards
The arrows with the line directly next to them take you one image forwards, or backwards, resp.
Playing speed
A single click on this button opens a list for selecting the playing speed.
Zoom
Enlarging or reducing the platform display or the signal curves in the force/time diagram. The magnifying glass with a minus sign reduces the display by 20% The magnifying glass with a plus sign enlarges the display by 20% Customizing The platform presentation is centered in this view mode, whereby the zoom factor is determined automatically.
MPP
Display of the maximum pressure (Maximum Pressure Plot).
Roll-off line
Display of the roll-off line during the stance phase.
Change left/right side
Here you can change the side of the selected footprint.
3D presentation
Switches the load distribution between the 2D and 3D presentation. The 2D presentation is activated when the button has a colored background.
Single images
Single images can be marked or deleted with this function. Marked pictures are transferred to the report. (see 7.3.4)
Selecting a video sequence of a gait cycle
Select automatically the video sequence of the gait cycle at the current

Roll-off analysis
Textrelease R2 zebris FDM 1.12 118 18/06/2015 Software User Manual
playing position. (see 7.3.4)

Roll-off analysis
Textrelease R2 zebris FDM 1.12 119 18/06/2015 Software User Manual
10.3.3 Visualization of the load distribution
Numerical display of the pressure values
In the 2D presentation, the pressure values of the roll-off pattern can be shown numerically. To do this, deactivate the 3D mode by clicking on 3D (if the button is not highlighted in color, the 3D presentation is active.) By enlarging with the middle mouse button or magnifier tool the pressure values of the individual sensors and the limiting frame are displayed.
Please note that the presentation here has been smoothed, which can cause inaccuracies and rounding errors in the area at the edges of the pressure image displayed.
10.3.4 Selecting a certain interval for analysis in the Report
With zebris FDM it is possible to analyze either the total data volume recorded or only a
certain interval.
Select measuring data
One cycle each marks a roll-off process in the recording. By double clicking the cycle (numbers ease the assignment) in the time line, it can be switched on or off for the report. For the report the area with the blue background is discarded and only the data in the white area is evaluated. After each measurement all cycles are automatically displayed in the report.
Selecting video sequences
Please note, that the use of video cameras is not available with all modules.

Roll-off analysis
Textrelease R2 zebris FDM 1.12 120 18/06/2015 Software User Manual
1. Define a position
In order to transfer video images to the report, click on the desired position in the time-force diagram. The dotted line (cursor) is shifted to the clicked position. You can shift the cursor with the left mouse button resp. the image back/forth button to the desired position.
2. Define the video interval
By clicking on the movie symbol, the gait cycle around the marked position is selected (each one step before/one step after). In order to select a larger section, move the mouse cursor on a limitation line of the violet section, until it becomes a double cursor. While keeping the left mouse button pressed, you can now change the length of the video sequence by drawing the limitation line. Delete the marking by pulling the limitations together until the marking disappears completely.
Marking single images in the video, angles and length ratios
The displayed image section can be reduced or enlarged, using the magnifying glasses.
By clicking with the right mouse button on the image section, the following functions open in
the context menu: “Copy current image in the clipboard” as well as “Save video under”.
When recording with several cameras, a colored frame marks the currently selected video
image.
Marking a single image
Click on the desired position in the force-time diagram. The dotted line (cursor) is set at the clicked position. Then click on the camera symbol under the video image. The marking appears as blue line in the bar „single images and video sequences“.
Deleting a single image
Click on the single image marking in the bar „Single images and video sequence“
Roll-off analysis
Textrelease R2 zebris FDM 1.12 121 18/06/2015 Software User Manual
(blue line). Then, click on the crossed out video symbol. In doing so, the marking is deleted. Of course, you can set the marking any time again.
Angles and Length ratios
Draw two straight lines with the left mouse button directly in the video mode. Then the angles between the straight lines as well as the length ratio to one another are displayed automatically at the right bottom edge of the video image. The drawn in angles and the length ratios are saved with the single image and displayed in the report.

Roll-off analysis
Textrelease R2 zebris FDM 1.12 122 18/06/2015 Software User Manual
10.4 Roll-off analysis Report (Report mode)
In the "Report" mode, the gait parameters are assessed and shown which had previously
been defined in the "View" mode.
Selecting the data set
First mark a data set and then click on Report.
Align the Report
For displaying or hiding single parameters of the Report, click on Customize and you will be redirected to the report settings. By clicking on the OK button your changes are saved and you will return to the database.
Report settings
On the left-hand side, categories are displayed. On the right-hand side, the single parameters of the category that has been chosen on the left, are displayed.
Fade in/fade out of parameters
By placing a tick on the right-hand side, the parameter is displayed in the report. Once the tick is removed, the corresponding parameter does not appear in the report. By placing/removing a tick on the left-hand side, a whole category of parameters can be displayed or faded out.
By setting or removing a tick in the drop-down menu the stored data is neither changed nor deleted.

Roll-off analysis
Textrelease R2 zebris FDM 1.12 123 18/06/2015 Software User Manual
10.4.1 Functions
View
With these buttons you can stipulate how many pages of the Report are to be shown at one time. Alternatively the slide control for reducing/enlarging can be used.
Miniature view
Shows all the pages in an overview as small pictograms.
Whole page
Shows the pages in the original size. Due to different screen resolutions, the size can deviate from the size of the printer paper.
1:1
Adjusts the display such the entire height of a page height can be shown.
Page width
The current page is zoomed to the full available width
Printing
The Report is printed out on the printer selected under printer settings.
PDF export
PDF export to any directory or, e.g. to external data carriers such as USB sticks.
Customize
Showing and hiding categories of the Report.
Printer settings
Select printer and change settings for printing (e.g. format, page size, etc.).
CSV export
Export of the report parameters in a CSV file format (Comma separated values.).

Roll-off analysis
Textrelease R2 zebris FDM 1.12 124 18/06/2015 Software User Manual
10.4.2 Description of the Report contents
The Report comprises the elements described in the following:
Header
Title, project name, patient name, date of the measurement and the company logo are in the header.
Force fore foot/rear foot
The maximum force for fore foot and rear foot is displayed in this 3D figure.
Maximum pressure pictures
In this diagram the maximum pressure pictures are displayed in color. Each maximum pressure picture (MPP) contains the highest pressure values of a complete roll-off pattern. The line of the force application points is displayed separately for each foot.
Stance phase average
This diagram shows the average of all the maximum pressure pictures recorded.
Stance phase maximum
This diagram shows the absolute maximum pressure picture of all the maximum pressure pictures recorded.
Color scale
The color scale enables the load distribution to be quantified.
COP analysis
This block analyzes the course of the center of pressure (COP) during the selected step cycles. When taking the double-standing phase and the load transfer into consideration, the typical butterfly diagram of the force application

Roll-off analysis
Textrelease R2 zebris FDM 1.12 125 18/06/2015 Software User Manual
points is produced.
Gait line left and right
Here the lines of the force application points are shown separately for each foot.

Roll-off analysis
Textrelease R2 zebris FDM 1.12 126 18/06/2015 Software User Manual
10.4.3 Force & Pressure
Average maximum pressure
Presentation of the averaged and
normalized pressure curves. The standard
deviation is shown as a shaded area, and
the dotted line represents the maximum
values. The vertical line separates the
stance and swing phase.
Average force
Diagram of the average vertical reaction force. The area of the standard deviation is indicated as a shadowed area. The height of the maximum force and its localization related to the gait cycle are given for the heel and forefoot for the left and right side, respectively. The vertical line separates the stance and swing phase.
Force parameters
Shown here are the amplitudes recorded in the force curve together with their position in the gait cycle.

Roll-off analysis
Textrelease R2 zebris FDM 1.12 127 18/06/2015 Software User Manual
10.4.4 Three foot zone analysis
Here the load surface area of the left and right side of the body is divided into the zones: forefoot, mid-foot and heel and shown in color. A force curve corresponds in the respective color for each zone. The maximum pressure pictures of the entire load surface area of the left and right side of the body are shown at three fixed times.
Fmax t1 Time of the maximum heel force
Fmax t2 Time of the maximum force on the forefoot
(t1+t2)/2 Load distribution between the two times t1 and t2
Here the parameters are shown as a bar chart and briefly described the indicator indicates the standard deviation in each case.
Load change
The absolute load change from the heel to the forefoot during the stance phase given as a percentage.
Maximum force, N
The average maximum values reached in N/cm² for the three zones: forefoot width, mid-foot and heel.
Maximum pressure, N/cm²
The average maximum values reached in N/cm² for the three zones: forefoot width, mid-foot and heel.
Time maximum force, % of stance time
Der durchschnittliche Zeitpunkt im Gangzyklus, bei dem die Maximalwerte in Newton für die drei Zonen Vorfußbreite, Mittelfuß und Ferse erfasst wurden.
Contact time, % of stance time
The average contact time of the three zones, forefoot width, mid-foot and heel as a percentage.

Roll-off analysis
Textrelease R2 zebris FDM 1.12 128 18/06/2015 Software User Manual
10.4.5 Video
Camera - Video sequence
Here, the stride phase defined in the View module, is shown as a video sequence of ten images with the same time interval (given in seconds).
Camera – Marked pictures
Shows the individual images marked in the "View" module, including all the angles and lines defined there. Underneath the image the recording time is shown in seconds.
10.4.6 Comments
Patient comment
Shows the patient comment stored in the database. For notes on setting up a patient comment see Comments & Clips , p. 27.
Comment on the recording
Shows the comment on the recording, stored in the database. For notes on setting up a recording comment see Details of the recording, p. 29.
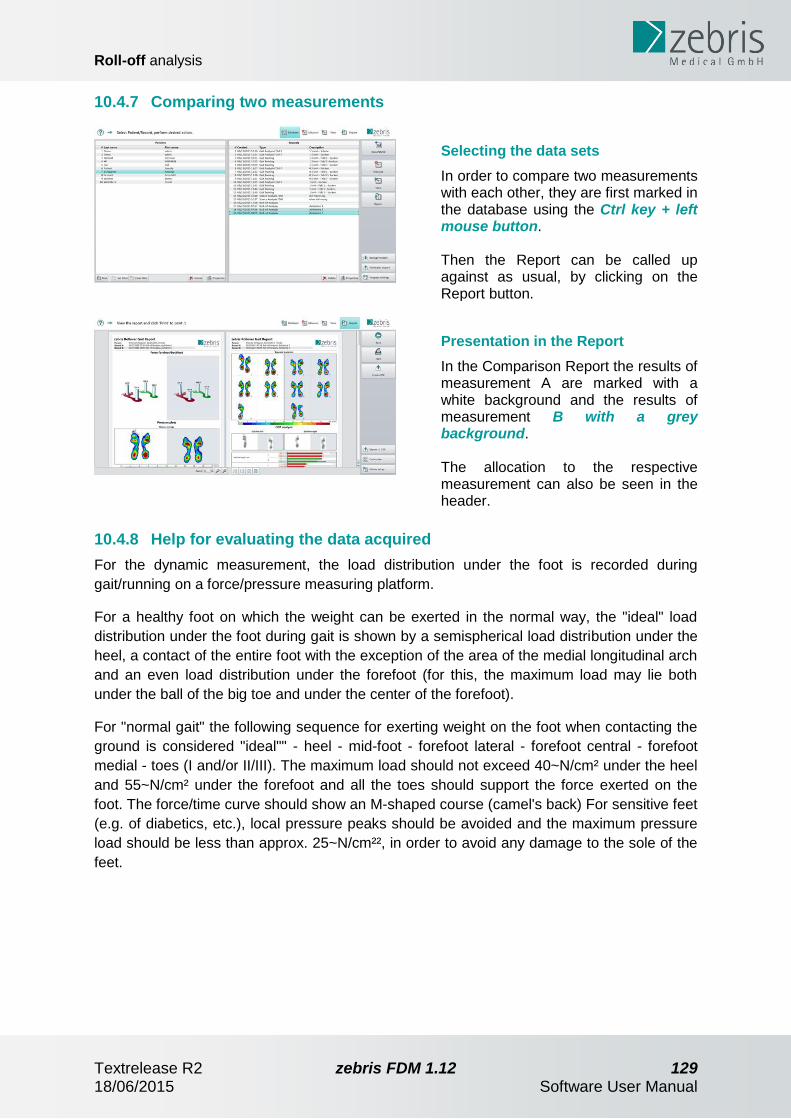
Roll-off analysis
Textrelease R2 zebris FDM 1.12 129 18/06/2015 Software User Manual
10.4.7 Comparing two measurements
Selecting the data sets
In order to compare two measurements with each other, they are first marked in the database using the Ctrl key + left mouse button. Then the Report can be called up against as usual, by clicking on the Report button.
Presentation in the Report
In the Comparison Report the results of measurement A are marked with a white background and the results of measurement B with a grey background. The allocation to the respective measurement can also be seen in the header.
10.4.8 Help for evaluating the data acquired
For the dynamic measurement, the load distribution under the foot is recorded during
gait/running on a force/pressure measuring platform.
For a healthy foot on which the weight can be exerted in the normal way, the "ideal" load
distribution under the foot during gait is shown by a semispherical load distribution under the
heel, a contact of the entire foot with the exception of the area of the medial longitudinal arch
and an even load distribution under the forefoot (for this, the maximum load may lie both
under the ball of the big toe and under the center of the forefoot).
For "normal gait" the following sequence for exerting weight on the foot when contacting the
ground is considered "ideal"" - heel - mid-foot - forefoot lateral - forefoot central - forefoot
medial - toes (I and/or II/III). The maximum load should not exceed 40~N/cm² under the heel
and 55~N/cm² under the forefoot and all the toes should support the force exerted on the
foot. The force/time curve should show an M-shaped course (camel's back) For sensitive feet
(e.g. of diabetics, etc.), local pressure peaks should be avoided and the maximum pressure
load should be less than approx. 25~N/cm²², in order to avoid any damage to the sole of the
feet.

Virtual Training
Textrelease R2 zebris FDM 1.12 130 18/06/2015 Software User Manual
11 Virtual Training
Virtual training can be carried out using this module together with the appropriate zebris FDM
System System.
11.1.1 Carrying out the Virtual Training (Measuring Mode)
1. Database
Click on Measure in the toolbar on the right.
2. Module selection
Select the Virtual Training module. Under Settings specify the duration of the recording. By clicking on Back you will return to the database.

Virtual Training
Textrelease R2 zebris FDM 1.12 131 18/06/2015 Software User Manual
3. Preparation
Please ask your patient to stand next to the treadmill or on the side bar, so that a zero measurement can be taken in an unloaded state. Then select the level that is to be played by clicking on Next. The standard duration of the training is set to 1 minute. If you only purchased the demo version of the virtual training you cannot set the duration of the training individually. By clicking on Back you will return to the database.
4. Safety prompt
After having selected the level and set the training time, the safety prompt appears when clicking on Next. If you have secured your test person with a chest strap, click on YES. If you only have a belt clip on your treadmill as a safeguard, click on NO. The maximum training speed is limited in this case to 3 km/h At a higher speed, a message appears requesting you to reduce the speed. By clicking on Back button you will return to the Module selection.
The chest belt should definitely be worn, in order to protect the user from any physical injuries, irrespective of the treadmill speed.

Virtual Training
Textrelease R2 zebris FDM 1.12 132 18/06/2015 Software User Manual
5. Training
At the beginning of the training the screen alongside appears. Start the treadmill. The patient ought to walk on the treadmill for a few minutes to get used to the feeling. By clicking on Record a measurement can be carried out during the training. The measuring time was determined before in the measuring settings. The measuring time is set to 10 seconds as a standard. By clicking on the Back button you will return to the level selection.
6. Recording
Once the measurement has started, the measuring signals are recorded for 10 seconds as long as the pre-defined measuring time has not been changed. The green progress bar shows the elapsed measuring time. The measurement can be stopped at any time by clicking on the Stop button. Any number of measurements can be taken one after the other, but only the last will be saved. By clicking on the Back button you will return to the level selection.
7. End of the training
After the set training time is over, the training parameters (training time, stretch and points) appear. By clicking on Repeat the training is repeated with the same training duration. By clicking on Finish or Back you will return to the database.
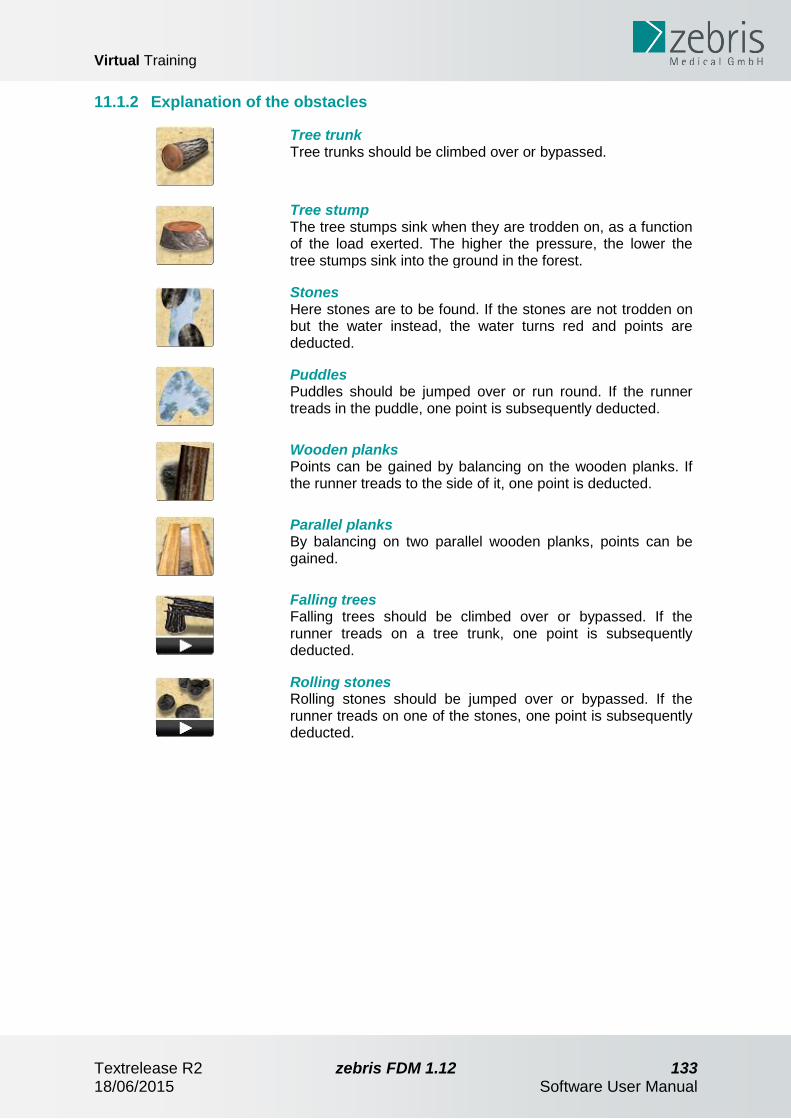
Virtual Training
Textrelease R2 zebris FDM 1.12 133 18/06/2015 Software User Manual
11.1.2 Explanation of the obstacles
Tree trunk Tree trunks should be climbed over or bypassed.
Tree stump The tree stumps sink when they are trodden on, as a function of the load exerted. The higher the pressure, the lower the tree stumps sink into the ground in the forest.
Stones Here stones are to be found. If the stones are not trodden on but the water instead, the water turns red and points are deducted.
Puddles Puddles should be jumped over or run round. If the runner treads in the puddle, one point is subsequently deducted.
Wooden planks Points can be gained by balancing on the wooden planks. If the runner treads to the side of it, one point is deducted.
Parallel planks By balancing on two parallel wooden planks, points can be gained.
Falling trees Falling trees should be climbed over or bypassed. If the runner treads on a tree trunk, one point is subsequently deducted.
Rolling stones Rolling stones should be jumped over or bypassed. If the runner treads on one of the stones, one point is subsequently deducted.

Virtual Training
Textrelease R2 zebris FDM 1.12 134 18/06/2015 Software User Manual
11.2 Processing the measurement (View mode)
In the "View mode" you can view and play the measurements, limit the measuring interval.
And when using a camera system, mark single images for the report as well as draw in
angles. In the following, the individual functions of the View mode are explained in detail.
11.2.1 Basics
Opening the measuring dataset
Select a measuring dataset in the database and click on View in the toolbar on the right.
Play the measurement
Click on Play in the toolbar on the right. The time display above the Play button shows the actual time of the measurement in seconds. Click on the box to enter a value By clicking on Back you will return to the database.
Export...
Here you can export a pressure image per foot as jpg graphic. After having selected the desired image, you are asked to assign a saving destination and a name.
1:1 Report
Opens the Report for the 1:1 printout. The data basis is the averaged stance phase of all the steps taken within the marked interval. The average, maximum resp. medium stance phase can be selected.

Virtual Training
Textrelease R2 zebris FDM 1.12 135 18/06/2015 Software User Manual
The manual step definition for the gait analysis FDM is momentarily not available.
Automatic step definition
By clicking on the corresponding button, the following dialog window opens (see below).
When clicking Ok, all previously defined steps are deleted and the automatic step definition is carried out again.
Manual step definition
In case that the automatic step definition has not recognized the test person's gait pattern, you can also define the steps manually. Therefore, click on Manual Step Definition. All steps are deleted and you are redirected to the mode of manual definition.
By holding down the left mouse button you can navigate over the timeline with the help of the vertical dashed line (cursor). By pressing Undo/Repeat you can jump back and forth in the work process.
1. Navigate to the footprint
Navigate in the time course to the left

Virtual Training
Textrelease R2 zebris FDM 1.12 136 18/06/2015 Software User Manual
footprint, with which you would like to start. If you prefer to start with the right footprint, then click on Next.
2. Click on the footprint
Click on a part of the footprint that is to be defined. A frame around the footprint is then generated automatically.
Now the displayed frame can be adjusted by using the displayed points. If required, shift the points into another position inside the frame by dragging with the left mouse button. After having finished the manual step definition, click the button Finish and your changes are saved.
You will have to define at least five steps, as this number is necessary for the evaluation of the report. If you have defined fewer steps, a note appears after clicking Finish. Close it and define more steps.

Virtual Training
Textrelease R2 zebris FDM 1.12 137 18/06/2015 Software User Manual
11.2.2 Functions
Playing the measurement
Automatic playing of the measurement by clicking on the Play button. The measurement recording is played and repeated until the Pause button is pressed.
Image forw./backwards
The arrows with the line directly next to them take you one image forwards, or backwards, resp.
Playing speed
A single click on this button opens a list for selecting the playing speed.
Zoom
Enlarging or reducing the platform display or the signal curves in the force/time diagram. The magnifying glass with a minus sign reduces the display by 20% The magnifying glass with a plus sign enlarges the display by 20% Adjusting The 3D depiction is centered in the view mode and the zoom factor is automatically determined, so that the model becomes completely visible.
MPP
Display of the maximum pressure (Maximum Pressure Plot).
Gait line
Display of the COP pattern in the gait phase.
Roll-off line
Display of the roll-off line during the stance phase.
Swapping left/right side
Here you can swap the side assignment of the foot prints.
3D presentation
Switches the load distribution between the 2D and 3D presentation. The 2D presentation is activated when the button has a colored background.

Virtual Training
Textrelease R2 zebris FDM 1.12 138 18/06/2015 Software User Manual
Single images
Single images can be marked or deleted with this function. Marked pictures are transferred to the report. (see 7.3.4)
Selecting a video sequence of a gait cycle
Select automatically the video sequence of the gait cycle at the current playing position. (see 7.3.4)
11.2.3 Visualization of the load distribution
Numerical display of the pressure values
In the 2D presentation, the pressure values of the roll-off pattern can be shown numerically. To do this, deactivate the 3D mode by clicking on 3D (if the button is not highlighted in color, the 3D presentation is active.) By enlarging with the middle mouse button or magnifier tool the pressure values of the individual sensors and the limiting frame are displayed.

Virtual Training
Textrelease R2 zebris FDM 1.12 139 18/06/2015 Software User Manual
Please note that the presentation here has been smoothed, which can cause inaccuracies and rounding errors in the area at the edges of the pressure image displayed.
Recordings that are carried out with with visual cueing, the projected footprints are shown as a gray shadow. In this way, it is possible to make a visual assessment of the training in advance.
11.2.4 Selecting a certain interval for analysis in the Report
With zebris FDM it is possible to analyze either the total data volume recorded or only a
certain interval.
Select measuring data
Two blue limitation lines in the the force/- time diagram mark the area for analysis. For the Report the area with the blue background is discarded and only the data in the white area is evaluated.
Customizing the area for analysis
Move the cursor over the limitation line from blue to white. The cursor changes to a double arrow. With the left mouse button pressed you can now restrict the area for analysis by dragging the limitation lines.
Selecting video sequences
Please note, that the use of video cameras is not available with all modules.

Virtual Training
Textrelease R2 zebris FDM 1.12 140 18/06/2015 Software User Manual
1. Define a position
In order to transfer video images to the report, click on the desired position in the time-force diagram. The dotted line (cursor) is shifted to the clicked position. You can shift the cursor with the left mouse button resp. the image back/forth button to the desired position.
2. Define the video interval
By clicking on the movie symbol, the gait cycle around the marked position is selected (each one step before/one step after). In order to select a larger section, move the mouse cursor on a limitation line of the violet section, until it becomes a double cursor. While keeping the left mouse button pressed, you can now change the length of the video sequence by drawing the limitation line. Delete the marking by pulling the limitations together until the marking disappears completely.
Marking single images in the video, angles and length ratios
Using the magnifying glass, the displayed image section can be enlarged or minimized. By clicking with the right mouse button on the image section, the following functions in the context menu open: “Copy current image in the clipboard” as well as “Save video under”. When it comes to recordings with several cameras, a colored frame marks the currently selected video image.
Marking a single image
Click on the desired position in the force-time diagram. The dotted line (cursor) is set at the clicked position.

Virtual Training
Textrelease R2 zebris FDM 1.12 141 18/06/2015 Software User Manual
Then click on the camera symbol under the video image. The marking appears as blue line in the bar „single images and video sequences“.
Deleting a single image
Click on the single image marking in the bar „Single images and video sequence“ (blue line). Then, click on the crossed out video symbol. In doing so, the marking is deleted. Of course, you can set the marking any time again.
Angles and Length ratios
Draw two straight lines with the left mouse button directly in the video mode. Then the angles between the straight lines as well as the length ratio to one another are displayed automatically at the right bottom edge of the video image. The drawn in angles and the length ratios are saved with the single image and displayed in the report.
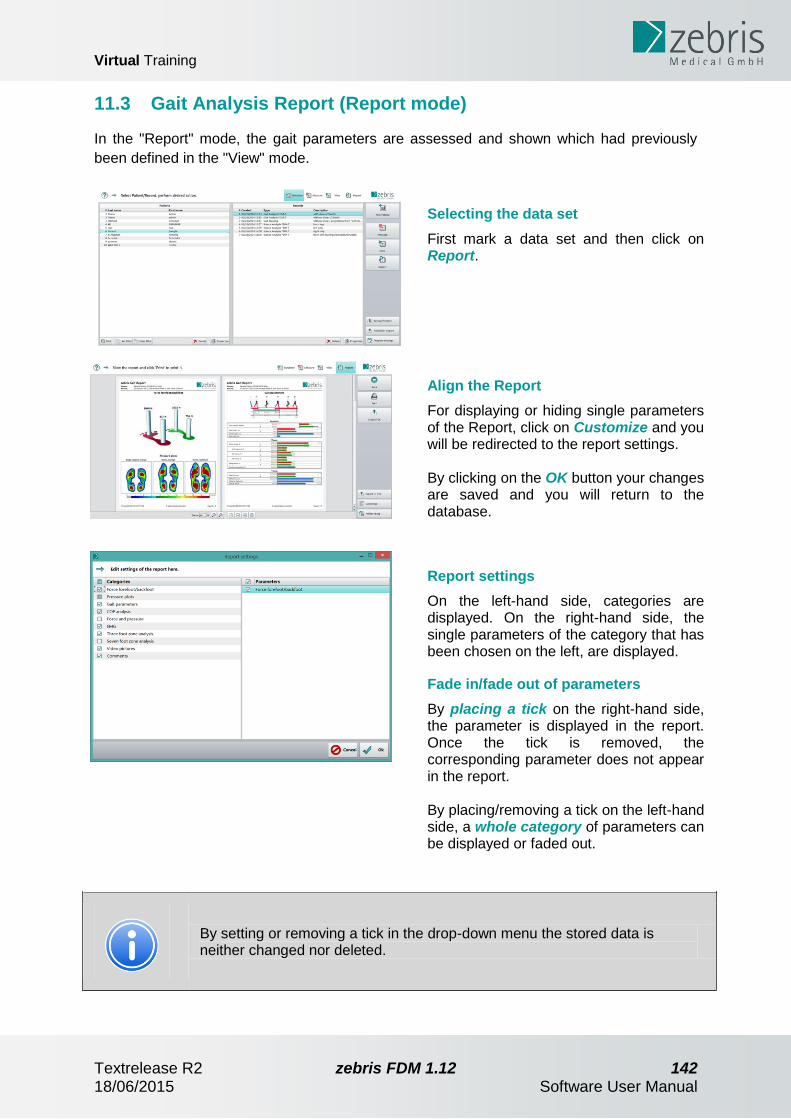
Virtual Training
Textrelease R2 zebris FDM 1.12 142 18/06/2015 Software User Manual
11.3 Gait Analysis Report (Report mode)
In the "Report" mode, the gait parameters are assessed and shown which had previously
been defined in the "View" mode.
Selecting the data set
First mark a data set and then click on Report.
Align the Report
For displaying or hiding single parameters of the Report, click on Customize and you will be redirected to the report settings. By clicking on the OK button your changes are saved and you will return to the database.
Report settings
On the left-hand side, categories are displayed. On the right-hand side, the single parameters of the category that has been chosen on the left, are displayed.
Fade in/fade out of parameters
By placing a tick on the right-hand side, the parameter is displayed in the report. Once the tick is removed, the corresponding parameter does not appear in the report. By placing/removing a tick on the left-hand side, a whole category of parameters can be displayed or faded out.
By setting or removing a tick in the drop-down menu the stored data is neither changed nor deleted.

Virtual Training
Textrelease R2 zebris FDM 1.12 143 18/06/2015 Software User Manual
11.3.1 Functions
View
With these buttons you can stipulate how many pages of the Report are to be shown at one time. Alternatively the slide control for reducing/enlarging can be used.
1:1
Adjusts the display such the entire height of a page height can be displayed.
Page width
The current page is zoomed to the fully available width.
Whole page
Shows the pages in the original size. Due to different screen resolutions, the size can deviate from the size of the printer paper.
Miniature view
Shows all the pages in an overview as small pictograms.
Printing
The Report is printed out on the printer selected under printer settings
PDF export
PDF export to any directory or, e.g. to external data carriers such as USB sticks.
Customize
Showing and hiding single report parameters.
Printer settings
Select printer and change settings for printing (e.g. format, page size, etc.).
CSV export
Exporting the parameters of the report in a CSV file format (comma separated values).

Virtual Training
Textrelease R2 zebris FDM 1.12 144 18/06/2015 Software User Manual
11.3.2 Description of the Report contents
The Report comprises the elements described in the following:
Header
Title, project name, patient name, date of the measurement and the company logo are in the header.
Force fore foot/rear foot
In this 3D depiction the maximum force for the fore and rear foot is displayed.
Maximum pressure pictures
In this diagram the maximum pressure pictures are displayed in color. Each maximum pressure picture (MPP) contains the highest pressure values of a complete roll-off pattern.
Mid-stance phase, average
This diagram shows the average maximum pressure picture of the mid-stance phase of all the maximum pressure pictures recorded.
Stance phase average
This diagram shows the average of all the maximum pressure pictures recorded.
Stance phase maximum
This diagram shows the absolute maximum pressure picture of all the maximum pressure pictures recorded.

Virtual Training
Textrelease R2 zebris FDM 1.12 145 18/06/2015 Software User Manual
Color scale
The color scale enables the load distribution to be quantified.
Gait line
The line of the force application points are displayed in the pressure pictures for each foot separately.

Virtual Training
Textrelease R2 zebris FDM 1.12 146 18/06/2015 Software User Manual
Gait phases
Here you see the individual gait phases illustrated.
Geometry
Here the local gait parameters, i.e. foot rotation, step length, stride length and step width are displayed.
Phases
Here, the step phases in the two main phases, i.e. the stance phase and swing phase, are shown. The stance phase is divided into the two double-standing phases, i.e. loading response phase and roll-off phase and also the mid-stance phase. The sections marked in bright green are reference values.
Timing
Includes the time-dependent gait parameters, i.e. step time, stride time, cadence and the average speed of the interval analyzed.
11.3.3 Explanation of gait parameters
Foot rotation, degree
Describes the angle between the longitudinal axis of the foot and the running direction.
Negative value = inward rotation, positive value = outward rotation
Step width, cm
Describes the distance between the right and left foot.
Step length, cm
Describes the distance between the heel contact of one side of the body and the heel contact
of the contralateral side.
Step time, sec.
Describes the phase within a gait cycle between the heel contact of one side of the body and
the heel contact of the contralateral side.

Virtual Training
Textrelease R2 zebris FDM 1.12 147 18/06/2015 Software User Manual
Stance phase, %
Describes the phase of a gait cycle in which the foot has contact with the ground.
Loading response phase, %
Describes the phase between the initial ground contact and contralateral toe off.
Mid-stance phase, %
Describes the contralateral toe-off phase and the transfer of the body's center of gravity over
the weight-bearing foot.
Pre-swing phase, %
Describes the phase during a gait cycle that begins at contralateral initial contact (when the
heel of the contralateral side touches the ground) and ends at toe off of the viewed side of
the body.
Swing phase, %
Describes the phase of a gait cycle during which the foot has no contact with the ground.
Double-standing phase, %
Sum of the loading response phase and the pre-swing phase.
Double-stride length, cm
Describes the distance between two heel contacts on the same side of the body.
Double-stride time, sek
Time span of a stride.
Cadence, steps/minute
Step frequency
Speed, km/hr
Measured average gait speed during the analyzed measuring interval.

Virtual Training
Textrelease R2 zebris FDM 1.12 148 18/06/2015 Software User Manual
Butterfly diagram
This block analyzes the course of the center of pressure (COP) during the selected step cycles. In doing so the COP tracks that are displayed in color correspond to different levels of speed (red: fast, green: intermediate, blue: slow). When taking the double-standing phase and the load transfer into consideration, the typical butterfly diagram of the force application points is produced.
Gait line left and right
Here the lines of the force application points are shown separately for each foot.
The parameters for the butterfly diagram are described in more detail in the next section.

Virtual Training
Textrelease R2 zebris FDM 1.12 149 18/06/2015 Software User Manual
11.3.4 Explanation of the butterfly diagram
Length of the gait line
The parameter "Length of the gait line" is characterized by the position of the center of pressure (COP). Only the ground contacts of one side of the body are taken into account. This parameter covers the progression of the COP of all the steps recorded of one side of the body. All the other parameters can be seen in the cyclograms.
Mid-stance phase
This parameter corresponds to the average length of the lines that show the progression of the COP of one side of the body, when all the ground contacts are taken into consideration.
Anterior/Posterior Position
This parameter describes the shift forwards or backwards of the COP intersection point in chronological sequence in the cyclogram display, taking all the steps into consideration. The initial or zero position is the rearmost place where the heel contacts the ground.

Virtual Training
Textrelease R2 zebris FDM 1.12 150 18/06/2015 Software User Manual
Anterior/posterior variability
This describes the standard deviation in the anterior/posterior position that results when taking all the steps into consideration.
Lateral shift
This parameter describes the left /right shift of the COP intersection point in chronological sequence in the cyclogram display, taking all the steps into consideration. A negative value indicates a shift to the left, and a positive value, a shift to the right. The initial or zero position is shown as the central point of the illustration.
Lateral deviation
This describes the standard deviation in the lateral shift, which results when taking all the steps into consideration.

Virtual Training
Textrelease R2 zebris FDM 1.12 151 18/06/2015 Software User Manual
11.3.5 Force & Pressure
Average maximum pressure
Presentation of the averaged and
normalized pressure curves. The standard
deviation is shown as a shaded area, and
the dotted line represents the maximum
values. The vertical line separates the
stance and swing phase.
Average force
Diagram of the average vertical reaction force. The area of the standard deviation is indicated as a shadowed area. The height of the maximum force and its localization related to the gait cycle are given for the heel and forefoot for the left and right side, respectively. The vertical line separates the stance and swing phase.
Force parameters
Shown here are the amplitudes recorded in the force curve together with their position in the gait cycle.

Virtual Training
Textrelease R2 zebris FDM 1.12 152 18/06/2015 Software User Manual
11.3.6 Three foot zone analysis
Here the load surface area of the left and right side of the body is divided into the zones: forefoot, mid-foot and heel and shown in color. A force curve corresponds in the respective color for each zone. The maximum pressure pictures of the entire load surface area of the left and right side of the body are shown at three fixed times.
Fmax t1 Time of the maximum heel force
Fmax t2 Time of the maximum force on the forefoot
(t1+t2)/2 Load distribution between the two times t1 and t2
Here the parameters are shown as a bar chart and briefly described the indicator indicates the standard deviation in each case.
Load change
The absolute load change from the heel to the forefoot during the stance phase given as a percentage.
Maximum force, N
The average maximum values reached in N/cm² for the three zones: toes, mid-foot and heel.
Maximum pressure, N/cm²
The average maximum values reached in N/cm² for the three zones: toes, mid-foot and heel.
Time maximum force, % of stance time
The average point in time within a gait cycle where the maximum values for the three zones toes, mid-foot and heel were collected in Newton.
Contact time, % of stance time
The average contact time of the three zone toes, mid-foot and heel as a percentage.
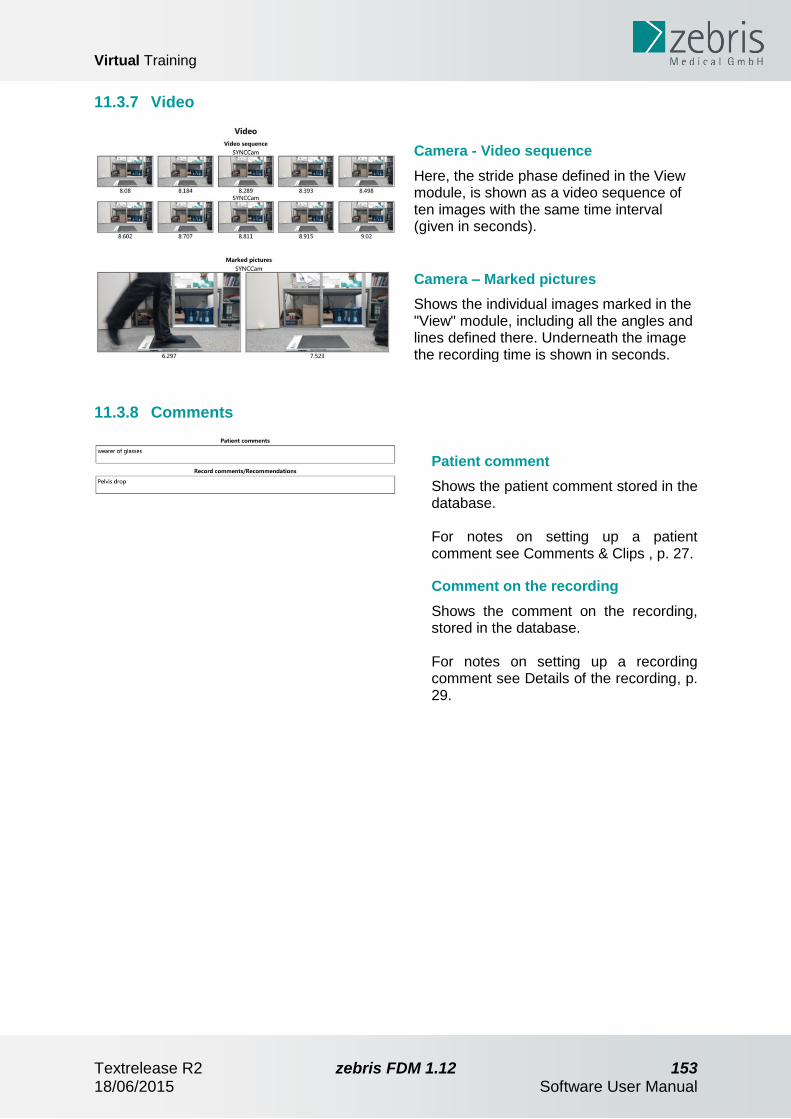
Virtual Training
Textrelease R2 zebris FDM 1.12 153 18/06/2015 Software User Manual
11.3.7 Video
Camera - Video sequence
Here, the stride phase defined in the View module, is shown as a video sequence of ten images with the same time interval (given in seconds).
Camera – Marked pictures
Shows the individual images marked in the "View" module, including all the angles and lines defined there. Underneath the image the recording time is shown in seconds.
11.3.8 Comments
Patient comment
Shows the patient comment stored in the database. For notes on setting up a patient comment see Comments & Clips , p. 27.
Comment on the recording
Shows the comment on the recording, stored in the database. For notes on setting up a recording comment see Details of the recording, p. 29.

Virtual Training
Textrelease R2 zebris FDM 1.12 154 18/06/2015 Software User Manual
11.3.9 Comparing two measurements
Selecting the data sets
In order to compare two measurements with each other, they are first marked in the database using the Ctrl key + left mouse button. Then the Report can be called up against as usual, by clicking on the Report button.
Presentation in the Report
In the Comparison Report the results of measurement A are marked with a white background and the results of measurement B with a grey background. The allocation to the respective measurement can also be seen in the header.
11.3.10 Help for evaluating the data acquired
For the dynamic measurement, the load distribution under the foot is recorded during
gait/running on a force/pressure measuring platform.
For a healthy foot on which the weight can be exerted in the normal way, the "ideal" load
distribution under the foot during gait is shown by a semispherical load distribution under the
heel, a contact of the entire foot with the exception of the area of the medial longitudinal arch
and an even load distribution under the forefoot (for this, the maximum load may lie both
under the ball of the big toe and under the center of the forefoot).
For "normal gait" the following sequence for exerting weight on the foot when contacting the
ground is considered "ideal"" - heel - mid-foot - forefoot lateral - forefoot central - forefoot
medial - toes (I and/or II/III). The maximum load should not exceed 40~N/cm² under the heel
and 55~N/cm² under the forefoot and all the toes should support the force exerted on the
foot. The force/time curve should show an M-shaped course (camel's back) For sensitive feet
(e.g. of diabetics, etc.), local pressure peaks should be avoided and the maximum pressure
load should be less than approx. 25~N/cm²², in order to avoid any damage to the sole of the
feet.

Virtual Training
Textrelease R2 zebris FDM 1.12 155 18/06/2015 Software User Manual
11.4 Level Editor
Using the Level Editor you have the possibility of creating or editing levels for the virtual
training yourself.
1. Database
Click on Measure in the toolbar on the right.
Open level editor
Click on Level Editor to open it.
Set / Edit the level
Click on File >> New in the toolbar on the right to create a new level with the help of an assistant. After having marked a listed level and clicking on Edit Level, you open a level already available and can then edit this. By clicking on Back you get back to the module selection.
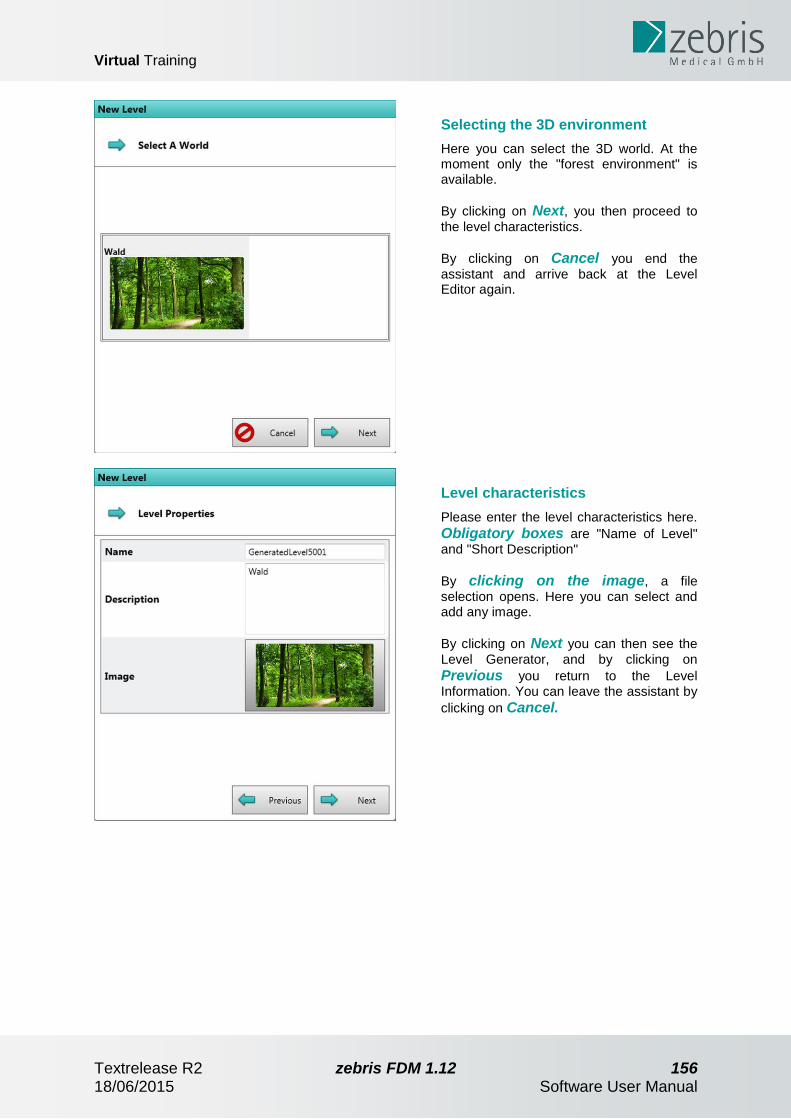
Virtual Training
Textrelease R2 zebris FDM 1.12 156 18/06/2015 Software User Manual
Selecting the 3D environment
Here you can select the 3D world. At the moment only the "forest environment" is available.
By clicking on Next, you then proceed to
the level characteristics.
By clicking on Cancel you end the
assistant and arrive back at the Level Editor again.
Level characteristics
Please enter the level characteristics here.
Obligatory boxes are "Name of Level" and "Short Description"
By clicking on the image, a file selection opens. Here you can select and add any image.
By clicking on Next you can then see the
Level Generator, and by clicking on
Previous you return to the Level Information. You can leave the assistant by
clicking on Cancel.

Virtual Training
Textrelease R2 zebris FDM 1.12 157 18/06/2015 Software User Manual
11.4.1 Automatic setting of a Level
There are two procedures for creating a new Level using the Level Editor. The possibility
described here using the Level Generator is the most comfortable method and the faster
one.
To activate the automatic creation of a Level, please click on Use Level Generator. By dragging the sliders you now have the possibility of setting the following parameters:
Track elevation
Number of obstacles
Number of random obstacles
Track length
Number of branches By clicking on OK you end the Assistant and have the possibility of watching the Level generated in the Level Editor and editing it, if required. By clicking on Previous you will return to the previous step. You can leave the assistant by clicking on Cancel.
11.4.2 Basic information on the Level Editor
If you have created a Level using the Level Generator, you have the possibility of editing,
adding or deleting individual segments.
You will see this screen after creating a Level using the Level Generator. In the left-hand section of the monitor you see an overall overview of the level you created before. The section that is framed by the red rectangle is displayed in a zoomed view in the middle of your monitor. By using the magnifying glasses resp. pressing the middle mouse button this section can be enlarged and reduced. On the right-hand side you will find the elements that you can insert into your level.

Virtual Training
Textrelease R2 zebris FDM 1.12 158 18/06/2015 Software User Manual
Segments
Here the single track segments are described, that you can add to your level.
Mark the position in the level, where the segment shall be inserted with one mouse click. By
double clicking a single element the segment is positioned.
Straight Segments
By Straight Segments we mean the individual stages of the path that are run through in the 3D environment. Here you have seven different elements to choose from and you can also set their elevation.
Branches
Are the segments created when the path splits into two directions. Here you have five different elements to choose from, and you can add these by clicking on them.
Elements
Here you will find a description of the individual elements that can be added to the segments.
In order to position an obstacle, click on the required one in the obstacles box on the right
and drag is into the desired position in the level. Size and position of the placed obstacle can
be modified using the mouse and the shown slide control.
Obstacles
Obstacles can make a level significantly more difficult training the test person’s coordinative and cognitive skills.
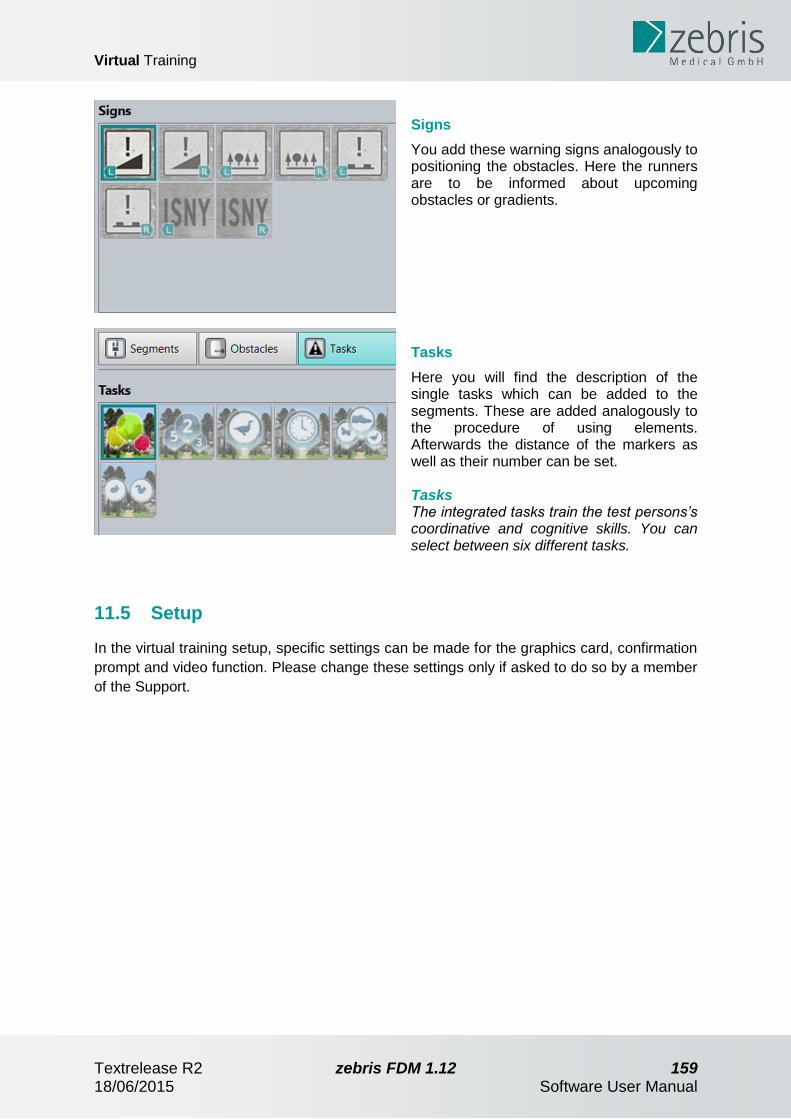
Virtual Training
Textrelease R2 zebris FDM 1.12 159 18/06/2015 Software User Manual
Signs
You add these warning signs analogously to positioning the obstacles. Here the runners are to be informed about upcoming obstacles or gradients.
Tasks
Here you will find the description of the single tasks which can be added to the segments. These are added analogously to the procedure of using elements. Afterwards the distance of the markers as well as their number can be set. Tasks The integrated tasks train the test persons’s coordinative and cognitive skills. You can select between six different tasks.
11.5 Setup
In the virtual training setup, specific settings can be made for the graphics card, confirmation
prompt and video function. Please change these settings only if asked to do so by a member
of the Support.

Troubleshooting
Textrelease R2 zebris FDM 1.12 160 18/06/2015 Software User Manual
12 Troubleshooting
This chapter presents frequently occuring error messages caused by usage problems and
suggests how to deal with them. If you happen to come across an error message, at first
please follow the suggestions in this list before you contact our customer support.
This list does not claim to be exhaustive.
When you have a suspicion on what device does not work correctly, please go through these
instructions one by one and check between each item if the system works again.
12.1 SYNCCam
1. Check if the USB plug is still connected to the computer (if the green LED is lit, USB
is powered) and properly plugged into the camera (there is only one USB socket).
2. Execute the Hardware Setup, check that there is a SYNCCam present and double-
click it (see chapter Hardware setup (device settings), p.38).
Now a live stream of the camera should show up – if not, unplug the camera and plug
it again, then delete the current hardware profile (button delete in the upper right),
press ‘Ok’ and start the Hardware Setup again. Automatic detection shows up,
confirm and check if the camera has been added.
3. Plug the USB into another port on the computer and repeat step 2.
4. Open the Windows Device Manager and search for an entry Imaging Devices >>
“Logitech HD Pro Webcam C920”. If it is not present, unplug and replug the camera.
Windows will install the driver and then the device should appear in the list.
If this does not help or if the camera’s name is only “HD Pro Webcam C920”, right-
click the camera’s entry in the Windows Device Manager and select “Update
drivers…”.
Windows will update the driver and may require a restart of the computer.
12.2 Forceplate/Treadmill
Troubleshooting
Textrelease R2 zebris FDM 1.12 161 18/06/2015 Software User Manual
1. Check if the USB plug is still connected to the computer and also the power supply is
plugged in correctly (if you the green LED is lit, power is there, the LED changes to
orange while recording).
2. Check the connections to the forceplate (or interface box for treadmills), see your
hardware user manual for details.
3. Execute the Hardware Setup, check that there is a forceplate/treadmill present and
double-click it (see chapter Hardware setup (device settings), p.38).
If an error is displayed, delete the current hardware profile (button delete in the upper
right), press ‘Ok’ and start the Hardware Setup again. Automatic detection shows up,
confirm and check if the forceplate/treadmill has been added.
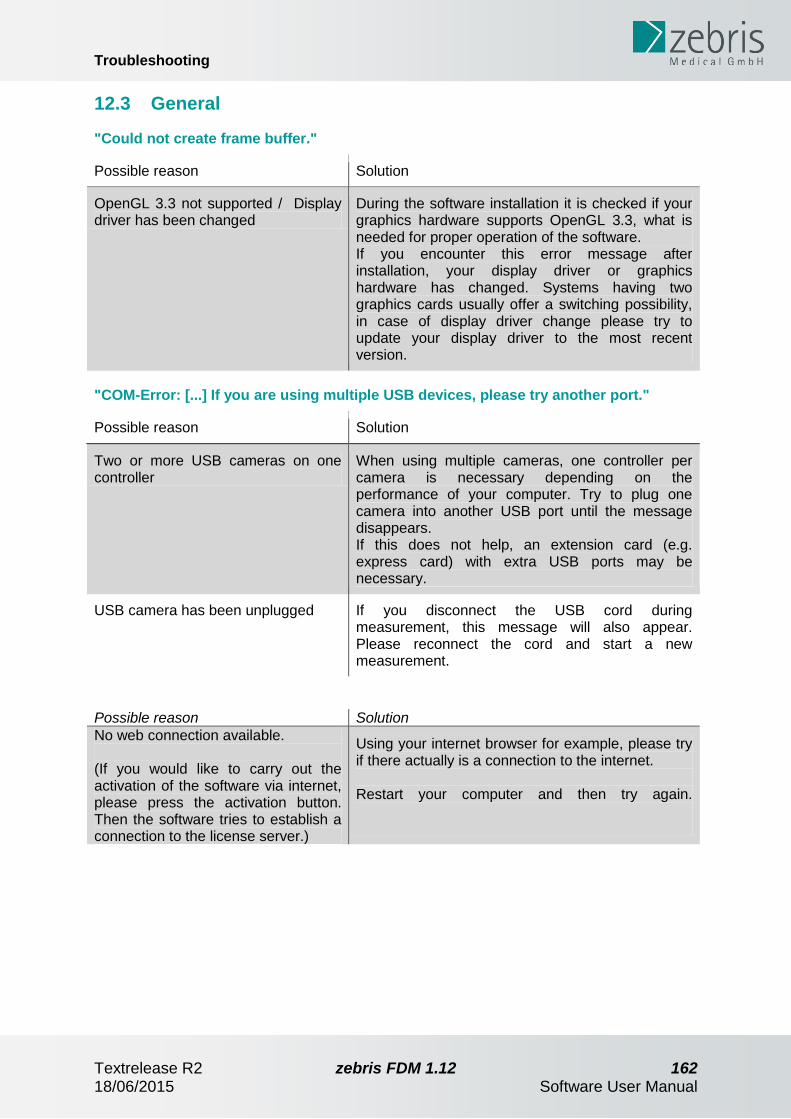
Troubleshooting
Textrelease R2 zebris FDM 1.12 162 18/06/2015 Software User Manual
12.3 General
"Could not create frame buffer."
Possible reason Solution
OpenGL 3.3 not supported / Display driver has been changed
During the software installation it is checked if your graphics hardware supports OpenGL 3.3, what is needed for proper operation of the software. If you encounter this error message after installation, your display driver or graphics hardware has changed. Systems having two graphics cards usually offer a switching possibility, in case of display driver change please try to update your display driver to the most recent version.
"COM-Error: [...] If you are using multiple USB devices, please try another port."
Possible reason Solution
Two or more USB cameras on one controller
When using multiple cameras, one controller per camera is necessary depending on the performance of your computer. Try to plug one camera into another USB port until the message disappears. If this does not help, an extension card (e.g. express card) with extra USB ports may be necessary.
USB camera has been unplugged If you disconnect the USB cord during measurement, this message will also appear. Please reconnect the cord and start a new measurement.
Possible reason Solution
No web connection available. (If you would like to carry out the activation of the software via internet, please press the activation button. Then the software tries to establish a connection to the license server.)
Using your internet browser for example, please try if there actually is a connection to the internet. Restart your computer and then try again.

Troubleshooting
Textrelease R2 zebris FDM 1.12 163 18/06/2015 Software User Manual
12.4 FDM-T System
"Speed detection hardware failure"
Possible reason Solution
Speedometer barcode damaged At the front of the treadmill there is a black-white barcode attached to the deflector roll. It has to be faultless for correct function of the speedometer. Typically, the barcode is being battered if the running belt runs excentric on the roll because of lacking maintenance. The barcode is available as a spare part.
"Communication timeout"
Possible reason Solution
Defective USB cord / USB disconnected
Check if the USB cord is intact, meaning there are no cracks, sharp bends oder crimped sections on it. In case of doubt try again with another USB cord.
Hardware defect If your USB connection is faultless, the electronics of the forceplate could be damaged. In this case please contact our technical support.
" Pressure distribution platform not found."
Possible reason Solution
No hardware profile defined Check if you created a device profile in the Hardware Setup and added the forceplate.
Not connected / No power supply Please check your cable connections and power supply.

Import Interfaces
Textrelease R2 zebris FDM 1.12 164 18/06/2015 Software User Manual
13 Import Interfaces
zebris FDM provides some interfaces for the data exchange with other software packages,
e.g. medical office management software. Please consult the software manufacturer's
information, whether your software is compatible with one of these interfaces.
Mandatory fields in zebris FDM are the following: first name, last name; and since version 1.10 the birthday. When measurements from older packages are imported where the birthday field is empty, it is set as empty. As soon as some action requires a birthday to be set, you get a message about this.
In the following, the installation of the interface as well as the available amount is described, If the interface is supplied by several providers, the software of your third-party supplier is described in the following as third-party software.

Import Interfaces
Textrelease R2 zebris FDM 1.12 165 18/06/2015 Software User Manual
13.1 GDT
This interface can be used to transfer patient data in the zebris FDM software.
The following sets are supported according to the GDT version 2.1.: 6301, 6302.
Please find details on the sets in the GDT interface specifications of the Quality Association
for Medical Software (http://www.qms-standards.de).
Installation
Your third-party software stores the data to be exchanged in a location that you have defined
before, e.g. on your hard disk. Afterwards, your third-party software starts the zebris FDM
software and transfers a script file and optionally a file path as parameter.
The zebris FDM software then carries out the script file and transfers the existing patient data
from the file path that was defined here resp. the transferred file path „Transfer Location“.
Settings in the third-party software
Please find the settings for data exchange in the information of your third-party software
manufacturer.
Calling up the third-party software has to be proceeded as follows (e.g. Win7 64bit):
C:\Program Files (x86)\zebris\zebris FDM\zebris.shell.exe execute
import_gdt.xml –mask "[path to the transfer location and file type]"
In doing so, please note:
the path has to be written with quotation marks and without square brackets
for the file type you can only use files with a certain name or ending, like e.g.
„G*.txt“ (only searches for txt files, starting with a G), the * stands for any sign, that
means *.* stands for all file names with all endings
if „-mask“ and the path are not indicated, the software automatically uses
„C:\Exchange\GDT\*.*“
Files to be imported is searched for at the transfer location. The patient data found, is
integrated in the zebris FDM database. If a patient exists there already, you will get a
corresponding notification.
Sample call
C:\Program Files (x86)\zebris\zebris FDM\zebris.shell.exe execute
import_gdt.xml –mask "F:\MyExchangeFolder\*.*"
This call starts zebris FDM and searches in the directory „F:\MyExchangeFolder\“ all files
(*.*) for GDT data to be imported. The patient data found, is transferred automatically.

Import Interfaces
Textrelease R2 zebris FDM 1.12 166 18/06/2015 Software User Manual
13.2 PAEDUS
This interface can be used to transfer patient data in the zebris FDM software. It only
transfers existing patient data information in exactly the same fields of both software
packages.
Installation
PAEDUS stores the data to be exchanged in a location that you have defined before, e.g. on
your hard disk. Afterwards, PAEDUS starts the zebris FDM software and transfers a script
file and optionally a file path as parameter.
The zebris FDM software then executes the script file and transfers the patient data from the
file path that was defined here resp. the transferred file path „Transfer Location“.
Settings in PAEDUS
Please find the settings for data exchange in the information of the pead software GmbH.
Calling up PAEDUS has to be proceeded as follows (e.g. Win7 64bit):
C:\Program Files (x86)\zebris\zebris FDM\zebris.shell.exe execute
import_paedus.xml –path "[path to the transfer location]"
In doing so, please note:
• the path has to be written with quotation marks and without square brackets
• if „-path“ and the path are not indicated, the software automatically uses
„C:\Exchange\pae\paedus_in“
Data to be imported is searched for at the transfer location. The patient data found is
integrated in the zebris FDM database. If a patient exists there already, you will get a
corresponding notification.
Sample call
C:\Program Files (x86)\zebris\zebris FDM\zebris.shell.exe execute
import_paedus.xml –path "M:\PAEDUS\YourExchangeFolder"
This call starts zebris FDM and searches in the directory „M:\PAEDUS\Datenaustausch“ for
PAEDUS patient data to be imported. The patient data found, is transferred automatically.

Import Interfaces
Textrelease R2 zebris FDM 1.12 167 18/06/2015 Software User Manual
13.3 Rothballer
This interface can be used for the transfer of patient data into the zebris FDM software. With
the zebris FDM software called up from the Rothballer software, an automatic transfer of the
evaluated data of the selected patient's measurements, that have been carried out since the
start, is transferred when closing the zebris FDM software.
The export of the evaluated measuring data can also be done out of the zebris FDM
database. Therefore, please see chapter Data Export , p.32.
Installation
The Rothballer software stores the data to be exchanged in a location that you have defined
before, e.g. on your hard disk. Afterwards, the Rothballer software starts zebris FDM and
thus transfers the import and export path as well as the measuring module that is to be called
up as parameter.
The zebris FDM software then transfers the existing patient data from the transferred import
path, starts the transferred measuring module and exports the measured data in the
transferred export path.
Settings in Rothballer
Please find the settings for the data exchange in the information of Rothballer electronic
systems.
Calling up the Rothballer software has to be proceeded as follows (e.g. Win7 64bit):
C:\Program Files (x86)\zebris\zebris FDM\zebris.shell.exe execute
import_rothballer.xml –import_path "[path to the transfer location]"
–export_path "[destination path]" –measurement [measuring module]
In doing so, please note:
• all three specifications are absolutely obligatory
• paths have to be written with quotation marks and without square brackets
• possible values according to „-measurement“ are
o gait_treadmill for the gait analysis
o stance_pressure for the stance analysis
…these values have to be written down without quotation marks.
The data transfer path searches for patient data to be imported. The patient data found, is
automatically transferred to the zebris FDM database. For already existing patients, you will
get a corresponding notification.
Sample call
C:\Program Files (x86)\zebris\zebris FDM\zebris.shell.exe execute
import_rothballer.xml –import_path
"H:\Rothballer\SomeExchangeFolder\patient.ini" –export_path
"H:\Rothballer\zebris-records" –measurement gait_treadmill
This call starts zebris FDM and searches the file
„H:\Rothballer\SomeExchangeFolder\patient.ini“ for Rothballer patient data to be

Import Interfaces
Textrelease R2 zebris FDM 1.12 168 18/06/2015 Software User Manual
imported. The patient data found, is transferred and the gait analysis for the measuring is
started.
After closing zebris FDM, the measurements that were carried out, are exported to the
directory „H:\Rothballer\zebris-records“.

Export Interfaces
Textrelease R2 zebris FDM 1.12 169 18/06/2015 Software User Manual
14 Export Interfaces
zebris FDMprovides some interfaces to export the recorded data for processing with other
software packages such as statistics software.
Some interfaces are accessible from the Database screen, others can be accessed in the
View mode, further ones in the mode Report.
Mandatory fields in zebris FDM are the following: first name, last name; and since version 1.10 the birthday. When measurements from older packages are imported where the birthday field is empty, it is set as empty. As soon as some action requires a birthday to be set, you get a message about this.
14.1 zebris-own formats
14.1.1 CSV
This export interface is available in the mode Report.
All numerical values from the parameter charts being visible in the report are here exported
into a CSV file (comma separated values). You can easily open and edit this file e.g. in
Excel.
The first line contains all designations and start with the patient and recording information.
The standard deviation of parameters is output as extra column featuring the parameter’s
name and the addition „SD“ (standard deviation).
Text qualifiers are the quotation marks ("), separator is the semicolon (;).
14.2 JPG
This interface is accessible via the View screen.
One footprint for each side from the currently opened measurement is saved as a .jpg image
@72dpi, white background and 20mm white border. You can select if you want to export the
average pressure plot, maximum pressure plot or mid stance plot if available.
These images are the same as the ones which are created in the report.
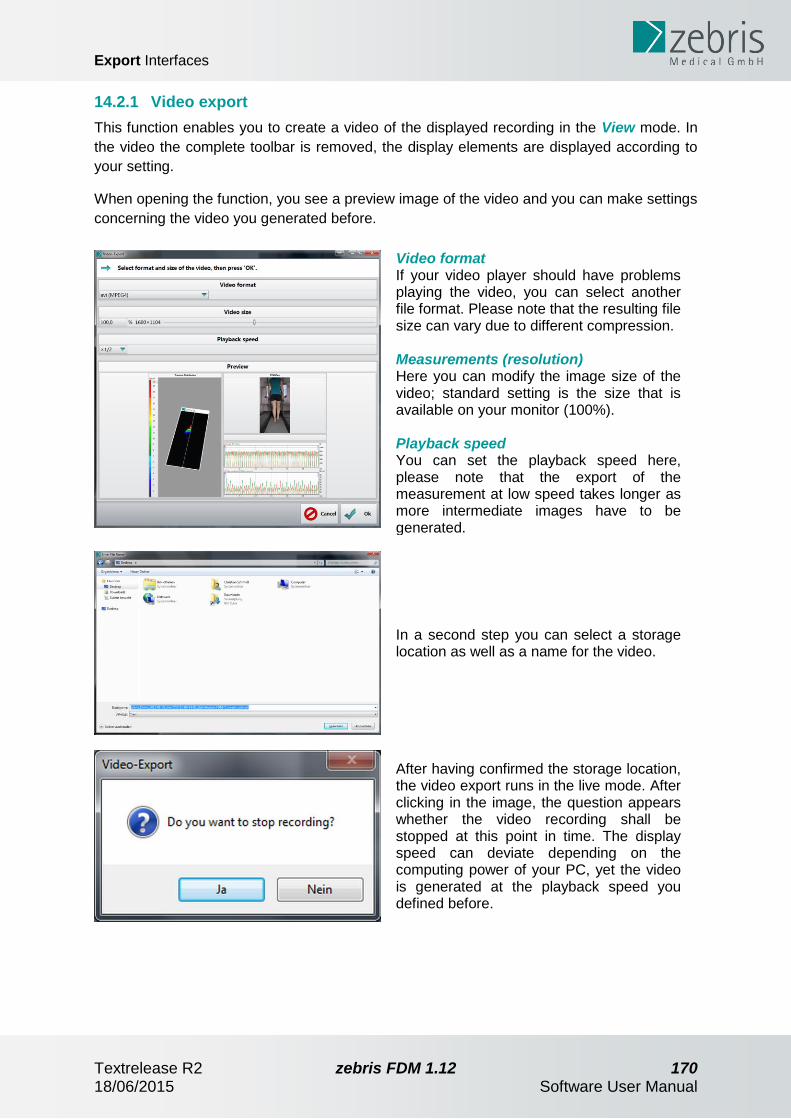
Export Interfaces
Textrelease R2 zebris FDM 1.12 170 18/06/2015 Software User Manual
14.2.1 Video export
This function enables you to create a video of the displayed recording in the View mode. In
the video the complete toolbar is removed, the display elements are displayed according to
your setting.
When opening the function, you see a preview image of the video and you can make settings
concerning the video you generated before.
Video format If your video player should have problems playing the video, you can select another file format. Please note that the resulting file size can vary due to different compression. Measurements (resolution) Here you can modify the image size of the video; standard setting is the size that is available on your monitor (100%). Playback speed You can set the playback speed here, please note that the export of the measurement at low speed takes longer as more intermediate images have to be generated.
In a second step you can select a storage location as well as a name for the video.
After having confirmed the storage location, the video export runs in the live mode. After clicking in the image, the question appears whether the video recording shall be stopped at this point in time. The display speed can deviate depending on the computing power of your PC, yet the video is generated at the playback speed you defined before.

Export Interfaces
Textrelease R2 zebris FDM 1.12 171 18/06/2015 Software User Manual
You can play the final video with every video player supporting the generated format. If errors occur during playing or it is not possible to play the video at all, please try to generate the video in another format or turn to the manufacturer of your video player.
14.2.2 XML
This export interface is available in the mode View with the modules gait analysis FDM/FDM-
T as well as stance analysis FDM/FDM-T. The file format is intended for the processing
through software packages with XML parser function or self-programmed software.
Besides meta information like patient and recording data, the size of the pressure platform
with which the measurement was carried out as well as all pressure plots in the interval of
analysis are generated – in case of the gait analysis both the single images and the roll-off
processes as well as the corresponding maximum pressure picture.
In the following, the used XML structure is illustrated, relevant tags are commented in the
text (please refer to specialist literature when it comes to the structure of an XML file.):
<type>gait_treadmill</type> used measuring module
<program>zebris FDM</program> name of the software
<program_version>1.12</program_version> version of the software
<format_version>1.0</format_version> format version
<measuring_system/> (used for internal purposes)
Patient information <patient>
<first_name>Demo</first_name>
<last_name>zebris</last_name>
<born>2012-01-01</born>
<sex>female</sex>
<code/>
</patient>
Recording information <measured>2012-11-09T12:06:06Z</measured>
<description>Demo (FDM-T + SYNClight plus + SYNCCam)</description>
Size of the used measuring matrix used during the measurement <cell_count>
<x>56</x>
<y>128</y>
</cell_count>
Structural order according to the following content, several sublevels possible
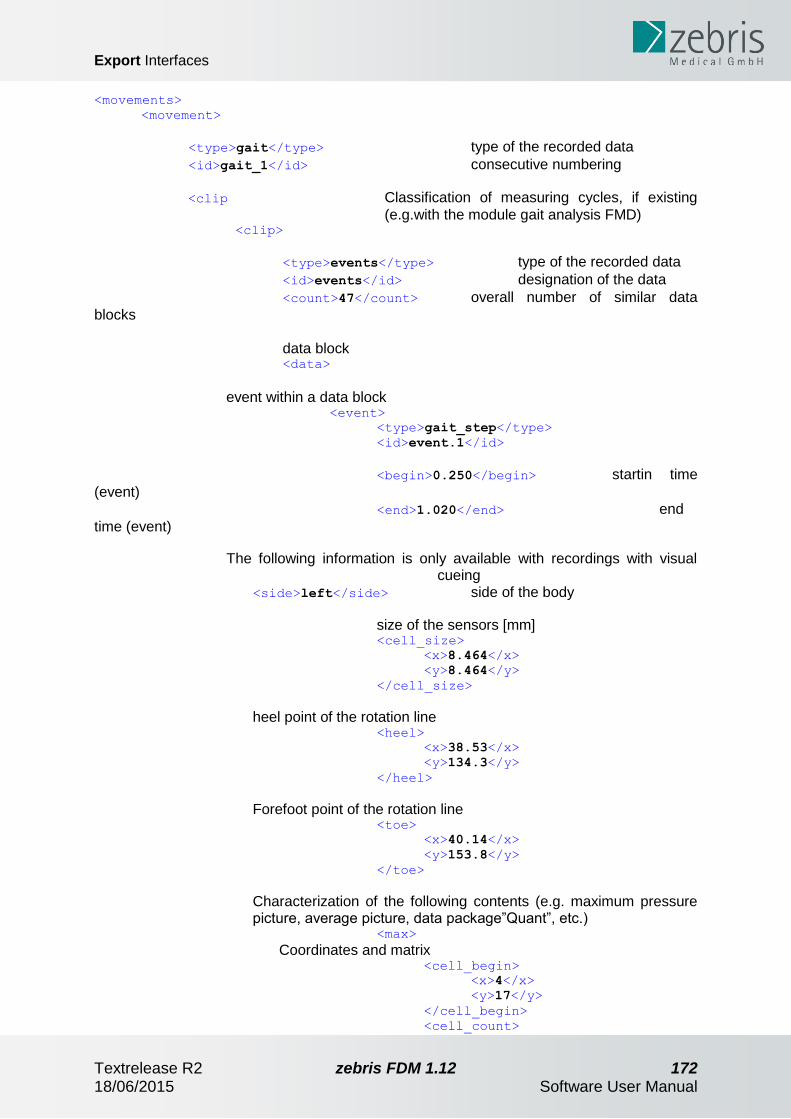
Export Interfaces
Textrelease R2 zebris FDM 1.12 172 18/06/2015 Software User Manual
<movements>
<movement>
<type>gait</type> type of the recorded data
<id>gait_1</id> consecutive numbering
<clip Classification of measuring cycles, if existing
(e.g.with the module gait analysis FMD) <clip>
<type>events</type> type of the recorded data
<id>events</id> designation of the data
<count>47</count> overall number of similar data
blocks data block <data>
event within a data block
<event>
<type>gait_step</type>
<id>event.1</id>
<begin>0.250</begin> startin time
(event) <end>1.020</end> end
time (event)
The following information is only available with recordings with visual cueing
<side>left</side> side of the body
size of the sensors [mm] <cell_size>
<x>8.464</x>
<y>8.464</y>
</cell_size>
heel point of the rotation line <heel>
<x>38.53</x>
<y>134.3</y>
</heel>
Forefoot point of the rotation line <toe>
<x>40.14</x>
<y>153.8</y>
</toe>
Characterization of the following contents (e.g. maximum pressure picture, average picture, data package”Quant”, etc.)
<max>
Coordinates and matrix <cell_begin>
<x>4</x>
<y>17</y>
</cell_begin>
<cell_count>

Export Interfaces
Textrelease R2 zebris FDM 1.12 173 18/06/2015 Software User Manual
<x>9</x>
<y>15</y>
</cell_count>
<cells>
0.0 0.0 0.0 0.0 0.0 0.0 0.0
0.0 0.0 0.0 0.0 0.0
[...]
</cells>
14.2.3 XML (raw data)
In contrast to the XML export, here only the data for every single measurement over the whole interval are generated. For recordings with a treadmill, the speed per measuring point in time [m/s] is created at the end of the file:
<clip>

Export Interfaces
Textrelease R2 zebris FDM 1.12 174 18/06/2015 Software User Manual
<type>analog</type>
<id>velocity.treadmill.1</id>
<begin>0.000</begin>
<frequency>100</frequency>
<count>3012</count>
<units>m/s</units>
<data>
<quant>0.62</quant>
<quant>0.84</quant>
[...]
</data>
14.3 Formats of third-party providers
Rothballer
This interface is accessible via the Database screen if you additionally purchased this
optional software module.
Data is saved in Rothballer format to a user-defined location. Provided that you configured
the Rothballer software for this interaction, the data transfer takes place automatically.
14.3.1 APD-Export
This type of export writes data from gait and stance analysis to a storage location. The data
format conforms with the specifications of pedcad GmbH.
The name of the export files will be generated like this: {last name}_{first name}_{birthday}_me-{measurement date}-{measurement time}_{record type}-{AVG for average plot or MPP for Maximum Pressure Plot}_{L for left or R for right foot}.apd Example file name: Doe_John_1983-03-26_me-2014-01-31-16-03_Stance Analysis FDM-T-AVG_L.apd
Stance analysis
When you export from a stance analysis measurement, just press the button APD Export in
the lower right corner.
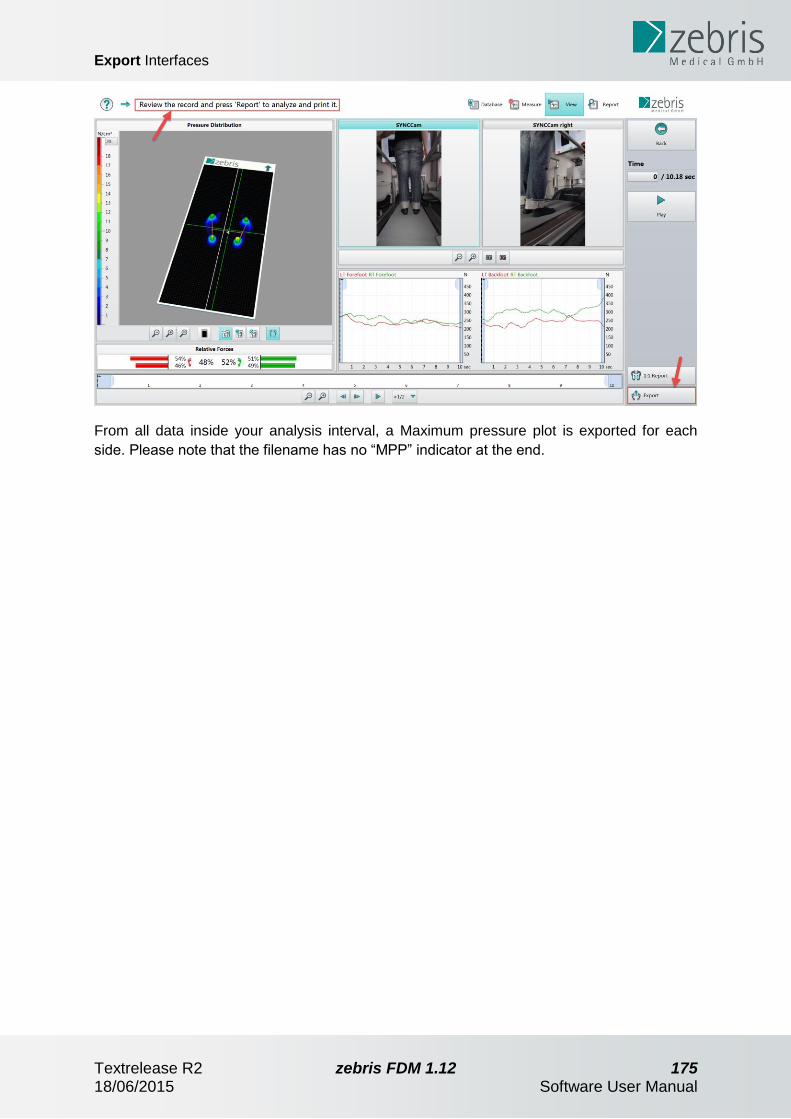
Export Interfaces
Textrelease R2 zebris FDM 1.12 175 18/06/2015 Software User Manual
From all data inside your analysis interval, a Maximum pressure plot is exported for each
side. Please note that the filename has no “MPP” indicator at the end.

Export Interfaces
Textrelease R2 zebris FDM 1.12 176 18/06/2015 Software User Manual
Gait analysis
1. When you export from a gait analysis measurement, press the button APD Export in
the lower right corner:
2. Now a simple wizard starts and you are prompted to select a left foot.
Just set the time cursor to the position where you can see the left foot you want on
the left side.
3. Often it is useful to zoom into the force curves to better see the single steps and
activate maximum pressure plot in the 3D view.

Export Interfaces
Textrelease R2 zebris FDM 1.12 177 18/06/2015 Software User Manual
4. When your wanted step is shown, press ‘Next’. Now you have to select a right foot,
same procedure as with the left foot.
Press ‘Next’ after selecting the right foot - four files will be exported (average and
MPP for each foot side).
Export Interfaces
Textrelease R2 zebris FDM 1.12 178 18/06/2015 Software User Manual
Notes