Zbigniew A. Dreger et al- Shock Wave Induced Decomposition Chemistry of Pentaerythritol Tetranitrate...
10
Shock Wave Induced Decomposition Chemistry of Pentaerythritol Tetranitrate Single Crys tals: Time -Res olved Emission Spectros copy Zbigniew A. Dreger, Yuri A. Gruzdkov, and Yogendra M. Gupta* Institute for Shock Physics and Department of Physics, Washington State Uni Versity, Pullman, Washington 99164-2816 Jerry J. Dick MS P952, Los Alam os National Laborat ory, Los Alamo s, New Mexico 87545 ReceiVed: May 3, 2001; In Final Form: October 25, 2001 The decomposition mechanism in shocked pentaerythritol tetranitrate (PETN) was examined using time- resolved emission spectroscopy. PETN single crystals were subjected to stepwise loading along [100] and [110] to peak stresses between 2 and 13 GPa. Due to concurrent changes in the optical transmission of PETN, emission spectra were analyzed using the absorption data acquired separately under the same loading conditions. Analyses of the corrected emission data revealed two bands in the spectra at ∼3.0 and ∼2.4 eV. Both bands were observed in every experiment regardless of stress or crystal orientation. However, their relative and absolute intensities, and temporal behavior revealed stress and orientation dependence. The emission was identified as chemiluminescence from the nitronium ion, NO 2 + , on the basis of its electronic structure and properties. NO 2 + electronic structure was analyzed using ab initio calculations, which showed transition energies matching those of the emitting intermediate observed experiment ally. Several chemical pathways compatible with the formation of NO 2 + are considered and evaluated. Finally, a four-step chemical initiation mechanism in shocked crystalline PETN is proposed and discussed in detail. I. Introduction Understanding decomposition mechanisms associated with sho ck initiatio n of hig h exp los ive s (HE) is imp ortant for improvement s in HE performance and for mitigation of hazards in storage and handling. For these reasons, shock initiation of HEs has received much attention in the past. 1 Although the macroscopic (thermal and mechanical) behavior of HEs has been exami ned extens ively , chemi cal decomp osition mechanisms under shock loading are not well understood. A combination of continuum measurements (pressure, particle velocity) and time-resolved spectroscopic methods is needed to provide the necessary macroscopic and microscopic insight into this chal- lengi ng probl em. 2 This combin ed app roach is par ticula rly important for solid HEs where the mechanical response and initiation chemistry are strongly coupled. 3-5 In this work, we sought to characterize the decomposition mecha nism in singl e crystals of penta erythr itol tetranitr ate (PETN, 1,3-propanediol, 2,2-bis(nitroxy)methyl-, dinitrate (es- ter)). Use of single crystals avoids the inherent complexities in the mechanical response of inhomogeneous solid materials, such as powders and composites, and is desirable for fundamental studies. PETN is a crystalline HE used extensively as an ingredient in many explosive formulations. Previous work on PETN has concentrated primarily on its mechanical response 4,6 and the shock to detonation transition (SDT). 7,8 The time and run distance to detonation in PETN crystals depends strongly on the orientation along which the crystal is shocked. Also, it was found that along the [110] orientation, crystals are more sensitive near 4.2 GPa than at 8.5 GPa. 6,9-11 The observed aniso tropy and the SDT anomaly for the [110] orientat ion are not well understood. 5,12,13 Strong light emission accompanying the changes in PETN was observed when the crystal was shocked along the [110] and [001] orientations. 4,6,14,15 Based on available data, this emission was tentatively assigned to chemiluminescence associated with PETN decomposition in the early stages of initiation. 4 An accurate determination of the origin of the emission was not possible due to the limited amount of data, 4 the lack of time-resolved measurements, and the needed complimentary absorption data. 16 Consequently, the decomposi- tion chemistry responsible for emission could not be determined. In the present work, we address the deficiencies indicated in prior studies by fully characterizing light emission from shocked PETN. Among the new features introduced in this work are time-resolved emission measurements and analytical corrections of the emission spectra due to concurrent changes in absorption of shocked PETN. Furthermore, our experiments are designed to explore the possibility of using this emission to identify chemical changes to the sample. The results are analyzed using ab initio computational methods. The remainder of this paper is organized as follows. Sample preparation and experimental techniques are described in the next section. Section III presen ts the experiment al results, covering both absorption and emission measurements. In section IV, we discuss the origin of the emission, identify the emitting intermediate, and propose a plausible reaction mechanism in shocked PETN. The main findings of this work are summarized in section V. II. Experimental Methods A. Sample Preparation. The PETN single crystals used in these studies were grown at Los Alamos National Laboratory as described in ref 17. The samples were optically clear and 247 J. Phys. Chem. B 2002, 106, 247-256 10.10 21/jp 011682v CCC: $22. 00 © 2002 Ameri can Che mica l Soci ety Published on Web 12/12/2001
Transcript of Zbigniew A. Dreger et al- Shock Wave Induced Decomposition Chemistry of Pentaerythritol Tetranitrate...

8/3/2019 Zbigniew A. Dreger et al- Shock Wave Induced Decomposition Chemistry of Pentaerythritol Tetranitrate Single Cryst…
http://slidepdf.com/reader/full/zbigniew-a-dreger-et-al-shock-wave-induced-decomposition-chemistry-of-pentaerythritol 1/10
Shock Wave Induced Decomposition Chemistry of Pentaerythritol Tetranitrate Single
Crystals: Time-Resolved Emission Spectroscopy
Zbigniew A. Dreger, Yuri A. Gruzdkov, and Yogendra M. Gupta*
Institute for Shock Physics and Department of Physics, Washington State UniVersity,Pullman, Washington 99164-2816
Jerry J. Dick MS P952, Los Alamos National Laboratory, Los Alamos, New Mexico 87545
ReceiVed: May 3, 2001; In Final Form: October 25, 2001
The decomposition mechanism in shocked pentaerythritol tetranitrate (PETN) was examined using time-resolved emission spectroscopy. PETN single crystals were subjected to stepwise loading along [100] and[110] to peak stresses between 2 and 13 GPa. Due to concurrent changes in the optical transmission of PETN,emission spectra were analyzed using the absorption data acquired separately under the same loading conditions.Analyses of the corrected emission data revealed two bands in the spectra at ∼3.0 and ∼2.4 eV. Both bandswere observed in every experiment regardless of stress or crystal orientation. However, their relative andabsolute intensities, and temporal behavior revealed stress and orientation dependence. The emission was
identified as chemiluminescence from the nitronium ion, NO2+, on the basis of its electronic structure andproperties. NO2+ electronic structure was analyzed using ab initio calculations, which showed transition energies
matching those of the emitting intermediate observed experimentally. Several chemical pathways compatiblewith the formation of NO2
+ are considered and evaluated. Finally, a four-step chemical initiation mechanismin shocked crystalline PETN is proposed and discussed in detail.
I. Introduction
Understanding decomposition mechanisms associated withshock initiation of high explosives (HE) is important forimprovements in HE performance and for mitigation of hazardsin storage and handling. For these reasons, shock initiation of HEs has received much attention in the past.1 Although the
macroscopic (thermal and mechanical) behavior of HEs has beenexamined extensively, chemical decomposition mechanismsunder shock loading are not well understood. A combinationof continuum measurements (pressure, particle velocity) andtime-resolved spectroscopic methods is needed to provide thenecessary macroscopic and microscopic insight into this chal-lenging problem.2 This combined approach is particularlyimportant for solid HEs where the mechanical response andinitiation chemistry are strongly coupled.3-5
In this work, we sought to characterize the decompositionmechanism in single crystals of pentaerythritol tetranitrate(PETN, 1,3-propanediol, 2,2-bis(nitroxy)methyl-, dinitrate (es-ter)). Use of single crystals avoids the inherent complexities inthe mechanical response of inhomogeneous solid materials, suchas powders and composites, and is desirable for fundamentalstudies. PETN is a crystalline HE used extensively as aningredient in many explosive formulations. Previous work onPETN has concentrated primarily on its mechanical response4,6
and the shock to detonation transition (SDT).7,8 The time andrun distance to detonation in PETN crystals depends stronglyon the orientation along which the crystal is shocked. Also, itwas found that along the [110] orientation, crystals are moresensitive near 4.2 GPa than at 8.5 GPa.6,9-11 The observedanisotropy and the SDT anomaly for the [110] orientation arenot well understood.5,12,13 Strong light emission accompanying
the changes in PETN was observed when the crystal wasshocked along the [110] and [001] orientations.4,6,14,15 Basedon available data, this emission was tentatively assigned tochemiluminescence associated with PETN decomposition in theearly stages of initiation.4 An accurate determination of theorigin of the emission was not possible due to the limited amountof data,4 the lack of time-resolved measurements, and the neededcomplimentary absorption data.16 Consequently, the decomposi-tion chemistry responsible for emission could not be determined.
In the present work, we address the deficiencies indicated inprior studies by fully characterizing light emission from shockedPETN. Among the new features introduced in this work aretime-resolved emission measurements and analytical correctionsof the emission spectra due to concurrent changes in absorptionof shocked PETN. Furthermore, our experiments are designedto explore the possibility of using this emission to identifychemical changes to the sample. The results are analyzed usingab initio computational methods.
The remainder of this paper is organized as follows. Samplepreparation and experimental techniques are described in the
next section. Section III presents the experimental results,covering both absorption and emission measurements. In sectionIV, we discuss the origin of the emission, identify the emittingintermediate, and propose a plausible reaction mechanism inshocked PETN. The main findings of this work are summarizedin section V.
II. Experimental Methods
A. Sample Preparation. The PETN single crystals used inthese studies were grown at Los Alamos National Laboratoryas described in ref 17. The samples were optically clear and
247 J. Phys. Chem. B 2002, 106, 247-256
10.1021/jp011682v CCC: $22.00 © 2002 American Chemical SocietyPublished on Web 12/12/2001
8/3/2019 Zbigniew A. Dreger et al- Shock Wave Induced Decomposition Chemistry of Pentaerythritol Tetranitrate Single Cryst…
http://slidepdf.com/reader/full/zbigniew-a-dreger-et-al-shock-wave-induced-decomposition-chemistry-of-pentaerythritol 2/10
contained less than 100 ppm of organic impurities as indicatedby NMR and chromatography. The crystals were cut using adiamond saw into thin (ca. 1 mm) slabs with either the [110]or [100] crystal axis orthogonal to the face of the slab. Thecrystal orientation was maintained to better than 1 degree. Theslabs were cleaved into smaller pieces, typically rectangular inshape, with lateral dimensions of approximately 8-10 mm. Eachpiece was ground down and polished using a progression of aluminum oxide lapping sheets (30, 10, 1, and 0.3 micron, Fiber
Optics Center, MA) and an aqueous solution of detergent as alubricant. This procedure resulted in optically clear crystal slideswith a thickness from 350 to 500 µm. Typically, the thicknessacross the sample was maintained to better than 5 µm and thesurfaces were flat to ca. 5 wavelengths of visible light.
In all emission and absorption experiments, the PETN slideswere sandwiched between two LiF windows. The front and backwindows were 25.4 and 19 mm in diameter and 3 and 5 mm inthickness, respectively. The sample was centered on thewindows using a plastic mask cut to the exact shape of thesample. Liquid glycerol (spectrophotometric grade, 99.5+%,Aldrich Chemical) was used to fill the small (<4 µm) gapsbetween the sample and windows. In a separate set of controlexperiments, we verified that glycerol remains optically trans-
parent and chemically inert under the loading conditions of interest.
B. Impact Experiments. Shock waves were generated byimpacting a piece of a-cut sapphire mounted on a projectileonto the LiF front window of a sample cell. The projectile wasaccelerated to the desired velocity using a single-stage light-gas gun.18 After traversing the front window, the shock wavereverberated between the windows bringing the PETN sampleto the final stress and temperature in approximately three stepsand 300 ns. The lateral dimensions of the sample allowed forat least 800-ns recording time, after the entry of the shock wavein the sample, before release waves arrived from the sampleedges. Stress histories in the sample in each experiment werecalculated using a one-dimensional wave propagation code,COPS.19 The calculations used a material model describing theshock response of sapphire,20 LiF,21 and PETN. The latter iscurrently under development in our laboratory.22 Experimentaldetails are summarized in Table 1.
Emission Measurements. Light emitted from shocked PETNwas collected as illustrated schematically in Figure 1. The lightwas delivered through optical fibers (400 µm core diameter) toa fast photodiode (DET2-SI, Thorlabs) and to the spectraldetection system shown in Figure 1. The output of thespectrometer (SpectraPro-150, Acton Research Corporation) wasdispersed temporally (∼50 ns resolution) by an electronic streakcamera (Imacon 500, Hadland) producing a two-dimensionalimage (intensity vs time vs wavelength) on the phosphor screen
of the streak camera. This image was amplified by a micro-channel plate intensifier and recorded by a CCD detector (PICCD, 1024 × 1024 back-illuminated chip). The photodiodesignal at a 4-ns sampling rate was used as an overall intensitymonitor and a timing diagnostic. Although both sets of datacan be recorded with higher time resolution, the higherresolution was not needed in this work.
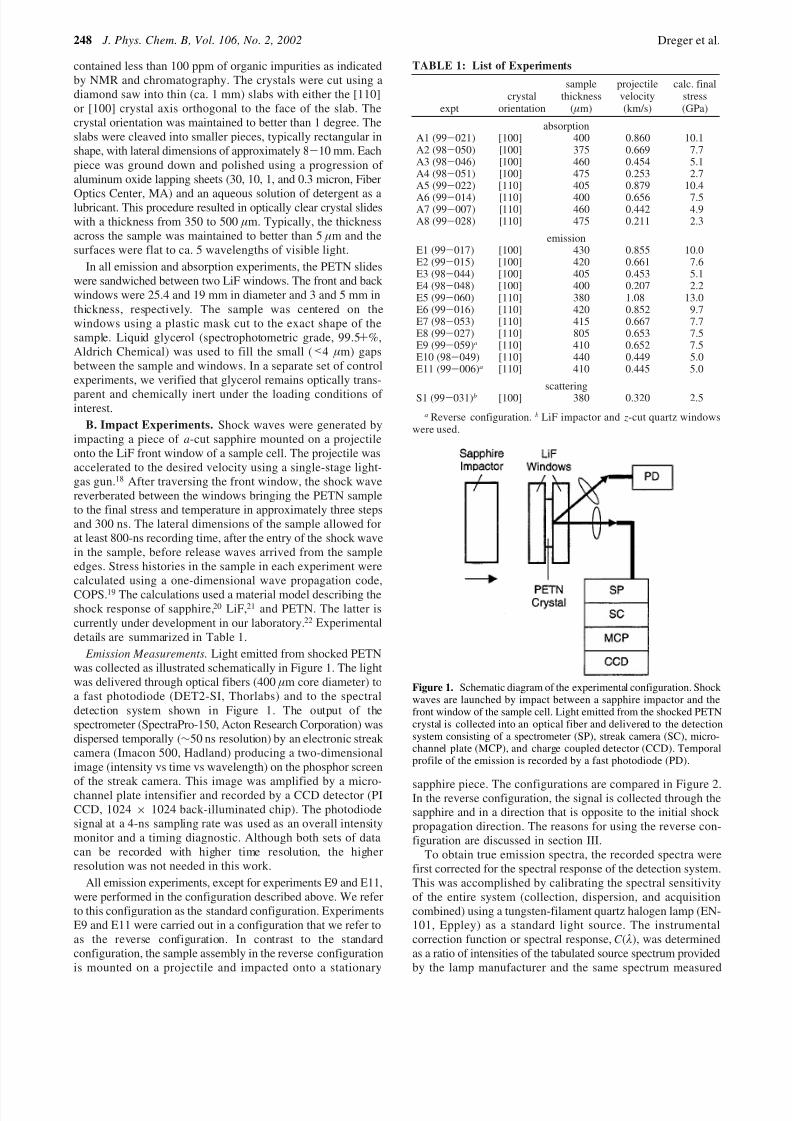
All emission experiments, except for experiments E9 and E11,were performed in the configuration described above. We referto this configuration as the standard configuration. ExperimentsE9 and E11 were carried out in a configuration that we refer toas the reverse configuration. In contrast to the standardconfiguration, the sample assembly in the reverse configurationis mounted on a projectile and impacted onto a stationary
sapphire piece. The configurations are compared in Figure 2.In the reverse configuration, the signal is collected through thesapphire and in a direction that is opposite to the initial shockpropagation direction. The reasons for using the reverse con-figuration are discussed in section III.
To obtain true emission spectra, the recorded spectra werefirst corrected for the spectral response of the detection system.This was accomplished by calibrating the spectral sensitivityof the entire system (collection, dispersion, and acquisitioncombined) using a tungsten-filament quartz halogen lamp (EN-101, Eppley) as a standard light source. The instrumentalcorrection function or spectral response, C ( λ), was determinedas a ratio of intensities of the tabulated source spectrum providedby the lamp manufacturer and the same spectrum measured
TABLE 1: List of Experiments
exptcrystal
orientation
samplethickness
( µm)
projectilevelocity(km/s)
calc. finalstress(GPa)
absorptionA1 (99-021) [100] 400 0.860 10.1A2 (98-050) [100] 375 0.669 7.7A3 (98-046) [100] 460 0.454 5.1A4 (98-051) [100] 475 0.253 2.7A5 (99-022) [110] 405 0.879 10.4
A6 (99-014) [110] 400 0.656 7.5A7 (99-007) [110] 460 0.442 4.9A8 (99-028) [110] 475 0.211 2.3
emissionE1 (99-017) [100] 430 0.855 10.0E2 (99-015) [100] 420 0.661 7.6E3 (98-044) [100] 405 0.453 5.1E4 (98-048) [100] 400 0.207 2.2E5 (99-060) [110] 380 1.08 13.0E6 (99-016) [110] 420 0.852 9.7E7 (98-053) [110] 415 0.667 7.7E8 (99-027) [110] 805 0.653 7.5E9 (99-059)a [110] 410 0.652 7.5E10 (98-049) [110] 440 0.449 5.0E11 (99-006)a [110] 410 0.445 5.0
scatteringS1 (99-031)b [100] 380 0.320 2.5
a Reverse configuration. b LiF impactor and z-cut quartz windowswere used.
Figure 1. Schematic diagram of the experimental configuration. Shockwaves are launched by impact between a sapphire impactor and thefront window of the sample cell. Light emitted from the shocked PETNcrystal is collected into an optical fiber and delivered to the detectionsystem consisting of a spectrometer (SP), streak camera (SC), micro-channel plate (MCP), and charge coupled detector (CCD). Temporalprofile of the emission is recorded by a fast photodiode (PD).
248 J. Phys. Chem. B, Vol. 106, No. 2, 2002 Dreger et al.
8/3/2019 Zbigniew A. Dreger et al- Shock Wave Induced Decomposition Chemistry of Pentaerythritol Tetranitrate Single Cryst…
http://slidepdf.com/reader/full/zbigniew-a-dreger-et-al-shock-wave-induced-decomposition-chemistry-of-pentaerythritol 3/10
using our detection system. This function was consequently usedto correct the experimental data.
In addition to the instrumental correction, an additionalcorrection to the data was necessary since the shocked PETNabsorbs light quite strongly.23 Therefore, light attenuation insidethe sample had to be taken into account. The latter requiredknowledge of the light extinction in the sample, which had tobe measured separately. Further details about this correctionare given in section III B.
Absorption Measurements. For each emission experiment, amatching extinction experiment was performed (see Table 1).The configuration for time-resolved extinction measurementswas similar to that used in our earlier work.24,25 A pulsed xenon
flashlamp was used as the light source. The output was filtered,collimated, and directed through the sample. The transmittedlight was delivered to a streak camera/spectrometer/CCD systemthat recorded time-resolved transmission spectra with 50 ns timeresolution. These spectra were then converted to extinction dataas described in ref 26.
Since two different physical processes, absorption and scat-tering, could cause light extinction in the sample, we used aseparate experiment to determine directly the possible contribu-tion of scattering from the sample. A beam of laser light (514.5nm) was sent through the PETN sample along its normal, andthe elastically scattered light was collected at 45 degrees to thenormal in a backscattering geometry. The intensity of thescattered light was monitored using a fast photodiode.23 Z -cut
quartz windows were used in the scattering experiment becausequartz remains elastic up to 6 GPa.27 The elastic response of the quartz windows eliminates any potential contribution to thescattering signal from the windows. The result of this experimentis presented in section III A.
As indicated in Table 1, a total of 20 experiments (11emission, 8 absorption, and 1 scattering) were carried out inthis work. The final stress in the PETN sample in each of theexperiments could be determined very accurately (within 1-2%)because this stress is related only to the projectile velocity andthe known shock response of the impactor and windows.20,21,27
To support the emission data analyses, the same loadingconditions were employed in emission and extinction experi-ments.
III. Results
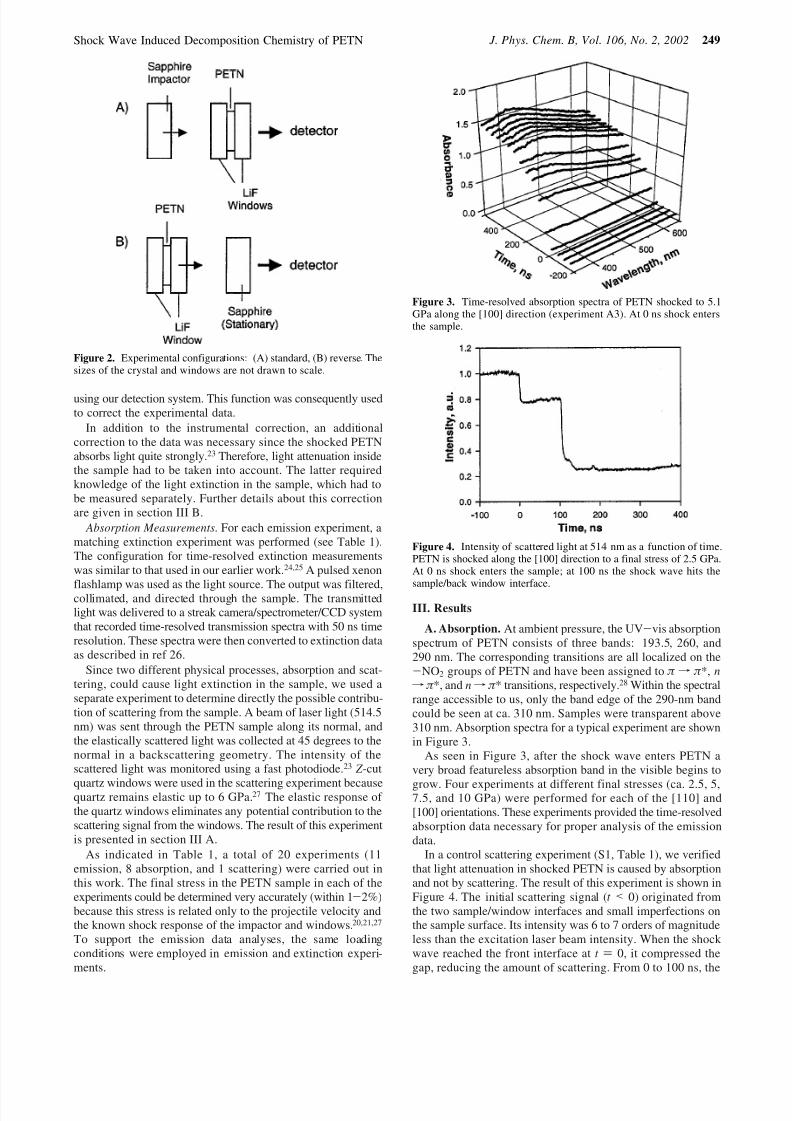
A. Absorption. At ambient pressure, the UV-vis absorptionspectrum of PETN consists of three bands: 193.5, 260, and290 nm. The corresponding transitions are all localized on the-NO2 groups of PETN and have been assigned to π f π *, nf π *, and nf π * transitions, respectively.28 Within the spectralrange accessible to us, only the band edge of the 290-nm bandcould be seen at ca. 310 nm. Samples were transparent above310 nm. Absorption spectra for a typical experiment are shownin Figure 3.
As seen in Figure 3, after the shock wave enters PETN avery broad featureless absorption band in the visible begins to
grow. Four experiments at different final stresses (ca. 2.5, 5,7.5, and 10 GPa) were performed for each of the [110] and[100] orientations. These experiments provided the time-resolvedabsorption data necessary for proper analysis of the emissiondata.
In a control scattering experiment (S1, Table 1), we verifiedthat light attenuation in shocked PETN is caused by absorptionand not by scattering. The result of this experiment is shown inFigure 4. The initial scattering signal (t < 0) originated fromthe two sample/window interfaces and small imperfections onthe sample surface. Its intensity was 6 to 7 orders of magnitudeless than the excitation laser beam intensity. When the shockwave reached the front interface at t ) 0, it compressed thegap, reducing the amount of scattering. From 0 to 100 ns, the
Figure 2. Experimental configurations: (A) standard, (B) reverse. Thesizes of the crystal and windows are not drawn to scale.
Figure 3. Time-resolved absorption spectra of PETN shocked to 5.1GPa along the [100] direction (experiment A3). At 0 ns shock entersthe sample.
Figure 4. Intensity of scattered light at 514 nm as a function of time.PETN is shocked along the [100] direction to a final stress of 2.5 GPa.At 0 ns shock enters the sample; at 100 ns the shock wave hits thesample/back window interface.
Shock Wave Induced Decomposition Chemistry of PETN J. Phys. Chem. B, Vol. 106, No. 2, 2002 249

8/3/2019 Zbigniew A. Dreger et al- Shock Wave Induced Decomposition Chemistry of Pentaerythritol Tetranitrate Single Cryst…
http://slidepdf.com/reader/full/zbigniew-a-dreger-et-al-shock-wave-induced-decomposition-chemistry-of-pentaerythritol 4/10
shock wave traversed the sample. Effectively, there was nochange in scattering during that time interval while transmissionthrough the sample was decreasing by ca. 60% (prior measure-ment). When the shock wave reached the back interface, thescattering signal decreased sharply again due to compressionof the back interface. After that, there was no further change inscattering while transmission through the sample kept decreasingdown to a few percent. From the result in Figure 4, weconcluded that light attenuation observed in extinction experi-ments was indeed due to absorption; the contribution of scattering did not exceed 0.001% and could be ignored for allpractical purposes. Since the experiment revealed no scattering,the terms “absorption” and “extinction” can be used inter-changeably in the present work.
The observed absorption in shocked PETN is not fully
understood at the present time. The subnanosecond time scaleof the process causing absorption may indicate an electronicprocess, such as stress or deformation induced change of theelectronic band structure of PETN.23,29
B. Emission. Light emission from both the [110] and [100]orientations of PETN was observed when the crystal wassubjected to stepwise shock loading with final stresses as lowas 5 GPa; the precise lower limit was not established. Therewas no emission at 2.2 GPa for the [100] orientation (experimentE4). In previous studies,4,14,15 light emission was observed onlyfor crystals shocked along the [110] and [001] directions; noemission was found for the [100] crystal orientation. Theapparent discrepancy with our results is most likely due to thelower sensitivity of the previous detection systems.
Typical time-resolved emission spectra of shocked PETN(experiment E2) are shown in Figure 5. As can be seen, theemission covers a broad spectral range from 300 to beyond 700nm (700 nm was the long wavelength limit of our detectionsystem). The emission onset occurs at ∼150 ns and the emissionintensity increases while the shock wave is still reverberatingin the sample. It continues to increase after the final stress isreached at ∼300 ns.
As discussed in the preceding section, shocked PETN absorbslight throughout the entire visible range. Because this absorptionoverlaps spectrally and temporally with the emission, the latteris attenuated before the radiation exits the sample. Therefore,to obtain true emission spectra, the recorded spectra must becorrected for light reabsorption in PETN. To implement this
correction one must know the spatial distribution of the emittingand absorbing species across the sample (see Appendix).Experimental or theoretical determination of the spatial distribu-tions is a complex problem since a shock wave constitutes amoving discontinuity. Hence, no two locations inside the samplewill have the same history of stress and temperature. Theresulting spatial distributions of the absorbing/emitting specieswill reflect the time-dependent processes that give rise to
absorption/emission and the history of these changes in theshocked sample.Despite this complexity, some qualitative conclusions could
still be drawn from the data presented in Figures 6 and 7. Figure6 compares the temporal profiles of absorption (Exp. A6) withemission (Exp. E7) that are typical for the set of experimentspresented here. It indicates that at the onset of emission theabsorbance has already reached a plateau. Further absorptionchanges are fairly small and slow for the entire duration of emission. This behavior implies that the absorbing species hasattained a steady state across the sample and the spatialdistribution is close to uniform.
Figure 7 compares emission results obtained in the standardand reverse configurations (see Figure 2). It has been suggested
Figure 5. Time-resolved emission spectra of PETN shocked to 7.6GPa along the [100] direction (experiment E2). The spectra have beencorrected for the detector sensitivity. At 0 ns shock enters the crystal;by ∼350 ns the final stress is reached. Spectra were taken with 50 nsresolution.
Figure 6. Temporal profiles of absorption and emission. The curvesrepresent photodiode records for experiments A6 and E7. Shock entersthe samples at 0 ns.
Figure 7. Temporal profiles of emission for the standard (solid line)and reverse (dotted line) configuration. The following experiments arecompared: E10 and E11 (5 GPa, low emission intensity), E7 and E9(∼7.6 GPa, high emission intensity). Shock enters the sample at 0 ns.
250 J. Phys. Chem. B, Vol. 106, No. 2, 2002 Dreger et al.

8/3/2019 Zbigniew A. Dreger et al- Shock Wave Induced Decomposition Chemistry of Pentaerythritol Tetranitrate Single Cryst…
http://slidepdf.com/reader/full/zbigniew-a-dreger-et-al-shock-wave-induced-decomposition-chemistry-of-pentaerythritol 5/10
that the emitting region may be narrow and concentrated nearthe shock front.4 In such a scenario, emission signals should bedifferent in these two configurations since the emitted light hasto travel different optical paths to reach the detector. On theother hand, if the emitting region is broad and includes the entireshocked sample, the difference between the two configurationsshould be small. Figure 7 shows that the emission traces coincidealmost exactly, indicating the broad spatial distribution.
Based on the data and arguments presented above, weassumed that both the emitting and absorbing species aredistributed uniformly in the bulk of shocked PETN. With thisassumption, an expression for “true emission”, I T( λ, t ), can beeasily derived (see Appendix):30
where C ( λ) is the spectral response of the detection system, I R( λ, t ) is the recorded emission intensity, and A( λ, t ) is themeasured absorbance of the sample. Figure 8 shows the effectof the corrections on a typical emission spectrum acquired usingour detection system. It is seen that the spectrum becomesbroader and shifts to higher energies. All the data presentedbelow have been corrected using eq 1.
As indicated, emission appears after an induction period of at least 100 ns relative to when the shock wave enters thesample. The results in Figure 9 demonstrate that the inductionperiod depends on both the crystal orientation and the final stressin the sample. The traces shown were obtained from emissionspectra by integrating the area under the curve from 300 to 700
nm. In general, the induction periods are shorter for the [110]orientation than for the [100] orientation. Also, the effect of stress on the induction period is different for the two orienta-tions. For the [100] orientation, the induction period decreasesmonotonically as the stress increases. In contrast, it goes througha local minimum at 7.7 GPa (final stress) for the [110]orientation.
Emission spectra change significantly with time and/or stress.However, both crystallographic orientations produce very similarspectral features. As illustrated in Figure 10, the spectral shapeof the emission shows a tendency to broaden and to shift tolower energies with time. Analysis of this spectral evolutionreveals that the spectra consist of two components that can befitted well by Gaussian peaks. The first component is the high-
energy band (HEB) located at ∼3.0 eV, which emerges first.The second component, low-energy band (LEB), located at ∼2.4eV, appears ∼50 ns later. Intensity of the LEB grows fasterthan the HEB, with both bands shifting gradually to lowerenergies as time progresses. However, the observed separationbetween the bands, ∼0.6 eV, appears to be constant regardlessof the shift. This behavior is illustrated in Figure 11.
The absolute and relative intensities, and the positions of thelow and high-energy bands also change with stress, as shownin Figure 12. Similar to the induction period, the absoluteintensity of both bands goes through an extremum at 7.7 GPafor the [110] orientation. However, the intensity ratio of theLEB to the HEB increases continuously with stress. At highstresses, the emission becomes dominated by the LEB.
IV. Discussion
A. Origin of Emission. Light emission occurring in shockedPETN can arise from three potential sources: (i) thermalemission, (ii) electronically excited PETN molecules, or (iii)excited intermediates. Several factors suggest that the observed
emission cannot arise from thermal emission. First, the emissionappears at stresses as low as 5 GPa. The estimated temperatureincrease in PETN at this stress is on the order of 100 K,22 whichis not sufficient to produce thermal emission in the visible.Furthermore, the emission spectra cannot be fitted satisfactorilyto Wien’s law. Finally, the maximum of the emission spectrum(at 5 GPa) would correspond to a temperature of 6700 K, whichis unreasonably high even for a fully developed detonation wave(3400-4100 K).8,31
The next possibility, emission originating from shock inducedelectronic excitation of PETN, can be ruled out on the basis of the following arguments. First, emission does not appear at theinstant of shock wave entry into the sample, as it would beexpected for this kind of process. Second, the luminosity reaches
Figure 8. Result of corrections for a typical emission spectrum: (a)recorded spectrum, (b) after instrumental (C ( λ)) correction only, (c)after applying eq 1.
I T( λ,t ) ) A( λ,t ) I R( λ,t ) ln10
C ( λ)(1- 10- A( λ,t ))(1)
Figure 9. Temporal profile of global emission intensity from PETNshocked along two different crystallographic directions. Shock directionand final stress values are shown. Time resolution is 50 ns; shock entersthe sample at 0 ns.
Shock Wave Induced Decomposition Chemistry of PETN J. Phys. Chem. B, Vol. 106, No. 2, 2002 251

8/3/2019 Zbigniew A. Dreger et al- Shock Wave Induced Decomposition Chemistry of Pentaerythritol Tetranitrate Single Cryst…
http://slidepdf.com/reader/full/zbigniew-a-dreger-et-al-shock-wave-induced-decomposition-chemistry-of-pentaerythritol 6/10
its maximum after the final state has been reached and when
there are no shock waves propagating in the sample. Finally,the emission spectra differ significantly from the photolumi-nescence spectrum of PETN. The photoluminescence has a verylow quantum yield and the resulting luminosity would be veryweak. Also, the maximum of the photoluminescence (∼420 nmat ambient pressure) exhibits a blue shift with pressure, 32 whilea red shift is observed for the shock-induced emission.
Figure 13 compares the behavior of reciprocal run distanceto detonation (RDD)4,12 to the integrated emission intensity(summed over a time interval of 800 ns) and to the reciprocalinduction period for the [110] orientation. There is a clearcorrelation between these three quantities. In particular, all of them go through a maximum near 5 GPa (input stress). Thiscorrelation between the emission parameters and RDD suggests
that the emission most likely originates from the same chemicalprocesses that drive the shock to detonation transition. Giventhe above factors, the observed emission can be identified aschemiluminescence from the excited intermediates that areproduced in the course of PETN decomposition.
B. Emission Components. The two components in theemission spectra separated in time and energy imply twodifferent chemiluminescent processes. The HEB componentappears first after a short induction period. Existence of the
induction period suggests that the initial decomposition step isnot chemiluminescent. This is reasonable because the firstreaction in HE decomposition is usually rate limiting and largelyendothermic, while the following reactions are relatively fastand exothermic.33 A longer induction period for the secondcomponent indicates that either one extra step is involved inthe process, giving rise to the LEB compared to the HEB, orthe respective reaction is slower. However, since the LEB growsfaster than the HEB, the first alternative appears to be morereasonable.
Figure 14 gives a qualitative energy diagram that is consistentwith the kinetic profile just described and the expected ther-mochemistry of these processes. Reaction 1 is endothermic.Reaction 2 produces the first emitting intermediate. Although
the combined energy of this intermediate and other reactionproducts cannot be determined with certainty, it is likely to besimilar to that of the transition state, TS2. Therefore, it isprobably higher in energy than the products of reaction 1.Reaction 3 represents the extra step between the two emittingintermediates. It is likely exothermic and is shown as such inFigure 14. Its activation energy can either be lower than that of Reaction 2, as shown in the figure, or higher. Reaction 4
produces the second emitting intermediate and is similar toReaction 2. Reactions 5 and 6 depict electronic transitions of the intermediates to the ground states producing the HEB andLEB, respectively.
Although there appears to be two chemiluminescent reactions,the number of chemiluminescing intermediates may or may not
Figure 10. Evolution of emission spectrum in time for PETN shockedto 7.6 GPa along the [100] direction (experiment E2). Dashed and dottedlines correspond to the low- and high-energy components of thespectrum, respectively. Shock enters the sample at 0 ns; the spectrawere collected at times shown.
Figure 11. Position of the maxima for the low- and high-energyemission bands as a function of time. Results of experiments E6 andE1 are presented.
252 J. Phys. Chem. B, Vol. 106, No. 2, 2002 Dreger et al.

8/3/2019 Zbigniew A. Dreger et al- Shock Wave Induced Decomposition Chemistry of Pentaerythritol Tetranitrate Single Cryst…
http://slidepdf.com/reader/full/zbigniew-a-dreger-et-al-shock-wave-induced-decomposition-chemistry-of-pentaerythritol 7/10
be two. In principle, it is possible that two different excitedstates of the same intermediate give rise to the two emissioncomponents. For this to occur, two requirements need to besatisfied: (1) the potential energy surface (PES) of each reactionmust cross with the corresponding excited state of the inter-mediate and (2) internal conversion between the excited statesmust be slow compared to the radiative transition to the groundstate.
C. Emitting Intermediate. It is well-known that highlyexothermic reactions producing small molecules are more likelyto result in chemiluminescence since the energy would bedifficult to accommodate within the limited degrees of freedom
of such products.34
Therefore, it is reasonable to look for theemitting species among the small molecules expected to formin the course of PETN decomposition. Previously, nitrogendioxide, NO2, was tentatively suggested as the emitting species.4
However, only the LEB is close in energy to the transitionenergy of nitrogen dioxide (2 eV; X(2A1) r A(2B2) transi-tion).35-37 The HEB cannot be explained by NO2 because the2B2 state of NO2 has a dissociative limit of 390 nm. Thisemission cutoff is not present in our experiments.
Emission from NO was suggested to account for light below390 nm.4 However, the NO X(2Π1/2)rB(2Π3/2) transition peaksat 320-340 nm,38 which does not match the HEB either. Also,the presence of NO in the early decomposition products wouldnot be consistent with the ionic character of decomposition.5
Instead, after considering the electronic structure of NO2+ and
analyzing it in terms of our emission data, we propose that the
nitronium ion, NO2+
, is the emitting species.The nitronium ion is a first-row, closed-shell triatomic andis among the simplest polyatomic cations. However, theavailable information for NO2
+ is limited primarily to its groundstate.39-41 To determine the electronic transition energies andgeometry of the excited states we carried out ab initio calcula-tions employing single excitation configuration interaction (CIS)and the 6-311+G(d, p) basis set implemented in Gaussian 98.42
Figure 15 shows the PES for the ground and three lowest excitedstates. The ground state is linear (1Σg
+) and the ON bond lengthis 1.122 Å.40 In contrast, the excited states are bent; theirproperties are detailed in Table 2. The two lower excited statesare stable as verified by vibrational analyses. The upper 1A2
excited state has one imaginary frequency indicating that the
Figure 12. Stress dependence of the emission spectra for the [110]orientation. The spectra were recorded at 650 ns after the shock waveentered the sample. Dashed and dotted lines show the two components
(LEB and HEB) of the spectra.
Figure 13. Correlation of run distance to detonation (RDD) andemission data (intensity and induction period) for the [110] orientation.The top panel displays RDD data of ref 6 (circles) and the solid linerepresents a polynomial fit to the data. The bottom panel shows totalemission intensity (squares) and induction period (triangles) measuredin this work.
Figure 14. Qualitative energy diagram for reactions in shocked PETN.TS# denotes the transition state for each reaction. Each bold horizontalline represents either the transition state or products/intermediatesformed at each decomposition step. The vertical arrows depict chemi-luminescence that brings one of the species from an excited state, inwhich it is formed, down to the ground state. A photon is emitted inthis transition. More details are given in the text.
Shock Wave Induced Decomposition Chemistry of PETN J. Phys. Chem. B, Vol. 106, No. 2, 2002 253

8/3/2019 Zbigniew A. Dreger et al- Shock Wave Induced Decomposition Chemistry of Pentaerythritol Tetranitrate Single Cryst…
http://slidepdf.com/reader/full/zbigniew-a-dreger-et-al-shock-wave-induced-decomposition-chemistry-of-pentaerythritol 8/10
state is dissociative. The cation will dissociate into NO+ + Ofrom this state.
The vertical-up and vertical-down transitions have differenttransition energies by ∼3 eV because of a large mismatch inthe geometry of the ground and the two stable excited states.The up transitions are located in the UV while the down
transitions are in the visible. For the purpose of this discussion,we will be concerned with the down transitions only. Remark-ably, the transitions from the 1B2 and lower 1A2 states closelymatch the energies of the HEB and LEB, respectively. The 0.6eV separation between the states is also in agreement with theexperimental data. These findings provide the first supportingpoint for the identification of the nitronium ion as the emittingspecies.
Although the Franck-Condon principle does not strictly applyto chemical reactions, a similar constraint is expected. Thegeometry of the reactant will not change much during the instantwhen the excited state is formed. Hence, if the nuclear geometryof the transition state resembles the electronically excitedproduct rather than its ground state, it will favor entry into the
excited state.43 The ONO angle in the PETN nitro groups is∼130°.44,45 This value is very similar to the angles in theequilibrium geometry of both stable excited states of NO2
+ (seeTable 2). Although the molecular conformation and/or volumemay be different in the transition state relative to the groundstate, it is unlikely to significantly affect the ONO bond angle.5
In contrast, this value does not conform to the linear groundstate. Therefore, NO2
+ satisfies the geometric constraints forthe chemiluminescing species.
Furthermore, the emission band shifting (see Figure 11)observed in our experiments is also consistent with the expectedbehavior of NO2
+. Since the decomposition mechanism is likelyionic (see section IV D), the polarity of the medium will increaseas the decomposition progresses due to the formation of charged
and polar products. This will affect transition energies throughion-ion, ion-dipole, and dipole-dipole interactions. Since theground state of NO2
+ is linear, it has zero dipole moment. Incontrast, the excited states possess sizable dipole moments dueto the bent geometry. Thus, greater energy stabilization isexpected for the excited states than for the ground state. Thiswill manifest itself as a red shift of the corresponding transitions.
The transition bands are expected to maintain their separationbecause both states are very similar in terms of their geometry,dipole moment, and, therefore, energy stabilization.
Although there is no information available in the literatureabout the rate of interstate conversion in NO2
+, some conclu-sions about it can be reached from the data available for theisoelectronic molecule CO2. Chemiluminescence from CO2 hasbeen observed in several reactions, with the CO2 afterglow beingstudied the most. The emission spectrum of CO2 afterglowconsists of two bands located at ca. 400 and 525 nm.46 Thisindicates that two excited states contribute to the chemilumi-nescence and that the nonradiative crossing from the higherenergy excited state to the lower one is slow and cannot competewith the radiative transition to the ground state. Since the
electronic structures of each molecule are very similar, the sameshould be true for NO2+ as well.
These evaluations of the electronic structure, geometry, andproperties of the nitronium ion are consistent with the experi-mental data and have led us to conclude that NO 2
+ is thechemiluminescing species. Therefore, the nitronium ion isinferred as an intermediate in the decomposition process inshocked crystalline PETN.
D. Reaction Mechanism. Given the identification of anintermediate and the qualitative reaction scheme of Figure 14,we are now in a position to propose the reaction mechanism inshocked PETN. This mechanism is shown in Figure 16.
The dominant reaction of nitrate esters at ambient pressureis homolysis of the O-NO2 bond.47 Under high pressure, a
Figure 15. Electronic structure of NO2+. The ground state and three
lowest excited states are shown.
TABLE 2: Geometry, Vibrational Frequencies, and Energyof NO2
+ Excited States a
lower 1A21B2 higher 1A2
ON length, Å 1.161 1.163 1.161ONO angle, deg. 131.5 129.3 167.2vibrational frequencies, cm-1
ω1(B2) 775 627 1847ω2(A1) 794 810 1428ω3(A1) 1626 1627 870i
vertical-down transition, eV (nm) 2.35 (528) 2.98 (415)
a CIS/6-311+G(d,p) model chemistry
Figure 16. Proposed initiation mechanism in shocked PETN. Moredetails are given in the text.
254 J. Phys. Chem. B, Vol. 106, No. 2, 2002 Dreger et al.

8/3/2019 Zbigniew A. Dreger et al- Shock Wave Induced Decomposition Chemistry of Pentaerythritol Tetranitrate Single Cryst…
http://slidepdf.com/reader/full/zbigniew-a-dreger-et-al-shock-wave-induced-decomposition-chemistry-of-pentaerythritol 9/10
competing reaction mechanism emerges in which the first stepis the formation of a carbocation and the nitrate ion.48-50 ForPETN this is reaction 1 in Figure 16. Ionic reactions have atypical activation volume of ca. -20 cm3 /mol and, as such, theyare promoted by pressure while homolysis is retarded bypressure.51,52 The ascendancy of heterolysis over homolysis isgradual with the turning point around 0.5 GPa.48 Although thereare no direct data for PETN, it is reasonable to assume that itfollows the same pattern as other nitrate esters. Therefore, the
operative mechanism in PETN at stresses of ca. 5-10 GPa islikely to be ionic. Reaction 1 in the gas phase is endothermicby about 180 kcal/mol as estimated using AM1 semiempiricalcalculations. The amount of endothermicity is likely to bereduced significantly in a polar environment.5
Carbocation [1] is a primary carbocation. As such, it is proneto rearrangement to tertiary carbocation [2] via reaction 3 inFigure 16.53 Reaction 3 is exothermic by about 22 kcal/mol (asestimated using AM1). Further reactions of carbocations [1] and[2] are less certain. However, on the basis of our experimentalresults these reactions must yield NO2
+. A helpful considerationhere is the following reaction:
Cation [3] can be obtained via abstraction of the hydride ion,H-, from PETN. It is unstable (IRC calculation42) and eliminatesthe nitronium ion to produce [4], the trinitrate aldehydederivative of PETN. Both carbocations [1] and [2] can serve ashydride ion acceptors.53 However, because of the intrinsicinstability of [3], an abstraction step is likely to occur concur-rently, with reaction (A) as a bimolecular reaction providingtwo separate pathways to NO2
+, as shown in Figure 16 byreactions 2 and 4.
Reactions 2 + 5 and 4 + 6 are exothermic by ca. 38 and 25kcal/mol, respectively, (as estimated using AM1). To satisfy theenergy balance necessary to produce excited states of NO2
+,the transition state in these reactions must lie above the productsby at least 70 and 55 kcal/mol, respectively. The latter translatesinto an activation energy of ∼30 kcal/mol, which is veryreasonable for this type of reaction. The heats of reactions 2 +
5 and 4 + 6 are different by ∼13 kcal/mol or ∼0.6 eV. Thisvalue matches the energy separation between the emission bandsand explains the presence of two emission components. Theamount of energy in reaction 4 is sufficient only to populatethe lowest excited state of NO2
+. On the other hand, reaction 2
has an extra 0.6 eV available, which makes the next excitedstate accessible from the transition state (see also Figure 14).
As discussed in the preceding section, geometric constraints andslow interstate conversion will lead to emission from bothexcited states. Although the amount of NO2
+ in reacting PETNcannot be determined with certainty, it is reasonable to concludethat this strong electrophile known for its high reactivity mayplay an important role in the reaction growth and propagation.
Together with the results of section IV C, the scheme of Figure 16 provides an interpretation of the experimental resultspresented in this paper. This interpretation is self-consistent andis also consistent with the physical and chemical data availablein the literature. Combining all the experimental evidence andanalyses presented above, we conclude that the mechanismshown in Figure 16 best describes the decomposition processin shocked PETN crystals.
V. Summary
Time-resolved emission spectroscopy was used to examinethe decomposition mechanism in shocked PETN single crystals.PETN was shocked to peak stresses as high as 13 GPa usingstepwise loading. Emission spectra were measured for thincrystalline samples shocked along two different crystallographicdirections, [100] and [110].
Emission data were analyzed in conjunction with absorptiondata, due to the concurrent changes in the optical transmissionof PETN. The absorption data were acquired separately underthe same loading conditions. The raw emission data werecorrected analytically by assuming spatial uniformity of theemitting/absorbing species. The applicability of this assumptionwas tested and verified in separate experiments. Analysis of the corrected emission data reveals two bands in the spectra:the high-energy band (HEB) at ∼3.0 eV and the low-energyband (LEB) at ∼2.4 eV. Both the HEB and LEB are observedin every experiment regardless of stress or crystal orientation.However, their relative and absolute intensities and kineticsrevealed stress and orientation dependence.
The emission is identified as chemiluminescence from thenitronium ion, NO2
+, on the basis of the electronic structureand properties of NO2
+. Nitronium ion was analyzed using abinitio calculations, which revealed transition energies matchingthose of the emitting intermediate observed experimentally.Several chemical reactions compatible with the formation of NO2
+ were considered and evaluated. Finally, a four-stepchemical initiation mechanism in shocked crystalline PETN isproposed and discussed in detail.
Acknowledgment. Dr. J. M. Winey is thanked for sharinghis preliminary results on the equation of state of PETN. D.Savage and K. Zimmerman are thanked for their assistance inthe experimental effort. This work was supported mainly byONR grants N000149310369 and N000149911014, and in partby DOE grant DEFG0397SF21388.
Appendix
Emission intensity recorded from a radiating object can bemarkedly different from the intensity actually emitted if partsof the object can reabsorb the emitted radiation. In the one-dimensional case illustrated in Figure 17, the recorded emissionintensity, I R( λ,t ), can be expressed as follows:
Figure 17. One-dimensional model of the experimental geometry. X is the coordinate axis and x is an arbitrary location inside the sample.The sample occupies the region from x ) 0 to x ) d . The detector isplaced at infinity and I R( λ,t ) is the emission intensity recorded by thedetector as a function of wavelength, λ, and time, t . The dashed anddashed-dotted lines represent the distributions of the emitting andabsorbing species, N E( x, λ,t ) and R( x, λ,t ), respectively.
Shock Wave Induced Decomposition Chemistry of PETN J. Phys. Chem. B, Vol. 106, No. 2, 2002 255

8/3/2019 Zbigniew A. Dreger et al- Shock Wave Induced Decomposition Chemistry of Pentaerythritol Tetranitrate Single Cryst…
http://slidepdf.com/reader/full/zbigniew-a-dreger-et-al-shock-wave-induced-decomposition-chemistry-of-pentaerythritol 10/10
where C ( λ) is the spectral response of the detector; N E( x, λ,t ) isthe number of photons emitted per unit sample thickness; x isthe spatial coordinate in the direction of light propagation;
p( x, λ,t ) is the probability that a photon emitted from location xwill be received by the detector. The latter can be expressedthrough the absorption coefficient, R( x, λ,t ), as
Of physical interest, however, is the true emission intensity, I T( λ,t ), that is unaltered by reabsorption. It can be defined asfollows:
For arbitrary spatial distributions of the absorbing and emittingspecies, the system of eqs A1-A3 is convoluted and difficultto untangle. However, in the special case of uniform distribu-tions, N E( x, λ,t ) ) N E( λ,t ) and R( x, λ,t ) ) R( λ,t ), it can be easilyintegrated. The result of this integration is given by eq 1 in thetext.
References and Notes
(1) See proceedings of the First through EleVenth Symposia (Interna-tional) on Detonation; Office of Naval Research: Arlington, Virginia,1951-1998.
(2) Gupta, Y. M. J. Phys. IV, Colloque, 1995, 5, C4-345.(3) Dick, J. J. Appl. Phys. Lett. 1984, 44, 859.(4) Dick, J. J.; Mulford, R. N.; Spencer, W. J.; Pettit, D. R.; Garcia,
E.; Shaw, D. C. J. Appl. Phys. 1991, 70, 3572.(5) Gruzdkov, Y. A.; Gupta, Y. M. J. Phys. Chem. A 2000, 104, 11169.(6) Dick, J. J., J. Appl. Phys. 1997, 81, 601.(7) Tarver, M. C.; Breithaupt, R. D.; Kury, W. J. J. Appl. Phys. 1997,
81, 7193.(8) Yoo, C. S.; Holmes, N. C.; Souers, P. C.; Wu, C. J.; Ree, F. H.;
Dick, J. J. J. Appl. Phys. 2000, 88, 70.
(9) Halleck, P. M.; Wackerle, J. J. Appl. Phys. 1976, 47 , 976.(10) Craig, B. G. In LASL ExplosiVe Property Data; Gibbs, T. R.;Popolato, A., Eds.; University of California Press: Berkeley, 1980; pp 301,318.
(11) Soulard, L.; Bauer, F. In Shock Compression of Condensed Matter,1989; Schmidt, S. C., Johnson, J. N., Davison, L. W., Eds.; Elsevier:Amsterdam, 1990; p 817.
(12) Dick, J. J.; Ritchie, J. P. J. Appl. Phys. 1994, 76 , 2726.(13) Jindal, V. K.; Dlott, D. D. J. Appl. Phys. 1998, 83, 5203.(14) Spitzer, D.; Samirant, M. Tenth Symposium on Detonation; Office
of Naval Research: Arlington, VA, 1993; p 831.(15) Spitzer, D., Ph.D. Thesis, Universite Louis Pasteur de Strasbourg,
1993.(16) Dreger, Z. A.; Gruzdkov, Y. A.; Gupta, Y. M.; Dick, J. J. In Shock
Compression of Condensed Matter, 1999; Furnish, M. D., Chhabildas, L.C., Hixson, R. S., Eds.; AIP: New York, 2000; p 933.
(17) Dick, J. J. J. Appl. Phys. 1982, 53, 6161.(18) Fowles, G. R.; Duvall, G. E.; Asay, J.; Bellamy, P.; Feistmann, F.;
Grady, D.; Michaels, T.; Mitchell, R. ReV. Sci. Instrum. 1970, 41, 984.(19) Gupta, Y. M. COPS code; Stanford Research Institute: Menlo Park,CA, 1976, unpublished.
(20) The a-axis sapphire used in this work has shown to have an elasticresponse nearly identical to that for the c-axis sapphire. The latter has beenexamined in Barker, L. M.; Hollenbach, R. E. J. Appl. Phys. 1970, 41,4208.
(21) Carter, W. J. High Temp. - High Press. 1973, 5, 313.(22) Winey, J. M., personal communication.(23) Gruzdkov, Y. A.; Gupta, Y. M.; Dick, J. J. In Shock Compression
of Condensed Matter, 1999; Furnish, M. D., Chhabildas, L. C., Hixson, R.S., Eds.; AIP: New York, 2000; p 929.
(24) Winey, J. M.; Gupta, Y. M. J. Phys. Chem. A 1997, 101, 9333.(25) Gruzdkov, Y. A.; Gupta, Y. M. J. Phys. Chem. A 1998, 102, 2322.(26) Constantinou, C. P.; Winey, J. M.; Gupta, Y. M. J. Phys. Chem.
1994, 98, 7767.(27) Jones, S. C.; Gupta, Y. M. J. Appl. Phys. 2000, 88, 5671.(28) Mullen, P. A.; Orloff, M. K. J. Phys. Chem. 1973, 77 , 910.(29) Kunz, A. B. Mater. Res. Soc. Symp. Proc. 1996, 418, 287.(30) Since in our experiments collection of light takes place from a small
solid angle (<0.13 sr), the one-dimensional approximation employed issufficiently accurate. The analysis presented can be easily adapted to anyarbitrary direction.
(31) Mader, C. L. Numerical Modeling of Detonation; University of California Press: Berkeley, 1970; p 48.
(32) Dreger, Z. A.; Gupta, Y. M.; White, J. O.; Drickamer, H. G.,unpublished results.
(33) Cheret, R. Detonation of Condensed ExplosiVes; Springer-Verlag:New York, 1993.
(34) Gundermann, K. D.; McCapara, F. Chemiluminescence in OrganicChemistry; Springer-Verlag: Berlin, 1987.
(35) Hsu, D. K.; Monts, D. L.; Zare, R. N. Spectral Atlas of Nitrogen Dioxide 5530 to 6480 Å; Academic Press: New York, 1978.
(36) Gillespie, G. D.; Khan, A. U.; Wahl, A. C.; Hosteny, R. P.; Krauss,M. J. Chem. Phys. 1975, 63, 3425.
(37) Gillespie, G. D.; Khan, A. U. J. Chem. Phys. 1976, 65, 1624.(38) Frosch, R. P.; Robinson, G. W. J. Chem. Phys. 1964, 41, 367.(39) Bryant, G.; Jiang, Y.; Grant, E. Chem. Phys. Lett. 1992, 200, 495.(40) Lee, T. J. Chem. Phys. Lett. 1992, 188, 154.(41) Lee, T. J.; Rice, J. E. J. Phys. Chem. 1992, 96 , 650.(42) Frisch, M. J.; Trucks, G. W.; Schlegel, H. B.; Scuseria, G. E.; Robb,
M. A.; Cheeseman, J. R.; Zakrzewski, V. G.; Montgomery, J. A., Jr.;Stratmann, R. E.; Burant, J. C.; Dapprich, S.; Millam, J. M.; Daniels, A.D.; Kudin, K. N.; Strain, M. C.; Farkas, O.; Tomasi, J.; Barone, V.; Cossi,M.; Cammi, R.; Mennucci, B.; Pomelli, C.; Adamo, C.; Clifford, S.;Ochterski, J.; Petersson, G. A.; Ayala, P. Y.; Cui, Q.; Morokuma, K.; Malick,D. K.; Rabuck, A. D.; Raghavachari, K.; Foresman, J. B.; Cioslowski, J.;Ortiz, J. V.; Baboul, A. G.; Stefanov, B. B.; Liu, G.; Liashenko, A.; Piskorz,P.; Komaromi, I.; Gomperts, R.; Martin, R. L.; Fox, D. J.; Keith, T.; Al-Laham, M. A.; Peng, C. Y.; Nanayakkara, A.; Gonzalez, C.; Challacombe,
M.; Gill, P. M. W.; Johnson, B.; Chen, W.; Wong, M. W.; Andres, J. L.;Gonzalez, C., Head-Gordon, M.; Replogle, E. S.; Pople, J. A. Gaussian98, ReVision A.7 , Gaussian, Inc.: Pittsburgh, PA, 1998.
(43) Rauhut, M. M. Acc. Chem. Res. 1969, 2, 80.(44) Cady, H. H.; Larson, A. C. Acta Crystallogr. B 1975, 31, 1864.(45) Gruzdkov, Y. A.; Gupta, Y. M. J. Phys. Chem. A 2001, 105, 6197.(46) Gundermann, K. D.; McCapra, F. Chemiluminescence in Organic
Chemistry; Springer-Verlag: Berlin, 1987; p 75.(47) Hiskey, M. A.; Brower, K. R.; Oxley, J. C. J. Phys. Chem. 1991,
95, 3955.(48) Naud, D. L.; Brower, K. R. J. Org. Chem. 1992, 57 , 3303.(49) Davis, L. L.; Brower, K. R. J. Phys. Chem. 1996, 100, 18775.(50) Davis, L. L. Reactions of Organic Compounds in ExplosiVe-DriVen
Shock WaVes; Ph.D. Dissertation, New Mexico Institute of Mining andTechnology, 1996.
(51) Asano, T.; le Noble, W. J. Chem. ReV. 1978, 78, 407.(52) Klarner, F. G.; Diedrich, M. K.; Wigger, A. E. In Chemistry under
Extreme or Non-Classical Conditions; van Eldik, R., Hubbard, C. D., Eds.;
Wiley: New York, 1997; p 103.(53) Morrison, R. T.; Boyd, R. N. Organic Chemistry, 5th ed.; Allynand Bacon: Boston, 1987; Chapters 5, 6, and 7.
I R( λ,t ) ) C ( λ)∫0
d N E( x, λ,t ) p( x, λ,t ) d x (A1)
ln p( x, λ,t ) )-∫ xd R( x′, λ,t ) d x′ (A2)
I T( λ,t ) )∫0
d N E( x, λ,t ) d x (A3)
256 J. Phys. Chem. B, Vol. 106, No. 2, 2002 Dreger et al.

![excitation Zijun Yu and Elliot R. Bernstein …sites.chem.colostate.edu/bernsteinlab/239.pdf · Decomposition of pentaerythritol tetranitrate [C(CH2ONO2)4] following electronic excitation](https://static.fdocuments.in/doc/165x107/5b6445627f8b9a6c178d1f15/excitation-zijun-yu-and-elliot-r-bernstein-siteschem-decomposition-of-pentaerythritol.jpg)


![excitation Zijun Yu and Elliot R. Bernstein Decomposition ... · THE JOURNAL OF CHEMICAL PHYSICS 135, 154305 (2011) Decomposition of pentaerythritol tetranitrate [C(CH 2ONO 2) 4]](https://static.fdocuments.in/doc/165x107/5e787db4b732f263ad767ab0/excitation-zijun-yu-and-elliot-r-bernstein-decomposition-the-journal-of-chemical.jpg)