Zamira Noh, Paul Goddard, Patrick Hylton & Adrian Parke
31
Zamira Noh, Paul Goddard, Patrick Hylton & Adrian Parke School of Psychology ICAP2015 Tokyo, Japan
Transcript of Zamira Noh, Paul Goddard, Patrick Hylton & Adrian Parke

Zamira Noh, Paul Goddard, Patrick Hylton & Adrian Parke
School of Psychology
ICAP2015 Tokyo, Japan
Presenter
Presentation Notes
Introduce myself – name, year, from (origin & Uni)

Gift economy: Neighbour effect
in giving
Presenter
Presentation Notes
Read the title..

What is the ‘neighbour effect’?
Demonstrating the ‘neighbour effect’.
Testing the ‘neighbour effect’.
‘Neighbour effect’ in giving.
Presenter
Presentation Notes
Talk about the outlines for today’s talk… What is the neighbour effect? – I’m going to explain what is the neighbour effect Demonstrating the neighbour effect – explaining the demonstration of NE in the WL Testing the neighbour effect – explaining the NE testing with a lecture study NE in giving…how it relates…. Before that……I would like to explain what is the NE…

What is the ‘neighbour effect’?
Presenter
Presentation Notes
What is NE? Imagine that someone name Bob, your neighbour…keep on throwing paper rolls almost everyday to your yard or garden? It’s pretty much annoying right? Such as this scenario…Mrs Bear found Bob throwing the paper rolls again! Bob family can’t find him… But his neighbour do…. ^^ So this is the ‘Neighbour effect’ which we’ve found in our preliminary study…we tend to avoid doing something nasty towards someone who is close or near to us! Because upsetting neighbour is RISKY! Yet, to observe or to conduct experiment where people are ask to do something bad or nasty towards other people is quite hard.. A classic example, the Milgram obedient to authority experiment…where 100% of the participants willing to give the electric shock to the other person just because they received an order from an authority figure….nowadays, it is quite hard for us even to pass through a research ethics committee! However….we have found a way to study this behaviour…. It comes from a rather unlikely source… a TV game show! Why TV game show??

……… game show provides an ideal laboratory to study human decision-making. The rules are well-defined and the stakes are high, something that is not easy to replicate elsewhere (Barmish & Boston 2009)
(Haigh, 2002; Levitt, 2004; Antonovics et al, 2005; Barmish & Boston, 2009, Raghubir & Valenzuela, 2010; Goddard, Hylton, Parke & Noh, 2013).
Demonstrating the ‘neighbour effect’…cont’
Presenter
Presentation Notes
According to a research by Barmish & Boston….game shows…. (read the text).. So, we’re not the only one has used game shows as the observational field studies…. In a particular… I’ve used the weakest link tv game show… it is a British TV game show, aired more than a decade and has been replicated around the world… So, how’s the games work and what are the rules? The following slide shown the illustration of the game format…

Demonstrating the ‘neighbour effect’…cont’
I am the strongest link!
Mwa Ha ha haa
Presenter
Presentation Notes
In the WL, there will be 9 contestants…standing in a semi-circle format in front of the game master…..

Question Bank
t
Chain
Chain
I am the strongest link!
Mwa Ha ha haa
Demonstrating the ‘neighbour effect’…cont’
Presenter
Presentation Notes
All the contestants need to take turn answering questions…to create a chain with correct answers…within the specific time in each round to increase the money pot… For example, in the first round…the objective is to increase the money pot up to £1,000 , approximately 187k Yen The chain may break or not until the times up…. Each round, contestants have to make a choice to vote SOMEONE as the WEAKEST LINK!

Question Bank Vote
t
Chain
Chain
I am the strongest link!
Mwa Ha ha haa
151 episodes
Demonstrating the ‘neighbour effect’…cont’
Presenter
Presentation Notes
For my study, I have observed 151 episodes for the first round….. When each of the contestant cast a vote and the most received vote will be considered as the weakest link! Our hypothesis is, when the contestants were asked to vote the weakest link, they will avoid their nearest neighbour! So, what we did….

Question Bank Vote
t
Chain
Chain
I am the strongest link!
Mwa Ha ha haa
151 episodes
Demonstrating the ‘neighbour effect’…cont’
Presenter
Presentation Notes
First, we calculated the expected frequency – we use a simple probability calculation and calculate the chances of each contestant to vote their direct neighbour.. (give example of Sailormoon & Kenny) Then followed by the chances they vote at least 2, 3 spaces away from them….and last…..the chances they vote for a contestant who are 8 spaces away from them (give example of Sailormoon & Naruto)

Question Bank Vote
t
Chain
Chain
I am the strongest link!
Mwa Ha ha haa
151 episodes
Demonstrating the ‘neighbour effect’…cont’
+ +
+ + + + + +
Presenter
Presentation Notes
We then… add up the probability they vote based on the space and we come out with the expected frequency voting pattern.. For example……. For each DIRECT neighbour, we add it up and its sum as 2. (click) Then, we times it with 151 observed episodes (click)…..to calculate the ‘expected’ frequency…for direct neighbour (1 space away).. Then, for the observed frequency, we count each of the vote the contestants made 1 space, 2 spaces away and so on..until 8 spaces away… …and the next slide shows what happened

0
50
100
150
200
250
300
350
n n1 n2 n3 n4 n5 n6 n7
Vote
freq
uenc
y
Spatial position
Expected and Observed Frequencies 𝞆2(7) = 48.22, p<0.0001
Exp (+wl)obs (+wl)
Demonstrating the ‘neighbour effect’…cont’
Presenter
Presentation Notes
The graph is plotted based on the voting frequencies over the spatial position (space/distance between the contestant). Y-axis is the vote frequencies from 151 episodes x 9 contestants votes. X-axis is the spatial position which shows the space/distance the contestant from each other…1 space…2 spaces..3 spaces..and so on… n is a neighbour… (explain n=1 space away, n1= 2 spaces away on so on…)

0
50
100
150
200
250
300
350
n n1 n2 n3 n4 n5 n6 n7
Vote
freq
uenc
y
Spatial position
Expected and Observed Frequencies 𝞆2(7) = 48.22, p<0.0001
Exp (+wl)obs (+wl)
Demonstrating the ‘neighbour effect’…cont’
Presenter
Presentation Notes
Red line is the calculated expected frequency (2x151 – for every direct neighbour and 0.25x151 – for Sailormoon & Naruto – 8 spaces away from each other) , as discussed earlier…..it was my null hypothesis, and its calculated purely due to chance… using a simple probability theory…. ….while the green line is the observed frequency, the observed votes counts where the actual votes were counted in 151 episodes…from 9 contestants..

0
50
100
150
200
250
300
350
n n1 n2 n3 n4 n5 n6 n7
Vote
freq
uenc
y
Spatial position
Expected and Observed Frequencies 𝞆2(7) = 48.22, p<0.0001
Exp (+wl)obs (+wl)
Demonstrating the ‘neighbour effect’…cont’
Presenter
Presentation Notes
From the graph, we have observed that, for a neighbour with a space away from each other (direct neighbour), there is a significant drop from our expected frequency of voting a direct neighbour! So, all the contestants were avoiding their direct neighbour. Why? What does it means?
Demonstrating the ‘neighbour effect’…cont’
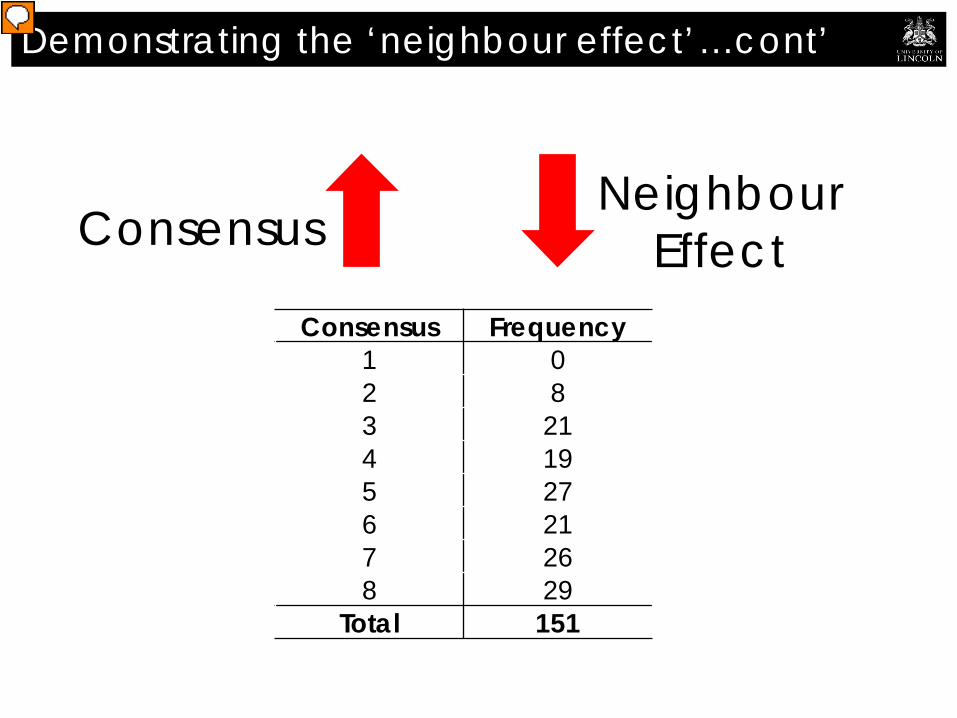
Consensus Neighbour
Effect Consensus Frequency
1 0 2 8 3 21 4 19 5 27 6 21 7 26 8 29
Total 151
Presenter
Presentation Notes
we have come to the 2nd prediction that…. The higher the consensus…it will decrease the ‘neighbour effect’… The data derived from 151 episodes which each voting consensus recorded…. With 8 consensus (where the explicit level is high) where majority of the contestants vote for the WL, we know that the NE is low… However, when the explicit level is lower than the implicit level, the NE is stronger! The next slide shows how the proximity effect of each as a function of consensus… Give example…..(if in one round…1 person has a wrong answer..while the rest have a correct asnwer….therefore…all the contestants has high consensus who to vote out as the WL)

Demonstrating the ‘neighbour effect’…cont’
0
5
10
15
20
25
30
35
40
0 2 4 6 8 10
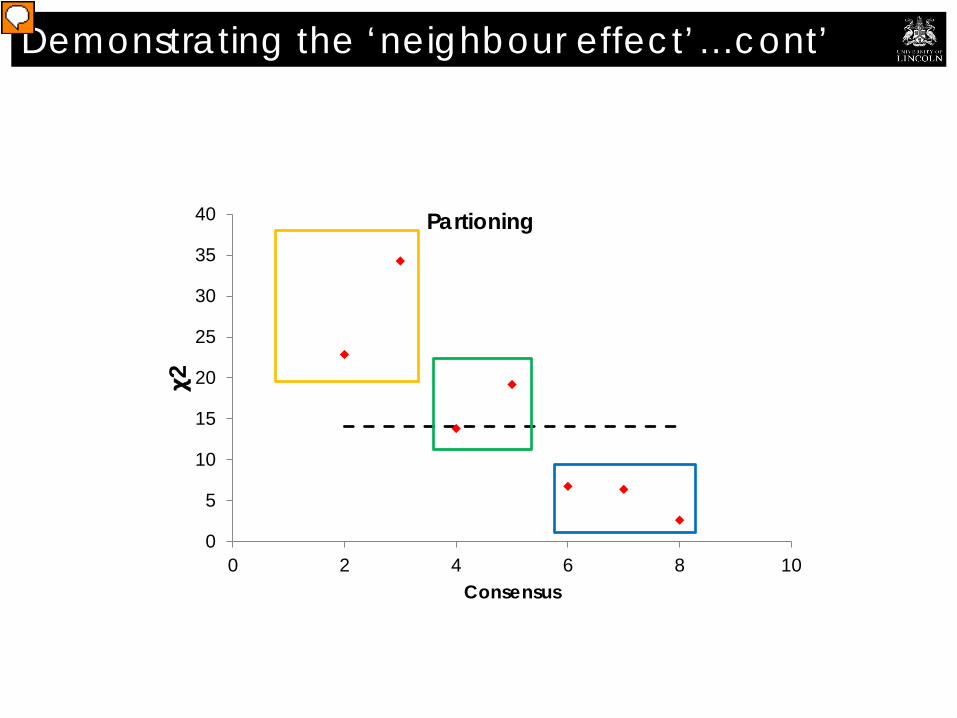
𝞆2
Consensus
Partioning
Presenter
Presentation Notes
Higher consensus will decrease the ‘neighbour effect’ Divided into 3 level of consensus…
Demonstrating the ‘neighbour effect’…cont’
0
5
10
15
20
25
30
35
40
0 2 4 6 8 10
𝞆2
Consensus
Partioning
Presenter
Presentation Notes
Consensus 2 and 3 are the low consensus, Consensus 4,5 and 6 are the medium consensus While 7 and 8 are the high consensus… From the line, I have calculated the expected and observe frequencies by taking consideration with or without the WL. The chi square values for the proximity effect with the highest consensus episodes are gradually removed.

Demonstrating the ‘neighbour effect’
Does it’s only exist in an exclusive environment such as the TV game show?
If the implicit information is higher, would the neighbour effect still exist?
Presenter
Presentation Notes
…..one explanation is contestant’s voting was based on 2 sources of information; …..game specific & primary source of information – explicit & observable during the round. ……As such, the higher the information integrity, higher consensus over the WL. …….Yet, when the game specific information is lower, contestants directed to rely on the secondary source of information – implicit & private ……the process believe is based on the system 1 thinking which is effortless, fast, unconscious & trigger the emotions… However….. (read the slides..)… Therefore to test this……..

Testing the ‘neighbour effect’…cont’
n5 n4 n3 n2 n1 V n1 n2 n3 n4 n5
Presenter
Presentation Notes
Therefore, we conducted a lecture study with 233 participants……the first year psychology students during their orientation lecture, first week after they just arrived to the Uni….they were distributed to sit in 3 blocks of seating comprising seven rows. Their seats were randomly assigned in a lecture theatre….

Testing the ‘neighbour effect’…cont’
n5 n4 n3 n2 n1 V n1 n2 n3 n4 n5
Presenter
Presentation Notes
Again….we calculated the expected frequencies by using simple probability theory… Such in this case….in the middle position….the direct neighbour for Chopper is Bart & Yugi. Therefore, Chopper has 1/5 chances to vote for his neighbour….and all the chances for everyone is calculated based on 1 space, 2 spaces, 3 spaces and so on….

Testing the ‘neighbour effect’…cont’
n5 n4 n3 n2 n1 V n1 n2 n3 n4 n5
Presenter
Presentation Notes
Next, instead of voting someone publicly….we would like to test if the ‘voting activity’ perform in close and private. In the instruction sheet, we asked the participants to participate in a voting activity…..

Testing the ‘neighbour effect’…cont’
n5 n4 n3 n2 n1 V n1 n2 n3 n4 n5
Presenter
Presentation Notes
A response sheet served as a ballot paper….for this experiment, instead of only testing a negative vote (as in the WL scenario) we have asked the participants to do negative (nasty votes) & added with a positive (nice votes) to anyone who sit at the same block and same row with them…. Prior to vote, each and everyone has to first identified their seat number and in the response sheet, they need to mark X at the seating plan when they cast the vote. The next slide shows what happened…

0
2
4
6
8
10
12
14
16
18
20
n n1 n2 n3 n4 n5 n6 n7 n8 n9 n10 n11 n12 n13 n14
Vote
Fre
quen
cy
‘Voter-candidate’ spatial distance
Negative Voting 𝞆2 (10) =34.11 p < 0.001
exp nastyobs nasty
Testing the ‘neighbour effect’…cont’
Presenter
Presentation Notes
We’ve plotted the graph…vote frequency over the voter-candidate spatial distance… Red line is the expected negative voting frequencies…. Purple line is the observed negative voting frequencies….

0
2
4
6
8
10
12
14
16
18
20
n n1 n2 n3 n4 n5 n6 n7 n8 n9 n10 n11 n12 n13 n14
Vote
Fre
quen
cy
‘Voter-candidate’ spatial distance
Negative Voting 𝞆2 (10) =34.11 p < 0.001
exp nastyobs nasty
Testing the ‘neighbour effect’…cont’
Presenter
Presentation Notes
Notice that there is a significant drop from the expected to observe frequencies…….which has confirm that the ‘NE’ is not only exists in an exclusive atmosphere such as a TV game show! Next, when we ask the participants to cast a nice vote (positive vote)….. The next slide shows what happened…

0
2
4
6
8
10
12
14
16
18
20
n n1 n2 n3 n4 n5 n6 n7 n8 n9 n10 n11 n12 n13 n14
Vote
freq
uenc
y
‘Voter-candidate’ spatial distance
Positive Voting x2 (10) =15.21 p < 0.001
exp niceobs nice
Testing the ‘neighbour effect’
Presenter
Presentation Notes
Plotted the graph vote frequency over spatial distance….. Orange line indicate the expected frequency for positive vote… While blue line indicate the observe frequency when participants were asked to cast the positive vote!

0
2
4
6
8
10
12
14
16
18
20
n n1 n2 n3 n4 n5 n6 n7 n8 n9 n10 n11 n12 n13 n14
Vote
freq
uenc
y
‘Voter-candidate’ spatial distance
Positive Voting x2 (10) =15.21 p < 0.001
exp niceobs nice
Testing the ‘neighbour effect’
Presenter
Presentation Notes
Notice that, a reverse polarity was found when the votes carried a positive consequences!

‘Neighbour effect’ in giving…cont’
0
2
4
6
8
10
12
14
16
18
20
n n1 n2 n3 n4 n5 n6 n7 n8 n9 n10 n11 n12 n13
Vote
Fre
quen
cy
'Voter-candidate' spatial distance
Obs - Positive
Obs - Negative
Presenter
Presentation Notes
I’ve plotted the negative and positive observed frequency in this graph….

‘Neighbour effect’ in giving…cont’
0
2
4
6
8
10
12
14
16
18
20
n n1 n2 n3 n4 n5 n6 n7 n8 n9 n10 n11 n12 n13
Vote
Fre
quen
cy
'Voter-candidate' spatial distance
Obs - Positive
Obs - Negative
Presenter
Presentation Notes
As you can see….there is a distinct pattern when the valence of the votes carried different consequences! We believe that the participants are applying the do-no-harm principle by Baron, 1995 for the nearest neighbour… Besides, the were significantly ‘fair’ in –ve valence compare to +ve valence (Leliveld et al, 2009)… What is the implication or what does it shows to us?

‘Neighbour effect’ in giving
Pay it forward
Presenter
Presentation Notes
Does anyone remember the Pay it forward movie in year 2000? A young boy name Trevor plan to organise a charitable programme which he named it ‘Pay it forward’. the idea is to help someone without expecting any favour in return….. This is applied when we conducted the positive (nice) voting where the recipients of the votes were expected to earn the chances to receive course materials without the recipients aware that someone close to them willing to give the chances to them (remember…it was a close and private voting!)….an act of altruism…. Hence…..

3 things to remember!
NEIGHBOUR EFFECT exists as a strategic bias in decision making probably operating at unconscious, implicit level…. Validation with lecture study has proven that the ‘Neighbour Effect’ is NOT AN ARTIFACT which exist in a game show.
‘Neighbour Effect’ in a positive environment exists as an indication of ALTRUISM!
Presenter
Presentation Notes
There are three things I would like you to remember today… ‘Neighbour effect’ exists as a strategic bias in decision making, which probably operating at unconscious, implicit level… The lecture study has validated that ‘neighbour effect’ is not an artifact of a game show! NE in a positive environment exists as an indication of altruism!

Noh, Z., Goddard P., Hylton, P., & Parke, A. (2014). Voting bias: Switches in the neighbour effect as a function of vote valency. In: ICAP/IAREP, Paris, France. Goddard, P., Hylton P., Parke, A., & Noh, Z. (2013). Tit-for-tat voting by contestants in the TV game show “The Weakest Link”. In: SABE-IAREP-ICABEEP, Atlanta, United States of America.
References
Presenter
Presentation Notes
List of references

ありがとう