
Zachary Tofias: Cities Acting Together on Climate Change
37
C40 SUSTAINABLE COMMUNITIES INITIATIVE OPPORTUNITIES IN SUSTAINABLE DEVELOPMENT Zachary Tofias, C40 Cities Head Sustainable Communities Initiative
-
Upload
sitra-ekologinen-kestaevyys -
Category
Environment
-
view
287 -
download
3
Transcript of Zachary Tofias: Cities Acting Together on Climate Change
C40 SUSTAINABLE COMMUNITIES INITIATIVE
OPPORTUNITIES IN SUSTAINABLEDEVELOPMENT
Zachary Tofias, C40 CitiesHead Sustainable Communities Initiative

2
WHY CITIES
Cities are part of the problem
468 cities will contribute
60% of global GDP &
50% Co2 growth by 203020%
50%
60%
New Climate Economy Cities
Population
GDP ($US)
C02 Emissions
Contribution to Global Growth
3
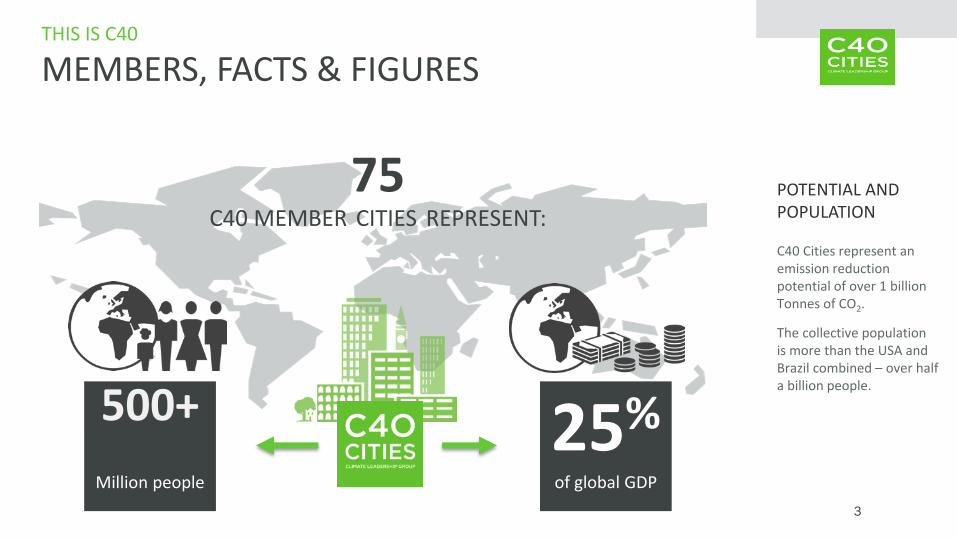
THIS IS C40
MEMBERS, FACTS & FIGURES
POTENTIAL AND POPULATION
C40 Cities represent an emission reduction potential of over 1 billion Tonnes of CO2.
The collective populationis more than the USA and Brazil combined – over half a billion people.
500+
Million people
75C40 MEMBER CITIES REPRESENT:
25%of global GDP
4
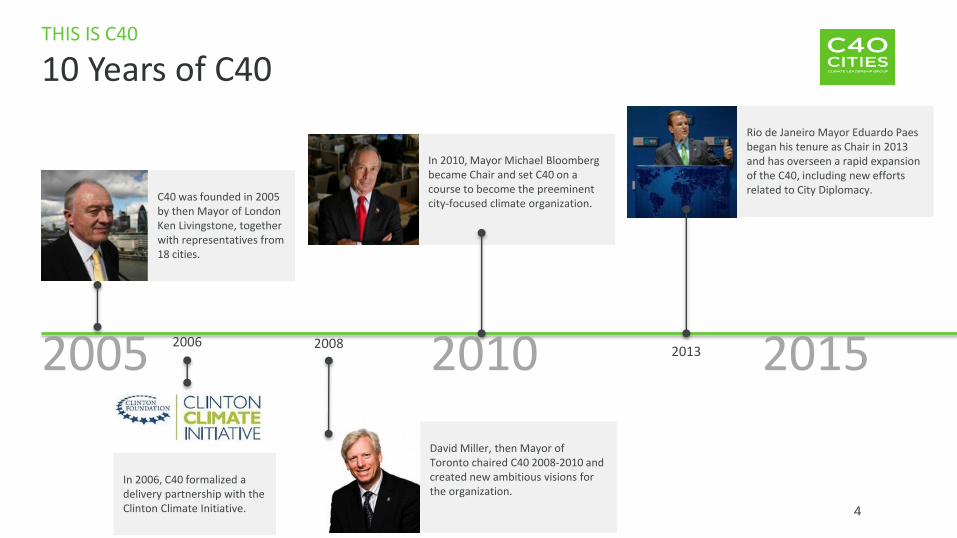
THIS IS C40
10 Years of C40
2005 20152010
C40 was founded in 2005by then Mayor of LondonKen Livingstone, together with representatives from18 cities.
In 2010, Mayor Michael Bloomberg became Chair and set C40 on a course to become the preeminent city-focused climate organization.
Rio de Janeiro Mayor Eduardo Paesbegan his tenure as Chair in 2013 and has overseen a rapid expansion of the C40, including new efforts related to City Diplomacy.
2013
David Miller, then Mayor ofToronto chaired C40 2008-2010 and created new ambitious visions for the organization.
20082006
In 2006, C40 formalized a delivery partnership with the Clinton Climate Initiative.
C40: DELIVERING OUTCOMES THROUGH TARGETED INITIATIVES
5
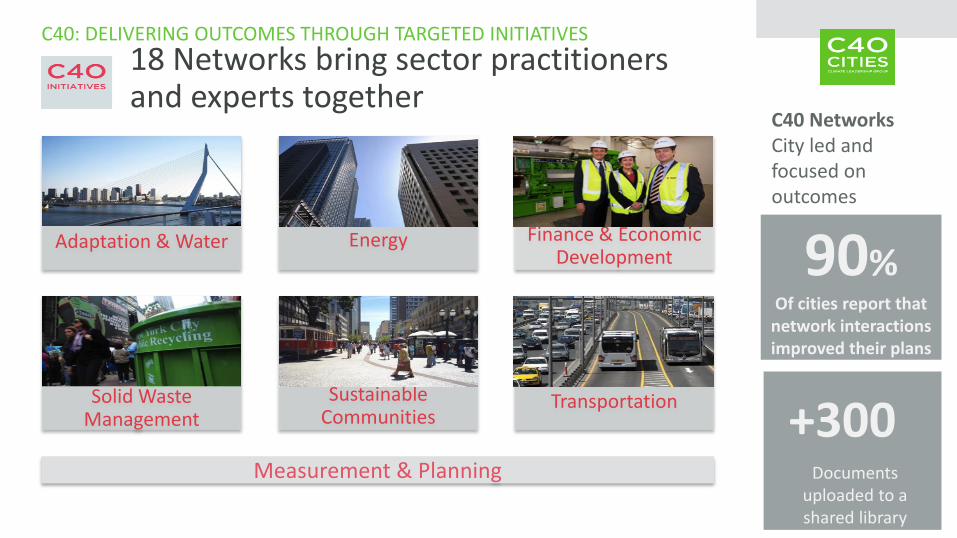
C40 NetworksCity led and focused on outcomes
18 Networks bring sector practitioners and experts together
90%Of cities report that
network interactions improved their plans
+300Documents
uploaded to ashared library
Adaptation & Water Energy Finance & Economic Development
Solid Waste Management
Sustainable Communities
Transportation
Measurement & Planning
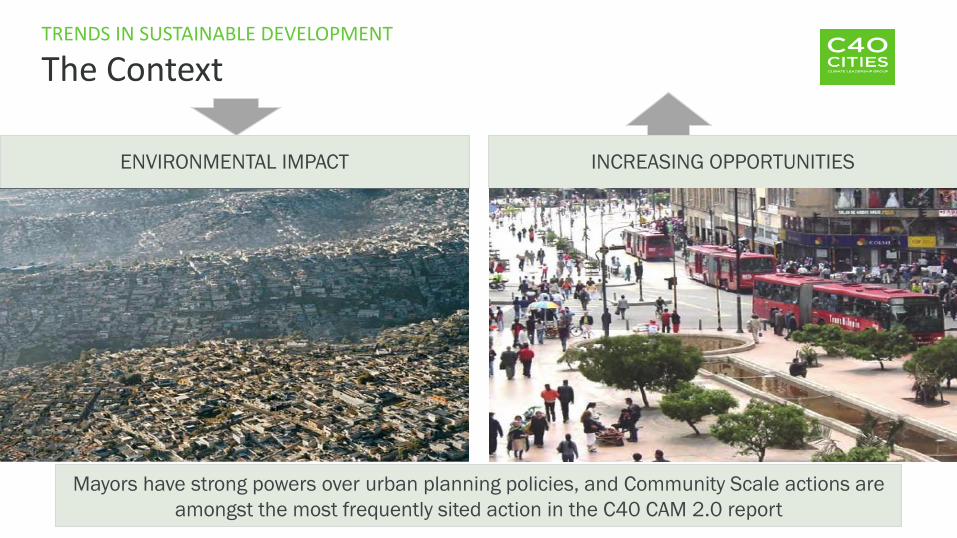
TRENDS IN SUSTAINABLE DEVELOPMENT
The Context
Mayors have strong powers over urban planning policies, and Community Scale actions are
amongst the most frequently sited action in the C40 CAM 2.0 report
ENVIRONMENTAL IMPACT INCREASING OPPORTUNITIES
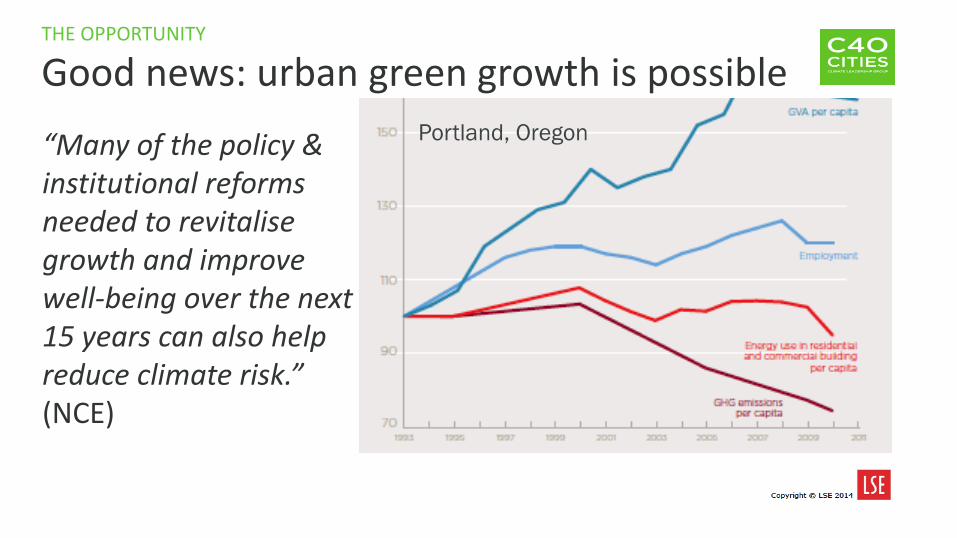
THE OPPORTUNITY
Good news: urban green growth is possible
“Many of the policy & institutional reforms needed to revitalisegrowth and improve well-being over the next 15 years can also help reduce climate risk.” (NCE)
Portland, Oregon
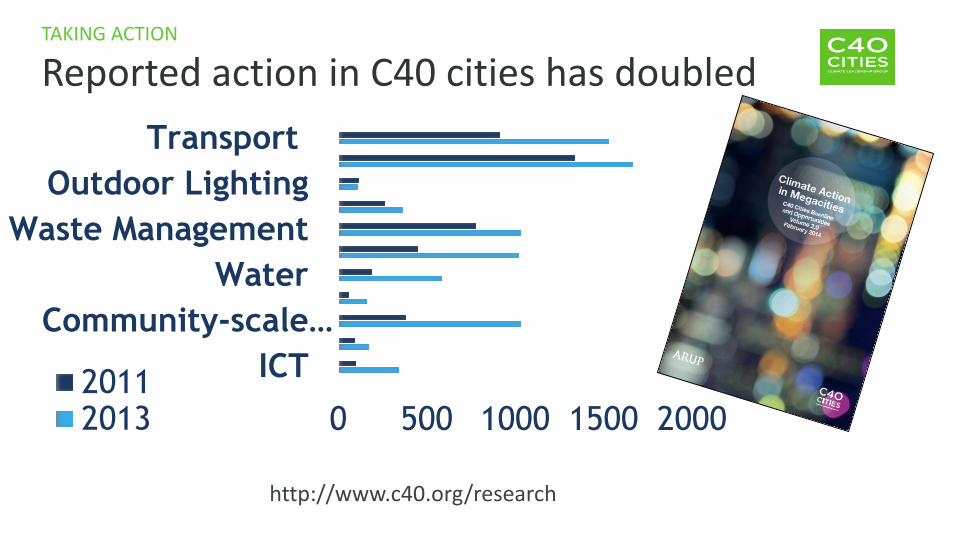
TAKING ACTION
Reported action in C40 cities has doubled
0 500 1000 1500 2000
Transport
Outdoor Lighting
Waste Management
Water
Community-scale…
ICT20112013
http://www.c40.org/research
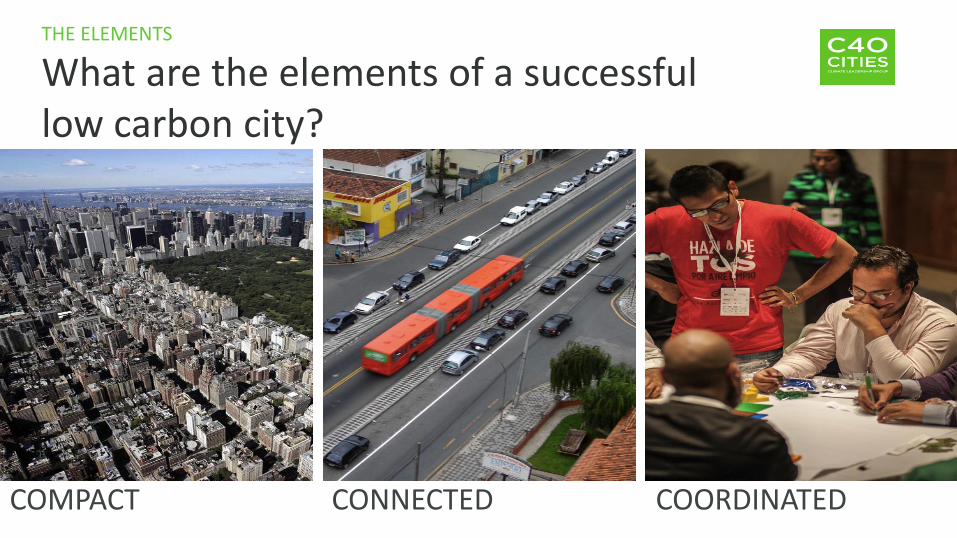
THE ELEMENTS
What are the elements of a successfullow carbon city?
COMPACT CONNECTED COORDINATED
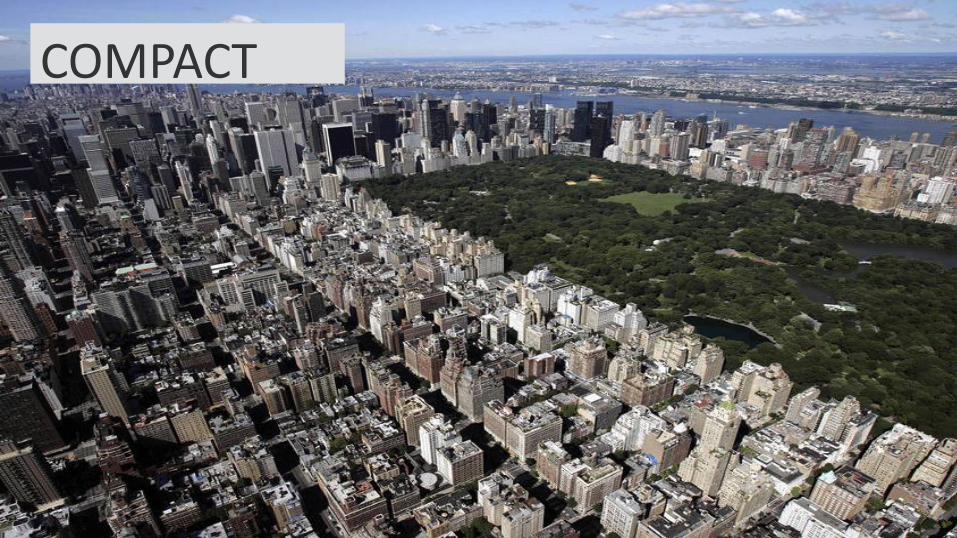
COMPACT
COMPACT
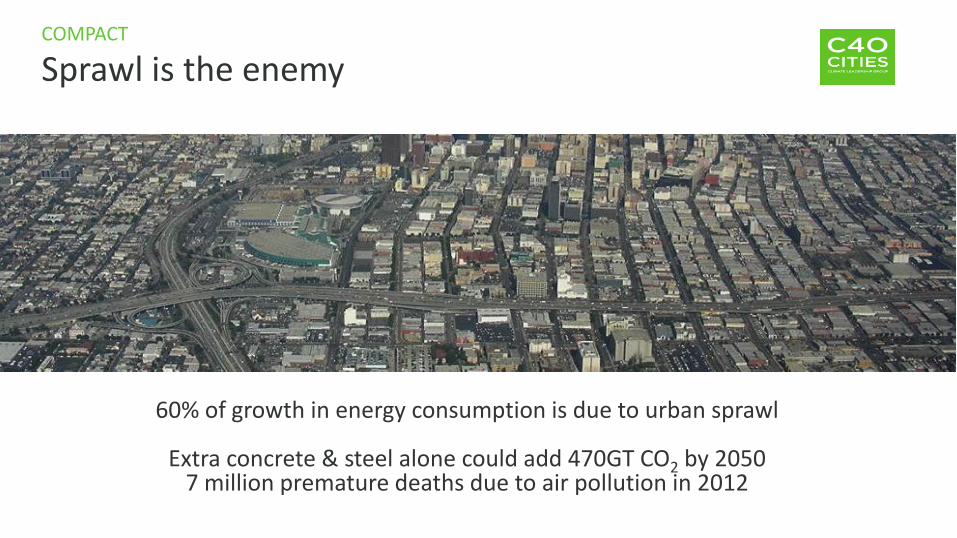
Sprawl is the enemy
60% of growth in energy consumption is due to urban sprawl
Extra concrete & steel alone could add 470GT CO2 by 20507 million premature deaths due to air pollution in 2012
12
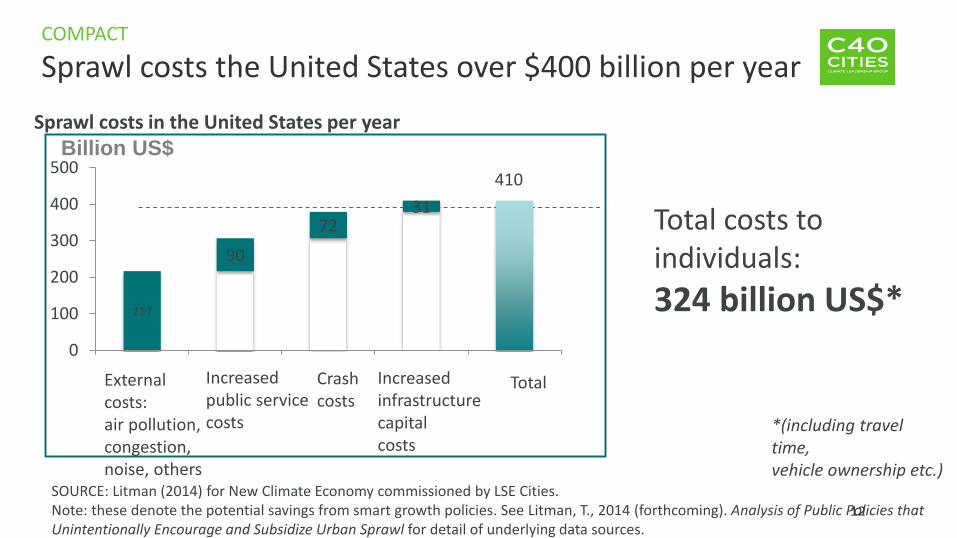
COMPACT
Sprawl costs the United States over $400 billion per year
Sprawl costs in the United States per year
SOURCE: Litman (2014) for New Climate Economy commissioned by LSE Cities. Note: these denote the potential savings from smart growth policies. See Litman, T., 2014 (forthcoming). Analysis of Public Policies that Unintentionally Encourage and Subsidize Urban Sprawl for detail of underlying data sources.
Total
Billion US$
External costs:air pollution,congestion,noise, others
217
90
7231
0
100
200
300
400
500
Increased public service costs
Crash costs
Increased infrastructurecapital costs
Total costs to individuals:
324 billion US$*
410
*(including travel time, vehicle ownership etc.)
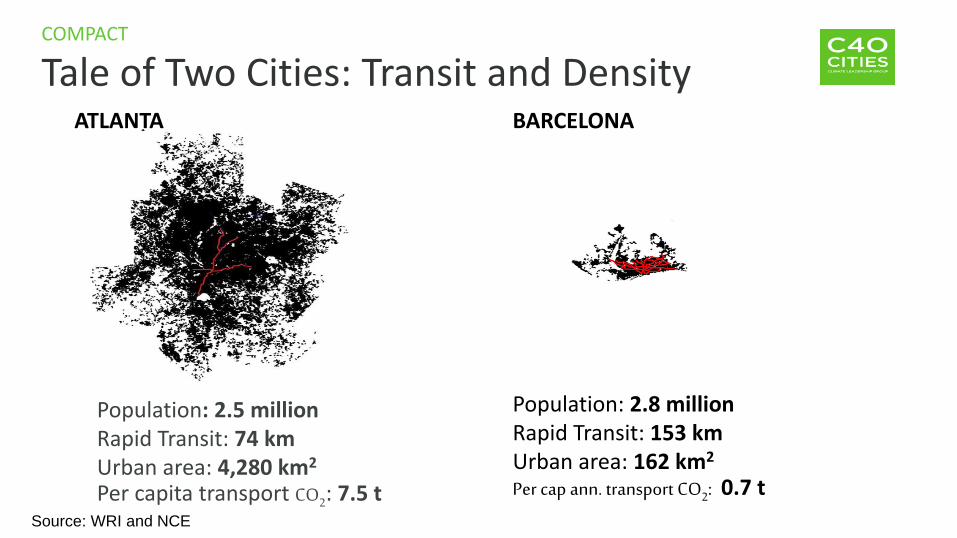
COMPACT
Tale of Two Cities: Transit and Density
Source: WRI and NCE
Population: 2.5 millionRapid Transit: 74 kmUrban area: 4,280 km2
Per capita transport CO2: 7.5 t
Population: 2.8 millionRapid Transit: 153 kmUrban area: 162 km2
Per cap ann. transport CO2: 0.7 t
ATLANTA BARCELONA
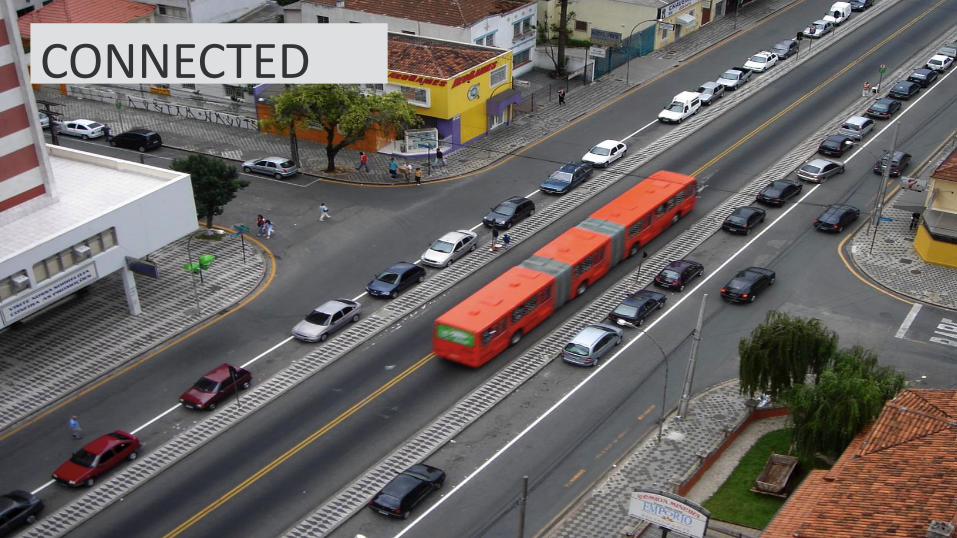
CONNECTED
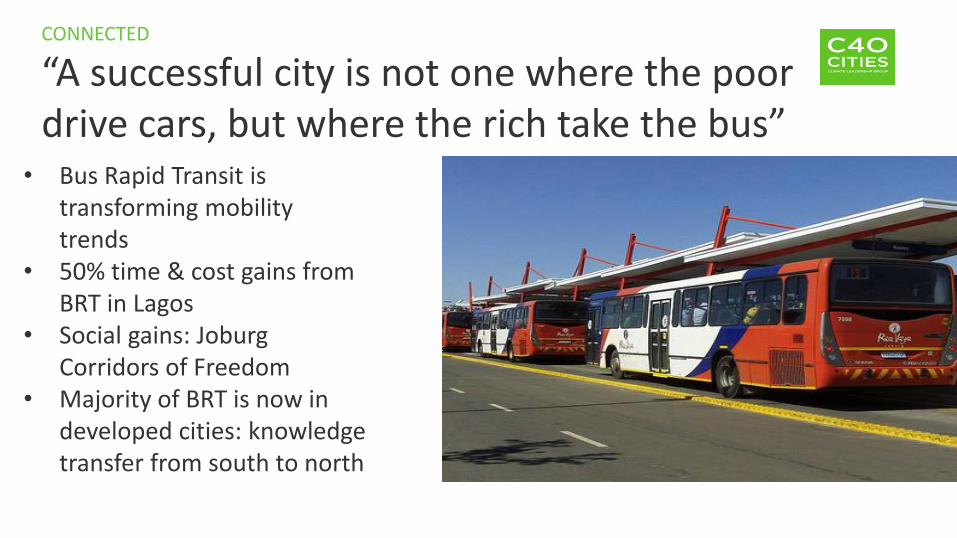
CONNECTED
“A successful city is not one where the poor drive cars, but where the rich take the bus”
• Bus Rapid Transit is transforming mobility trends
• 50% time & cost gains from BRT in Lagos
• Social gains: JoburgCorridors of Freedom
• Majority of BRT is now in developed cities: knowledge transfer from south to north
BUILT ENVIRONMENT
But of course planning and transport policy are not the only drivers of sustainable cities...
And mayors are delivering in areas thought to be the preserve of national government
17
BUILT ENVIRONMENT
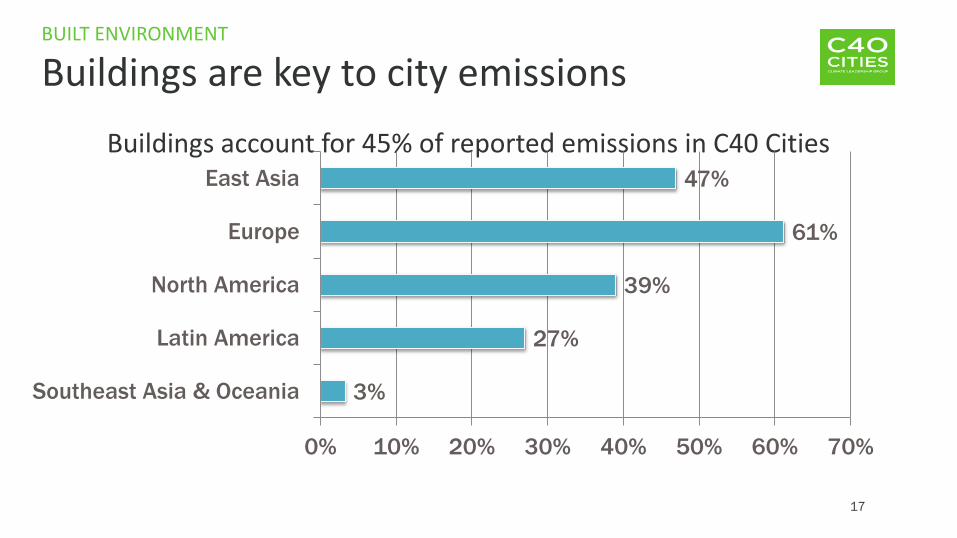
Buildings are key to city emissions
Buildings account for 45% of reported emissions in C40 Cities47%
61%
39%
27%
3%
0% 10% 20% 30% 40% 50% 60% 70%
East Asia
Europe
North America
Latin America
Southeast Asia & Oceania
BUILT ENVIRONMENT
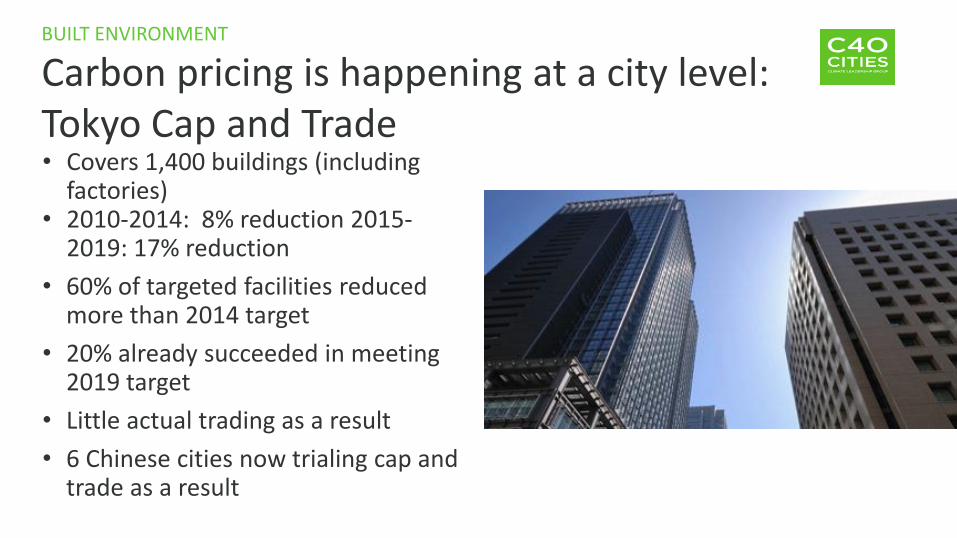
Carbon pricing is happening at a city level: Tokyo Cap and Trade• Covers 1,400 buildings (including
factories)• 2010-2014: 8% reduction 2015-
2019: 17% reduction
• 60% of targeted facilities reduced more than 2014 target
• 20% already succeeded in meeting 2019 target
• Little actual trading as a result
• 6 Chinese cities now trialing cap and trade as a result
COORDINATED
20
COORDINATED
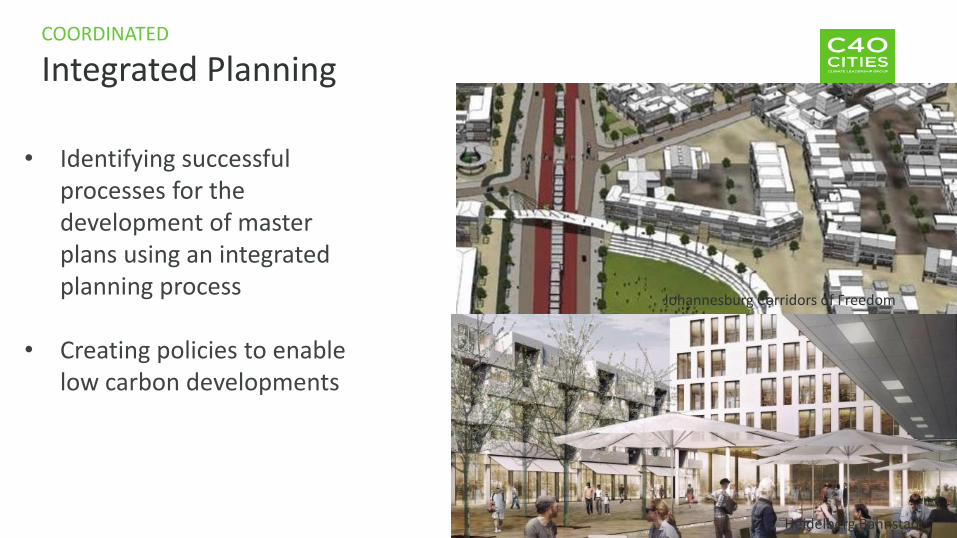
Integrated Planning
Creating policies to enable low carbon developments
Johannesburg Corridors of Freedom
Heidelberg Bahnstadt
• Identifying successful processes for the development of master plans using an integrated planning process
• Creating policies to enable low carbon developments
COORDINATED
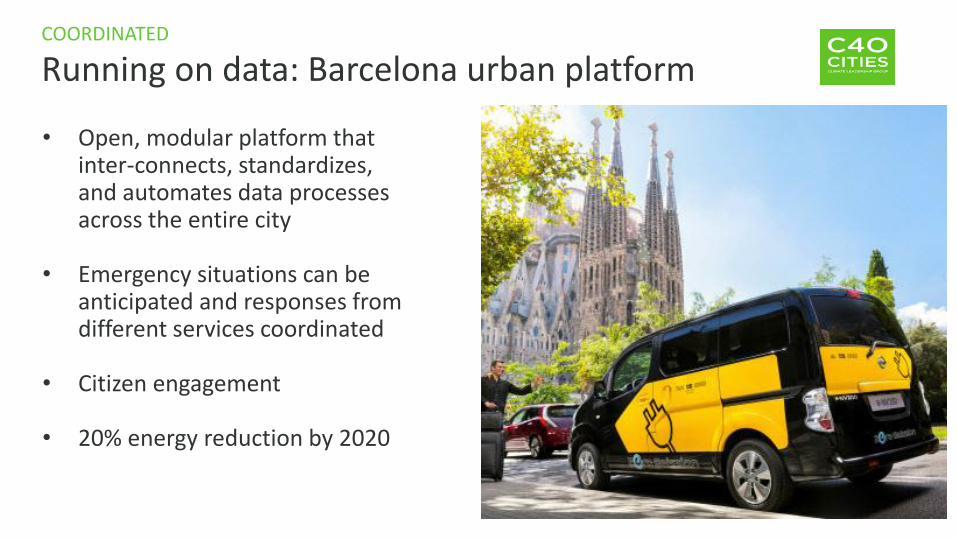
Running on data: Barcelona urban platform
• Open, modular platform that inter-connects, standardizes, and automates data processes across the entire city
• Emergency situations can be anticipated and responses from different services coordinated
• Citizen engagement
• 20% energy reduction by 2020
TRENDS IN SUSTAINABLE DEVELOPMENT
Ambitious Goal Setting
23
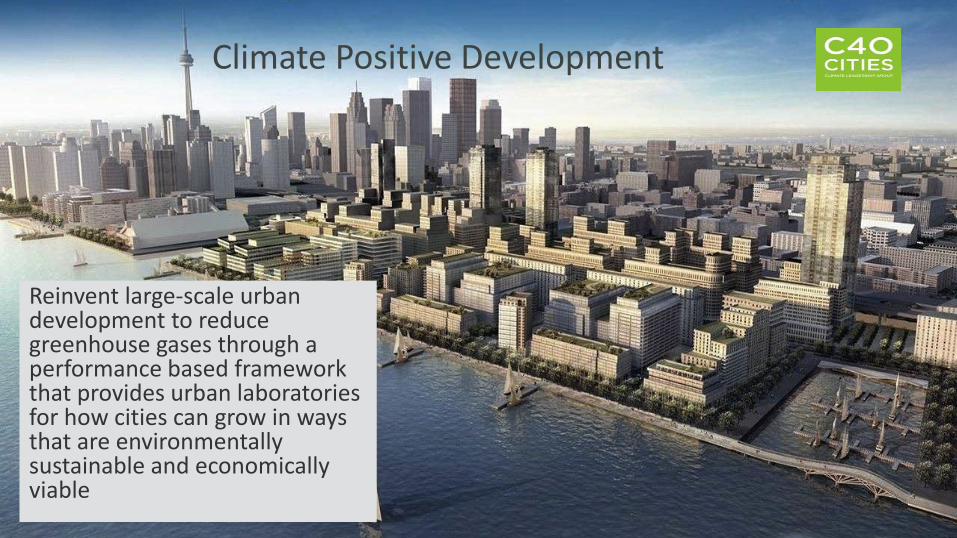
Reinvent large-scale urban development to reduce greenhouse gases through a performance based framework that provides urban laboratories for how cities can grow in ways that are environmentally sustainable and economically viable
Climate Positive Development
AMBITIOUS GOAL SETTING
Achieving a Climate Positive Outcome
• Create detailed integrated plans that quantify operational emissions
• Develop an emissions baseline, to allow the identification of opportunities and to measure reductions
• Maximize energy efficiency and the utilization of renewable energy
• Reduce waste to landfill, and ideally use waste as a resource• Minimize private vehicle travel, and promote walkability and
low-carbon mass transit• Expand the impact into the surrounding community
25
AMBITIOUS GOAL SETTING
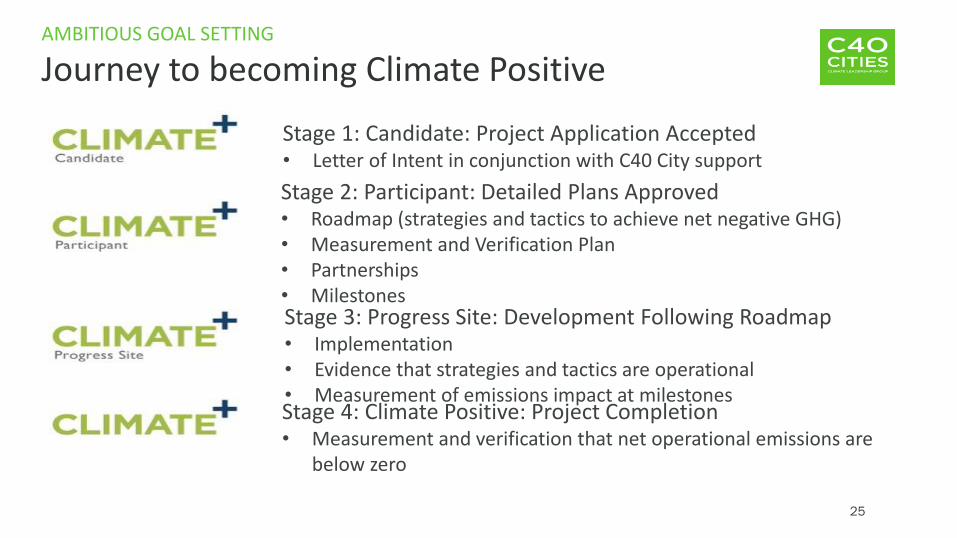
Journey to becoming Climate Positive
Stage 1: Candidate: Project Application Accepted• Letter of Intent in conjunction with C40 City support
Stage 2: Participant: Detailed Plans Approved• Roadmap (strategies and tactics to achieve net negative GHG)• Measurement and Verification Plan• Partnerships• MilestonesStage 3: Progress Site: Development Following Roadmap• Implementation• Evidence that strategies and tactics are operational • Measurement of emissions impact at milestonesStage 4: Climate Positive: Project Completion• Measurement and verification that net operational emissions are
below zero

AMBITIOUS GOAL SETTING
The Framework
Maximizing efficiency and minimizing emissions onsite; earning Climate Positive Credits by reducing emissions in the community
27
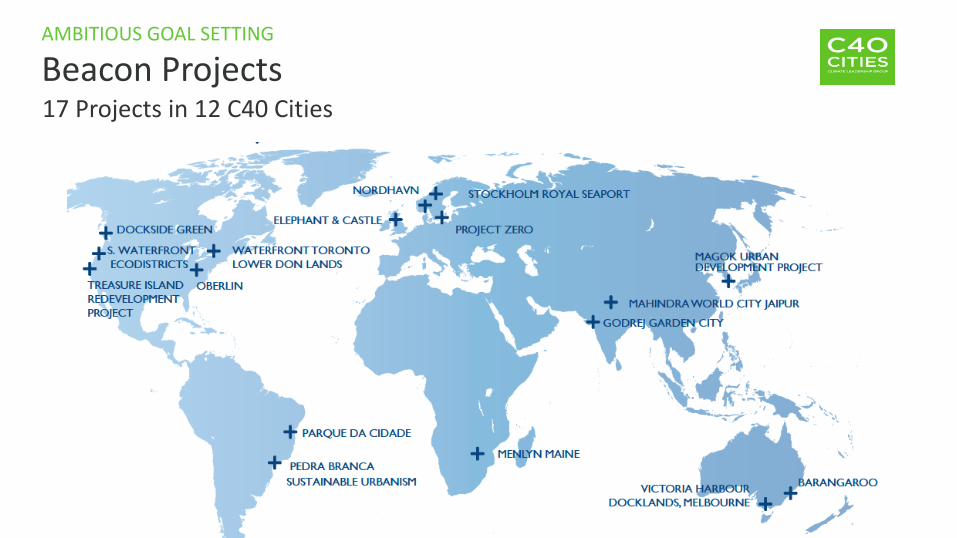
AMBITIOUS GOAL SETTING
Beacon Projects17 Projects in 12 C40 Cities
28
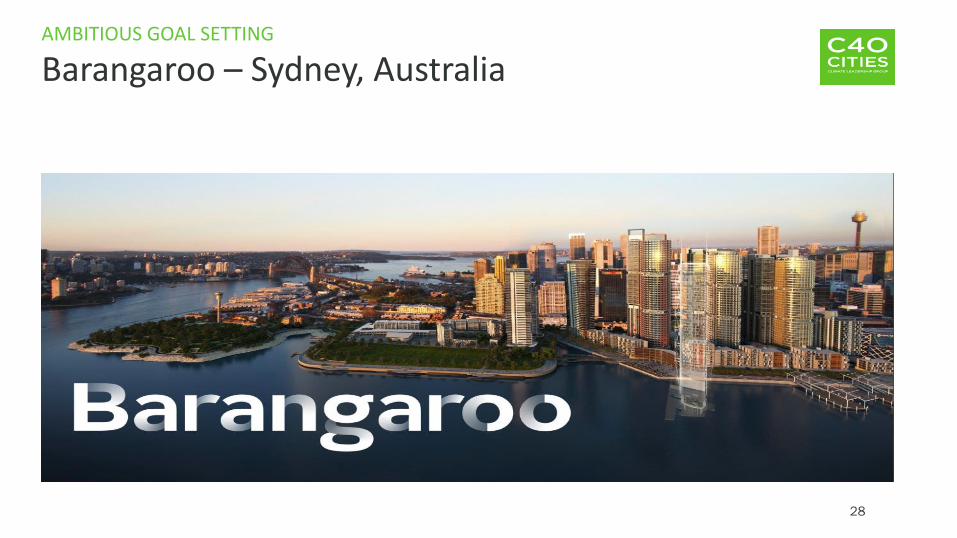
AMBITIOUS GOAL SETTING
Barangaroo – Sydney, Australia
29
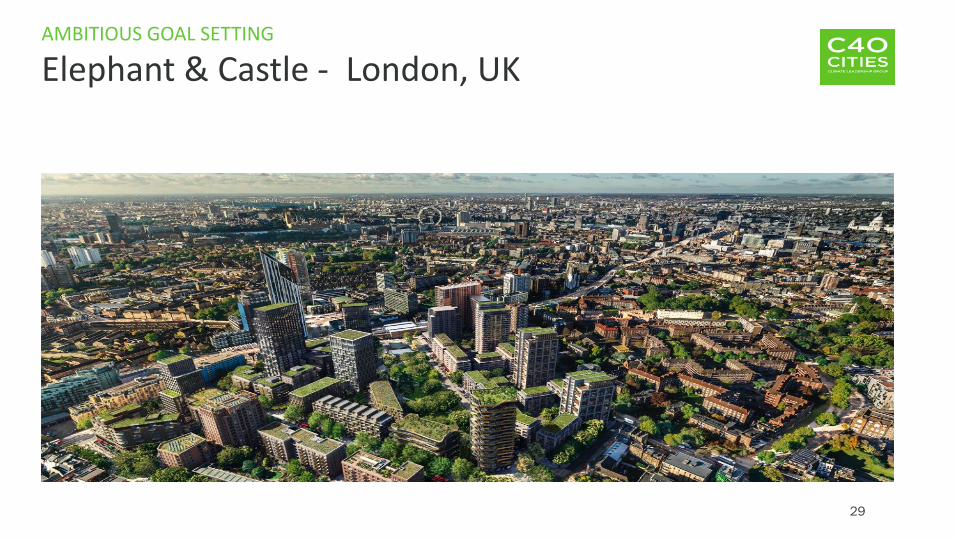
AMBITIOUS GOAL SETTING
Elephant & Castle - London, UK
30
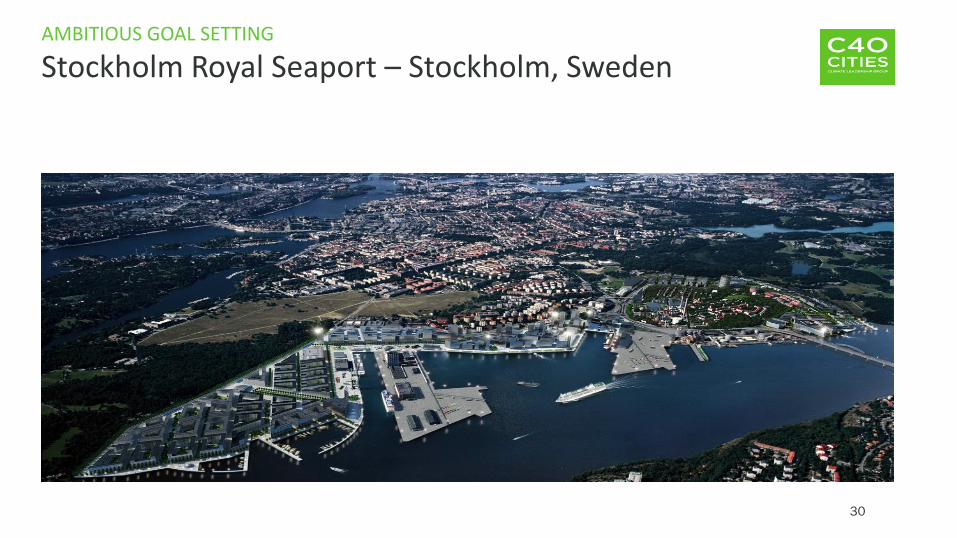
AMBITIOUS GOAL SETTING
Stockholm Royal Seaport – Stockholm, Sweden
31
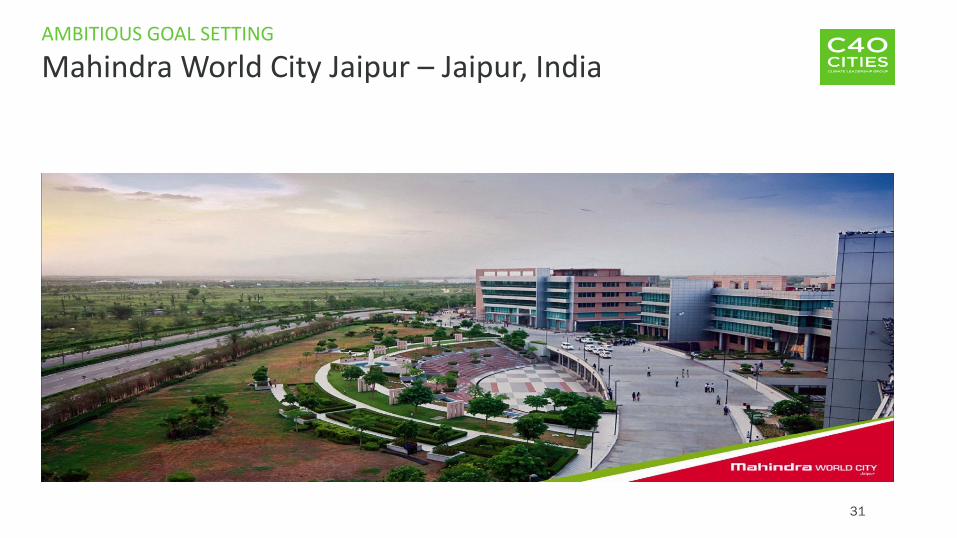
AMBITIOUS GOAL SETTING
Mahindra World City Jaipur – Jaipur, India

Can cities really make a difference?
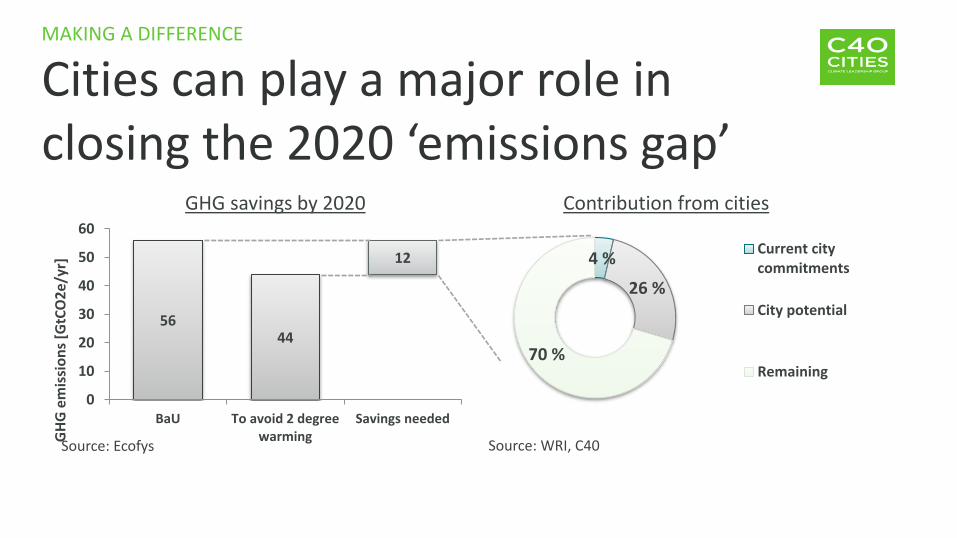
MAKING A DIFFERENCE
Cities can play a major role in closing the 2020 ‘emissions gap’
5644
12
0
10
20
30
40
50
60
BaU To avoid 2 degreewarming
Savings needed
GH
G e
mis
sio
ns
[GtC
O2
e/y
r] 4 %
26 %
70 %
Current citycommitments
City potential
Remaining
Source: Ecofys Source: WRI, C40
GHG savings by 2020 Contribution from cities
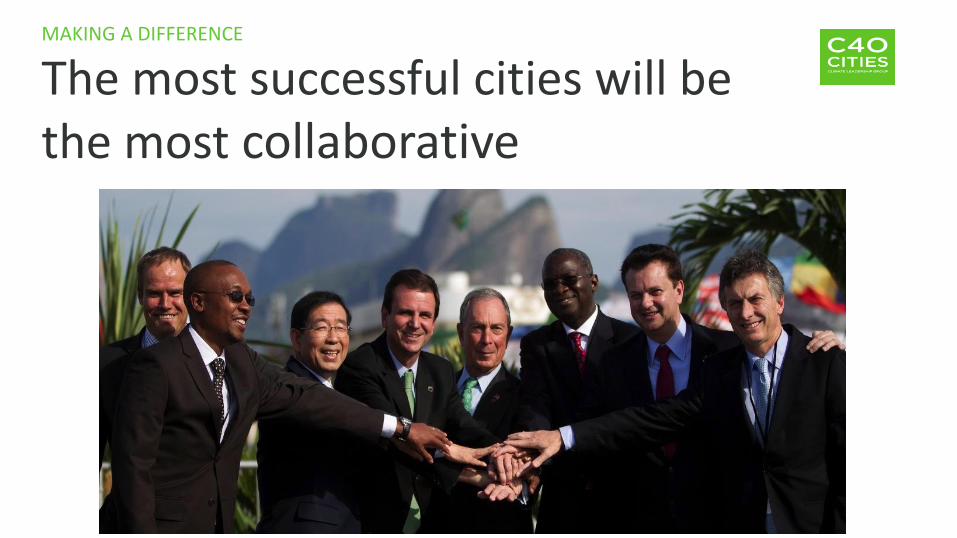
MAKING A DIFFERENCE
The most successful cities will be the most collaborative
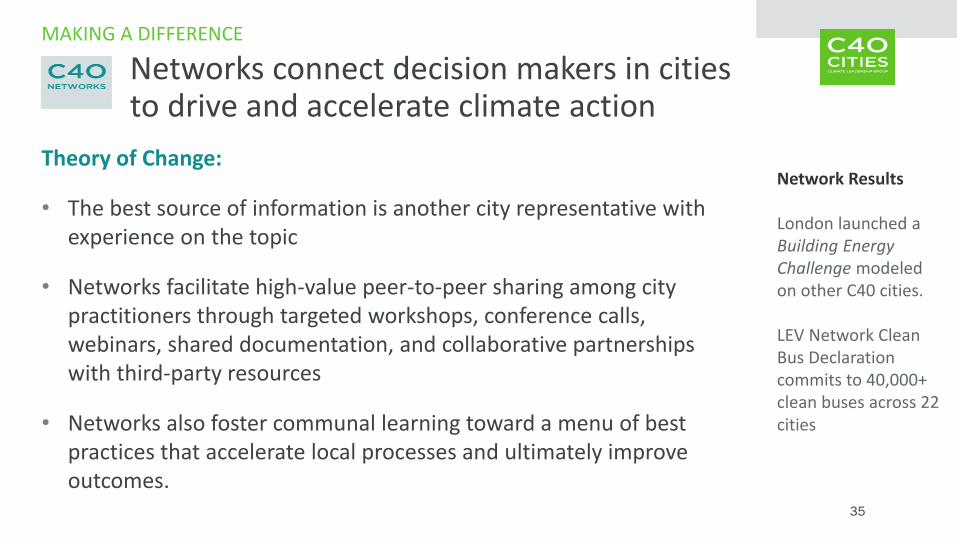
Theory of Change:
• The best source of information is another city representative with experience on the topic
• Networks facilitate high-value peer-to-peer sharing among city practitioners through targeted workshops, conference calls, webinars, shared documentation, and collaborative partnerships with third-party resources
• Networks also foster communal learning toward a menu of best practices that accelerate local processes and ultimately improve outcomes.
MAKING A DIFFERENCE
35
Network Results
London launched a Building Energy Challenge modeled on other C40 cities.
LEV Network Clean Bus Declaration commits to 40,000+ clean buses across 22 cities
Networks connect decision makers in cities to drive and accelerate climate action
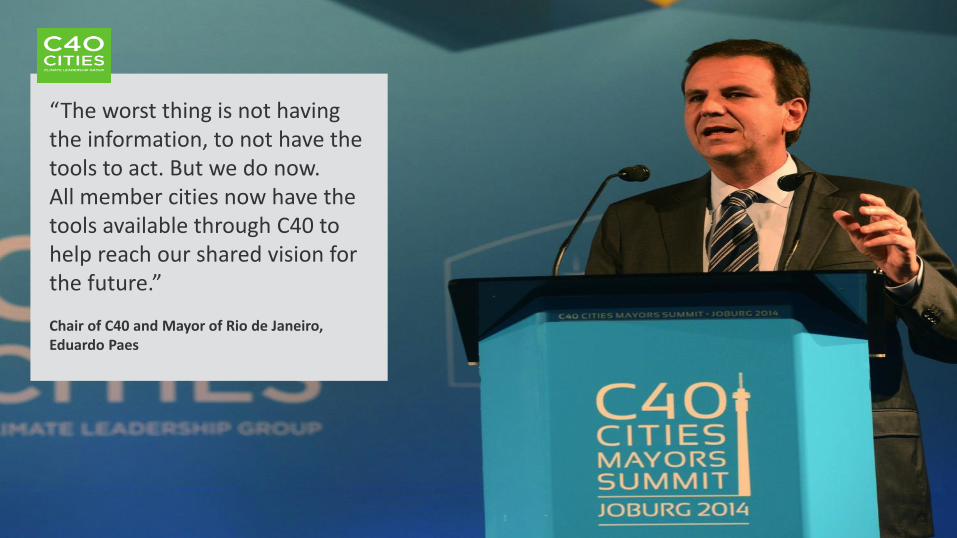
“The worst thing is not havingthe information, to not have the tools to act. But we do now. All member cities now have the tools available through C40 to help reach our shared vision forthe future.”
Chair of C40 and Mayor of Rio de Janeiro,Eduardo Paes