Zabbix Smart problem detection - FISL 2015 workshop
40
Zabbix Smart problem detection
-
Upload
zabbix-llc -
Category
Technology
-
view
792 -
download
0
Transcript of Zabbix Smart problem detection - FISL 2015 workshop

ZabbixSmart problem detection

Who am I?
Alexei Vladishev
Creator of Zabbix
CEO, Architect and Product Manager
Twitter: @avladishev
Email: [email protected]

Our plan
• How Zabbix works
• Basic problem detection
• Advanced problem detection
• Do some practical work
What is Zabbix?Enterprise level Free and Open Source monitoring solution
Benefits of Zabbix
• True Free software
• All in one solution
• Easy to maintain
• Mature, high quality and reliable
• Flexible (also applies to problem detection)
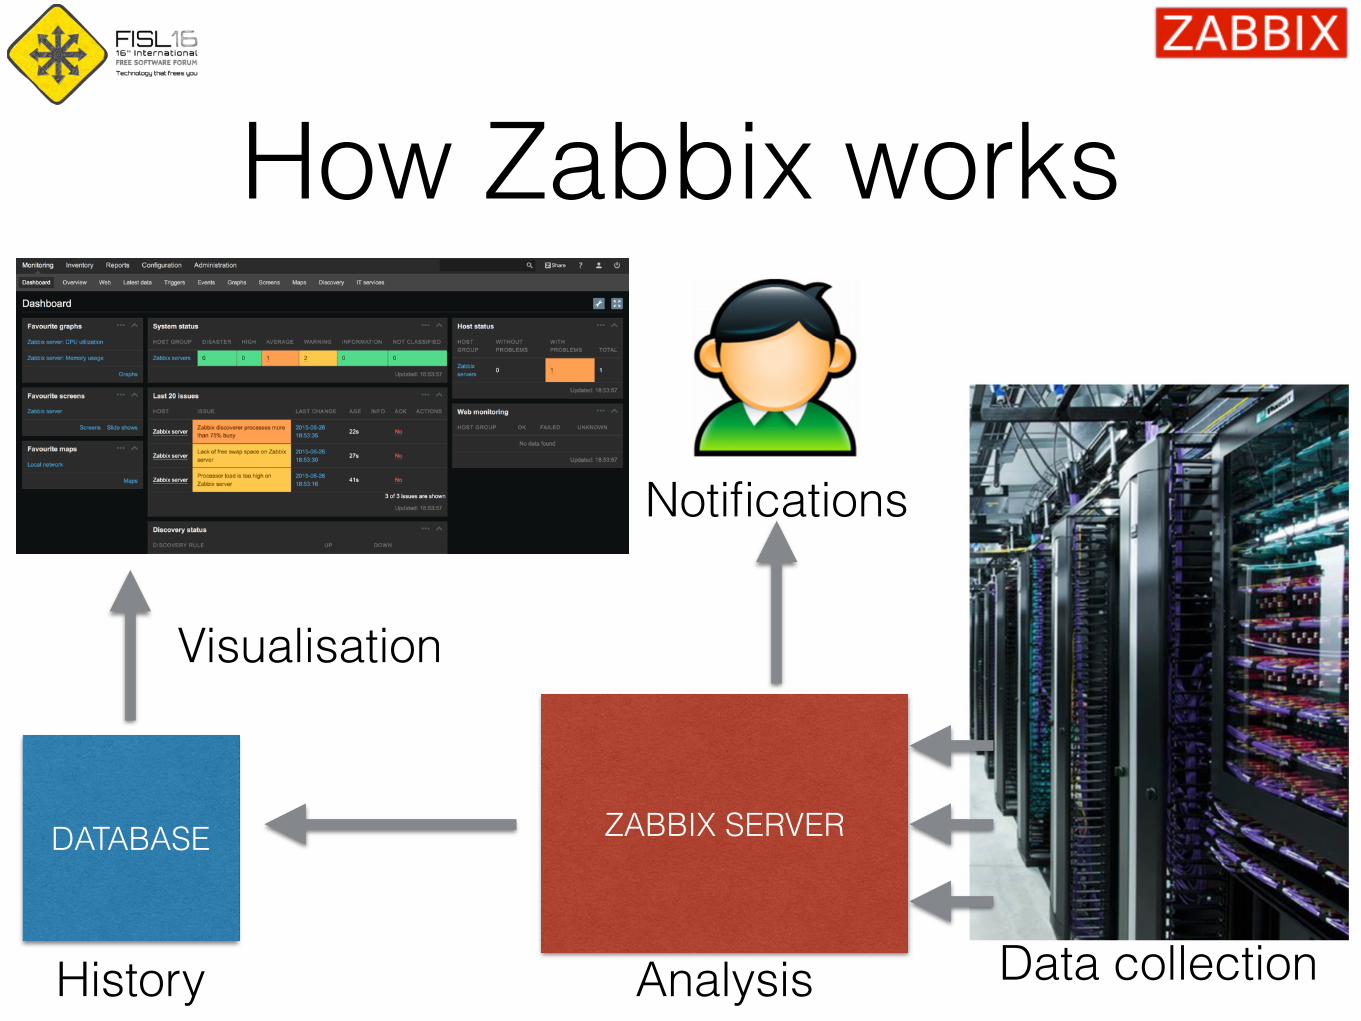
How Zabbix works
DATABASE ZABBIX SERVER
Visualisation
History Analysis Data collection
Notifications
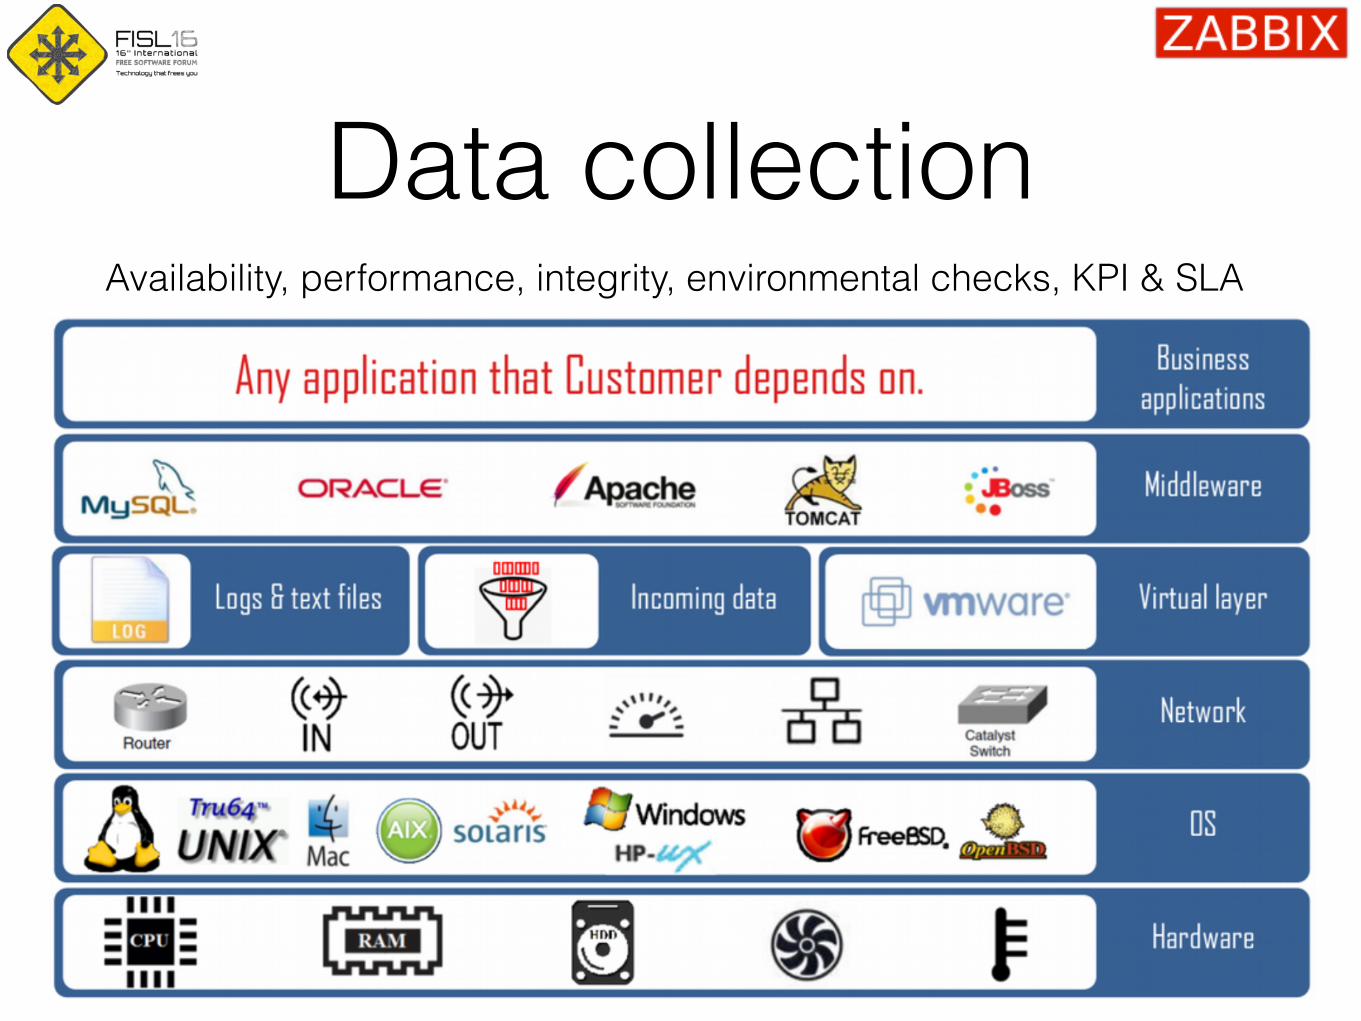
Data collectionAvailability, performance, integrity, environmental checks, KPI & SLA
Methods of data collectionPull
• Service checks: HTTP, SSH, IMAP, NTP, etc
• Passive agent
• Script execution using SSH and Telnet
Push
• Active agent
• Zabbix Trapper and SNMP Traps
• Monitoring of log files and Windows event logs

Active vs Passive

How often execute checks?Every N seconds
• Zabbix will evenly distribute checks
Different frequency in different time periods
• Every X seconds in working time
• Every Y second in weekend
At a specific time (Zabbix 3.0)
• Ready for business checks
• Every hour starting from 9:00 at working hours (9:00, 10:00, …, 18:00)
How to detect problems in this data flow?

Triggers!

Trigger is problem definition

TriggersExample
{server:system.cpu.load.last()} > 5
Operators
- + / * < > = <> <= >= or and not
Functions
min max avg last count date time diff regexp and much more!
Analyse everything: any metric and any host
{node1:system.cpu.load.last()} > 5 and {node2:system.cpu.load.last()} > 5 and {nodes:tps.last()} > 5000

Junior level
Performance
{server:system.cpu.load.last()} > 5
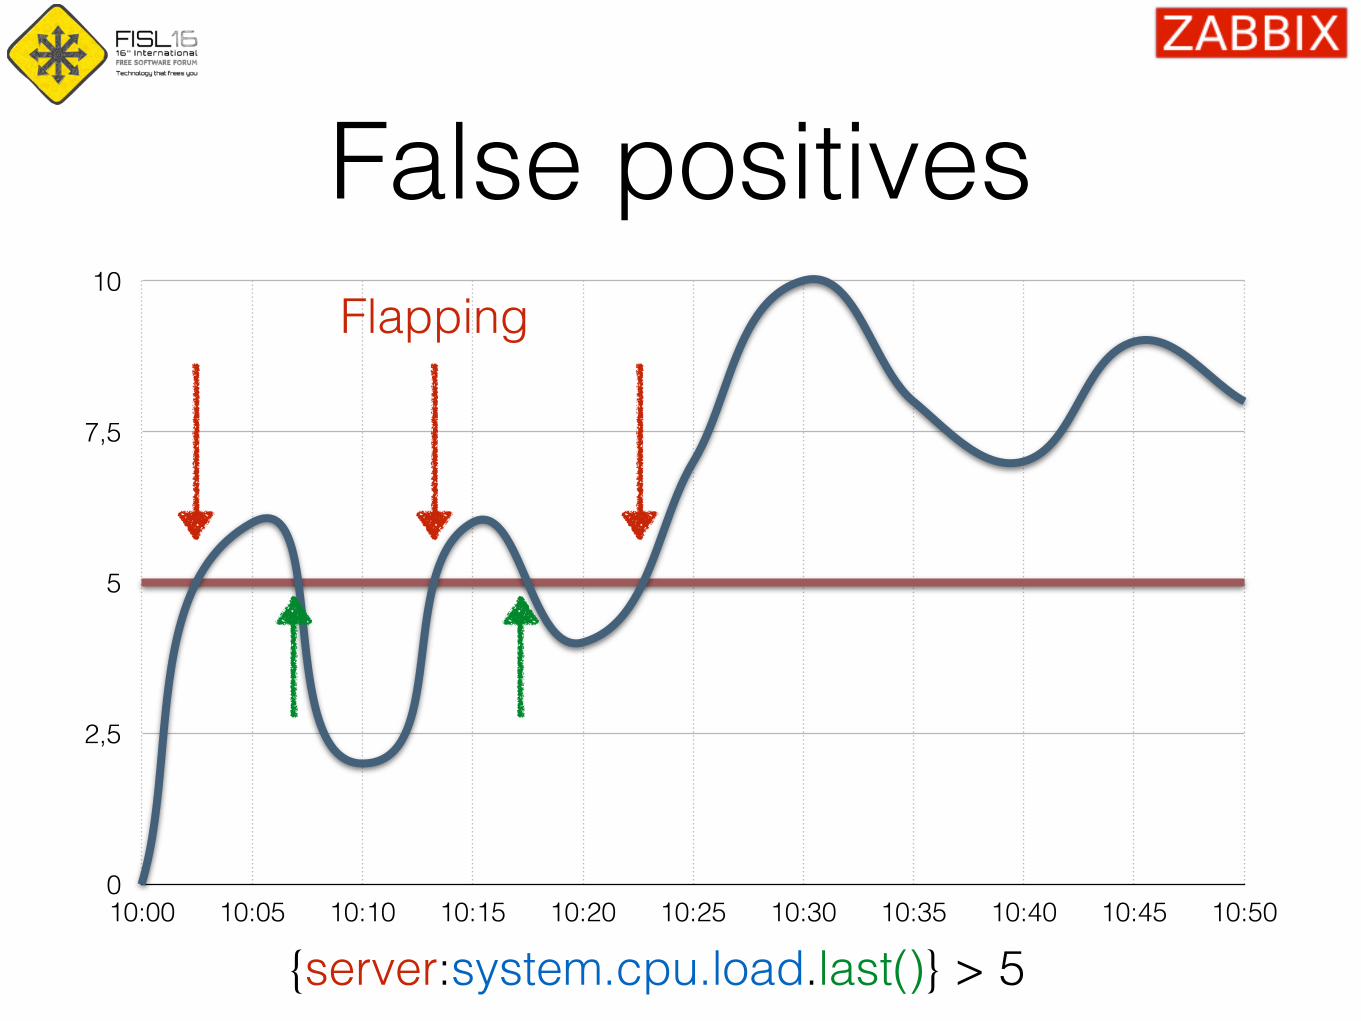
False positives
0
2,5
5
7,5
10
10:00 10:05 10:10 10:15 10:20 10:25 10:30 10:35 10:40 10:45 10:50
{server:system.cpu.load.last()} > 5
Flapping

Junior level
Availability
{server:net.tcp.service[http].last()} = 0
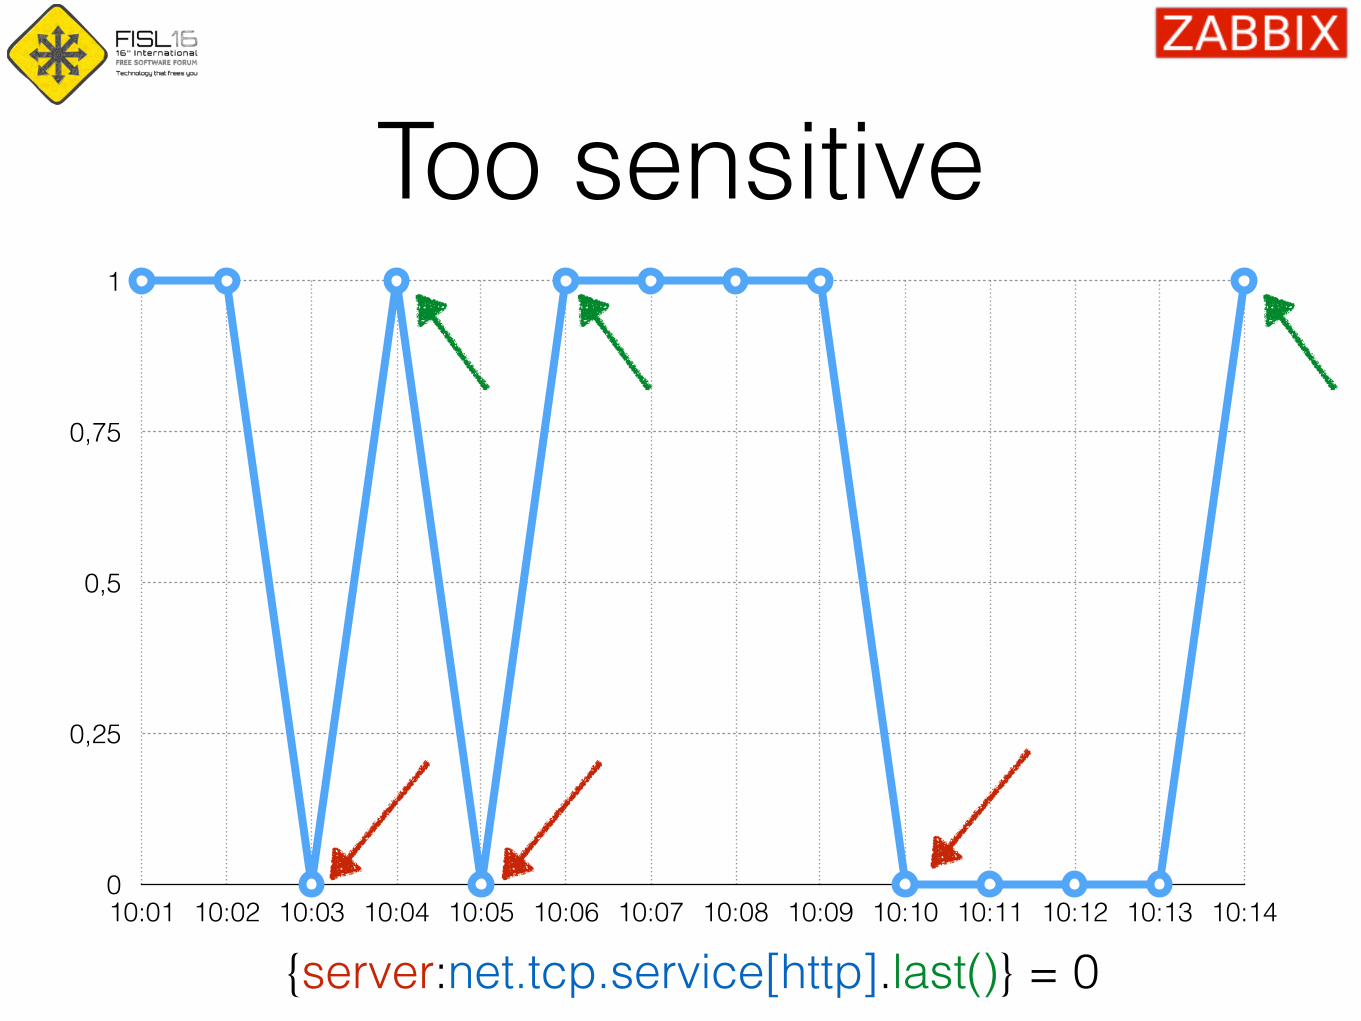
Too sensitive
0
0,25
0,5
0,75
1
10:01 10:02 10:03 10:04 10:05 10:06 10:07 10:08 10:09 10:10 10:11 10:12 10:13 10:14
{server:net.tcp.service[http].last()} = 0

Too sensitive leads to false positives

How to get rid of false positives?

Properly define problem conditions and think
carefully!
system is overloaded running out of disk space a service is not available
What really means ?
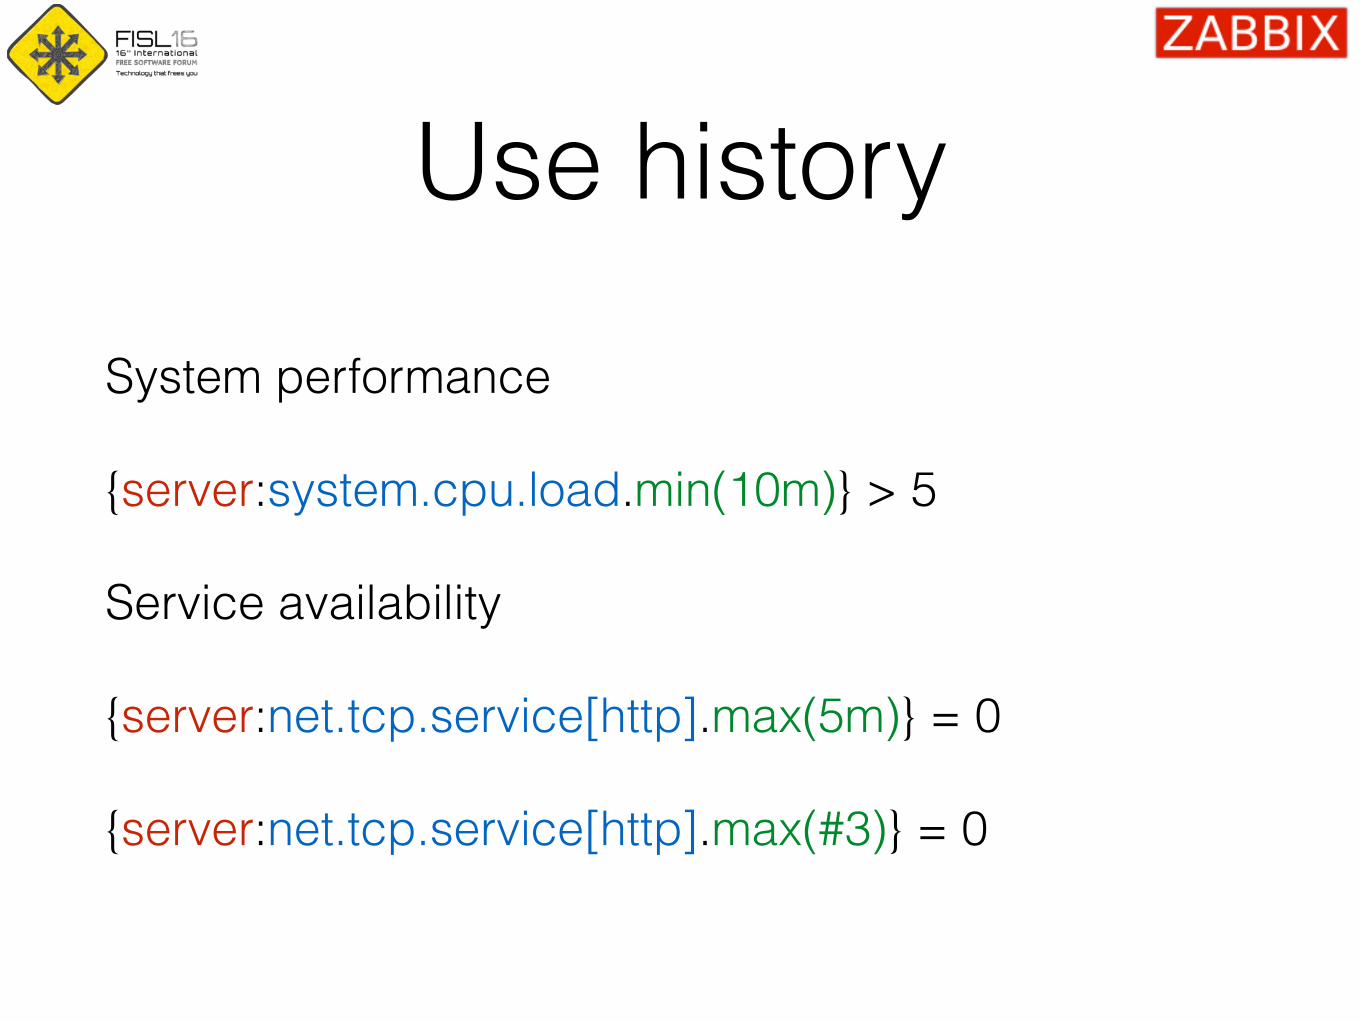
Use history
System performance
{server:system.cpu.load.min(10m)} > 5
Service availability
{server:net.tcp.service[http].max(5m)} = 0
{server:net.tcp.service[http].max(#3)} = 0

Analyse history
0
2,5
5
7,5
10
10:00 10:05 10:10 10:15 10:20 10:25 10:30 10:35 10:40 10:45 10:50 10:55 11:00 11:05 11:10
{server:system.cpu.load.min(10m)} > 5
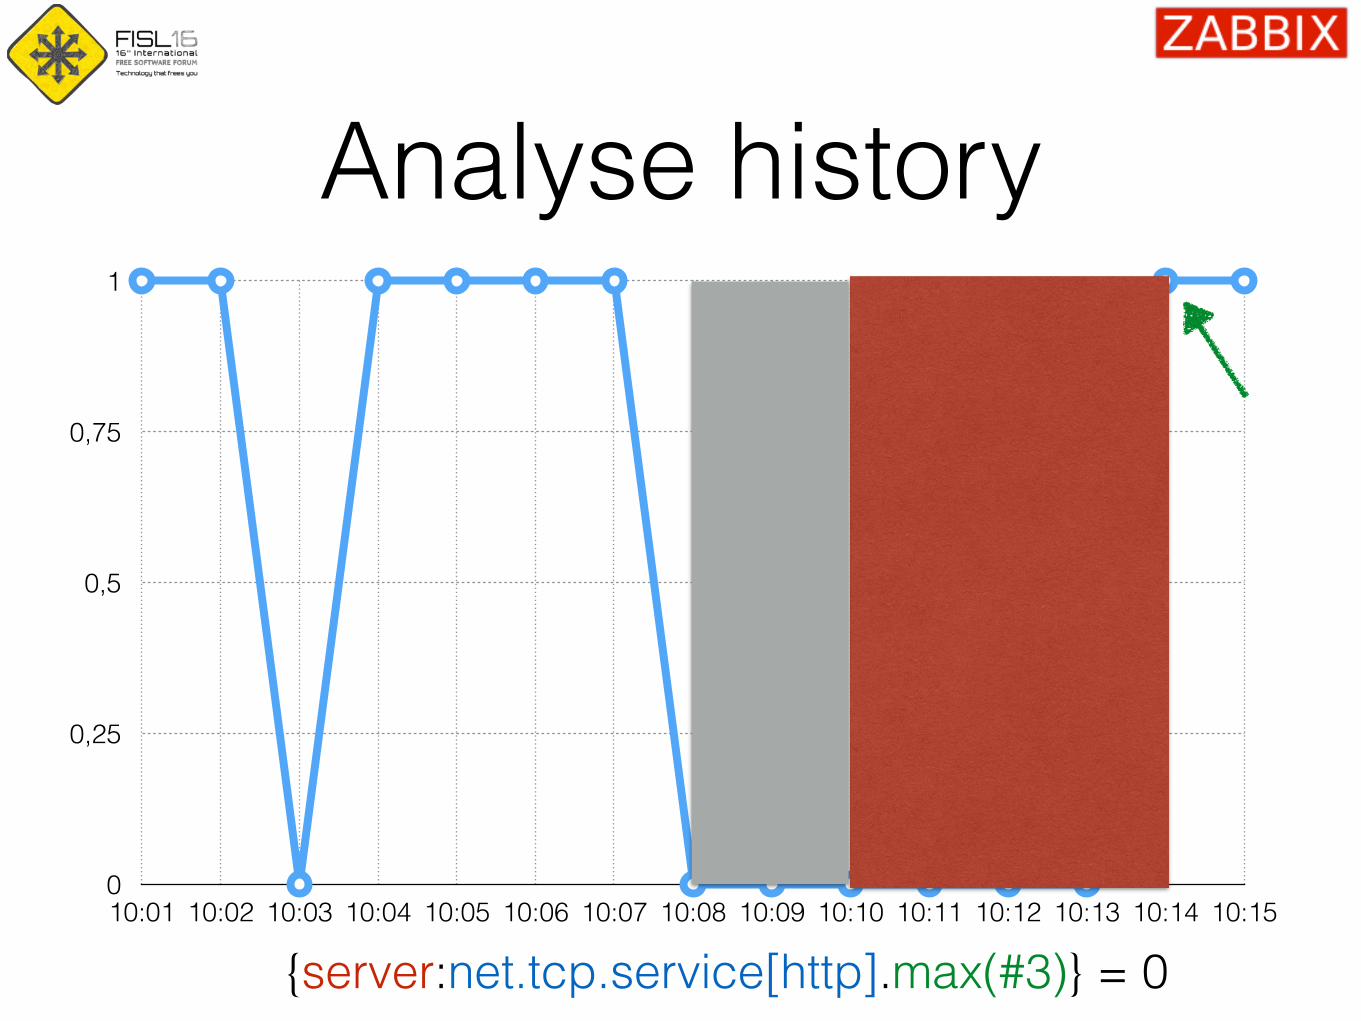
Analyse history
0
0,25
0,5
0,75
1
10:01 10:02 10:03 10:04 10:05 10:06 10:07 10:08 10:09 10:10 10:11 10:12 10:13 10:14 10:15
{server:net.tcp.service[http].max(#3)} = 0
Problem disappeared !=
problem is resolved

A few examples
Problem: free disk space < 10%No problem: free disk space = 10.001% Resolved?
Problem: CPU load > 5 No problem: CPU load = 4.99 Resolved?
Problem: SSH check failed No problem: SSH is up Resolved?

Different conditions for problem and recovery
Before
{server:system.cpu.load.last()} > 5
Now
({TRIGGER.VALUE=0} and {server:system.cpu.load.last()}>5)
or
({TRIGGER.VALUE=1} and {server:system.cpu.load.last()}>1)
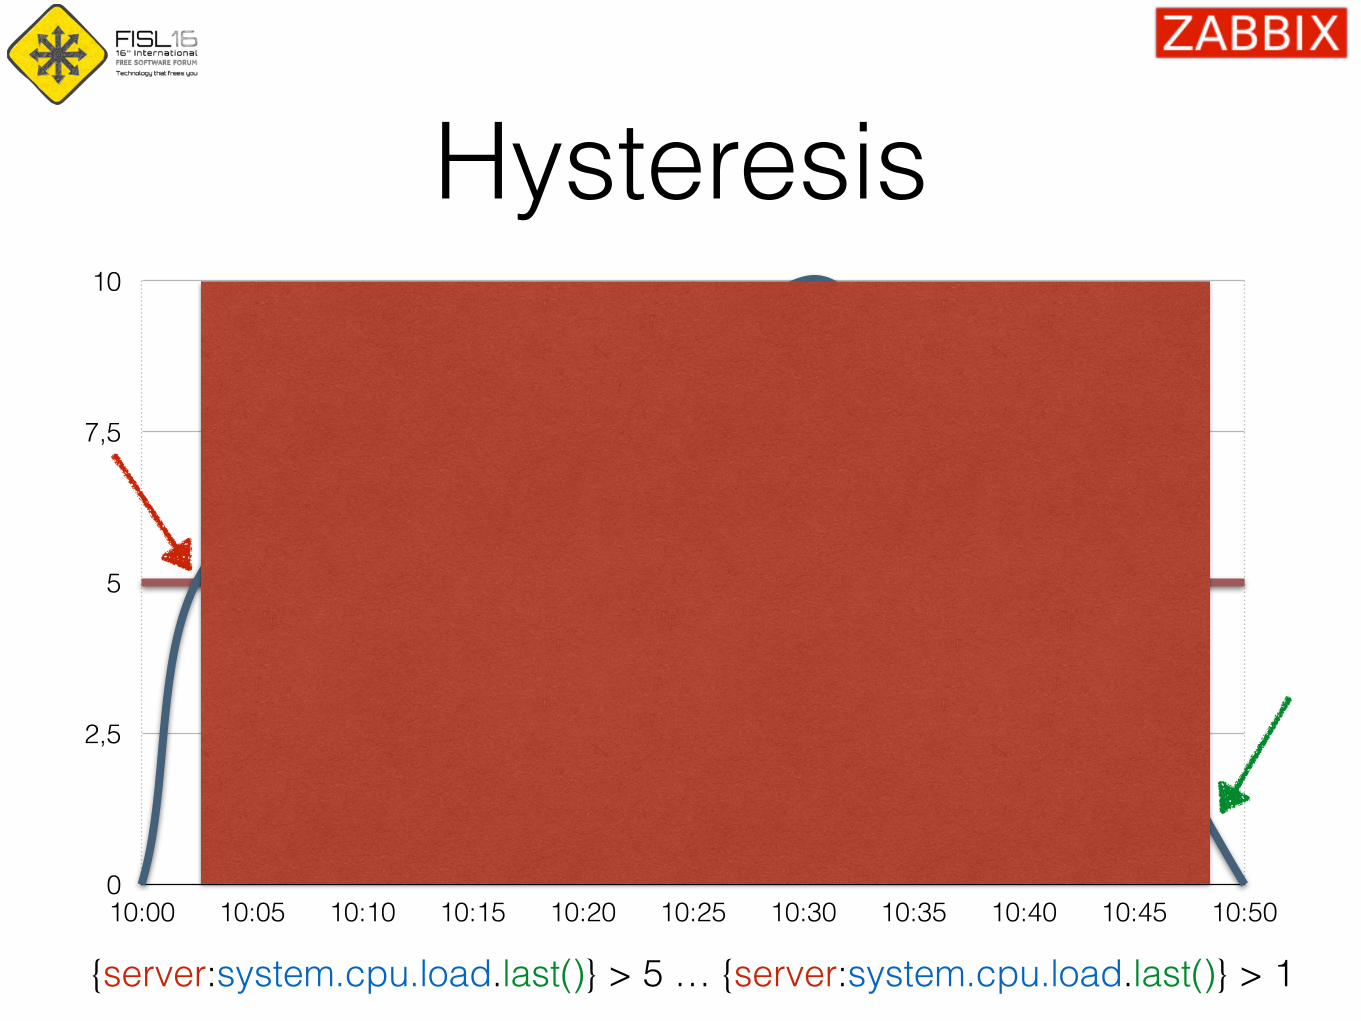
Hysteresis
0
2,5
5
7,5
10
10:00 10:05 10:10 10:15 10:20 10:25 10:30 10:35 10:40 10:45 10:50
{server:system.cpu.load.last()} > 5 … {server:system.cpu.load.last()} > 1

No flapping!

Several examplesSystem is overloaded
({TRIGGER.VALUE=0} and {server:system.cpu.load.min(5m)}>3)or ({TRIGGER.VALUE=1} and {server:system.cpu.load.max(2m)}>1)
No free disk space on /({TRIGGER.VALUE=0} and {server:vfs.fs.size[/,pfree].last()}<10)or ({TRIGGER.VALUE=1} and {server:vfs.fs.size[/,pfree].min(15m)}<30)
SSH server is not available ({TRIGGER.VALUE=0} and {server:net.tcp.service[ssh].max(#3)}=0)or ({TRIGGER.VALUE=1} and {server:net.tcp.service[ssh].min(#10)}=0)

Anomalies

How to detect?Compare with a norm, where norm is system state in the past.
Average CPU load for the last hour is 2x higher than CPU load for the same period week ago
{server:system.cpu.load.avg(1h)} >
2 * {server:system.cpu.load.avg(1h,7d)}

Anomaly
0
2,5
5
7,5
10
10:00 10:05 10:10 10:15 10:20 10:25 10:30 10:35 10:40 10:45 10:50 10:55 11:00 11:05 11:10
Compare with 7 days ago
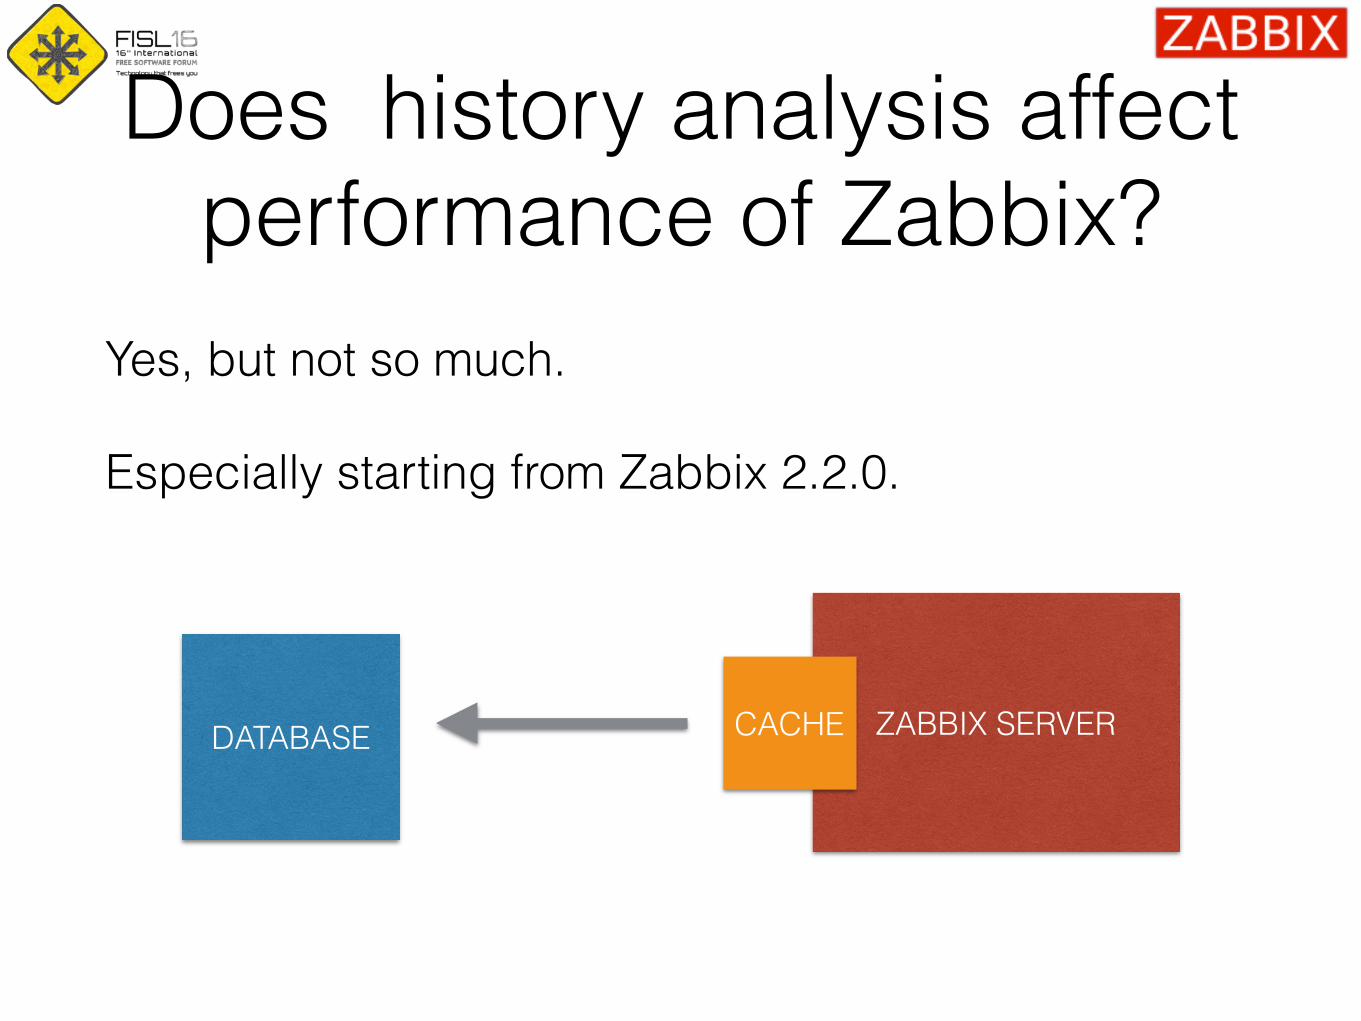
Does history analysis affect performance of Zabbix?
Yes, but not so much.
Especially starting from Zabbix 2.2.0.
DATABASE ZABBIX SERVERCACHE

Dependencies
Hide dependent problems.
CRM is not available
Database is down
No free disk space

How to react on problems?

Possible reactions
• Automatic problem resolution
• Sending notification to user and user group
• Opening tickets in Helpdesk systems
Escalate!• Immediate reaction
• Delayed reaction
• Notification if automatic action failed
• Repeated notifications
• Escalation to a new level

Example
Critical problem Repeated EmailSMS and ticket
Service restart
SMS to manager
5 min
10 min
15 min
20 min
0 min

Summary• Analyse history
• No problem != solutionUse different conditions for problem and recovery
• Take advantage of anomaly detection
• Resolve common problem automatically
• Do not afraid to escalate!
Thank you!
twitter.com/zabbix
Welcome to Zabbix conference! Riga, September 11-12.