Z- Z- Z S( - World Bankdocuments.worldbank.org/curated/en/891371468261908884/pdf/multi... · /Z- Z-...
149
Documentof The World Bank FOR OFFICIAL USE ONLY Z-k IS 3S -S V-7 /Z- Z- Z S( -/. Repon No. 9290-CHA STAFF APPRAISAL REPORT CHINA IRRIGATEDAGRICULTUREINTENSIFICATION PROJECT APRIL 25, 1991 China AgricultureOperationsDivision Country Department III Asia Regional Office This document has a resicted distribution and may be used by reCipients only in the performance of their official duties. Its contents may not otherwise be disclosed witbout World Bank authorization. Public Disclosure Authorized Public Disclosure Authorized Public Disclosure Authorized Public Disclosure Authorized Public Disclosure Authorized Public Disclosure Authorized Public Disclosure Authorized Public Disclosure Authorized
Transcript of Z- Z- Z S( - World Bankdocuments.worldbank.org/curated/en/891371468261908884/pdf/multi... · /Z- Z-...
Document of
The World Bank
FOR OFFICIAL USE ONLY
Z-k IS 3S -S V-7 /Z- Z- Z S( -/.
Repon No. 9290-CHA
STAFF APPRAISAL REPORT
CHINA
IRRIGATED AGRICULTURE INTENSIFICATION PROJECT
APRIL 25, 1991
China Agriculture Operations DivisionCountry Department IIIAsia Regional Office
This document has a resicted distribution and may be used by reCipients only in the performance oftheir official duties. Its contents may not otherwise be disclosed witbout World Bank authorization.
Pub
lic D
iscl
osur
e A
utho
rized
Pub
lic D
iscl
osur
e A
utho
rized
Pub
lic D
iscl
osur
e A
utho
rized
Pub
lic D
iscl
osur
e A
utho
rized
Pub
lic D
iscl
osur
e A
utho
rized
Pub
lic D
iscl
osur
e A
utho
rized
Pub
lic D
iscl
osur
e A
utho
rized
Pub
lic D
iscl
osur
e A
utho
rized

CURRENCY EOUIVALENTS(As of January 1, 1991)
Currency Unit - Yuan (Y)US$1.00 = Y5.22
Y1.00 = US$0.1916
FISCL YEAR
January 1 to December 31
WEIGHTS AND MEASURES
1 meter (m) = 3.28 feet (ft)1 cubic meter (cu m) - 35.31 cubic feet1 kilometer (km) = 0.62 miles1 hectare (ha) = 2.47 acres1 mu = 0.067 ha1 ton (t) = 1,000 kg
= 2,205 pounds (lbs)1 kg = 2.2 pounds (lbs)
ABBREVIATIONS AMD ACRONYMS
ABC - Agricultural Bank of ChinaCAAS - China Academy of Agr~icultural SciencesCATEC - County Agrotechnical Extension CenterCMS - Cubic meters per secondcNIEC - China Machinery Import & Export CorporationCMS - Cubic meters per secondCPCP - Central Project Coordinating OfficeCPSG - Central Project Steering GroupDAP - Diammonium phosphate
GOC - Government of China
ICB - International competitive biddingIPM - Integrated pest managementITC - International Tendering CompanyLCB - Local competitive biddingM&E - Monitoring & EvaluationMOF - Ministry of Finance
MWR - Ministry of Water ResourcesNCS - North China Plain
PEPB - Provincial Environmental Protection BureauPMO - Project Management OfficeSMC - Supplies and Marketing CooperativesSNWT - South-North Water TransferSOE - Statement of ExpenditureTATES - Township Agrotechnical Extension Station

ClIMA
IRRIGATED AGRICULTURE INTENSIFICATION PROJECT
Table of Content.
Page No.
I. BACKGROUND ................................................ ... 1
Introduction ............................................................. IIrrigated Agriculture in China . ... 1.* ................... IInstitutional Aspects of Irrigation ..................... 2
Policies and Plans for Grain Production ................. 5
Agriculture in the North China Plain .................... 6
Bank Group Strategy and Role in Irrigated Agriculture ... 6
Rationale for Bank Group Involvment ................... 7
II. THE PROJECT AREAS ............................................ . 8
Location . ... 8
Climate, Topography and Soils .. ...................... 8
Population, Labor, Farm Size and Land Use ........... ... 9
Rural Incomes and Poverty .......... . . . 9
Agricultural Development ............................... . 10
Water Resources and Irrigation ...................... 12
Institutional Support ........ ....................... 15Infrastructure. . ........... . 19
III. THE PROJECT .. . .......................................... 20
Objectives ............................................. 20
Irrigation and Drainage ................................ 20
Agricultural Intensification . ... ..... .. 26Trai.ning and Technical Ass ictance .... 29
Water Supply, Demand and Quality ....................... . 30
Design Status and Standards .... 31
Environmental Impact ....... . ........................... 31Implementation Schedule . ................................ 33
Cost Estimates ...................................... 34
Financing ..... ...... 36Procurement ..................................... . 36
Disbursements . . *. .o ....... .. ............. 38
Accounts and Audits .................................. . . . 39
This repot is baend on the findingp of a pre-appraisl nission in Nov. 1989 comprising A. Ody (Mision Leader), L. S. Tay, W. P. fl;g(Bank/IDA), R. 1. Sun and S. McGurk (consultants); a technical reWviw mnision in May 1990 eomprising L. S. Tay (Mision Leader), W.P. flag, Usaid El-Hanbali (Bank/IDA) and S. McGurk (consultant) &.nd e- appriul mnision in AuSust 1990 conVrising L. S. Tay (MissionLader), W. P. rTng, El-Hsnbali, R. Vick (Bank/lDA), Tao Zhan and S. McGurk (consultants). Poer reviewers conrined Mess. A. Ody(AS3CO), H. Plusquellec (AGRPS), J. Berkoff (ASTAO), B. Van de Poll (AS4AG) and R. Derhpande (AS3AO). lbe AS3AG DivisionChief is Mr. J. Goldberg and the Depautment m Director is Mr. Shahid J. Burki. Ms. V. Elliott also aeisted in the drafting of the SAR.

Li
Page No.
IV. ORGANIZATION AND MANAGEMENT .............................................. . 40Project Organization . ... ................................ 40Financial Management .................................... 41Execution and Supervision of Project Works .............. 42Operation and Maintenance ... . .......... 43Project Launch Workshop .. .. 44Monitoring, Evaluation and Reporting ............ ....... o 45
V. PRODUCTION, MARKETS AND PRICES .............. ................. 45Production .............................................. 45Markets ........................... 0............ 0.......... 46Marketing Channels . ...................... .......... 48Prices . ....................... ....................... .49
VI. ECONOMIC AND FINANCIAL ANALYSIS ..... 51Benefits .............. .. . . . 51Employment and Incomes ..... 52Cost Recovery ......................................... .. 52Economic Analysis . .... 53Risks .... .54
VI. AGREEMENTS REACHED AND RECOMMENDATIONS ........................ 55
TABLES IN THE TEXT
Table 2.1 - Area and Yield of Major CropsTable 2.2 - South-North Water Transfer - Eastem AlignmentTable 3.1 - Improvement and Expansion of Irrig. AreasTable 3.2 - Improvement and Expansion of Iig. Areas in JiangsuTable 3.3 - Improvernent and Expansion of Irrig. Areas in AnhuiTable 3.4 - Improvement and Expansion of Irrig. Ars in ShandongTable 3.5 - Project Cost SummnaryTable 3.6 - Project FinancingTable 3.7 - Procurement ProfileTable 5.1 - Cropping Pattem, Yields and ProductionTable 6.1 - Annual Increnental Staple Crop Production and Value Added
ANNEXES
1. Basic Provincial and Project Area StatisticsProject Prefectures, Municipalities and CountiesClimatic Data - Anhui, Jiangsu and ShandongAnnual Hectarage Damaged by Drought and Waterlogging, 1970-89Design Standards for Flood Control, Drainage and IrrigationList of Existing Dams/Reservoirs in Jinagau requiring PeriodicSafety Inspections

FOR OFFICIAL USE ONLY
CH{INA
IRRIGATED AGRICULTURE INTENSIFICATION PROJECT
Loan/Credit and Proiect Summary
Borrower: People's Republic of China
Beneficiaries: Provinces of Anhui, Jiangsu and Shandong
Amount: Loan US$147.1 millionCredit SDR 139 million (US$187.9 million equivalent)
Terms: Loan: 20 years maturity including 5-year graceperiod at variable interest rates.Credit: IDA standard terms with 35 years raaturity.
Onlendino Terms: From Ministry of Finance to Provinces of Anhui, Jiangsu andShandong on terms and conditions satisfactory to theBankjiDA. It is expected that the Ministry of Finance willonlend to the Provinces for 15 years including 5 years ofgrace with interest at 5 percent per annum, and from theprovincial governments to prefecture and county governmentsat the same terms.
Objectives andDescription: The principal objective is to assist the Government in
increasing production of staple food and thereby increasingfarm incomes for some 2.8 million rural families in theNorth China Plain. The project would: (a) improve andexpand irrigation and drainage facilities to some 1.14million ha of lowi and medium yielding land covering sectionsof 73 counties in the provinces of Anhui, Jiangsu andShandong; (b) provide a complementary package of integratedagricultural inputs and support services to increaseproduction; (c) provide institutional development intechnical skills, project implementation and managementthrough technical assistance, operational research andtraining programs; and (d) implement an environmentalmonitoring management program to sustain the projectedagricultural productivity.
Benefits and Risks: About 1.14 million ha of low and medium yield land wouldhave higher productivity. At full development, the projectwould produce about 2.5 million tons of grain, 56,300 tonsginned cotton, 82,600 tons oilcrops and 65,100 tons othercrops with a total value of about US$528 million. Percapita income would increase by about 40% for 2.8 millionfarm families. About 450,000 per-_.,-year employmentopportunities would be generated during the constructionperiod. No major risks are foreseen.
This document has a restricted distribution and may be used by recipients only in the performanceof their official duties. Its contents may not otherwise be disclosed without World Bank authorization.

Estimated Cost:
Local Foreign Total
…US $ million ---
Irrigation and Drainage 170.6 158.1 328.7Agricultural Inputs 56.8 125.7 182.5Institutional Development
and Support 8.6 3.4 12.0
Total Base Cost 236.0 287.2 523.2
Physical Contingencies 12.9 16.3 29.2
Price Contingencies 9.4 31.2 40.6
Total Proiect Cost\l 258.3 334.7 593.0
Financino Plan:
Bank/IDA 335.0Central Covernment 106.0
Provincial Govts. 46.4Prefecture/Municipal Govts. 13.6
County/Township Govts.
and self-raised funds 92.0
Total 593.0
Estimated Disbursements: (USS million)
Bank Group Fiscal Year 1992* 193 1994 199 1996 1997
Annual 52.6 87.0 79.6 54.0 38.0 23.8
Cumulative 52.6 139.6 219.2 273.2 311.2 335.0
Economic Rate of Return: 26.5% (overall)
Shandong Component: 24.0%
Anhui Component: 26.4%
Jiangsu Component: 28.7%
\I Project is exempt from taxes and duties.* Includes USS15.0 million retroactive financing for works being carried out
between November 1, 1990 and the date of signing of Loan/Credit Ageement.
iii
2. Project Cost:- Project Cost Summary (Anhul, Jiangsu and Shandong)- Summary Account Cost Summary ( Three provinces)- Summary Account by Project Components (Three provinces)- Project Components by Year (Three provinces)
Procurement of Machinery, Equipment and Materials (Three province.)
Procurement Packaging and Scheduling (Three provinces)Estimated Disbursement Schedule and ProfileTraining, R*search and Technical Assistance Programs (Three provinces)Key Monitoring IndicatorsProposed Bank/IDA Supervision Input
3. Cropps,d Areas, Yields and Production (Each province)Province-wide Crop Budgets (Each province)Summary of Farm Household Model AnalysisFar Models (Each Province,)Rent and Cost RecoveryMain Conversion Factors UsedBorder Prices for Principal Products and InputsEconomic Analysis:
- Summary of Economic Analysis- Summary of Sensitivity Analysis- Econca:Lc Cash Flows - Whole Project- Emoncinic Cash Flows - Anhui Component- Economic Cash Flows - Jiangsu Component- Economic Cash Flows - Shandong Component
Annual Not Tra%u in Principal Project Outputs, 1988-89
Crop Prices and Marketing, 1990-2000
4. Environmental Monitoring Program
5. Selected Documents and Data available in the Project File
FIGURES AND CHARTS
Figure No.1 - Huai River BasinFigure No.2 - Cropping CalendarChart No.1 - Project OrganizationChart No.2 - Implementation Schedules (Three provinces)Chart No.3 - Disbursements Schedule - Cumulative and Semester
IBRD No.22448 - Project LocationIBRD No.22449 - Shandong ComponentIBDD No.22450 - Anhui ComponentIBRD No.22451 - Jiangsu Component
Introduction
1.1 The Government of China has requested Bank/IDA assistance in financing aproject to intensify irrigated agriculture in 73 counties in the Provinces of Anhui,Jiangsu and Shandong. The project's objective is to ameliorate poverty and increasestaple crop production by expanding and rehabilitating irrigation schemes, so as topermit greater productivity on low yielding areas. In particular, projectinvestments in irrigation and drainage systems would overcome the drought,waterlogging, soil salinity and flooding that currently constrain yields.Complementary support would be provided for agricultural inputs, extension, seedsupply, soil improvement and land leveling, farm roads, and planting of windbreaksand shelter belts. A Bank/IDA mission identified the project in May 1989, and theGOC and three provincial governments began preparing detailed feasibility studies inAugust 1989. A Bank/IDA preparation mission took place in August 1989, a pre-appraisal mission in November 1989, a technical review mission in May 1990, and anappraisal mission in August-September 1990.
Irrijated Agriculture i' China
1.2 Agriculture in China provides sustenance for over 1.1 billion people; itis an important source of income for some 190 million farm families and accounts forabout 30% of GDP. Only about 137 million ha of the country's 960 million ha of landarea is arable. Farming systems are intensive, requiring heavy inputs of labor,fertilizers, small machinery and water. Nearly half of the cropped area in thecountry is irrigated. Food grains occupy about 70% of the total cropland andaccount for about one-third of agricultural output. Intensive farming has allowedChina to meet the basic food requirements of its population and to produce anincreasingly diverse mix of cash and commercial crops. China's rural reform programintroduced in 1978 also has stimulated the agricultural sector. This programproduced impressive growth and structural change by introducing the productionresponsibility system, increasing producer prices, and expanding the role of themarket. The gross value of agricultural output increased by about 5% per yearbetween 1978 and 1988.
1.3 The productivity of China's irrigated land is about twice that of itsrainfed land. Irrigated agriculture accounts for about two-thirds of total grainproduction and three quarters of commercial crop production. irrigation allows bothhigher cropping intensities and higher yields. In China, it permits croppingintensities ranging from 1.2 in the northernmost areas to 2.5 to 3 in the southernprovinces. Irrigation can generate average yields of 3 t/ha for wheat, 5.3 t/ha forrice, 3.9 t/ha for corn, 0.9 t/ha for cotton, and 1.4 t/ha for soybean. Theseyields place China among the highest yielding countries in Asia.
1.4 Develogment of Irriaation. A major achievement of the ChineseGovernment since 1949 is the rapid expansion of irrigated farmland that took placebetween the early 1950r and the mid-1980s. Through this expansion, the effectivelyirrigated area in the country increased from about 20 milllon ha in 1952 to 33million ha in 1965, 45 milllon ha in 1976 and 48.5 million ha in 1984. This growthin irrigated area reflected the high priority attached to irrigation and agriculturein the State investment program, the ability of communes to mobilize ruralinhabitants for labor-intensive construction projects, and the widespread
2
introduction of tubewell te_hnology for exploiting groundwater in the early 19700.
Today, about 82% of the national irrigated area is fed by surface water and about
18% is fed by groundwater. China's irrigated lands are mainly located in the middle
and lower reaches of seven major rive- basins. These basins cover the densely
populated areas of the North, NortheaLt, East, South and Southeast.
1.5 Irrigation requirements vary considerably according to soil and
hydrogeological conditions. These conditions also have influenced the rate and
extent of irrigation development in the seven basins. In the nort>'est, Inner
Mongolia, northern Tibet and over a large part of the upper and middle stretches of
the Yellow River, where annual rainfall is less than 400 mm, irrigation is a pre-
requisite for the production of any crops. In the northeast, part of southwest and
the North China Plain, where annual rainfall ranges from 400 to 1000 mm, irrigation
needs vary annually and seasonally depending on the frequency and neverity of the
monsoon. In the middle and lower stretches of the Yantze River, parts of the east,
south and southeast where annual rainfall exceeds 1000 mm, irrigation is required
only to supplement rainfall.
Institutional Aspects of Irrigation
1.6 Water Resource Agencies. As a principal department for water
administration under the State Council, the central Ministry of Water Resources
(MWR) is responsible for the overall water resources management - improvement and
Jevelopment of major rivers, planning of water resources for major city water
supply, basic construction of farmland irrigation facilities, water/soil
conservancy, rural hydro-electricity supply, and construction and management of
large and medium-size reservoirs used primarily for flood control, irrigation, water
supply and rual hydro-electricity. The MWR employs about 1,337,000 workers'
nationwide, approximately 7.5% of whom work directly under the MWR and 92.5% of whom
work under provincial and local governments. The MWR also directly supervises the
Water Resources and Hydroelectric Power Construction Corporation, and administers
thirteen institutions of higher education and seven regional river basin
commissions .2
1.7 Each Province maintains a Water Resource Bureau (WRB), responsible for
the planning, survey, design, construction, operation and management of irrigation,
drainage, flood control worksand rural hydro-electricity. Designs for major
projects are prepared by the survey and design institutes of the provincial WRBas
projects covering areas larger than 20,000 ha must be approved by the MWR. The
provincial WRBs put forward annual water allocation schedules for major rivers,
which are aggregated from prefectural and county proposals. The WRBs also handle
actual water diversion for all rivers except the Yellow River, whose use is
controlled directly by the Yellow River Commission. Capital construction companies
under WRB control used to handle all construction works, although part of the job
might be sub-contracted to lower-level units. over the last several years, the MWR
has encouraged the WRBs to permit competitive bidding for all but the smallest
projects.
1.8 WRBs at the prefecture and county levels are directly responsible for
the construction and maintenance of most canals, associated irrigation and flood
control structures and medium-size reservoirs. Townships and villages share
' Of which about 267,620 are female employees and 230,340 are engineering and technical suff.
2 Ths even commissions cover tde Yangtze, Yellow, Huai, K&i, Pearl, and Songhua/Lao Rivers and Taihu Lake Basin.
3
responsibility for constructing and maintaining branch ca.aals, ancillary works, andsmall reservoirs. Staff of the prefectural and county water resource bureaus areorganized into irrigation areas or districts responsible for operating andmaintaining projects, planning and distributing water, and levying water charges.At the township and village level, water users elect members to canal committees.These committees handle on-farm water management under the direction of irrigationdistrict staff.
1.9 Water Resource Financing. Project funding for water resourcedevelopment involving major river diversion or control and/or central governmentfunding must be approved by the State Planning Commission (SPC). This approval ismade in accordance with annual anid five-year plans and 'hen is channeled through theMWR to the provinces involved. In 1980, when state investment in w4ter resourceswas reduced, emphasis shifted away from new irrigation developments to therehabilitation of existing projects. At the same time, provincial and localgovernments began to assume more responsibility for initiating and fundinginvestments and operating and maintaining water resource projects. Before 1980,water charges were kept well below cost recovery. After 1980, policy shifts andrising producer prices and incomes led the MWR to encourage the WRBs to experimentwith increasing water c'iarges. In 1985, the GOC prescribed a policy requiring allindustrial, municipal and agricultural end-users to pay water charges based on fullrecovery of water supply costs. These costs included operation and managementexpenses, major repair costs, and depreciation. At the same time, the MWRreestablished obligations of local jurisdictions for contributed labor and wages inwater resource projects, requirements which had been permitted to lapse during theearly 1980s. Between 1984 and 1987, 19 provinces enacted their own regulationspertaining to water charges and conti.ibuted labor.
1.10 The new water charge systems have several drawbacks, however. First,the provincially mandated water charges are set below national levels and are notrevised regularly. As a result, inflation has rapidly eroded their real value.Second, prefectures and counties continue to enjoy considerable flexibility insetting water charges. This flexibility give rise to inconsistent or unrealisticstandards of maintenance and repair, and allows billings to fall below both nationaland provincial levels. The MWR estimates that assessed agricultural water charge
levels in 1988 were only 40% of national standards, excluding projects managed bycollectives or individuals below the township level. Third, collecting watercharges continues to be a problem. In Anhui recent collection rates were only 50-60% of billings and after Shandong raised agricultural water charges in 1988,collection levels fell from nearly 100% to only 44%.
1.11 Water Lecislation. China's Water Law, promulgated in April 1988,establishes principles for water resource development, affirms the existinginstitutional setting, sets general guidelines, and confirms technical standardspertaining to the survey, design, construction, operation and management of thewater resource sector. The law also reinforces the principles and standards ofwater fee assessments, including a new water resource fee to be assessed in areas ofcompeting public and private interests, and determines legal jurisdiction, waterrights, methods for conflict arbitration, and penalties for violators. Although inpractice this law has been fairly ineffective, it does uphold the principle ofcomprehensive control over scarce water resources and beneficiary responsibility forthe financing of water resources project operation, maintenance, and capital costs.The MWR plans to establish a complete national water administration to enforce thenew Water Law by 1991. So far, water supervisors and security personnel have beenset up in one-third of China's counties to help execute the Water Law with the help

4
of local authorities.
1.12 Current Constraints in Irriaated agriculture. Despite past succesSe3,China now faces numerous problems in the irrigation sector. Many of the largeschemes constructed in the 1950c and 1960s were hastily designed and built with lowquality materials and equipment. Most now require major uApgrading or
rehabilitation. Many of the echemes still lack drainage and irrigation networks atthe tertiary and farm level--networks which were to have been constructed by localgovernments. Large t2lcts of cultivated land have been affected by waterlogging andsecondary soil salinization as a result of excessive irrigation without effectivedrainage to control the rise of the water table. Because improvement works must beplanned and implemented in an integrated manner for large contiguous blocks of land,large investments are needed. The uncontrolled construction of tubewells, promptedby gcvernment subsidies, th. low capital cost of construction and equipment, and lowelectricity charges for pumping has led to over-exploitation of groundwater,excessive drawdown of the water level and land subsidence, particularly in theNorth China Plain. Operation and maintenance have been inadequate in many areas.Resources allocated by the central and provincial governments frequently have notbeen matched adequately by funding from the counties and townships. The investmentin and maintenance of on-farm facilities, formerly a communal responsibility duringthe slack winter season, has been disrupted by the introduction of the householdproduction responsibility system, under which households tend to look after theircontracted interests. Measures to alleviate some of these problems were curtailed
by cutq in the Government budget for irrigation beginning in 1980. State capitaliavestment in irrigation has rebounded somewhat since 1985 but still falls short of
pre-1980 levels. The develoFment of new water resources has not kept pace with thegrowth in water demand from agri7ulture, industry, and urban centers.
1.13 China has achievad notable success in its support services sector, buthere also there is much room for improvement, particularly on the low-yield andmedium-yield lands.3 Many of these lands contain problem soils which are low infer.ility (N and P), and subject to frequent drought, flooding and waterlogging.The prolonged use of farm machinery also has resulted in the creation of a hard pan10 to 20 cm below the soil surface. A major program is under way to upgrade andstrengthen the extension services in the country. However, so far, only about one-
third of the 2,300 counties have established agrotechnical extension centers and 20%
of the counties have no formal extension prograrm at all. ExtensA.on services need to
move towards a client-supplier relationship, and offer a better quality service toproducers. Linkages among research, training and extension remain very weak.
1.14 Seeds production and agromachinery services also need improving. Longrange plans call for upgrading some 300 seed centers throughout China, but so faronly 18 have been modernized, under the IDA-financed Seeds Project (Credit 1577-CHA). Quality control for seed production is inadequate and varietal purity hasbecome a problem in some areas. Many of the county seed companies are poorlyequipped and lack facilities such as seed stores, drying floors, laboratories,garages and transport vehicles. The extension and demonstration of quality seeds
has been neglected. Agromachinery service centers are becoming increasinglyimportant in helping to maintain small tractors, the type most commonly owned by
farm households. The-e are some 37,000 collectively operated mechanization centersproviding service to individual farmers. The centers also provide training to
3 Low-yield land refers to eas with *nnual grain production below 2.6 t/hb, medium-yield land to areas witb producdon from2.6 to 3.8 t/ha.
5
operators of medium and large machinery used for land improvemant. Most of thecenters still function with weak management, outdated facilities, and inadequatetools and equipment.
Policies and Plans for-Grain Productign
1.15 The Government plans to increase total grain production by 25%--from 400million to 500 million tons--by the year 2000. This increase is required not onlyto feed the growing population, but also to provide raw mat-rials for livestock fedand other agro-processing activities. After experiencing extraordinary growthbetween 1979 and 1984, grain production stagnated at about 400 million tons per yearsince 1984. 4Although the changes in the incentive system brought about large one-time increases in output, there is little room for effecting additional increasespurely through new policy reforms. Most of the availabli land already has beenbrought under cultivation, and newly reclaimed and irrigated areas generally areoffset by the conversion of cultivated areas to non-agricultural use. The plannedincrease in grain production therefore must come largely from increased yields onland already under cultivation.
1.16 Under the GOC's plan, about 70 million of the 100 million tons of griiinrequired would be produced on irrigated land. Some 2.6 million ha of already high-yielding irrigated land could be further improved through the use of superiorvarieties, more fertilizer, and scientific and technological improvements. Onanother 12 million ha, the improvement of irrigation facilities could raise yieldsfrom low and medium levels to higher, more stable levels. Finally, some 2.6 millionha now under rainfed cultivation could be brought under irrigation. The remaining30 million tons of incremental grain production would come from improvements indrainage, land preparation, fertilization, and cultural practices in rainfed areas.
1.17 Bringing new land under irrigation entails high capital costs. Becauseof this, the Government is attempting to increase production by upgrading andrehabilitating existing irrigation facilitiee. The potential for doing this variesby region. The south, with its high rainfall, may have already reached its fullyield potential. Along the Yellow River, available water supplies for irrigationare increasingly constrained. Some locations in the northwest have promisingpotential, but the area is sparsely populatod and has poor transport links with themajor markets. The North China Plain (NCP), with its good transport links andfavorable soil and climatic conditions, has the greatest potential for yieldincreases. This area could potentially produce an additional 25 million tons ofgrain ant: ally and therefore is key to achieving the overall production objective.Indeed, ooveloping grain bases in the NCP is a priority in both the Seventh andEighth Five-year Plans (1986-90 and 1991-199S). Moreover, the GOC recentlyestablished an Agricultural Development Fund (ADF)s to promote investment inselected areas6; the NCP is listed as the first of such areas to benefit from thisfund.
' Due to favorable weather, a record harvest of 437 million tons was achieved in 1990.
I Th ADF, esablished under the Ministry of Fmince, utilizes funds collectod from the acquisition/utilization of aicultura lands todevelop compensating lands for agricuture.
' 'hese arma include the NCP, Songliao Plain, Four Lagues in Eautern Inner Mongol; Southem Hunan, Southwest Jiangxi, Hetao,Hexi Corridor, Jianphn Plain nd coasl areas in south and southeast China.
6
Agricultur. in the North China Plain
1. 18 The North China Plain (NC? )7 is China's most important agricultural
region. It covers about 19.3 million ha of cultivable land in five provinces--
Anhui, Hebei, Henan, Jiangsu, Shandong--and two cities--Beijing and Tianjin. The
NCP has cropping intensity of 1.55% and a cropped area of 29.8 million ha. About
77% of this area is under food grains, of which the NCP produces some 83 million
tons per year, or 20% of China's total production. Wheat is the main food grain
produced, accounting for 37.5 million tons, or 44% of national production. Cotton
is the area's most important cash crop. It is grown from April to November/December
on about 9% of the cropped area and yields about 2.4 million tons of ginned cotton
per year (57% of total national output). The NCP area also is important for
oilseeds, producing about 3.6 million tons (17% of national output) on 1.8 million
ha. The cropping pattern in most of the NCP area is wheat based. Wheat is grown
from mid-September to the end of May or early June. Corn, soybean and peanuts are
planted as soon as the wheat is harvested, from late April to mid-June. Oilseeds
(mainly rapeseed) are grown from early September to late May. Rice is grown between
April and September, on Shajiang black soil which is a heavy clay soil with very low
permeability.
1.19 About 55% of the NCP's cultivated area--10.6 million ha--is irrigated.
As a result of extensive investments starting in the 1950s, most surface water in
the NCP is subject to some control and 70% of all groundwater is extracted. The NCP
has about 250 medium and large reservoirs, 1.8 million tubewells, and a preliminary
network of agricultural support services at the county and lower levels. Despite
these advantages, however, about 80% (16.3 million ha) of the NCP's land area is
classified as low and medium yielding. Some 2.4 million ha are affected by
salinity, 2.3 million ha by waterlogging, and 1.4 million ha by sandy soils. Up to
half of the runoff from major rivers is lost as a result of uncontrolled runoff
during the flood and rainy seasons. Moreover, increases in population density and
rapid economic growth have increased the demand for water in agricultural uses.
Limited water resources--already exploited to the maximum in some areas--coupled
with aging and incomplete water delivery systems, place serious constraints on the
future development of agriculture in the area. To address these constraints the
Government plans to invest further in water conservation measures which will improve
the efficiency of water utilization.
1.20 By the year 2000, the Government plans to improve and expand irrigation
and drainage facilities on some 15.6 million ha of existing low- and medium-yield
lands and reclaim about 1.7 million ha of wasteland for crops, forestry, and
livestock. As a result of these actions, the output of grain, cotton, and oilseeds
is expected to increase by 2.7%, 3.3%, and 3.1%, annually between 1988 and 2000.
Bank GrouD Strateog and Role in Irricated Aariculture
1.21 The Bank Group's main strategy for lending to China's agricultural
sector has been to suuport her long-term ob;ectives to increase production of food,
feed, industrial crops and animal products to meet demands created by population and
income growth, and to increase income and employment opportunities in rural areas.
The Bank Group has supported to-date 25 operations involving a total assistance of
about US$2.7 billion in the agricultural sector. Of this, about US$820 million is
for irrigated agriculture which focuses on land devilopment, irrigation and
' Abo commownly knon as HusaagpHuai-Hai (3H) Plain, rmferdrg to the Yellow River in its center, the Huai River to its south, and the
Hai River to its north.

7
drainage, and upgrading of agricultural support services. Of particularsignificance in this context is the North China Plain Agriculture Project (Credit1261-CHA), the second Bank Group operation in China and the firat agriculturaloperation. This project successfully introduced integrated irrigation/drainage andagricultural intensification in nine counties -- three in each of Shandong, Anhuiand Henan Provinces. The project encompassed the development of soil and waterresources, rural infrastructure, crops, forestry, and small scale agro-processingand village enterprises. The cropping intensity in the project area increased from138% to 163%, and extraordinary yield increased were recorded and sustained. Theeconomic benefits of the project exceeded those anticipated at appraisal; the ex2ost ERR was 56%.
1.22 Some of the highly successful project features of the North China PlainAgriculture Project have been adopted (with appropriate modifications) in theplanning and design of the proposed project. These include: techniques forreclaiming land affected by salinity and waterlogging; development of appropriatecropping pattern; guideline for the establishment of shelter belts, windbreaks, andborder rows; and organizational arrangements for project implementation andmanagement. The scil/water study results also provided a basis for evaluatinq thephysical impact of project works. Project implementation experience and lessonslearnt have been reflected in the design of the project. These include: use oftechniques and technologies well tested locally and readily acceptable to farmers,early establishment of a highly decentralized project management structure withfully-staffed county FMOs playing the leading role; active participation by villageand township levels in the initial planning and design of project activities; andcreation of sense of "project ownership" among project beneficiaries through laborcontribution for earthwork construction and O&M works.
1.23 Other lending operations for irrigated agriculture in China include the:Pishihang-Chaohu Area Development Project (Loan/Credit 2579/1606-CHA), NorthernIrrigation Project (Credit 1885-CHA), Shaanxi Agricultural Development Project(Credit 1997-CHA), Shandong Agricultural Development Project (Credit 2017-CHA), andHebei Agricultural Development Project (Credit 2159-CHA). The last three projectsare in the early stages of implementation and most of their physical works have beencompleted on time or ahead of schedule. Disbursements also have been close toappraisal estimates. Notable features of the projects are the high standard ofcompleted project works, the enthusiastic participation of farmers, and theeffective collaboration of project staff at all levels.
Rationale for Bank Group Involvement
1.24 The proposed project would support the GOC's plan to increase theproduction of staple grains. This is the Government's highest priority for theagriculture sector, and the NCP is the area with the greatest potential to addressthat priority. The Bank's previous experience in this region confirms the region'shigh potential for yield increases. The Bank's support for crop production andpeasant agriculture in the past has been directed primarily to projects inindividual provinces. The present project, by contrast, addresses crop productionproblems over a large geographical area spanning three Provinces. This makes itpossible for the project to have a broader impact than in provincial projects, andto introduce an integrated package of investments and inputs throughout the relevantagro-climatic zone. By increasing the agricultural productivity of large tracts oflow- and medium-yield lands, the project would ameliorate poverty for some 2.8million farm families and thereby address the income imbalance in the threeProvinces (paras. 2.7 and 2.8).
8
1I1 TEE PROJECT ARCAS
Location
2.1 The project would be located in 73 counties spanning 3 provinces.
These include 28 counties in the south and southwest of Shandong, 21 counties
the north and northwest of Anhui, and 24 counties in northern Jiangsu. A list
of the counties is presented in Annex 1, Table 2. The three Provinces and 73
counties have boon selected according to three criteria. First, these areas
already have basic irrigation and drainage facilities in pl&ce. Second, the
areas have large areas of low- and medium-yield land in contiguous blocks with
the potential for yield increaset Third, the local governments and farmers
in the area are highly committed to the project. The project area lies in the
coastal plain of the Huai River Basin, which is bounded by the Yellow River to
the north and the Huai River to the south (See IBRD Map 22448). The project
has a total land area of about 2 million ha and cultivable land of about 1.1
million ha. The project area constitutes about one-third of the North China
Plain. Additional data about the project area are given in Annex 1, Table 1.
Climate. Toggoraphv and Soils
2.2 The project area has a continental monsoon climate. Temperatures
range from 400 C in the summer to -20° C in the winter; the annual mean
temperature is 120 to 150 C. There are 200 to 220 frost-free days a year, and
the annual average rainfall ranges from 620 mm to 1,000 mm. About 60% of the
annual precipitation occurs during the monsoon period between June and
September, frequently giving rise to waterlogging and flooding. Rainfall
distribution is uneven both seasonally and annually, and make the project area
prone to drought during spring and autumn, and flooding in summer.' Annual
evaporation averages 1,000 to 1,200 mm. The area enjoys strong solar
radiation (110-120 kilocalories/sq cm), and long periods of sunshine (2,000 to
2,600 hours annually). Climatic data for the project area covering the three
Provinces are summarized in Annex 1, Table 3.
2.3 The project is sited on a flat alluvial plain--the forme river
course and flood plain of the Yellow River. The plain has very little relief,
except for a few small hills scattered along the northeastern section. The
land slopes from west-northwest at the foothills of the Yan and Taihang/Funiu
Mountains, where the elevation is about 50 m, downward to the So and Yellow
Seas, where the elevation is less than 10 m. The slope ranges between 1:
5,000 and 1 10,000. Surface drainage is sluggish and the land is easily
waterlogged.
2.4 There are five principal soil types in the project area --mottled
sodic soil (26% of the project area), Shajiang black soil (38%), coarse to
medium-grained silty loam (19%), brown meadow soil (12%), and sandy soil (5%).
Most of the soils are low in fertility, deficient in nitrogen and phosphorous
(<5 ppm) and low in organic matter content (0.5 - 1.0%), with pH values
ranging from 6.5 to 8.0. When provided with adequate drainage, most of the
I Data on tc number of hectares damaged each year by drought and wateroSging in Shandong, Anhui and Jiangsu provinces between
1970 and 1988 an. presented in Annex I Table 4.
9
soil types are well suited to wheat, corn, and cotton production. With properirrigation rice can also be grown on Shajiang black soil.
Population. Labor, Farm Sizo and Land Us.
2.5 The project area has about 2.8 million farm families with anaverage family size of 4 persons. This amounts to 11.2 million farm dwellers,or 93% of the total population in the project area (See Annex 1, Table 1).The rural labor force of the project area includes 5.3 million persons, ornearly 7% of the the total rural labor force in the three Provinces. Atpresent, the rural labor force in the project area is estimated to be 30-40%underemployed. Women comprise somewhat less than half of the rural laborforce,2 Farm women are generally responsible for fertilizer application,weeding and hoeing, plant protection, drying, and collection of fuel wood.However, they also participate in most other farming tasks, particularly,harvest activities. The average farm size is 0.4 ha. On this small area atypical household will raise wheat, sweet potato, rape or cotton in thewinter, and paddy, corn, or oil crops in the summer. Farmers practice doublecropping or plant three crops in two years.3 Most families also rear chickensand pigs for their own consumption.
2.6 Forest cover ranges from 10% to 15% in the project areas.4 Mostof the trees have been planted as shelter belts, border rows, and windbreaksalong roads, canals, and drains. Poplars, locust, Chinese elm, Paulownia, andMetaseauoia are the most commonly planted species. Village households areresponsible for establishing, maintaining, and caring for trees, as theyderive most (70-80%) of the profit from sales of the harvested timber.Project counties can benefit from the experience in establishing forest covergained under the North China Plain Agriculture Project and in pilot projectareas of the NCP. Local Forestry Bureau offices are responsible for planningand organizing farmers in the development of forest belts in the project area.Most townships also have established nurseries.
Rural Incomes and Poverty
2.7 Rural Incomes. Unlike elsewhere in the three Provinces there arerelatively few sources of off-farm income in the project areas, nearly 70% ofon-farm income is derived from crop produ_.tion and about 20% is derived fromlivestock rearing.5 In 1988, the average rural per capita income in theproject area was Y470 (US$100), 75% of the average for the three Provinces and86% of the average for all of China. The average per capita rural income inthe 7iangsu project area that year was Y509 (US$108), significantly less thanin Jiangsu Province overall (Y797) and just 42% of .Yiangsu's urban per capitaincome. In Anhui the average per capita rural income in the project area thatyear was Y377 (US$80), 10% below the average for the project counties and just78% of the provincial average. In Shandong, the average per capita rural
2 In Shandong project areas women comprise only 41 % of the labor force.
3 7he avenge multiple cropping index is 166%.
4 Jiangsu 10%, Shandong 12%, and Anhui 15%.
In 1988, the followingwas the compositionofGross Value of Agricultural Output in theproject aeas: coppig69%, livestock 19%,sidelines 8%, forestry 2% and fisheries 2%, swe Annex 1, Table 1,

10
income in the project area was Y491 (US$104), 16% lower than the provincialaverage of Y583 (US$124).
2.8 Rural Poverty. However, even these relatively disaggregatedaverages obscure the extreme poverty and consequent social ills--poor housing,inadequate diets, illiteracy, and health problems--found in selected projectareas. For example, in the well irrigated project areas in Haze prefecture inShandong, rural per capita income is only Y339 (US$65), 54% of the average inthe three Provinces and 62% of the national average.' Similarly, in severalAnhui project areas, rural per capita incomes are far below the average forproject areas in the Province. In Mengcheng county project areas, rural percapita income in 1988 averaged Y203 (US$39), 54% of the average for theproject areas in the Province, 43% of the average for project areas in thethree Provinces, and only 37% of the national average.7 In the Guannan countyproject areas of Jiangsu Province, rural per capita income in 1988 was Y252(USS48), 50% of the average for project areas in the Province, 54% of theaverage for project areas in the three Provinces, and 46% of the nationalaverage.8 It is remarkable that such poverty exists within three of China'swealthier provinces. Rural per capita income in the three Provinces, overallis much higher than in these selected project areas.
2.9 The rural poverty observed in selected project areas of the threeProvinces can be attributed to four conditions: (a) poor natural resourceendowments -- infertile lands with limited water resources; (b) susceptibilityto floods, drought, and unpredictably severe weather; (c) poor infrastructureand communications, which restricts opportunities to learn about newagricultural technologies; and (d) an underdeveloped commercialinfrastructure, which limits incentives for farm production.
Auricultural Develooment
2.10 About 1.14 million ha of the project area is cultivated, and ofthis cultivated area about 45% is either fully or partially irrigated. Theoverall cropping intensity is 1.65. About 1.52 million ha (including coarsegrains) is sown to food grains, primarily wheat and corn, and 48% of the sownarea is under partial irrigation. Per capita grain production is about 475kg. This is slightly more than the provincial average (443 kg) because of thenet surplus of grain in Jiangsu and Anhui (see para. 5.5). Cotton is thesecond most important crop in the project area. It covers about 146,600 ha,55% of which is under irrigation. Other crops include oilseeds (rape andpeanut) on about 88,500 ha, and vegetables and fruits on 57,500 ha. The areasand yields of major crops are summarized in Table 2.1 below.
6 In addition, 9% of the population age 15-40 is illiterate, rural housing is provided mostly in the form of mud homes, clinics areinsufficient, and 3-S young men in every village seem to experience difficulty finding wives as young Heze women prefer to marry out and othernon-Heze women opt not to marry in.
7 In Wngshang county project areas, rural pce. capita income in 1988 was Y238 (USS50); in Funan county project areas, Y255(USS54); and in Linquan county project areas, Y262 (USS56). These ures represent 44%, 47% and 48% of the national average, respectively.
8 Other poor project areas in Jiangsu include Xlanrlhui, Liangshud, Suineng and Shuyang counties, with rural per .apita incomes ofY352 (44% of Jiangsu's rural per capita average), Y379 (48%), Y392 (49%) and Y395 (50%), respectively.

11
Table 2.1: Area and Yield of Maior Crope
Cropoed Area % Irria. Yield(000 ha) (t/ha)
Wheat 755.7 44 3.7
Corn 248.9 69 4.2
Rice 149.6 100 5.7
Cotton 146.6 55 0.8
Oilseeds 88.5 41 1.7
Vegetables/Melons 57.5 50 29.2
2.11 There is potential for increasing the yields of the crops listedabove. In 1984, the Science and Technology Commission and the Ministry ofAgriculture appointed the Agricultural Economic Research Institute, CAAS, to
carry out research on production constraints in the North China Plain. Twentypilot areas were selected for integrated research on crop husbandry, croppingpatterns and rotations, soil improvement, quality seeds, irrigation anddrainage works, green manure/fodder in rotation, and the establishment ofshelter belts and windbreaks. The results show that yields of food grain onresearch plots can be up to 75% higher than those noted above. Even onextension plots managed by farmers, yields can be increased by as much as 35%for food grain as well as for cotton.
2.12 As shown in Table 2.1, the main crops grown in the project areasare food grains (80%), cotton (7%), and cash crops (13%)--mainly peanuts,oilseeds, vegetables, and fruits. The principal crop rotation in the rainfedareas is winter wheat followed by course grains or sweet potato. Rainfedcotton covers about 5% of the area. For partially irrigated areas the mostprevalent cropping pattern is winter wheat followed by corn, soybean, orpeanuts.
2.13 The yields of most crops are below average for the province. Theyields of wheat vary from 3.0 to 3.8 t/ha in lower yielding rainfed areas to3.7 to 4.0 t/ha in partially irrigated areas. Cotton shows little variationin yield between rainfed and partially irrigated areas, averaging 0.8 t/ha(lint cotton) under both conditions. The low yields are mainly attributed topoor soil fertility, less than optimum inputs such as fertilizers, and lack ofimproved varieties. The fertilizer efficiency rate is only about 30% (halfthat of developed countries). There is a need for more site specificvarieties. The number of improved varieties developed in still insufficientto cater to the different soil types, climatic conditions, and resistancerequired to major pests. Most farmers still continue to use their own seeds--a practice which reduces the quality of materials--and county seed companiescan only meet a fraction of the demand for seeds. Hybrid seeds, on the otherhand, are gaining popularity among farmers. Although much has beenaccomplished in developing improved varieties of hybrid food grain and cottonseeds, much more remains to be done in exploiting the superior geneticmaterials found locally and overseas.
12
2.14 A good start has been made in applying integrated pest management
(IPM) on a number of important psts and diseases. This has been done by
combining cultural practices, resistant varieties, seed treatment, biological,
and physical barrLers, and chemical application based on economic thresholds.
Results to date have been encouraging, although the area covered is still
limited and needs to be extended.
2.15 In the project area, mechanization will continue to complement
draft power, which still plays an important role in some farm operations and
serves as an important source of organic manure and meat. The increase in
mechanization is mainly needed to overcome farmers' constraints during the
peak labor demaad period. The rapid growth of private ownership of small
tractors in the project area has increased the demand for spare parts,
implements/accessories, service, maintenance, repains, and fuel supply. This
increase in demand is placing a heavy strain on the resources of township farm
machinery stations.
Water Resources and Irrigation
2.16 Surface Water Resources. The surface water system of the project
area is shown in Figure No.l. The project area is drained by two major river
systems: the Huai and the Yishusi. The Huai flows from west to east through
Henan, Anhui and northern Jiangsu Provinces and drains into the regulated
Hongze Lake. From Hongze Lake, water flows through a large number of natural
and constructed channels north and east into the Yellow Sea. The Huai is
intensively regulated for flood control: there are 16 major reservoirs in the
upper reaches and numerous flood control detention basins and embankments
along the middle reaches. In addition, the nearly completed high-level
Cihuaxinhe flood channel will divert flood water from the middle reaches
directly to the Hongze Lake, and a similar second channel, the Huaixinhe, is
being planned. While flood control on the main channel now has reached a
satisfactory standard of 1 in 40 to 50 years, flood control on the tributaries
is less than 1 in 20 years and require further improvements.9 The Yishusi
River System (comprising the Yi, Shu and Si Rivers) originates from the Yimeng
Mountain area in Shandong Province and flows southward into Jiangsu Province
and then eastward to the Yellow Sea. The total catchment area is about 79,000
sq km. Major flooding has been regulated through completion of 18 flood
control reservoirs in the upper catchment areas of the Yi and Shu Rivers. On
the plain, dikes also have been built around Nansi Lake and Luoma Lake for
flood detention.
2.17 Hongze Lake plays an important role in surface water management in
the project area. It acts as a reservoir both for storing water for
irrigation and regulating floods during the monsoon. As the lake is located
on a plain, raising the water level to provide additional storage would
submerge large tracts of cultivated land in Anhui Province and dislodge many
farming families. Raising the water level also would require strengthening
the existing perimeter dike and reconstructing many structures--requirements
which make the proposal economically and socially unacceptable.
2.18 Nansi Lake was developed out of an inland marsh in the late 1950s
for flood regulation, irrigation, aquaculture and navigation. It has a total
9 See design standards for flood control and drainage in Annex I Table 5.

13
water surface area of 1,266 sq km and is divided by a dam into an upper lake(Nanyang and Dushan Lakes) and a lower lake (Zhaoyang and Weishan Lakes). TheLake provides irrigation water to about 233,000 ha in Shandong Provincethrough 1,268 pumping stations. Over the last 14 years, the water in the lakehas been depleted by annual droughts and excessive extraction of water.During the last two years the upper lake has virtually dried up and showed nosigns of recovering. As a result, agriculttiral losses have steadily mounted.To avert a crisis in agricultural and industrial production, beginning in 1987water was diverted from the Yellow River through the intake gates of theGuonali and Chengkai Irrigation Areas. This temporary diversion system cannotbe sustained because it interferes with the normal operation of the twoirrigation areas and causes their limited conveyance canals and silt retentionbasins to be silted up.
2.19 The Grand Canal, which links the Yangtze and the Yellow Rivers,runs north-south through the project area in Jiangsu and Shandong. Originallybuilt in the 6th century AD to transport grain from Yangtze Valley to northernChina, it began transferring water from the Yangtze River to the northern partof Jiangsu after the Jiangdu Main Pumping Station was constructed in the1963s. The transfer system, regulated by a series of lakes, provided muchneeded water for irrigation, navigation, and municipal and industrial uses.After further expansion during the 1970s, the 9-stage pumping scheme nowtransfers, stores, and distributes water along the Grand Canal up to WeishanLake in Shandong Province (see Map IBRD No. 22448). With increasing regionaldemands for water coupled with the low equipment efficiency and restrictedcapacity of some of the intermediate pumping stations between Hongze and LuomaLakes, the current water shortage in North Jiangsu is estimated at about 2.0billion cu m during the critical period of April to June (with about 50%occurring in June).
2.20 The capacity improvements to the Grand Canal proposed under theproject represent part of the national long-term plan to transfer water fromthe YangtL4 River to the water-deficient regions of northern China. Theeastern alignment of SNWT generally follow the Grand Canal route northward toNansi and Dongping Lakes through a 13-stage pumping process. There it willcross the Yellow River by an inverted siphon tunneled 70 m below bed level toHebei Province and by gravity flow to Tianjin. A feasibility study forinitial water transfer up to the southern bank of the Yellow River wasinitiated in 1973, reviewed in 1976, and approved by the State Council in1983. Further review was carried out in 1988 to extend the water transferplan across the Yellow River to Hebei and Tianjin. Given the critical watershortages north of the Yellow River, a plan is being finalized to initiate the"launch phase" under the 8th Five-Year Plan. This would take advantage of theimproved conveying capacity of the Grand Canal under this project to liftwater from the Yangtze River during the non-irrigation season (November toMarch) in Jiangsu and store the water in Nansi and Dongping Lake for transferacross the Yellow River to Hebei and Tianjin. The short- and long-term planproposals are summarized in Table 2.2 below:
2.21 Surface Water Irrication. Surface water irrigation already isextensive throughout the project area. It is based on a complex and highlyregulated network of reservoirs and channels. The Huai River is the backboneof the system. The westernmost part of the project area, in Anhui Province,lies on the northern bank of the Huai's middle reaches. There are elevenmajor control gates and 3,600 pumping stations along this part of the river

14Table 2.2 South-North Water Transfer - Eastern Alignment
South-North Long-tern Short-tern Short-trem lit Stage PresentWater Beyond Ist Stage 2nd Stage LAunch OrndTmnsfe Year 2020 (to 2010) (to 20201 (to 2000) Can1l
(cu m/ac2 (cu m/sec) tcu m/sec) (cu m/ec)YangecDiversion 1,400 600 1,000 400 400
To Nansi Lake 650 250-300 550-600 155\a nominal
Across YellowRiver 700 150-200 400 50\b 0
To Hebei Prov.and Tianjin 250 100 180 15-20 0
\a: pumping during non-irrigation season from November to March.\b: primarily for industrial and domestic water-supply.
and its channels. These permit irrigation of some 617,000 ha, or 28% of thetotal cultivated land area in northern Anhui. Many parts of the system areincomplete or have deteriorated due to age and poor maintenance. Moreover,each year large areas of cropland are affected by flood, waterlogging anddrought. Although systematic drainage works have been undertaken since 1980,60% of the land, affected by poor drainage and waterlogging still requiresimprovement. Therefore, development here will focus on upgrading, extendingand rehabilitating the irrigation system and extending the complementarydrainage network.
2.22 Further downstream to the east on the Huai River, the project areaenters northern Jiangsu Province. Here some 1.2 million ha are underirrigation - only 67% of the designed area. The major source of irrigation isthe Grand Canal's 9-stage pumping scheme described in para. 2.19. The HuaiRiver and its channels are a secondary irrigation source. Further developmentis constrained by three factors. First, the limited capacities of t.e_ GrandCanal and existing reservoirs, coupled with flow variation in the Huai Riverduring normal and dry years, restricts the total supply of water. The limitedwater supply results in competition for municipal, industrial, andnavigational uses. Downstream water to flush river outlet and drainagechannels has been reduced, resulting in channel siltation, outlet blockage,and poor land drainage. Second, the standard of flood control and drainageremains low. Many channels and lakes have flood control standards varyingfrom 1 in 10 to 15 years. The main channels of the Huai River, the YishusiRiver, and other flood relief channels flow through North Jiangsu, which isflat and low lying. Frequent waterlogging and poor drainage during rainyyears affect 733,000 ha of cultivated land, resulting in low and unstableyields. Finally, due to the lack of a comprehensive maintenance program, manyof the irrigation facilities are aged and deteriorating. The result is lowoperation efficiency and excessive energy consumption in pumping. Inadequatefacilities in 40% of the irrigation schemes prohibit proper water management.
2.23 The northernmost part of the project area lies in ShandongProvince. Surface water irrigation in Shandong Province has developed mainlythrough river diversion around Nansi Lake and along the southern bank of theYellow River. The virtual desiccation of Nansi Lake during the last threeyears has reduced the irrigated area from 230,000 ha to 160,000 ha.Agricultural and aquacultural production have been curtailed. The Xiezhai

15
Irrigation Area uses water diverted from the Yellow River to irriga,.e about10,000 ha of land. This area represents less than half of the designed 24,000ha, as the irrigation system has not been completed. Expansion of existingfacilities would provide irrigation to an additional, currently rainfed, areaof 36,000 ha. The 32,000 ha of irrigation facilities in the Shengli QuIrrigation Area are in need of upgrading, rehabilitation, and extension.These facilities make use of water regualted in the Weishan Lake.
2.24 Groundwater Resources. In the NCP, ground water is found mostlyin sand and gravel beds, and in patches of loamy sand within quaternaryformations. Layers of shallow, fresh, and salt water, and deep fresh waterare found throughout most of the plain. The shallow aquifer is the mainsource of irrigation water in the project area. About 80% of the resource isrecharged by rainfall. Lateral flows and irrigation return flow contributeequally to the remainder of the resource regeneration. The average depth ofthe groundwater over the year is 2 to 8 meters below ground level, but thereare significant variations across the project area.
2.25 Groundwater Irriaation. In 1972, there was a major drought in theNorth China Plain. Subsequently, a crash p-ogram was launched to sink twomillion tubewells. Many of the tubewells were constructed without adequateplanning and were installed with inferior equipment. Most of the tubewells inthe project area are located in the northwest and northern part of Anhui andto the east of Nansi Lake in Shandong. In Anhui, ground water extraction issignificantly below potential -- 39,000 of the 110,000 tubewells are onlyoperational. The rest are inoperative due to clogged wells, bad siting, ordamaged or obsolete installations. In Shandong, by contrast, the present rateof extraction already exceeds the recharge rate. The project here will focuson reducing the number of wells and introducing water saving techniques.Reducing the number of wells will allow for more optimal sizing and spacing ofwells in relation to the aquifer yield. The project areas in northern Jiangsuhave fewer tubewells due to unfavorable hydrogeological conditions which limitgroundwater resources. Extraction there is about 50 percent of potential, andthe project would only increase the rate of extraction marginally.
Institutional Sunoort
2.26 Irrication Desian and Research. The three project Provinces havestrong institutional support in preparing and executing water resourceprojects. Each Province has its own Investigation and Design Institute underthe Provincial Bureau of Water Resources. These institutes are fully staffedwith professional and technical employees. The Provinces also have institutesand experimental stations carrying out research on irrigation techniques, cropwater requirements, and the drainage needs of different types of crops andsoils. In Anhui Province, the Provincial Water Conservancy ScientificResearch Institute (with 234 staff), the Xinmaqiao Integrated On-farmIrrigation Experimental Station, the Wudakou Drainage Experimental Station andeight crop irrigation experimental stations have accumulated valuable resultson irrigation, drainage, waterlogging and the treatment of Shajiang Blacksoil, the predominant soil in Anhui project areas. In Shandong, the researcheffort is focussed on water-saving irrigation techniques, and the treatmentand disposal of sand and silt accumulated in silt retention basins used todivert water from the Yellow River. Research facilities in Jiangsu include 1provincial center, 11 municipal stations, and 24 county experimental sites.Earlier research covered irrigation and drainage techniques for paddy and

16
wheat cultivation. More recent research addresses coastal and wastelandreclamation, salinity and soil improvement. Research in Jiangsu is alsosupported by the national Hohai (River/Sea, i.e. Water Resources) Universityin Nanjing, the Nanjing Hydraulic Research Institute, Jiangsu IndustrialUniversity, and Jiangsu Agricultural University (Department of Mechanical andElectrical Irrigation Pumping Department).
2.27 Basic research for irrigation and drainage in the three Provincesis considered adequate. However, there is a neea to expand research to coverthe operation and management of irrigated areas. Topics worthy ofconsideration include irrigation system layout and optimization to improveirrigation efficiency, ground water resources development, major irrigationcanal structures and pumping stations and equipment. Funas for research arelimited, and equipment is inadequate and out-dated. Linkages between researchinstitutions within provinces appear inadequate to coordinate research andcommunicate results. The project would include provisions to address some ofthe deficiencies (Annex 2, Table 5-2).
2.28 Agricultural Supoort Services. Lead responsibility foragricultural support services lies with the Ministry of Agriculture (MOA).The bureaus responsible for support services in MOA are Agriculture, Scienceand Technology, Farm Mechanization, and Education. The Chinese Academy ofAgricultural Sciences (CAAS) functions under the Bureau of Science andTechnology, and has responsibility for agricultural research, planning andgraduate training at the national level. It has a staff of 10,600, stationedin 30 research institutes, centers, laboratories and a graduate school 'ocatedin major production centers across the country. The General Stations cfAgrotechnical Extension; Soils and Fertilizers; Seeds; and Crop Protection areattached to the Bureau of Agriculture.
2.29 The institutional arrangements at the provincial, perfectural, andcounty levels model the national pattern described above. However, at theselevels the institutions function primarily to solve local production problems,and participate in national and regional projects. The services, especiallyat county level and below, share the constraints of incomplete servicenetwork, lack of experienced staff and training, inadequate facilities andequipment, and insufficient operating funds.
2.30 Aoricultural Research. Agricultural production in the North ChinaPlain (NCP) is being addressed by national research programs and by provincialresearch academies and institutes and agricultural universities. At thenational level, the Agricultural Economic Research Institute and the FarmIrrigation Research Institute, both CAAS entities, are conducting appliedresearch on specific production problems in the area. Also at the nationallevel, the Institute of Soil Science of the Chinese Academy of Sciences (CAS)has been carrying out research at three experimental sites in the NCP since1965. Research conducted for preparing this project was sponsored byprovincial research institutes, the Beijing Agricultural University, countyPMOc In the NCP, and other organizations.
2.31 The results of the research have been used to develop technologiesfor improving the Shajiang black soil and soils affected bysalinity/alkalinity, and to overcome the constraints of producing on low- andmedium-yield land. Improved varieties developed include hybrid rices (Shanyu63 and Shanyu 64) and cotton (Yenmian 48, Simian, and Mian 553).
17
2.32 More research efforts are needed to widen the genetic base forcorn, soybean, oilseed and cotton. Superior germ plasm materials should bointroduced for use in the breeding program. There also is a need to developmore varieties adapted to different agro-ecosystems in the project area, and aneed for mo--e on-farm demonstrations. Research is needed also to address theefficient use of fertilizers and agro-chemicals, and IM for major pests anddiseases.
2.33 Research coordination and management is weak, and there is littleevidence of a multi-disciplinary team approach to problem solving. In mostinstances, formal linkages are lacking among research, education, andextension. As part e the ongoing reforms, research institutes have enteredinto commercial contracts with production units to solve production problems,but many research institutes continue to be plagued by shortage of operatingfunds, experienced technical staff, facilities and equipment. Systems forcommunicating research results and problems encountered by farmers needstrengthening. The above constraints will be addressed in a separate projectpresently under preparation.
2.34 Extension. The agricultural extension system is represented atthe national level by the National Agrotechnical Extension Center (NATEC)under the Ministry of Agriculture. NATEC is responsible for agriculturalextension policy guidelines and the overall planning, coordination, resourceallocation, and monitoring and evaluation of the extension programs. It has astaff of 46 and is divided into six divisions which cover food crops, cashcrops, training, organization and management extension, information andcommunication support, and administration. At the provincial and prefecturallevels, the bureaus of agriculture coordinate the extension programs. Thereal operational levels of the system are, however, are located at the countylevel and below.
2.35 The County Agrotechnical Extension Center (CATEC), formerlyoperated as county research centers, now combines the services of soiltesting, seed production, and plant protection, and also directs the work ofthe Township Agrotechnical Extension Stations (TATES). One-third of China's2,300 counties have established CATECn and 14,000 of its 70,000 TATES havefacilities and trained personnel. Each township station has 3 to Stechnicians, each serving 3 or 4 villages. Idoally, at each village, thefarmer technician contacts 20 to 30 leading households which participate indemonstration trials and disseminate information to other farmers. At presentthe project areas have the following ratios of extension personnel tohouseholds: 1:420 in Anhui, 1:50 in Jiangsu, and 1:223 in Shandong. Prov.sionhas been included under the project to improve the above ratios (para. 3.30).
2.36 New or improved technologies are first tested at the CATECexpc-~imontal farm. This testing is followed by verification trials onfarmers fields and the creastion of extensive demonstration areas (up to 670ha) with the aim of extension to farmers. Once proven successful, the packageis then entered into the annual extension plan. In order to tran.fer the neetechnology, training is offere- to leading farmers by CATEC or by townshipagricultural technical schools. Agro-technicians at the TATES also establfnhdemonstration sites on farmers' land. Visits are made by extension persokinelat the important development stages of the crop, and when problems are mostlikely to surface. Increasingly, farmers enter into contracts with townshaipagro-technicians and agree on production targets at the beginning of each

18
season. Farmers who are able to achieve the targets give shares (bonuses) intheir increments to the technician at the end of season. This system givesextension workers a strong interest in the successful implementation of theirrecommendations. Extension messages also are widely transmitted to farmersthrough radio and T V broadcasts, and pamphlets. Successful extensLonmessages to date have covered the adoption of improved varieties, plantingdensity, transplanting techniques, improved cropping patterns, balancedapplication and placement of fertilizer, breeding of quality seeds,agromachinery management, water saving technology, and IPM for bacterial andsheath blight affecting rice through resistant varieties, water control andseed treatment. The impact of the extension programs is evaluated twice ayear and is comprehensively reviewed once a year.
2.37 Research units also carry out research on production problems inthe project area. This practice places researchers directly in touch withfield problems. Feedback of farmers production problems is channeled throughthe demonstration households to village farmer technicians and TATES, totechnical specialists at CATEC. The more complex problems that cannot beresolved by CATEC are referred to research units at the municipal/prefecturallevel and above. Crop advisory committees comprising of experienced technicalspecialists already have been established at the provincial level to advisecounty agricultural staff on how to achieve the production targets. Similaradvisory committees will be established at the national level for importantcommodities, drawing on the pool of scientific expertise available under CAASand the bureaus of MOA. Some counties also have set up technical advisorygroups. This practice will be extended to all counties in the proposedproject (para. 4.6).
2.38 Most of the project counties, except for a few in Anhui andShandong, have an extension network in place. However, networks in manylocalities still suffer from shortages of experienced staff and stafftraining, basic facilities and extension equipment, transport vehicles, and ofoperating funds. Additional staff will be recruited and trained for newcenters and existing staff require refresher training. Under the project,extension services in each county will be strengthened and completed (para.3.28).
2.39 Seed Production and Sup2lv. Under the MOA, the administrativeand commercial activities of the seed sector have been separated, with theGeneral Seed Station responsible for administration, planning, regulation,pricing and marketing, while the National Seed Company is responsible for seedproduction and trade. This separation has not been fully implemented at theprovincial level and below. Although improved seeds are partly responsiblefor the recent increase in agricultural productivity, formal mechanism. ofseed development, production and distribution are inadequate. The provincialseed companies, which have branches at the prefectural and county levels, havebeen unable to provide farmers with adequate amounts of certified seeds. Thisis because the companies lack processing capability, storage space, qualitycontrol mechanisms, transport vehicles, working capital, trained staff, andmanacgement skills. The certified seeds themselves are produced by seed farmsand specialized households under contract to the provincial seed company orits county branches. The shortage of seeds has had its biggest impact on cornproduction. older varieties have been replaced only slowly, farmers oftenhave had to provide their own seeds out of production, and many farmers havehad to forego the superior yields of Fl hybrid seeds.

19
2.40 Agricultural Credit. The Agricultural Bank of China (ABC) is thelargest provider of institutional credit to the sector. It providas fundsthrough a national network of branches extending to the county and townshiplevels and some 59,000 rural credit cooperatives at township level and below.The ABC is widely represented throughout the project area. Its resources areobtained from deposits, loans, profits and the state budget. The bulk ofABC's portfolio (about 65%) is devoted to commercial activities such aspurchase of agricultural production; 30% finances agricultural productiondirectly; and the remainder goes to agro-industry and other sectors. ABCcharges interest according to the length of the repayment period. On April15, 1990, the bank lowered its interest rates from 11.3% to 10.1% for one-yearloans, and from 19.3% to 18,0% for loans over five years. No special creditwill be provided under the project and project farcers would continue to usethe existing credit facilities operated by ABC and the rural creditcooperatives.
Infrastructure
2.41 Transport. The project area has good transportation links. Themain north-south and east-west railw&y lines pass through most of the majortowns and cities. A good road network links the counties, townships andvillages, and the Grand Canal serves as an important transport system for themovement of bulk cargo. It can accommodate barges of up to 700 dwt, drawn bytug boats. Seven -major seaports serve the project area. Air transport ofpassengers and gocds has grown rapidly over the past ten years, and nowconnects the three provincial capitals with major cities in China and HongKong.
2.42 Power. The national China Eastern Grid provides most of theelectric power to the three Provinces. In addition, numerous provincial powerplants supply power to prefectures and counties. Each project county issupplied by a network of 110/36 kV lines. Shandong and Anhui have rich coalresources. The projected power requirements for these two Provinces would bemet by local coal-fired power plants. Plants supplying Shandong are locatedin Zou County, Jinin, Zhaozhuang and Tengzhou. Plants supplying Anhui arelocated in Huaibei and Nuainan. Jiangsu is somewhat constrained by lack ofpower and depends mainly on supply from the China Eastern Grid. This gridalready is under heavy demand from industry and urban centers. However,priority for power is given to agricultural production.
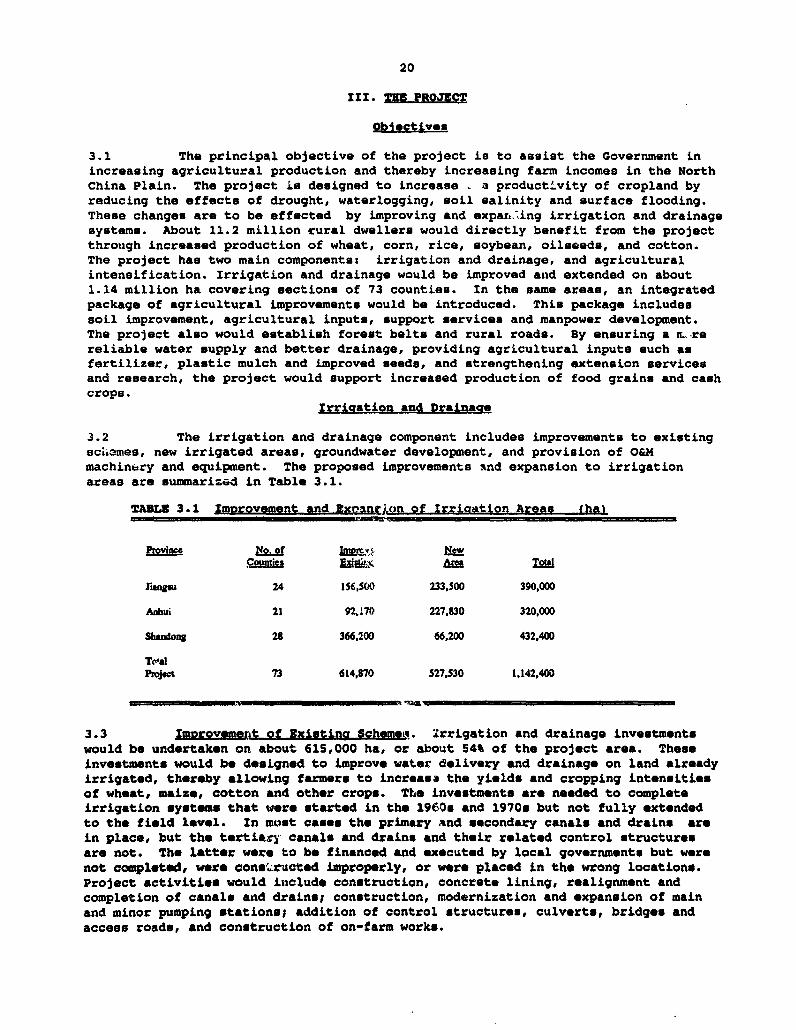
20
III. THE PROJ3CT
Obiectives
3.1 The principal objective of the project is to assist the Government inincreasing agricultural production and thereby increasing farm incomes in the NorthChina Plain. The project is designed to increase a productLvity of cropland byreducing the effects of drought, waterlogging, soil salinity and surface flooding.These changes are to be effected by improving and exparRing irrigation and drainagesystems. About 11.2 million rural dwellers would directly benefit from the projectthrough increased production of wheat, corn, rice, soybean, oilseeds, and cotton.The project has two main components: irrigation and drainage, and agriculturalintensification. Irrigation and drainage would be improved and extended on about1.14 million ha covering sections of 73 counties. In the same areas, an integratedpackage of agricultural improvements would be introduced. This package includessoil improvement, agricultural inputs, support services and manpower development.The project also would establish forest belts and rural roads. By ensuring a IL rereliable water supply and better drainage, providing agricultural inputs such asfertilizer, plastic mulch and improved seeds, and strengthening extension servicedand research, the project would support increased production of food grains and cashcrops.
irriaation and Drainage
3.2 The irrigation and drainage component includes improvements to existingsciiames, new irrigated areas, groundwater development, and provision of O&Mmachinery and equipment. The proposed improvements mnd expansion to irrigationareas are summari-ad in Table 3.1.
TABLt 3.1 Imorovement and KxEianeon of Irrigation Areas (ha)
Asovincc No..off IslAt Nw .c-u aia IEd!; <1
Janpu 24 156,500 233,500 390,000
Anhui 21 92170 227,830 320,000
Shandong 28 366,200 66,200 432,400
TOMPoect 73 614,870 527,530 1,142,400
3.3 Imoroveme t of Existina Schemeo. irrigation and drainage investmentswould be undertaken on about 615,000 ha, or about 54% of the project area. Theseinvestments would be designed to improve water delivery and drainage on land alreadyirrigated, thereby allowing farmers to increasa the yields and cropping intensitiesof wheat, maize, cotton and other crops. The investments are needed to completeirrigation systems that were started in the 1960z and 1970z but not fully extendedto the field level. In most cases the primary and secondary canals and drains arein place, but the tertiarw canals and drains and their related control structuresare not. The latter were to be financed and executed by local governments but werenot completed, were cons. ructed improperly, or were placed in the wrong locations.Project activities would include construction, concrete lining, realignment andcompletion of canals and drains; construction, modernization and expansion of mainand minor pumping stations; addition of control structures, culverts, bridges andaccess roads, and construction of on-farm works.
21
3.4 New Irriaated Area. The project will bring some 527,000 hectares ofrainfed land under irrigation. On about half of this area farmers will be able toswitch from growing low-value crops such as sweet potato, beans and sorghum, tohigher value crops such as rice and maize. On the rest of the newly irrigated area,farmers now growing maize, wheat, oilseeds and cotton would be able to increase thecropping intensity from single to rualtiple cropping or relay cropping. Irrigationfacilities will be expanded through the construction of canal networks complete withcontrol structures, multi-stage pumping stations, and tubewells.
3.5 Groundwater Development. In Anhui and Shandong Provinces, there will beextensive improvement of infrastructure for groundwater irrigation.' In all, about261,000 ha or 23% of the project's irrigated areas will be served by groundwater.The project will rehabilitate and complete 9,760 inoperative wells and willconstruct 5,030 new ones. The new wells will be from 20 to 30 meters deep withyields ranging from 30 to 50 m3 per hour. The rehabilitation work will includewashing and cleaning of clogged well casings and replacement and/or repair of aging,inefficient, and damaged pumping equipment. Most of the 14,300 pumping sets to berupplied under the project will be electrically driven; where electric power is notavailable, diesel engines would be used. To prevent well contamination, well headsand housing will be provided.
3.6 The provincial Water Resources Bureaus have evaluated the groundwaterresources and safe aquifer yields for each groundwater irrigation area in theproject. Sample detailed plans for rehabilitation and new construction now havebeen prepared and have been reviewed by the appraisal mission. The plansincorporate the optimal number, size, and spacing of wells indicated by thisassessment. Assurances have been obtained at negotiations that no new tubewells inproject areas in Anhui and Shandong other than those included in the project wouldbo drilled unless justified by availability of groundwater determined by furtherassesment of the groundwater resources (para. 3.40). The management of projectwells would continue to be handled at the village level. Farmers would pay watercharges based on the actual water production cost plus overhead costs formanagement, equipment repair, and depreciation. The project would providevolumetric devices for a representative sample of the wells to measure the amount otwater being produced and used.
3.7 The project would introduce water-saving pipe systems at all the wellsto be built or rehabilitated in Shandong and about two-thirds of those to be builtin Anhui. Existing earth channel water distribution systems would be replaced bysubsurface low-pressure pipe systems fed by one or more wells. Each well canirrigate from four to six hectares. The pipes would be 150 to 200 mm in diameterand would be constructed with pro-cast, cast-in-situ concrete or locally producedPVC. Valve-controlled turnouts are spaced 50 to 60 m apart along the main (orbranch) pipe, and farmers apply water to field plots manually by plastic hosesconnected to the turnouts. The use of low-pressure pipe will keep both investmentand maintenance costs low, and is appropriate for these small-scale distributionsystems. These pipe systems permit more precise scheduling and application ofirrigation, as well as reduced seepage losses. For these reasons, these pipes canserve a given area with 20-30 percent less water than open ditches, making itpossible to increase the area a well can irrigate. The pipes also save energy andlabor for both water application and system maintenance, and land now occupied bycanals. In Shandong, whero a 1S-year drought has severely drawn down aquifers, thepipe systems would not only lncrease the efficiency of water use but also reduce theabsolute quantity of water consumed, thereby reducing the net drawdown.
' Due to unbvorble bydmogcological conditions limiting groundwater maourcs and costs, ony marginal orm in the number of walbwill be developed under te project in JisngS (ae pam. 2.25).

22
3.8 O&M Machinery and Ecuinment. About USS 3.6 million of machinery andequipment would be provided to WRBs in the three Provinces. This equipment would beused to improve the operation, maintenance, and management of the irrigation areas.About 120 units of heavy machinery would be purchased, including excavators,bulldozers, shovels, desilting machines, and dredgers. Computer hardware andsoftware and VHF radio equipment would be provided to the Jiangsu and Anhui WRBs.These items would be used to enhance system operations for allocating and monitoringwater distribution and quality in the Grand Canal and the Huai River systems. Otherlogistic support would include vehicles, office equipment, and buildings. Detailson the quantity and cost of machinery, equipment and vehicles for the threeProvinces are shown in Annex 2, Tables 2-1 to 2-3.
3.9 The major features of the irrigation and drainage works proposed in eachProvince are presented in the following paragraphs.
Jiancsu
3.10 The project would improve and expand irrigated agriculture in 24counties in the northern part of Jiangsu Province (Map IBRD No.22451).
3.11 Grand Canal Pumpina Stations. Water transfer in the Grand Canal isbelow the canal's capacity and operating at high cost. This is because ofinefficient and inadequate pumping equipment at three of the canal's nine pumpingstations. The project would upgrade and expand these stations to increase theefficiency of northward water transfer and permit the expansion of irrigation alongthe canml. This plan is in keeping with the long-term national plan fortransferring water from the Yangtze River. The capacity of the Huaian PumpingStation would be expanded from 180 to 240 cms; this would remove the majorbottleneck in water transfer northwards. At the Siyang Pumping Station the capacitywill be increased from 100 to 140 cms. At the Liulaojiang Pumping Station, theexisting 100 sets of inefficient, high-energy consuming diesel pumps would bereplaced with new electrical pumps. In addition to these renovations, a new pumpingstation with 50 cms capacity would be built at Shaji. This station would transferHuai River water (regulated in the Hongze Lake) northwards via the Xu-Hong Canal nowunder construction. The station would provide water to irrigate about 57,700 habetween Shaji and Liuji, and pump irrigation water during the off-season period toFeng and Fei counties through the Fangting Channel. The type, size and number ofpumps for the new stations would take into consideration civil work costs,flexibility in operation, and standard modules of pump capacity (30, 20 and 10 cms).At Luoma Lake, which acts as a key regulating reservoir in the northward watertransfer, the project would strengthen about 18 km of the southern dike in order toincrease the lake's storage capacity by 150 mcm. Other minor canal strengthening,raising and repair to the control structures along the Grand Canal would also becarried out. To meet the electric power requirement of the proposed pumpingstations at Siyang and Liulaojiang, the main substation at Xuqian would be expandedby 30,000 kVA.
3.12 Imorovement and ExRansion of Irria4tion Schemes. The project wouldimprove and expand irrigation on 33 schemes covering 390,000 ha. The schemes arelocated in 24 counties of the following four regions: Yunxi, Yibei/Yinan, HongzeLake, and Coastal Area as summarized in Table 3.2. The schemes were selectedbecause they already have basic irrigation and drainage facilities, they show goodpotential for increased production, and local funding for the improvements has beencommitted. The project would expand irrigation facilities to 233,500 ha of rainfedareas and improve 156,500 ha of existing irrigated area. On completion, the projectwould raise the percentage of irrigated land in the Jiangsu project counties from58% to 70%.

23
TA.W3 3.2 Improvement and Expansion of Irriaation Areas in Jiangsu (ha)
Reuion lmmmx Exiond To
Yunxi 39,800 41,400 81,200Yinbei/Yinan 67,600 91,700 159,300Hongze Lake 21,000 57,300 78,300Coalul 28,100 43,100 71,200
Total 156.500 233.500390
3.13 The Yunxi Reaion has the poorest water resources in the Province andsuffers from poor soil fertility, floods, droughts, waterlogging, and soil salinity.The construction of the Shaji Pumping Station (see para. 3.11) would make it
possible to complete and intensify irrigation and drainage networks in eight schemestotalling 65,000 ha. In the Yibei/Yinan Reaion, poor drainage is a major problemdue to lack of outlets, water backup in high-level drainage channels, and shortage
of electric power. Under the project, 16 existing areas covering 188,400 ha wouldbe improved, rehabilitated and expanded. Project works would include drainagechannel excavation, construction and completion of canals and control structures,
and on-farm works. Some pumping stations and small reservoirs also would be built.The Honaze Lake Region is a lowland affected by poor drainage and waterlogging; itis even used for flood detention. However, the higher ground suffers from ashortage of water due to inadequate infrastructure and ftorage capacity forirrigation. The project would improve and upgrade eight irrigation areas covering a
total of 58,000 ha in this region. This would include strengthening of floodprotection dikes and lowland polder embankments, and construction of pumpingstations, a canal network to lift water, storage ponds for hilly areas, and on-farmworks. The Coastal Reaion is flat and low-lying. It is composed primarily ofcoastal saline soil which is subjected to tidal intrusion. Drainage is furtherconstrained by a number of high-level drains flowing from the hinterlands in the
west. The region also receives inadequate water supply, being located at the tailend of the irrigation system. The project would imprcve, rehabilitate, andconstruct irrigation and drainage facilities for seven irrigation areas in the
region.
Anhui
3.14 Irrigation and drainage works will be carried out in 21 counties in the
northern part of Anhui Province (see IBRD Map No.22450). These works consist of
improvement and expansion of surface and groundwater irrigation areas. They aresummarized in Table 3.3 below.

24TAaL 3.3 Improvement and Expansion of Irrigation Areas in Anhui (ha)
Tn/4AMS larov Expos Total
Surface Water:Huai River 18,290 41,060 59,350Ying River 2,600 12,730 15,330Cihuaixinhe 6,030 33,990 40,020Guo River 1,470 7,070 8,540Xinbianhe 15,030 21,810 36,80Qian River 9,070 28,010 37,940Beifei River 9,930 18,730 27,800
Total Surface 62.420 163,400 22S,820Water
Groundwater 29,750 64,430 94,180
Toal DrOieCt 92.170 227.830 320.000
3.15 Imorovement and Expansion of Surface Irrigation. Irrigation facilitieswould be improved on 62,400 ha and expanded on 163,400 ha along seven river systems.While most of the primary irrigation works are in place, secondary and tertiarynetworks need to be rehabilitated or completed. The project will construct about206 first-stage and 1,099 second-stage pumping stations, 151 main, 1,444 branch,10,048 lateral and 100,000 sub-lateral and field canals, and 53,840 controlstructures of various sizes. The project will lay about 60 km of 35kV and 895 km of10kV power lines and build the required substations to serve the new pumpingstations. In two of the areas, the Qian and the Beifei Rivers, low-lying lands willbe protected against floods and drained in order to allow for increased productionof rice and corn. Flooding has been controlled on the upper reaches of the QianRiver, but the middle and lower basins are not protected by dikes and subject tofrequent flooding. The project will dredge 44 km of the middle stretches of the
Qian River and construct 89 km of flood protection dikes, drainage networks, andpolders complete with pumping stations, bridges and structures. On the BeifeiRiver, 20,000 ha of low-lying land has been protected by polders but drainage isconstrained by high water levels and insufficient capacity at the 76 existingdrainage pumping stations. The encroachment of cultivation on the designated flood
detention areas also has worsened flooding in the area. The project will dredge themain drainage channel and the river, compartmentalize drainage areas into smallunits, and increase the capacity of the major and minor drainage pumping stations.
Natural flood storage areas will be designated in the Sancha River and in XiaoyutaiLake.
3.16 Groundwater Irrigation. The project will bring some 94,200 ha ofrainfed cropland in the Huaibei area under irrigation through the improvement ofgroundwater facilities. Of the 110,000 tubewells in the region, only about 37,000
are operational. The others have been abandoned due to clogged well casings,damaged and obsolete installations, or broken well heads. The project willrehabilitate about 7,300 of these wells by repairing and replacing well heads, wellhousings, and pumping sets. In addition, 4,230 new wells will be constructed.Subsurface in-situ concrete pipe systems (see para. 3.7) will be installed at allthe wells to serve about 43,620 ha. The remaining areas will continue to be servedby earth canals until funds are available to replace the latter with subsurface pipesystems.

25
Skandog
3.17 In Shandong, the project will improve and expand irrigation and drainagefacilities on about 433,000 ha (see IBRD Map No.22449). This area covers 28counties in the southern and southwestern parts of the Province. Project aotivitiesare summarized in Table 3.4 below.
Table 3.4 Improvement and Expansion of Irrgiation Areas in Shandong lha)
Surface Water:Xiezhai 23,300 37,700 60,000Shengli Qu 11,600 20,400 32,000Nsnai Lake 160,000 0 160,000Chongkai 13,300 0 13,300
Sub-total 208,200 57,100 265,300
Groundwater 158,000 9,100 167,100
3.18 Xiezhai Irrigation Area. This scheme, which uses water diverted fromthe Yellow River, has a designed area of 24,400 ha. However, only about 10,000 ha isirrigated because the system has not been completed. The project will improve andcomplete the system. It also will expand facilities to an adjoining area of 35,600ha which is currently rainfed. Marginal land will be parcelled into plots for useas silt retention basins for 1-3 years; the filled area will then be reclaimed andcultivated or afforested. Farmers will receive compensation for this temporary useof their land (para. 3.47). The main canal will be enlarged to feed water to theDongyu River, which will then supply water to the new areas. A comprehensivenetwork of canals, drains and structures also will be constructed.
3.19 Nansi Lake Irrigation Area. The project will provide a medium-termsolution to the loss of water in the lake (see para. 2.18) in order to permit400,000 farmers to continue irrigating their land. During the winter months,surplus water will be diverted from the Yellow River into the lake through twoexisting irrigation areas (Chengkai and Guonali). While this already has been doneon an emergency basis since 1987, the project will provide a safer and moreefficient system for diverting the water -- about 700 million cu m per year up to
the year 2010 and possibly beyond. The conveyance canal will be desilted. enlargedand lined with concrete, and the capacity of existing silt retention basins will be
increased. The project also will enlarge and excavate 27.5 km of the main LiangjiCanal and 15 km of other conveyance canals. When these works are completed, theproject will provide assured irrigation to about 160,000 ha fringing the lakethrough the 630 existing pumping stations. About 30% of the existing pumpingstations will be improved and upgraded under the project. This will allow farmersto switch from low-yielding rainfed cropping back to fully irrigated conditionsusing the irrigation infrastructure already in place. In addition, irrigation willbe improved on 13,330 ha of the Chengkai Irrigation Area through which the diversion
water will pass.
3.20 Shenali Qu Irriaation Area. On this scheme in southern Shandong, onlyabout 11,000 ha of the design area of 32,000 ha can be effectively irrigated due tothe incompleteness of the system and low standard of works. The project willimprove the existing area and expand facilities to the remaining 21,000 ha.Improvements will include desilting, canal lining, and construction of canals anddrains, control structures, access roads and telephone lines, and four new and two
26
expanded pumping stations.
3.21 Groundwater Irriaation. Currently, there are about 39,600 tubewellsirrigating 102,000 ha in 17 project counties. The project will reduce the number ofwells to about 31,000 by eliminating inv.fficient wells and optimizing the number andspacing of wells in relation to aquifer yields. Only 800 new wells are to beconstructed. Water-saving subsurface pipe systems totalling about 1.5 millionmeters will be installed at all now and rehabilitated wells. With Improved systemefficiency (90%), shorter and more timely application of irrigation water, the totalirrigated area will be raised to about 168,000 ha.
Aaricultural Intensification
3.22 The project will provide farmers in the 73 project counties with apackage of agricultural inputs and support services to complement the improvementsin irrl-stion and drainage. This package covers soil improvement and fertilization;other inputs; seeds; extension services; farm machinery; windbreaks, shelter belts,and border rows; and rural roads. These components were developed and successfullytested in 20 pilot areas and 9 counties under the North China Plain Project (seepara. 1.21).
3.23 Soil Improvement and Fertilization. The prolonged use of farm machinerywill cause certain soil types, such as the Shajiang black soils in the project area,to develop a hard pan 10 to 20 cm below the surface of the soil. This causes thesoil to compact and restrict root growth and the penetration of water into thesubsoil. The project will provide tractors to loosen the hard pan and improve thesoil texture. About 885 large and medium-sized tractors (>75 hp) will be providedfor the deep plowing and leveling on farmers' land. For this service the farmerswill pay a fee ranging from Y7§ to Y133/ha. To improve the texture, moistureretention and organic content of the soil, 4,882 small diesel-powered shredders willbe provided. These shredders will allow farmers to incorporate a portion of cropresidues into the field. During harvest about 15-20 cm of stubble normally is leftbehind. This portion will be plowed back into the soil instead of being burnt off byfarmers. In addition, some of the residue after threshing will be shredded andincorporated into the soil. However, residues from cotton plant will be burnt, asnow practiced, to control disease. The return of residue into the soil would notcompete with present practices of using residue for feed or fuel. Moreover, thearea is rich in fossil fuel.
3.24 Soils in the project area are generally deficient in nitrogen andphosphorus, and their organic content is below 1.0% (para. 2.4). The presentfertilizer application rate practiced by farmers is less than half of therecommended rate (about 1.2 t/ha, comprising of 750 kg N, 375 kg P and 75 kg K).Low analysis fertilizers such as highly volatile ammonium bicarbonate (17% N) andlow grade calcium superphosphate (12% P) are the main fertilizers applied in theproject counties. Given the national shortage of domestically produced high qualityphosphate fertilizer, it will be necessary for the project to import urea,diammonium phosphate, and potassium chloride.
3.25 The project will provide enough fertilizer for one application over theincremental cropped area at full development, based on a soil analysis carried outfor the different soil types. This amounts to about 155,000 tons of DAP, 50,000tons of urea, and 3,800 tons of potassium chloride. The fertilizer will be sold tofarmers through CATEC sales unit at its actual import cost plus distributors'margin. Each county PMO will establish a revolving fund with the sales proceeds forthe purpose of procuring future requirements. Each county PMO would submit anannual fertilizer plan to the provincial PMO, showing the intended cropping patternand area, fertilizer application rates (based on soil and foliar analyses carried
27
out prior to completion of on-farm works and repeated as needed), and quantityrequired. In order to ensur- that adequate quantlties of fertilizers are availableto farmers in a timely manner, assurances have been obtained at negotiations thats(i) each Province shall cause the county PNOI to operate a revolving fund forfertilizers and other inputs; and (li) each Province shall prepare and furnish tothe Bank/IDA by December 1 of each year an annual fertilizer plan showing thequantities of chemical fertilizers required and the plan for procuring them.
3.26 Other inuts. The project will import 670 tons of pesticides to be usedin all Provinces for the control and management of major pests of foodgrain andcotton. The chemicals will be approved in advance by the Bank/IDA and will behandled in accordance with Bank guidelines. Part of the materials will be marketedthrough the local Supply and Marketing Cooperatives and part will be marketed foruse by the Plant Protection Stations under CATEC. The project also will provide 300tons of plastic film for early planting of cotton, maize and vegetables, and 152tons of gypsum for the treatment of alkaline soils (Jiangsu project area). Proceedsfrom sale of inputs will be deposited in the revolving fund established (para. 3.25)and used to procure future requirements.
3.27 Seeds. The project will upgrade the breeding, production, and marketingof quality seeds to farmers. County seed companies lack storage facilities,inspection and testing rooms, drying floors, and processing and testing equipmentneeded to produce seeds of acceptable quality and purlty (para. 2.39). Furthermore,the companies produce less than 30% of the total seed requirement. The project willstrengthen the 73 county seed centers by providing them with 75,000 sq m of storehouses, 210,500 sq m of drying floors, 31,500 sq m of offices, laboratories, anddormitories; and equipment for drying, conditioning, and testing. Small tractors,harvesters and irrigation equipment will be provided to seed multiplication farms,
and vehicles will be supplied to transport seed from farms to processing plants andsales outlets. In order to optimize the quality and profitability of the seedsproduced, Shandong Province has agreed to establish an integrated seed production,processing and marketing system in Taian Prefecture. A detailed proposal for thispilot project was submitted to the Bank/IDA at negotiations. When completed, theproject seed systems will produce 100% of the quality seeds required in Shandong andAnhui, and 90% of the grain, 60% of the cotton and 80% of the oilseets required in
Jiangsu. Additional requirements in Jiangsu will be met from other areas.
3.28 Extension. In order to offer better services to producers, the projectwill strengthen extension in each Province, especially at the county, township andvillage levels. The project also will construct and equip 18 new CountyAgrotechnical Extension Centers (CATECs) -- 10 in Shandong and 8 in Anhui. Based onnational guidelines, each CATEC will be provided with about 2,300 sq m of buildings,comprising space for offices, classrooms, laboratories, dormitories, libraries,dining rooms, garage and storage areas, and experimental fields. The project alsowill expand and upgrade the existing 55 CATECs and 688 township extension stations.These will be supplied with analytical, diagnostic, audio-visual, and pest controlequipment, a&i 165 extension vehicles. An assurance has been obtained atnegotiations that each CATEC in the project area will prepare and submit to theprovincial PHO by December 31 each year an annual detailed extension program showingits proposed activities and physical targets for the following year.
3.29 Research. The project will finance adaptive research and field trials,aimed at supporting and improving the productivity of low and medium yield lands.Research will be carried out by relevant research institutes of the provincialacademy of agricultural sciences and agricultural universities in cooperation withCATEC staff. Research topics have been reviewed by the Bank/IDA and include:cultivation techniques, crop rotation, plastic mulch, soil improvement/fertility,

28
1PM, high yielding varieties, and rhizobium inoculation of legume. Details ofresearch topics to be Lnvestigated are listed in Annex 2, Table 5-2.
3.30 A staff development plan will be instituted over the project period torelieve staff shortages. This plan, to be agreed with the Bank/IDA at negotiations,will allow about 76,670 new staff to be recruited and trained2 (para. 3.36). Fundsalso will be provided for short-term training to upgrade the skills of about 58,900existing staff. The courses will be given by staff from county extension centers,agricultural universities and schools, and provincial academies of agriculturalsciences (PAASs), and municipality and prefecture research institutes. In someareas pest forecasting stations and crop protection teams have been established todetect and predict outbreaks of pest. The project will set up 48 new pestforecasting stations. The project also will provide 8,900 sprayers and 530 tons ofhigh efficiency and low toxicity pesticides to the stations.
3.31 Farm Machinery Stations. The degree of farm mechanization varies amongthe three Provinces. Jiangsu has the highest rate of mechanized land cultivation--80%. Anhui has the lowest rate--25%--and Shandong is in between these two--50%. Theproject will Improve and upgrade about 500 township service stations with facilitiesto service farm machinery and provide testing equipment, tools, spares and repairworkshops. This strengthening should allow the service stations to provide promptrepairs and servicing of farm machinery and Implements, and some overhauling ofsmall to medium-size machines. The project will finance tractors (para. 3.23) andfarm implements such as rotovators, disc ploughs, harrows, cultivators, planters,and seed drills. The service stations will contract with farmers to providedifferent services such as land preparation, deep plowing, leveling, and harvesting.At the same time, demonstration sites (2,000 to 2,600 ha each) will be set up on53,300 ha of land in Jiangsu Province to instruct farmers on the proper operation offarm equipment. The training of mechanics (approximately 2,000persons/year/province) in operation, repairs and maintenance by technicians from thelocal bureau of agro-machinery will be intensified. In Shandong, a mobile servicenetwork will be established in some farm machinery stations to perform simplerepairs in the field.
3.32 Windbreaks, Shelter Belts. and Border Rows. Less than 15% of theproject area is covered by forest. The little land that is forested is mostlyplanted as shelter belts, border rows, and windbreaks. Poplars, locust, Chineseelm, Paulownia, and Metaseouoia are the most commonly planted species. Villagehouseholds are assigned responsibility for establishing and maintaining trees by thelocal bureau of forestry. These households follow the standards established by theforestry bureau and are well acquainted wLth tree establishment and maintenanceprocedures. Depending on the area, farmers will plant appropriate species alongroads, canals and as border rows on raised bunds in fLelds to reduce soil erosionand wind damage. Such windbreaks signiflcantly reduce wind velocity (by up to 50%)and evaporation (by about 30%) and raise field temperatures (by 20%), therebyreducing crop damage caused by hot dry summer winds. Field border plantings andshelter belts generally are establLshed at 40 to 70 trees/ha. These are set Lnplanting holes of lxlxl m, Ln an offset pair of rows with 7x3 m spacing for thepurpose of reducing the wind speed.
3.33 The project will provide urea (0.3 kg/tree/yr), pesticides for spotcontrol of Lnsects, and saplings/cuttings. Township forestry bureaus Ln Jiangsuwill establLsh 360 ha of nurseries Ln project counties that do not have an adequatesupply of saplings. The other two Provinces have an adequate supply of saplings.
a Mainly frm,r technicians (selected skilled farmer) who have received trining at agricultural schools and themselves ame farrnn and arepaid onIy nominal aL owances for their services.

29
Households responsible for the trees dorive 70% to 80% of the benefit from the saleof the timberl 20 to 30% of the profit goes to the village group. At fulldevelopment forest cover in the project areas is expected to increase to about 15%.
3.34 Rural Roads. In Anhui, county PMOs will construct about 2,165 km ofrural roads in 776 villages. These roads will be designed to link the project siteswith existing village, township and county roads. The new roads would beconstructed using spoil from canals and drains and a surface layer of sand andstone. The roads will be maintained by county and township governments in theproject area. In Shandong and Jiangsu, no new roads will be constructed as presentrural road networks are adequate. Only bridges and culvorts (about 10 bridges orculverts per 670 ha) will be provided to facilitate crossings.
Trainina and Technical Assistance
3.35 Institutional Development. The project will provide institutionalsupport to upgrade technical skills and develop personnel resources in projectidentification, preparation, and management. The various design institutes andresearch stations under the project also will be strengthened with equipment andfacilities to be provided. This strengthening should allow these institutes toassume a larger role in project design work, supervision, quality control andresearch.
3.36 Trainina and Study Tours. 3 The project will include about 150,000person-months of local training for agricultural extension staff, farmer techniciansand demonstration households with emphasis and priority given to women (para. 3.29).The courses will run 10 to 30 days and will be offered three to six times a year.Topics to be covered include crop fertilizer requirements; appropriate croppingsystems; varietal improvement; seeds; crop protection; and the operation andmaintenance of farm machinery. The courses will be taught by county extensioncenters and agricultural schools, and technical staff from the PAASs and prefectureresearch institutes. Training courses also will be held for irrigation staff. Thesecourses will focus on operation and management of large irrigation schemes, improvedwater management, and water-saving techniques. About 456 managerial and technicalstaff will participate in overseas (165 participants) and local (291 participants)study tours to agricultural research institutes and irrigation areas. The purposesof these tours will be for staff to observe recent developments in plant nutrition,seed production, crop protection, irrigation and drainage technologies, soilsalinity control, project management, and monitoring and evaluation. The PHO staffwill also receive training in project management. The training programs aresummarized in Annex 2, Tables 5-1, 5-2. Assurances have been obtained atnegotiations that each Province will carry out training according to a programagreed with the Bank/IDA.
3.37 Technical Assistance. The project will provide 23 man-months oftechnical assistance. For irrigation, assistan * will be provided to introduce theuse of computerized simulation modelling for the planning, design and management ofgroundwater resources. Internationally recruited specialists will hold a series ofseminars in the project area to demonstrate the application of techniques to actualproject designs. Technical assistance will also be provided to plan and designcomputerized systems for monitoring the operation of the Grand Canal (Jiangsu) andthe various irrigation schemes along the Huai River system in Anhui. These schemesare linked by a complex network of reservoirs, control gates and pumping stations.
'"Te thrinig of project staff in the three pmvinces will be complementary to the 2-year training pmgram to be organized joirnly byUNDP/EDI for the Seminar on Amculturl Sector Policies nd Reional Develooment in the Huane-Hui-Hi Plain to train high evel plannersan managera in the development planning and management of agricultural and water resources in the North China Plain.

30
The computerized systems would replace the existing manual monitoring systems usingtelephone communication. The system package would include computer hardware andsoftware, and training of personnel to operate and maintain the systems. Onagricultural topics, both local and foreign experts will give lectures and conductseminars for staff in the project area. These sessions will cover subjects such aseffective rhizobial strains for soybeans, integrated pest management systems, andimproving the transfer of techniques to farmers. The Central Project CoordinatingOffice will coordinate these technical assistance programs (Annex 2, Table 6) forthe three Provinces.
Water Supply. Demand and ouality
3.38 Each Province has carried out a water balance study to assess theprojected water supply and demand up to the year 2000, with and without the project.These studles have been reviewed by the Bank/IDA and have been found to becomprehensive and satisfactory.
3.39 Surface Water. In Jiangsu, the water balance study was conductedthrough a computerized simulation method for the whole of Northern Jiangsu. Byupgrading canal systems and improving water management, the project would reduce thepresent annual water deficit of 2.0 billion cu meters (bcm) to 0.65 bcm afterproject completion and to 0.82 bcm by the year 2000. Based on a reliability indexof P=75%, the deficit would be eased by the 10% standby pumping capacity of theGrand Canal pumping stations. This standby capacity will allow more water to betransferred from the Yangtze River in time of need. The various lakes linking theGrand Canal also would be able to provide additional tenporary storage andregulation of water. Water supply/demand computations would be further refined inthe course of project implementation with the canal irrigation simulation system tobe provided under the project (para. 3.37). In Anhui, the water balance studies arebased on three river systems in the project area of northern Anhui Province andcover both project and non-project areas in the river systems. The analysis showsno apparent deficit of water based on reliability index of P-75%. In Shandong,separate water balance studies were carried out for Xiezhai, Nansi Lake and theShengli Qu irrigation areas. The first two areas involve diverting water from theYellow River. The additional 50 cms (present 30 cms) diversion of Yellow Riverwater for the Xiezhai Irrigation Area is part of the approved water allocation quotafor Shandong. However, the extra water is not being used because the irrigationsystem has not been completed. The proposed 700 mcm diversion of Yellow River waterto replenish Nansi Lake between November and February has been reviewed and approvedby the Yellow River Commission .4 The proposed diversion constitutes only about 15-20% of the downstream flow from the Yellow River to the sea, after allowing for thevarious uses downstream of the Huayuankou Station in Henan. For the Shengli QuIrrigation Area, demand would be met mainly from the storage water regulated in thelower portion of Nansi Lake and the Hanzhuan and Yicheng Dasha rivers.
3.40 Groundwater. Groundwater availability for tubewell irrigation inShandong and Anhui was assessed using hydrogeological data compiled by the Bureau ofGeological Services. In Anhui, most of the project tubewells will be located inareas with rich shallow aquifers which have yields from 10 to 50 m3/hour. Theexisting groundwater resources have not been fully exploited, as farmers have notshown much interest in irrigation witn groundwater in the past. In Shandong,tubewelle have been used for years in the project areas but they are constrained bydepleting groundwater resources. The project will conserve the depletinggroundwater resources by re-spacing the wells based on safe aquifer yields andreplacing earth canals with more efficient subsurface pipe systems for water
' For details wee Working Paper C.2 'Yellow River Diversion to Nansi lAke. Shandong'.
31
distributlon. To ensure the present groundwater availability would be sustainedunder the project, an area by area assessment of historical pumpage, yield, anddrawdown of water levels will be made. Such an assessment for five sample areasrepresentative of the project areas in Shandong have been made by the WaterResources Bureau. An assurance has been obtained at negotiations that the Shandongand Anhui WRBs will monitor and assess the groundwater resources in the project areaeach year and furnish their findings to the Bank/IDA by June 30 of the followingyear.
3.41 QOalY. Surface water and groundwater in the project area, includingraw water transferred from the Yangtze and Yellow Rivers, is gen-rally of goodquality and suitable for irrigation and other agricultural use. aowever, stretchesof the Grand Canal in Jiangsu are polluted to a varying degree by effluentdischarged from industries and urban centers. Under the project, surface waterquality will be monitored by 43 stations in North Jiangsu and by a network ofmonitoring stations on the main Huai River and its main tributaries. The former areoperated by the Bureau of Water Resources and the latter are operated by theEnvironmental Unit of the Huai River Commission. Groundwater will continue to bemonitored through the various existing observation wells established in Shandong andAnhui.
Desion Status and Standards
3.42 Responsibility for engineering design has been divided between the threeprovincial design institutes and the prefecture and county design offices under thejurisdiction of the Bureau of Water Resources. These offices have completeddetailed prelimirary designs, including quantity and cost estimates, for most of themajor engineering works. For on-farm works, designs and costing have been done forselected sample areas. This information would be used for designing similar areasto be constructed. Sample designs and detailed layouts for groundwater irrigationworks also have been prepared and reviewed by the appraisal mission. Depending onthe scope and size of work involved, designs are reviewed and approved by the WREsat the municipality, prefecture and provincial levels. The design standards forflood control, drainage and irrigation are summarized in Annex 1, able 5. Thesestandards generally conform to those set by the MWR for the region. They have beenreviewed and found acceptable by the Bank/IDA. The designs for rehabilitation andconstruction of new tubewells and water-saving pipe systems also are acceptable andappropriate for the level of groundwater development technology in Chinn-
3.43 No new dams or reservoirs will be built under the project. Safetyinspections of 19 existing dams and reservoirs serving the Jiangsu project area havebeen carried out periodically.5 Assurances have been obtained at negotiations thatJiangsu will carry out maintenance and periodic safety inspections of existingdams/reservoirs listed in Annex 1 Table No.6 under arrangements satisfactory to theBank/IDA. There are no dams or reservoirs in the project areas of Anhui andShandong requiring periodic safety inspections.
Environen:tal 1§2act
3.44 General. Each Province has carried out an environmental impact studyfor the project which identifies both positive and negative effects. The missionhas reviewed these studies and found the adverse effects to be minimal. The fewadverse effects could be controlled or mitigated through an appropriateenvironmental management program. The COC and provincial governments haveestablished satisfactory environmental standards and guidelines; an assurance has
' Of te 19 damslreaevoir, only 7 have embankment heights raging from 10 to 17 m and the test are below 10 m in height. Stongecapacity vanes ftm 2.1 mwm to 25.3 mcm, nmosty between 4 to 6 tnm. For detib we Annex I Table 6.
32
been obtained at negotiations that all project activities will conform to these
environmental standards and guidelines satisfactory to the Bank/IDA.
3.45 The irrigation and drainage works are unlikely to cause any adverse
effect, as they mainly will rehabilitate and extend existing facilities, and the
sites involved are small and widely dispersed. These works actually are expected to
improve drainage and reduce the incidence of waterlogging and soil salinity. Deep
plowing of the Shajiang soil and the retutrn of crop residues will improve soil
texture and increase its organic content. The planting of tree borders as
windbreaks and tree belts will increase the vegetative cover and reduce wind
erosion. An assurance has been obtained at negotiations that pesticides to be
provided will require Bank/IDA approval and their storage, handling, distribution
and use will follow the Bank Group guidelines, and where applicable, the MOA
guidelines on safe use of such pesticides.6 Extension services will train farmers
in the proper use of agro-chomicals procured under the project, and where
applicable, integrated management of pests will be encouraged (para. 3.37). The
major fertilizer applied will be mostly di-ammonium phouphate,(DAP) and urea, both
commonly used now in the project areas. To avoid *xcessive uJe, application rates
will be determined by foliar and soil analyses, and quantity regulated by an annualfertilizer plan to be prepared by each project county (para. 3.25).
3.46 Grand Canal. The project Ltself will not divert any additional water
from the Yangtze River, but it will increase the overall northward flow along the
Grand Canal. A study by Nanjing University showed that even the South-North Water
Transfer Project, with its massive diversion of water, would not produce significant
estuary siltation, erosion, saline intrusion or drop in water levels on the
downstream stretches of the Yangtze River. Schistosomiasis is not present in the
project area, and the Jiangsu Schistosomiasis Prevention and Research Center has
determined that the snail vector, *ven when introduced, does not survive north of
Baoyin at Latitude N 33015'. With improved water conveyance and distribution,
polluted water could spread further northward into l :4.gation areas. The present
system for monitoring water quality monitoring system, consisting of 43 stations,
will be strengthened and upgraded under the project with equipment and training of
personnel. A more effective pollution control and abatement program also will be
included under the environment management program (Para. 3.50). On the positive
side, the impro-ementa in water transfer northward will reduce water shortages in
agriculture, industry, cities and towns, and help to recharge groundwater aquifers.
3.47 Nani Lake. Silt retention basins, 100-150 ha each, for Yellow River
water will be established in the Xiezhai Irrigation Area and the Nansi LakeDiversion Project (see para 3.18-3.19).7 These basins will be temporarily used for
a period of 1-3 years. Afterwards they will be reclaimed and returned to
cultivation. Shandong Province has considerable experience in managing andreclaiming this type of basin. The land to be used consists mostly of areas ofsandy soil, old river channels and local depressions that are now marginally used;
the few villages located in these areas will be protected by dikes. There will be
no relocation of farmers. Farmers whose lands are temporarily used as desilting
basins will be given alternative land for temporary cultivation or compensated at a
rate of Y4,500 per ha per year. Some would be temporarily emplyed by local ruralenterprises. The compensation for basins required initially for the project has
been included in the project cost; subsequent basins will be met from annual 0 & N
funds. The management program for the silt retention basins was found to be
satisfactory and acceptable to the Bank/IDA.
' Guidelines for Application of Pesticides, 08 8321.1.87, 8321.2-87 nd 8321.349, isued by MiZisIy of Agiculture.
' totAl of about 20,000 ha hba been planned for use over the next 25.30 years for the two irripdon ems.

33
3.48 The diversion of Yellow River water into the now dry Nansi Lake willrestore and maintain thc lake's original water surface area of about 600 sq km.This will rovive an important habitat for birds, water fowl and aquatic life, andquickly recharge groundwater aquifers on the periphery of the lake. Since thediverted Yellow River water is "alien" to the lake, its long-term impact on the lakelimnology will be monitored, although no adverse effect is foreseen at this stage.The diversion of Yellow River water via the Liangji Canal to Nansi Lake passesthrough a large tract of low-lying land to the west of the Liangji Canal. As theLiangji Canal will be designed to ccivey water at a level below the general groundlevel, drainage of this low-lying land will not be affected. However, observationwells will be inotalled to monitor changes in water table level and aalinity.
3.49 Groundwater Ouality. The project will significantly increase the use ofpesticides and fertilizers. Changes in water quality associated with this increaseduse of agro-chemicals will be monitored by a network of monitoring stations to beoperated by the agro-environrnental protection units of the provincial bureaus ofagriculture. Pesticides to be used under the project would be subject to priorapproval by the Bank/IDA (para. 3.45).
3.50 Environment Manacement Proaram. Each Province has established anenvironmental unit under the provincial PMO. The unit is headed by a representativeof the Provincial Environmental Protection Agency and comprises members fromenvironmental monitoring units of the bureaus of water resources and agriculture.The unit will design and implement environmental management programs to meetspecific needs of each Province. These programs will include establishing baselinesurvey, collecting and analyzlng data, monitoring and evaluating the impact of theproject activities on envlronment, recommending and enforcing physical andregulatory measures, where applicable, to preserve and protect the *nvironment(Annex t)
3.51 Each Province will furnish an environmental management program to theBank/IDA for review no later than December 31, 1991. The Agro-environmentalProtection and Rural Energy Bureau of the MOA will provide technical guidance to theprovincial units in executing and managing these programs. Staff training, studytours and equipment also will be provided under the project to strengthen executionof the program. Each provincial PMO will review the annual progress report preparedby the environmental monitoring units and furnish the findings to the Bank/IDA foreach calendar year by March 31 of the following year. Assurances have been obtainedat negotiations from the Provinces that environmental units will be adequatelymaintained, environmental management programs will be furnished to the Bank/IDA forprior review before December 31, 1991, and that provincial PMOc will review andfurnish the results of the annual environment monitoring to the Bank/IDA by March 31of the following year.
Imo10uentation Schedule
3.52 The pro-t :t will be implemented over a five-year period between June1991 to June 1996. nsowever, some of the earthworks will be started during thewirter of 1990/91 to take advantage of labor available during the idle period offarmi .q activities. At negotiations, an assurance has been obtained that eachprovincial PMO will prepare and furnish to the Bank/IDA by December 31 of each year,a detailed annual budget and work program covering project activLties to beimplemented in the following year.
3.53 The primary and secondary irrigation and drainage systems will beconstructed during the first three years of the project. The tertiary systems willbe added during the third to fifth years. The constructLon of tubewell irrigationareas will be evenly phased over the five-year period in order to accommodate thelow supply of pipe materials and steep demand for skilled construction workers. The

34
construction and improvements to the pumping stations along the Grand Canal alsowill be completed during the first three years. The improvement and expansion ofirrigation areas will be started from the second year.
3.54 Facilities for agricultural intensification and support services will beimplemented in parallel with the irrigation and drainage works. Each project countywill carry out project activities in sequence, starting with land improvement andagrotechnical extension, followed by seeds development, mechanization services, andafforestation. Training initially will focus on project management for projectstaff and then will be extended to technical staff. Training of farmer agro-technicians and farmers would be scheduled annually during the implementationperiod.
3.55 The implementation schedules proposed by the three Provinces appear tobe feasible (Charts No.2 A-C). The schedules take into account the capability andstrong support to be provided at each administrative level and the technical bureausand design institutes. The three provincial governments have demonstrated theircapability for project implementation in ongoing Bank-financed projects.
Cost Estimates
3.56 The project is estimated to cost about US$593 million, including aforeign exchange component of US$334.7 million or 56% of the project cost. Thebreakdown of costs is summarized in Table 3.5. Taxes are not included in the costestimates since civil works and buildings are essentially tax-free and importedmachinery, equipment and materials are exempted from duties. The cost estimates arebased on quantities derived from preliminary designs completed, unit prices updatedto January 1, 1991 to reflect current prices for similar construction work andmaterials in each Province, and price lists of local and overseas manufacturers andsuppliers of machinery, equipment and vehicles. Design, engineering and supervisioncosts are estimated at 1% of total civil works and building costs. Administrationand management costs have been calculated at 1% of the base cost. rhysicalcontingencies are provided at 5% on all activities except the Grand Canal works,land improvement and on-farm works, for which physical contingencies of 10% havebeen provided. Price contingencies for both foreign and local costs are 3.6% for1991-95 when expressed in US dollars, and 10% for 1991, 8% for 1992, and 5% for1993-95 when expressed in Yuan. The estimated costs for each Province aresummarized in Table 3.5 and detail in Annex 2, Tables 1-1, 1-2, 1-3 for the threeProvinces.
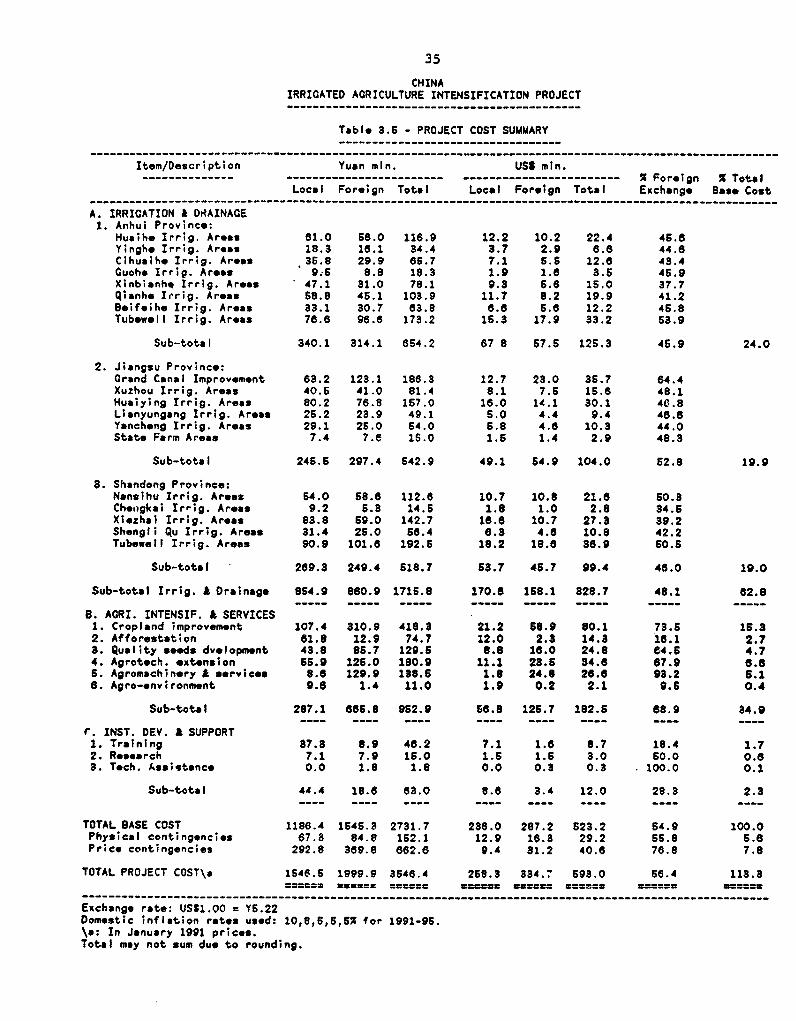
35
CHINAIRRIGATED AGRICULTURE INTENSIFICATION PROJECT---------------------------------------------
Table 3.6 - PROJECT COST SUMMARY
Item/Description Yuan mn. USS mn.______________ ------------------------ _-------_--- - -- X Foreign % TotalLocal Foreign Total Local Foreign Total Exchange Base Cost
A. IRRIGATION k DRAINAGE1. Anhui Province:
Husihe Irr;g. Areas 61.0 58.0 118.9 12.2 10.2 22.4 46.6Yinghe Irrig. Areas 18.3 16.1 34.4 3.7 2.9 6.8 44.6Cihua;h* Irrig. Areas 36.8 29.9 65.7 7.1 5.S 12.8 43.4Cuohe Irrig. Areas 9i5 8.8 18.3 1.9 1.6 3.5 46.9Xinbianhe Irrig. Areos 47.1 31.0 78.1 9.3 6.6 15.0 37.7Qasnhe Irrig. Areas 68.8 45.1 103.9 11.7 8.2 19.9 41.2Beifeihe Irrig. Areas 33.1 30.7 63.8 6.6 65. 12.2 45.8Tubewell Irrig. Areas 76.8 96.6 173.2 15.3 17.9 33.2 53.9
Sub-total 340.1 314.1 654.2 67 8 57.5 125.3 4S.9 24.0
2. J;angsu Province:Grand Canal Improvement 63.2 123.1 188.3 12.7 23.0 35.7 64.4Xuzhou Irrig. Areas 40.5 41.0 81.4 8.1 7.6 15S. 48.1Huaiying Irrig. Areas 80.2 78.8 157.0 16.0 14.1 30.1 46.8Lianyungang Irrig. Areas 25.2 23.9 49.1 S.0 4.4 9.4 48.6Yanch,ng Irrig. Areas 29.1 25.0 54.0 5.8 4.6 10.3 44.0State Farm Areas 7.4 7.e 15.0 1.5 1.4 2.9 48.3
Sub-total 245.5 297.4 642.9 49.1 54.9 104.0 62.8 19.9
3. Shandong Province:Nansihu Irrig. Areas 64.0 58.6 112.6 10.7 10.8 21.8 60.3Cheiigkai Irrig. Areas 9.2 6.3 14.6 1.8 1.0 2.8 34.5Xiezhai Irrig. Areas 83.8 59.0 142.7 16.6 10.7 27.3 39.2Shengli Qu Irrig. Areas 31.4 25.0 56.4 6.3 4.6 10.8 42.2Tubewell Irrig. Areas 90.9 101.8 192.5 18.2 18.8 38.9 50.6
Sub-total 269.3 249.4 518.7 53.7 45.7 99.4 46.0 19.0
Sub-total Irrig. A Drainage 854.9 880.9 1715.8 170.6 168.1 828.7 48.1 82.8_ -- -- - -- _- -- - _ -- --- _ -- --- -- --- _ - - - -- _--
B. AGRI. INTENSIF. & SERVICES1. Cropland improvement 107.4 310.9 418.8 21.2 58.9 80.1 73.5 15.32. Afforestation 61.8 12.9 74.7 12.0 2.3 14.3 16.1 2.73. Quality seeds dv-lopment 43.8 86.7 129.6 8.8 16.0 24.8 e4.5 4.74. Agrotech. extension 56.9 126.0 180.9 11.1 23.5 34.6 67.9 6.6S. Agromachinery £ services 8.6 129.9 138.6 1.6 24.8 26.6 93.2 5.18. Agro-environment 9.6 1.4 11.0 1.9 0.2 2.1 9.5 0.4
Sub-total 287.1 686.8 962.9 56.8 126.7 182.5 68.9 34.9
C. INST. DEV. A SUPPORT1. Tra;ning 37.8 8.9 46.2 7.1 1.6 8.7 18.4 1.72. Research 7.1 7.9 15.0 1.5 1.5 3.0 50.0 0.6B. Tech. Assistance 0.0 1.8 1.8 0.0 0.3 0.3 100.0 0.1
Sub-total 44.4 18.6 63.0 8.e 3.4 12.0 28.3 2.3
TOTAL BASE COST 1188.4 1545.3 2731.7 238.0 287.2 523.2 S4.9 100.0Physical contingencies 87.3 84.8 152.1 12.9 16.3 29.2 65.8 5.8Price contingenc;es 292.8 369.8 862.8 9.4 31.2 40.e 76.8 7.8
TOTAL PROJECT COST\s 1546.5 1999.9 3546.4 268.3 334.7 593.0 56.4 113.3===3== *===== ====== *====e a==== ===s = ====5=
--------------------------------------------------------------- __------------__--------------------------
Exchange rate: USS1.00 = YS.22Domestic inflation ratos used: 10,8,5,5,5w for 1991-95.\a: In January 1991 pricos.Total may not sum due to rounding.
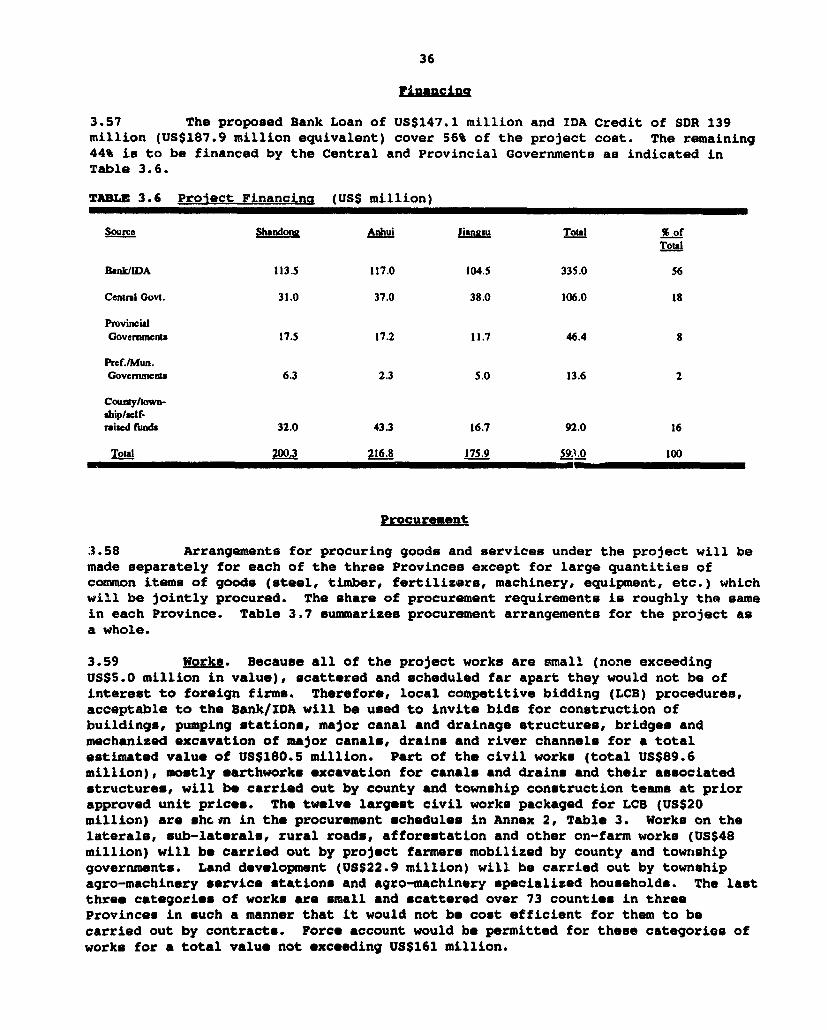
36
Einancina
3.57 The proposed Bank Loan of US$147.1 million and IDA Credit of SDR 139
million (US$187.9 million equivalent) cover 56% of the project cost. The remaining
44% is to be financed by the Central and Provincial Governments as indicated in
Table 3.6.
TABLE 3.6 Proiect Financing (USS million)
Source Shandong Anhui Jian, To % ofTotal
Bank/IDA 113.5 117.0 104.5 335.0 56
Centrl Govt. 31.0 37.0 38.0 106.0 18
ProvincialGovernacnts 17.5 17.2 11.7 46.4 8
Pref./Mun.Govemmcnts 6.3 2.3 5.0 13.6 2
Counayltown-ahip/self-rised finds 32.0 43.3 16.7 92.0 16
Total 200.3 216.8 175.9 A9. LO 100
Procuresent
3.58 Arrangements for procuring goods and services under the project will be
made separately for each of the three Provinces except for large quantities of
common items of goods (steel, timber, fertilizers, machinery, equipment, etc.) which
will be jointly procured. The share of procurement requirements is roughly the same
in each Province. Table 3.7 summarizes procurement arrangements for the project as
a whole.
3.59 Works. Because all of the project works are small (none exceeding
US$5.0 million in value), scattered and scheduled far apart they would not be of
interest to foreign firms. Therefore, local competitive bidding (LCB) procedures,
acceptable to the Bank/IDA will be used to invite bids for construction of
buildings, pumping stations, major canal and drainage structures, bridges and
mechanized excavation of major canals, drains and river channels for a total
estimated value of US$18O.5 million. Part of the civil works (total US$89.6
million), mostly earthworks excavation for canals and drains and their associated
structures, will be carried out by county and township construction teams at prior
approved unit prices. The twelve largest civil works packaged for LCB (US$20
million) are shcsn in the procurement schedules in Annex 2, Table 3. Works on the
laterals, sub-laterals, rural roads, afforestation and other on-farm works (US$48
million) will be carried out by project farmers mobilized by county and township
governments. Land development (US$22.9 million) will be carried out by township
agro-machinery service stations and agro-machinery specialized households. The last
three categories of works are small and scattered over 73 counties in three
Provinces in such a manner that it would not be cost efficient for them to be
carried out by contracts. Force account would be permitted for these categorios of
works for a total value not exceeding US$161 million.

37Table 3.7 Procuremnt Profile (US$ million)
Ekifft El;! La I&l Other2 Ak NA \c
LAnd 0.0 0.0 0.0 7.3 7.3(0.0) (0-0)
Work \b\3 0.0 180.5 89.6 0.0 270.1(75.3) (37.6) (112.9)
Land Irovnemelt/Affomeltion/ 0.0 0.0 70.9 0.0 70.9On-farm work X1 (15.6) (1S.6)
Goods 127.3 67.1 29.6 0.0 224.0(117.3) (59.6) (22.6) (199.5)
Training and 0.0 0.0 13.7 0.0 13.7R69earch (6.5) (6.5)
Tech. Asuisance 0.0 0.0 0.5 0.0 0.5(0.5) (0-5)
DesgWEnring/Admin/MSge.nt 0.0 0.0 0.0 6.5 6.5
(°-0) (0.0)
TOTAL 127.3 247.6 204.3 13.1 593.0(117.3) (134.9) (82.8) (0.0) (335.0)
Noic: Fgprs in parnhsis are the resective anmou financed by Bank/IDA.%a: N/A - not applicable (local coda).\b: Includes buildiqgs and utlitics.%J: incdes force accoumt work for eatiiworks and onfainr work conimated by orgnsd lbor.U: Includes LIB. dopping and direct purch from sole source.13: Excluding cost of consruction materi (seel, cement & timber).
3 60 Gods The equipment, materials and supplies to be procured for theproject are estimated to cost US$224 million. Thezs will be procured by threemethods: (i) IC8 will be used to procure steel, timber, fortiLizer, agro-chemicals,vehicles, larger equipment and major materials. These items are estimated to costabout US$127.3 million in total, or 57 percent of all goods. Domestic manufacturerswill receive margin of preference equal to 15 percent of the c.i.f. price ofimported goods, or the actual import taxes, whichever is the lesser in theevaluation of ICB bids. Contracts for equipment, materials and supplies would begrouped into packages of US$200,000 or more. (Li) Small agricultural machinery,euipment and attachments of various kinds (US$33.3 million), and cement (US$33.8million) will be procured through local competitive bidding (LCB) proceduresacceptable to the Bank/IDL in which foreign suppliers may participate. None of thepackages for LCB would exceed US$200,000. (iii) Computers, engineering, laboratoryand other specialized equipment (totaling US$3.7 millioni) will be procured throughlimited international bidding (LID). There are only a limited number of suppliersof this specialized equipment yet enough to assure competitive prices, therefore ICBwould not be the most economlc and efficient method of procurement. Smallquantities of office, training and engineering equipment, laboratory instruments,workshop tools and other miscellaneous goods (totaling US$8.0 million) will beprocured through domestic shopping. None of the packages for shopping would excaedUSS50,000 per contract and aggregating to not more than US$8.0 million for the threeProvinces. Planting materials includlng tree saplings, cuttings, seedlings, seedsetc. (totaling US$14.1 million) will be purchased directly from local productionteams and specializod houoeholds.
38
3.61 Due to its limited shelf life and the need to supply to numerousscattered project sites, cement (US$33.8 million) will be procured in small batches(not exceeding 100 tons each batch). Cement is produced in the three projectProvinces at competitive price. Therefore, cement required for the project will beprocured under an indefin:.te quantity blanket order arrangement in which LCB bidswill be solicited annually from suppliers and manufacturers on a fixed-prices basis.The PMO0 will place orders with suppliers and manufacturers who offer the bestdelivered price according to the needs which are impossible to schedule in advance.
3.62 A detailed list showing how each item of machinery, equipment andmaterials will be procured is provided in Annex 2, Tables 2-1 to 2-3 for each of theProvinces. The procurement schedules in Annex 2, Tables 3-1 to 3-3 show how thegoods are to be packaged and when they would be procured and delivered.
3.63 Trainina. Technical Assistance. Research etc. Training and research,costing about US$13.7 million, will be carried out based on prior agreed programs.Technical assistance (US$0.5 million) will bo procured in accordance with the BankGroup's guidelines for employment of consultants. Details are given in Annex 2,Tables 5-1 to 5-3. Other items of expenditures (land acquisition, design,engineering, supervision, administration and management), amounting to about US$13.8million, will be locally funded.
3.64. Bank/IDA Review. Bidding documents for all goods and works packages inexcess of US$200,000 will be subject to prior review by the Bank/IDA. This reviewwill cover approximately 12 works contracts (7 percent of total works by value) and33 goods packages (60 percent of total goods by value) over the five-yearimplementation period. Bidding documents will be standardized after review by theBank/IDA and used in preparing subsequent bid documents. All reimbursable trainingand technical assistance programs will be subject to prior Bank/IDA review. Othercontracts will be subject to selective review after bid awards. Each Province hasappointed two procurement agencies to carry out procurement activities. Theseagencies ar- selected from among the International Tendering Company (ITC) of theChina National Technlcal Import Corporation, the International Tendering Division ofthe China Machinery Import and Export Corporation (CMIEC), and the China InstrumentImport and Export Corporation (CIIEC). All Lhese agencies have procurementexperience on Bank Group projects and are acceptable to the Bank/IDA.
Riabursenets
3.65 Disbursements for machinery, equipment, vehicles and materials will bemade against 100% of the foreign expenditures of these items, 100% of the ex-factoryprice of locally manufactured items, and against 75% of expenditureu for itemsprocured locally. Disbursements against LCB contracts for civil works, buildingsand utilities will be made against 40% of contract expenditures, excluding the costof construction materials (steel, cement, timber) supplied under the project.Disbursments against on-farm works,\' rural roads, afforestation and landimprovement wlll be made againot 20% of force account expenditures. Disbursementsfor project otaff training, technical assistance and research will be made against100% of total expenditures. To take advantage of labor availability during theidling period of farming activities and the :990/91 winter season, retroactivefinancing for earthworks, structures, tub-wells, rural roads, land improvement,afforestation work, and small quantities of machinery, equlpment, construction andagricultural materials has been recommended for expenditures incurrod from November1, 1990 to the date of signing of the Loan/Credit Agreement. The total disbursableamount will be SDR11.1 million (US$15 million equivalent); Anhui SDR3.4 million
WIue talm mu abtawl cuadrins and on-rum a scntum.
39
(US$4.6 million equivalent), Jiangsu SDR2.2 million (US$3.0 million equivalent) andShandong SDR5.5 million (US$7.4 million equivalent) based on the work programsapproved in advance by the Bank/IDA.
3.66 Statements of expenditures (SOEs) will be required for diabursement tobe made against overseas training, study tours, contracts for goods and servicescosting less than US$200,000, and force account work. SOEs for civil works,irrigation and drainage, on-farm works, rural roads, land improvement andafforestation are to be supported by progress reports showing physical quantitiesand unit prices, the latter updated annually and reviewed by the Dank/IDA.
3.67 To facilitate disbursem-nts, the Bank/IDA will provide fund. to eachProvince to establish a Special Acc,.nt, with an initial deposit of SDR5.25 million(US$7.1 million equivalent) for Anhui, SDR4.8 million (US$6.5 million equivalent)for Jiangsu and SDR5.1 million (US$6.9 million equivalent) for Shandong, in a bankacceptable to the Bank/IDA. This Special Account will be operated and maintained bythe Provincial PMO. Provincial PMOe will prepare and submit applications fordisbursement and replenishment of the Special Account monthly or whenever theaccount is drawn down to half its initial deposit amount, whichever comes first.The project is expected to be completed by June 30, 1996 and to close on June 30,1997. Disbursements for agricultural projects in China have been better thanaverage for the Bank and the Asia Region. The estimated schedule of disbursementsis given in Annex 2, Table 4 and Chart No.3. The disbursement profile is comparablewith that for specific investment loans for agricultural projects in China.
Accounts and Audits
3.68 County PMOs will maintain records of all project expenditures. Theserecords will be forwarded regularly to .he provincial PMOs, who will consolidate theaccounts of expenditures and submit them to the Bank/IDA. At negotiations,assurances have been obtained from the three Provinces that the provincial PMOs willmaintain consolidated project accounts which will be audited by an independentauditor. The State Audit Administration will be acceptable for this auditingpurpose. The audited accounts will be submitted to the Bank/IDA within six monthsof the close of each financial year. The audited accounts are to include details onwithdrawals from the Loan/Credit account made on the basis of SOEs, and theauditor's opinion as to whether such withdrawals were made against expenditureseligible for reimbursement by the Bank/IDA.

40
IV. ORGAN!ZATIOK AND MAGEME
Proiect oraanizatiga
4.1 Geonral Structure. At the central level, the Ministry of Water
Resources (MWR), in close cooperation with the Ministry of Agriculture, will guide
the three project Provinces in project implementation. The MWR's Economic
Cooperation Division (ECD) of the Department of Foreign Affairs will function as the
Central Project Coordinating Offic- (CPCO) and will work closely with the MOA's
Office of External Economic Relations in coordinating project activities. The CPCO
will provide general guidance to Anhui, Jiangsu and Shandong Provinces in
implementing the project components in their respective provinces. The organization
of the project is shown in Chart No.l.
4.2 Central Proiect Ste-rinc Group (CPSG) and the CPCO. To guide the CPCO
in project policy matters, the MWR has established a Central Project Steering Group
(CPSG). This group will be chaired by a Vice Minister of Water Resources and its
members will include the MWR's directors of Foreign Affairs, Planning, Finance,
Farmland Irrigation and Water/Soil Conservation, and a representative from MOA.
Though located in the MWR, the CPSG will work closely with the MOA to formulate
project policies designed to achieve the project's integrated objectives. The CPSG
will review progress, coordinate project implementation, and resolve issues that
develop between i4WR, MOA and the three Provinces. The CPCO's main function will
include: (i) coordinate project implementation and management, which includes
overall project planning and reviewing technical proposals, resolving major
engineering issues and issuing guidelines for the preparation of technical reports;
(ii) resolve conflicts that emerge among provinces in water resource use and
allocation; (iii) review and approve preliminary designs for major works; (iv)
coordinate training, technical assistance and research activities; (v) provide
liaison between the Bank/IDA and the three Provinces; (vi) assist in reviewing and
monitoring progress of project implementation; and (vii) assist provinces in mid-
term review and preparation project completion report. Assurances have been
obtained at negotiations that the CPSG will be maintained with composition and
responsibilities acceptable to the Bank/IDA.
4.3 Project Leadino Grour s. Project leading groups (PLGs) have been
established at the provincial, prefecture, and county levels. They are chaired by a
senior administrative official at each level. The provincial PLGs, directly
responsible to the provincial governments, will: (i) formulate project polices based
on guidelines from the CPLG and the provincial government; (ii) review project
planning and progress; (iii) ensure the budgetory allocation of sufficient
counterpart funds and guide the expenditure of all project funds, and (iv)
coordinate project implementation issues. The PLGO at all levels will include
representatives from the Planning Commission, Agricultural Commission (where
applicable), Bureaus/Departments of Finance, Water Resources, Agriculture, Audit,
the Provincial Environmental Protection Agency, and the Provincial 3H Agricultural
Development Office.
4.4 Project Management Offices (PMOs}. PMOs also have been established at
the provincial, prefecture and county levels serving as executive arms of the PLGs.
In Shandong, the provincial PMO is under the administrative control of the Bureau of
Finance; in Anhui, under the Provincial Planning Commission; and in Jiangsu, under
the Bureau of Agricultural Resources Comprehensive Development and Management. Each
PMO has generally five departments--administration/coordination, finance,

41
agriculture, water resources and environmental protection. These departments arestaffed by 15 to 20 full-time profeEaionals transferred from relevan_ administrativeand technical departments and/or staff recruited especially for taese positions.
The county PMOs will have primary responsibility for implementing most projectactivities and are staffed mainly by personnel from the county departments of Water
Resources, Agriculture, Planning, Finance and Environmental Protection. The PMO0will: (i) prepare detailed annual work plans and budgets; (ii) review and approvelower level PMO work plans; (iii) monitor physical and financial progress; (iv)revi-e and approve designs and technical specifications for works and goods; (v)pl&n, administer and coordinate project training and technical assistance; (vi)undertake procurement of works under LCB procedures and coordinate with theprovincial PMO on ICB, LIB and LCB procurement of goods; (vii) prepare, collate andsubmit detailed project progress reports, accounts and audits to the provincial PMO
for consolidation and submission to the Bank/IDA; (viii) assist the provincial PMO
in preparing disbursement applications for Bank/IDA funds; (ix) monitor and evaluate
the project's benefits and impact; and (x) coordinate between the project and thevarious supporting technical and financial departments. Assurances have been
obtained at negotiations that the PLGs will be maintained with composition andresponsibilities acceptable to the Bank/IDA and that the PMOs will be maintainedwith functions and responsibilities acceptable to the Bank/IDA, staffed by competentstaff in adequate numbers.
4.5 Irrigation Area Engineering Headcuarters. Some of the project'sirrigation and drainage works will cross county or prefecture boundaries. In thesecases, the prefecture or provincial Bureau of Water Resources (BWR) will establishengineering command headquarters to organize and supervise construction of theworks. These offices, staffed by BWR engineers, will work closely with the
prefecture and county PMOs and the Bureaus/Departments of Water Resources. Afterthe project is completed, these command headquarters will become irrigationdistricts or area management offices overseeing the operation and maintenance ofactivities under the jurisdiction of the Bureau/Department of Water Resources.
4.6 Technical Consultative GrouDs /TCGsl. Technical Consultative Groups
(TCGs), comprising scientists, specialists and engineers, will be established at thecentral and provincial levels to advise the CPSG, PLGs and PMOs. Initially, the
TCGs will review project preparation and feasibility reports, select and designproject sub-components, and evaluate project economic beneiits. During
implementation, the TCGs will advise on specific engineering problems; on technicalspecifications for machinery and equipment; and on training, extension and research
programs. To provide technical support at the central level, the TCG will use theresources of the 3H Development Research Office of the Chinese Academy ofAgricultural Sciences (CAAS) (some 500 scientists and specialists) for the
agricultural component, and the Yellow River and Huai River Commissions for thewater conservancy component. Provincial TCGs will use experts from the provincial
research institutes and universities. To avoid duplication of effort among the
three Provinces, the central and provincial TCGs will closely coordinate theirrespective research activities for major crops, seeds development and varietalimprovement, and production technologies.
Financial Management
4.7 Flow of Bank/IDA Funds. Assurances have been obtained at negotiations
that the GOC will onlend the proceeds of the Bank Loan and IDA Credit to the three
Provinces on terms and conditions satisfactory to the Bank/IDA. Understadings were
reached at negotiations that the GOC will onlend to the Provinces for 15 years
42
including 5 years of grace with interest at 5 percent annum. Each Province willrelend the Bank/IDA funds at the same terms to the prefecture/municipal governmentswho, in turn, will relend to county governments. The foreign exchange risk will beborne by the Provinces. At each level of onlending, contracts will be signedi dicating the terms and conditions of onlending. At the county level, the county_.Os will onlend and collect repayments, through signed contracts, to and from
township/village agricultural service stations for the agricultural machinery,equipment and production inputs. Part of the Bank/IDA '-nds will be paid directlyto suppliers of goods under ICB, LIB and LCB contracts on requests by the provincialPMOs. A small portion of funds will be used to cover the costs of training,technical assistance and research. The remaining funds will be disbursed againstlocal expenditures for civil works, buildings, on-farm works, afforestation, landimprovement and goods procured locally.
4.8 Sources and Flows of Domestic Funds. Domestic funds, which will financeabout 44% of the project costs, will be contributed by the central, provincial,prefecture, county and township governments as well as project beneficiaries. Thecentral government's contribution will come froi,n the special "3H AgriculturalDevelopment Fund" allocated annually for agricultural development in the North ChinaPlain. Other governments' contributions will be raised through budgetaryal3cations. Project beneficiaries will contribute both funds and labor forearthwork construction. The central, provincial, prefecture, municipality, countyand township governments would provide, in timely fashion, their requiredcontributions to local counterpart funds. The PMOs will deposit counterpart fundsin special accounts in the county branches of the Agricultural Bank of China (ABC)or the Construction Bank of China. These banks will act as fiscal agents for thecounty PMOs to disburse funds and receive repayments, but will not be responsible
for enforcement of repayments. This resDonsibility will remain with the countyPMOs.
4.9 Recovery of Proiect Investments. County PMOs will be responsible forboth disbursing funds to and recovering funds from project beneficiaries. Townshipand county governments will repay the prefecture governments, which in turn willrepay the provincial governments. The latter will repay the HOF for the Bank Loanand IDA Credit used. Full recovery of the Bank/IDA portion of the project fundswill be guaranteed by the bureaus/departments of finance at all levels in eachProvince. Domestic funds will be similarly recovered, in accordance with terms andconditions determined by each provincial government.
4.10 Terms and Conditions of Bank Loan/IDA Credit. A project agreement willbe signed between the Bank/IDA and the three Provinces incorporating the aboveterms. State Council approval of the Loan and Development Credit Agreements will bea condition of effectiveness for the Loan/Credit.
Execution and Sunervision of Proiect Works
4.11 Execution. Prior to implementation, the provincial PMOs will evaluatein details those county proposals to finance project activities not appraised by t'leBank/IDA to ensure that they are consistent with overall project objectives and theyhave economic rates of returns comparable to those of the relevant representativemodels.' At negotiations, assurances have been obtained from the Provinces that the
The appraisal mission covered 100% of the four surface irrigation schemes and 25% of tubewell irrigation areas in Shandong; 100% ofthe two river basin areas and 20-25% of the surface and groundwater irrigation areas in Anhui; and 25% of the surface water irrigation areasin the four regions of Jiangsu.

43
provincial PMOs will evaluate and notify the Bank/IDA of those county proposalsaccepted for implementation under the project and their respective economic rate ofreturns. The county PMOs will have primary responsibility for executing andmanaging most project works, and will use a variety of implementation methods asillustrated below. They will let LCB contracts to local construction teams orenterprises to construct both irrigation and drainage works from branch canals anddrains onward (see Para. 4.5 above), and for seed processing and agriculturalextension buildings. They will use local contractors or direct labor contracts forthe construction of minor facilities and the installation of equipment at seed farmsand centers, agrotechnical extension centers and stations, and agri-machineryservice stations. They will utilize county or township construction teams underforce account operations for the construction and rehabilitation of tubewells andpiping systems. They will organize and use local farm labor, mobilized and fundedby individual villages, to construct earthworks and accomplish on-farm works, landimprovement, and afforestation, also under force account operations. For theproject's largest construction job-the pumping stations and other improvements onthe Grand Canal - the Jiangsu provincial PMO will award contracts by LCB to bemanaged by the Jiangsu Provincial Bureau of Water Resources.
4.12 Sunervision. Day to day supervision of project works will beaccomplished by implementing departments. Further, to ensure that work schedulesand quality standards are met, a joint ministry/province team will monitor andinspect project works at half-yearly intervals and send its findings andrecommendations to the provincial PMO0.2 The provincial PMOs will furnish thesefindings and recommendations tc the Bank/IDA together with the half-yearly progressreports stipulated in para. 4.18.
Overation and Maintenance
4.13 Existina Operation and Maintenance Procedures. The responsibility foroperation and maintenance (o&M) of water conservancy works is shared among differentlevels of governments and water-users in the three Provinces. In Jiangsu, the GrandCanal, the trunk canals and main drainage channels are the responsibility of theprovincial Bureau of Water Resources. For irrigation systems crossing more than onecounty, O&M is undertaken by irrigation district or area management offices underthe prefecture or municipal department of water resources. For smaller areas andfor branch canals and below, county departments of water conservancy provide the O&Mtogether with the units at the township or village levels. Laterals and sub-laterals are generally maintained by the water users through annual contributedlabor and are operated by ditch riders or canal headmen selected by the water users.In tubewell irrigation areas, operation, maintenance and management is handled atthe village level by groups which receive technical assistance from the waterconservancy units. Tubewells are contracted to tubewell operators by the villagegroups. Farmers in tubewell irrigation areas are charged water fees based on actualO&M costs, which include repair and depreciation of equipment.
4.14 O&M Enhancements. As the project involves improvements to andexpansions of existing irrigation schemes, organizations already are in place tocarry out O&M activities. However, these organizations require certain changes andenhancements in order to make O&M more effective and efficient. The project willprovide training for irrigation staff in operating and managing large irrigationsystems and associated machinery, equipment, and vehicles. For more efficient water
2 The joint ministry/provincial supervision teams will consist of one representative each from MWR, MOA and the three ProvincialGovernnents.

44
management, the project will construct water management centers in Jiangsu and Anhuicomplete with facilities and equipment (both hardware and software) to monitoroperation of the Grand Canal in Jiangsu and the major irrigation schemes along the
Huai River system in Anhui. Currently, the two Provinces have no such system inoperation. The O&M procedures for larger irrigation schemes will be systemically
documented in a Plan of Operation and Maintenance (POM) to be prepared by eachProvince based on the World Bank Technical Paper No.99 given to each Province..3 Thedraft plan for each identified surface water irrigation scheme will be furnished tothe Bank/IDA for comment not later than December 31, 1991. Thereafter, the planswill be issued to irrigation O&M staff at all levels for trial operation for aperiod of three years. After this time the plan will be reviewed, revised asnecessary and re-issued before December 31, 1995 based on the results of the trialoperation. At negotiations, assurances have been obtained on the preparation andissuance of the POMs as indicated above.
4.15 Surface Irrigation O&M - Fundina Considerations. Unlike tubewellirrigation areas, which self-finance their O&M, surface irrigation areas generallyreceive government subsidies to cover their O&M costs. Current water fees collectedare barely enough to meet annual O&M costs. Water fees are supplemented by the 12to 15 days of labor (per year) contributed by each farmer for canal and drain repairand desilting work. Very little funds are left over for major repair, replacementof structures, or equipment installations. This explains the poor and deterioratingcondition of most project schemes. Existing water fees collected range from a lowof Y3 to Y8 per 1,000 cu m in Jiangsu, to a high of Y25-Y30 in Anhui and Shandong.For the project, the three Provinces have agreed to raise water fees in stages to atleast meet full annual O&M costs, plus major repair and replacement costs.4 In1990, Anhui proposed immediate increases in water fees to cover 100% of annual O&Mcosts. In Jiangsu the WRB has proposed increases for 1992, to cover full annual O&Mcost and 100% of depreciation. Shandong is gradually increasing its charges tocover 100% of annual O&M costs and 75-100% of depreciation costs by 1995. TheAssurances have been obtained at negotiations from each Province that water chargeswould be collected at rates, revised periodically as necessary, to cover at leastthe full annual 0 & H costs.
Prolect Launch Workshop
4.16 To initiate project implementation, the Bank/IDA will conduct a projectlaunch workshop in each Province during May and June 1991 for the staff ofprovincial, prefecture and county PMOs. The objectives of the workshop will be toclarify the role and responsibilities of PMOs at each level and to familiarize staffwith project work planning, implementation and management. Other topics to beincluded will be: (i) procurement and disbursement procedures; (ii) financialadministration and management; (iii) monitoring and evaluation; and (iv) recordkeeping and reporting. Project staff experienced in Bank-financed projects will beinvited to share their experiences.
' Planninz the Manaeement. Operation and Maintenance of Inijation and DrainsEe Systems (A Guide for the Preparation of Stntegies andManuals) published jointly by the World Bank and the International Commission on Irrigation and Drainage.
I Anhui will raise rtes from YO.02-0.03 I /m3 presently to YO.046-0.095/m3, Jiangsu to Y0.00471m3 (from YO.003/m3), and Shandong toYO.0354-.055tOm (from YO.012-0.024/m3).

45
Monitorina. Evaluation and Retortina
4.17 PMO Monitoring and Evaluation Units. Full-time monitoring andevaluation (M&E) unit. will be established in the provincial PMOs to assess theproject's overall progress an well as the socio-economic benefits for each componentin the project area. Since the project components are simili, -`e AgricultureEconomic Research Institute of CAAS in Beijing has designed a uniform M&E system foruse by the three Provinces and will guide the M&E units' work. The Institute willalso assist in the analysis and evaluation of data collected. As part of theevaluation process, the M&E units will conduct a baseline survey of selected projectareas and beneficiaries not later than June 1991. The sample areas will bemonitored once a year during and after project implementation to evaluate projectbenefits and impact. Key monitoring indicators are presented in Annex 2 Table 7A-B.
4.18 M&E Record KeeDing and ReDorting. Using the standardized M&E reportingsystem and formats, the county PMOs will maintain detailed records on the physicaland financial progress of each project component. Physical indicators will includecomplete range of works completed, as well as machinery, equiLpment and materialsprocured. Financial records will detail all project expenditures, contributedlabor, and records of and supporting claims for disbursements against Loan/Creditproceeds. Regular monitoring of physical and financial progress will allow the PMOsto identify problems and take timely remedial measures. The provincial PMOs willconsolidate the physical and financial progress reports from county and prefecturePMos into semi-annual reports and furnish to the Bank/IDA by July 31 and January 31of each year.
V. PRODUCTION. MARKETS AND PRICES
Production
5.1 crop yields are expected to increase significantly with improvedirrigation and drainage, land improvement, development of improved varieties,appropriate fertilizer use, and a strengthened agricultural support servicesnetwork. Improved irrigation will enable farmers to change cropping pattern fromcourse grains (e.g., millet and sorghum) and sweet potato to high value crops suchas corn and rice.
Cropping Pattern
5.2 The total cultivated area is about 1.14 million ha and the presentcropped area is estimated at 1.89 million ha, which represents a cropping intensityof 166%. Wheat is by far the most important foodgrain and accounts for about754,400 ha; it is followed by corn with 250,900 ha, soybean 181,600 ha, and rice14Q,100 ha. Coarse grains (total 57,700 ha) and sweet potato (181,900 ha) haveresurged, primarily because of several years of drought. Cotton (136,600 ha) andoilseeds (92,700 ha) are the main cash crops. Wheat is normally planted in Octoberand harvested in May/June. Corn, rice, soybean and other grains are planted fromlate April to mid-June as soon as the wheat is harvested. The most common croppingsystem is wheat/corn, while wheat/rice, wheat/soybean and wheat/cotton are alsoencountered. Rotation systems generally feature three crops in two years. Withoutthe project, the cropping pattern is not expected to change. With the project andimproved irrigation, cropping intensity would increase slightly from 166% to 176%.
46
The area planted to rice would increase by 128% to 339,500 ha5, while the area
planted to sweet potato would decrease by 31% to 127,330 ha, and other grains by 34%to 38,000 ha. The decrease in area planted with sweet potato and other grains willoccur mainly in Anhui and Jiangsu. Figure 2 shows the cropping calendar.
Croo Yields and Production
5.3 As a result of the project, yield increases for the three Provincescombined are projected to be as follows: wheat - 19%, corn - 23%, rice - 21%, and
cotton - 35%. These changes would produce annual production increase as follows:2.5 million tons of foodgrain valued net of on-farm costs at US$422.3 million,
56,300 tons of ginned cotton worth US$80.5 million, 82,600 tons of oilseeds valuedat US$15.5 million, and 65,100 tons of other crops valued at US$ 9.4 million. Thepresent and future (at full development) cropping pattern, yields, and productionfor various crops are shown in Table 5.1. These yields are considered achievablebased on present yields and yields obtained at full development under the NCPproject. Yield projects for rice and corn are for hybrid varieties. Fulldevelopment would be achieved five years following completion of project works.
Markets
5.4 The incremental production from the project will be consumed locally andexported to regions which are deficient in domestically produced grains. The demand
for graina, oilseeds, and cotton in the project areas continues to increase as aresult of population and income growth. The growing rural industry input needs alsocreate a secure domestic demand for non-exported crops. Since 1980, project areasin the three Provinces have been designated collectively as one of China's majorgrain bases. However, cultivated land in these areas actually has decreased since1985.6 Product markets are described below.
5*5 Grains. Some of the 2.5 million tons of incremental grain production
from the project will be used to reduce national grain import. In 1989/90, China isexpected to have imported about 15 million tons of wheat, 1.2 million tons of riceand 0.3 million tons of maize. In 1989, the three Provinces produced 88.2 milliontons of grain or 21.6% of national output (Annex 1, Table 1). During the 1980s,Anhui and Jiangsu became large net exporters of grain and Shandong went from being anet exporter to a small net grain importer (see Annex 3, Table 9).
5.6 Most of incremental grain production in Anhui will be exported to areasdeficit in domestic grain; the remainder will be consumed locally. Much of
Jiangsu's projected incremental production is expected to be offset by per capita
production decline. (Per capita grain production declined from 544 kg in 1985 to 502kg in 1988. This trend is projected to accelerate through the life of the project.)
While a portion of Jiangsu's incremental grain production will be exported to graindeficit regions, provincial demand pressures will continue to erode the Province'snet grain export position. Shandong, lacking reliable water sources, will find itdifficult to maintain grain self-sufficiency and incremental grain produced will beused to meet local needs.
s For clinmtic, soil and economic reasons, paddy is the most suitable summer crop in many aras. It is more tolerant to waterlogging andslinity, and it gives higher production of grain per unit area than other foodgrain crops. Morm inportantly, farmere are keen to switch to paddy.
I Jiangw alone has lost over 13,000 ha of cropland every year since 1985, and expects to lose as much annually through the 8th FYP. Ruralinduril output value has grown at a phenomenal 30% annually in the 1978-1988 period. Jiangsu unprocessedgrain out-sales and out-allocationshave declined 5S percent from the 1986 all time highs of 3.02 million tons.
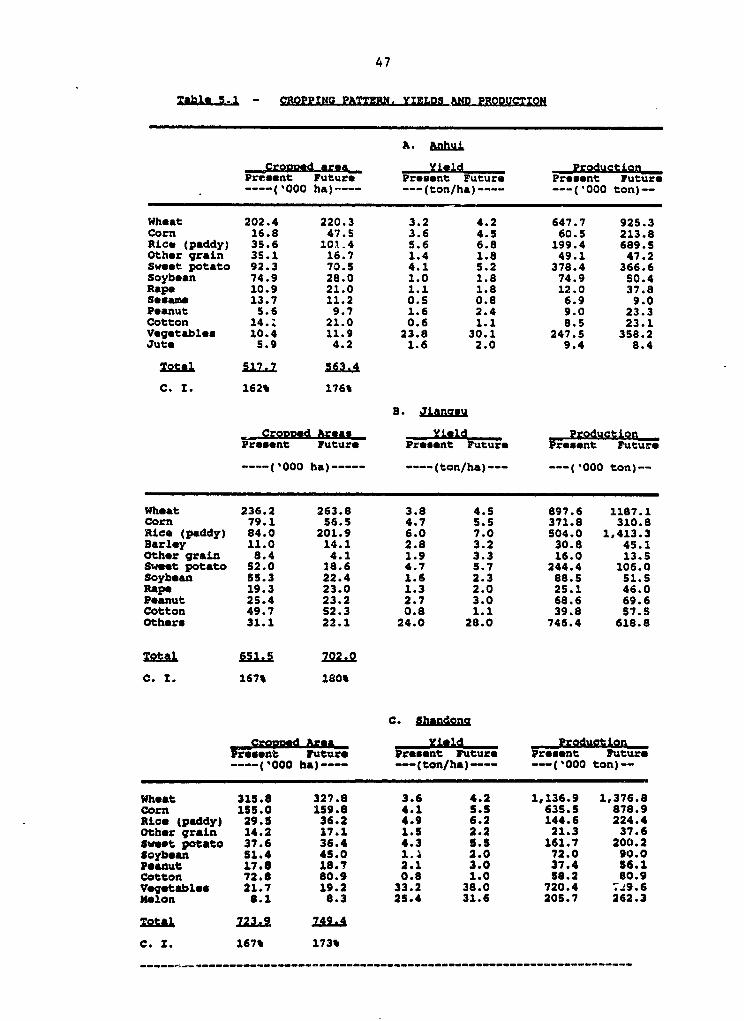
47
Table 5.1 - CROPPING PATTERN. YIELDS MQ FPRODURCTIO
A. Anhui
Crom=l lcarea Yield Pr2dU;tPresent Future Prsture utur Present Future
-- ('000 ha)---- ---(ton/ha)---- --- (000 ton)--
Wheat 202.4 220.3 3.2 4.2 647.7 925.3Corn 16.8 47.5 3.6 4.5 60.5 213.8Rice (paddy) 35.6 10'14 5.6 6.8 199.4 689.SOther grain 35.1 16.7 1.4 1.8 49.1 47.2Sweet potato 92.3 70.5 4.1 5.2 378.4 366.6soybean 74.9 28.0 1.0 1.8 74.9 50.4Rape 10.9 21.0 1.1 1.8 12.0 37.8Sesame 13.7 11.2 0.5 0.8 6.9 9.0Peanut 5.6 9.7 1.6 2.4 9.0 23.3Cotton 14.; 21.0 0.6 1.1 8.5 23.1Vegetables 10.4 11.9 23.8 30.1 247.5 358.2Jute 5.9 4.2 1.6 2.0 9.4 8.4
Total S17-7 563.4
C. I. 162% 176%
S. Jianasu
Cropped Areas _ield ProductionPr***nt Futuro Pre-snt Future Present Future
----('000 ha) ---- (ton/ha)--- --- (000 ton)--
Wheat 236.2 263.8 3.8 4.5 897.6 1187.1Corn 79.1 56.5 4.7 5.5 371.8 310.8Rice (paddy) 84.0 201.9 6.0 7.0 504.0 1,413.3Barley 11.0 14.1 2.8 3.2 30.8 45.1Other grain 8.4 4.1 1.9 3.3 16.0 13.5Sweet potato 52.0 18.6 4.7 5.7 244.4 106.0Soybean 55.3 22.4 1.6 2.3 88.5 S1.SRape 19.3 23.0 1.3 2.0 25.1 46.0Peanut 25.4 23.2 2.7 3.0 68.6 69.6Cotton 49.7 52.3 0.8 1.1 39.8 57.5Others 31.1 22.1 24.0 28.0 746.4 618.8
Ta 651.5 702.0
C. I. 167% 180%
c. shandoni
Crowd Yield uduresent Future r- Ftur- r t Futur-
---- ('OOO ha) ---- --- (ton/ha)--- --- ('000 ton)--
Wheat 315.8 327.8 3.6 4.2 1,136.9 1,376.8Corn 155.0 159.8 4.1 5.5 635.5 878.9Rice (-paddy) 29.5 36.2 4.9 6.2 144.6 224.4Other graLn 14.2 17.1 1.5 2.2 21.3 37.6Sweet potato 37.6 36.4 4.3 5.5 161.7 200.2Soybean 51.4 45.0 1.4 2.0 72.0 90.0Peanut 17.8 18.7 2.1 3.0 37.4 56.1Cotton 72.8 80.9 0.8 1.0 58.2 80.9Vegetables 21.7 19.2 33.2 38.0 720.4 .#9.6Melon 8.1 8.3 25.4 31.6 205.7 262.3
Total 723.2a 749.4
C. X. 167% 173%
…-- --- …-- - - - - - - - - - - - - - - - - - - - - - - - - - - - - -
48
5.7 Cotton. There is also considerable excess national demand for cotton.Although production has grown rapidly, it has not kept pace with the large andexpanding export capacity of the textile industry. National production of cotton isexpected to have reached 4.2 to 4.4 million tons in 1990, while total demand willhave exceeded 4.5 million tons. Despite the tight domestic supply situation, Chinacontinues to be a net exporter of cotton, exporting 0.5 million ton of cotton lint(much of it long-staple cotton f:om Xinjiang) in 1989. That same year, the threeProvinces produced 1.7 million tons of cotton lint, or about 40% of national output(Annex 1, Table 1). Shandong is self-sufficient in cotton. Jiangsu and Anhui arestill considered net exporters of cotton-lint. However, cotton demand in the twoProvinces has so far outstripped supply that officials only expect to achievesupply-demand balance in the 8th Five Year Plan by closing or converting small-scalecotton processing and textile mills.7 The incremental cotton production of 56,300tons in 3% of output in the three Provinces in 1989 and will be used to supply millsin the three Provinces.
5.8 Oilseeds. Most o. the incremental output of oilseeds will be sold inregional and national markets to satisfy growing domestic demands. The remainderwill be used to maintain current export levels in the three Provinces. The domesticdemand for edible vegetable oils has increased substantially in recent years due tothe rapid growth of rural and urban incomes. Despite tight supplies of oilseeds, in1989 China still managed to export large quantities of soybeans (1.3 million tons)and other oilseeds (0.3 million ton). In 1989, the three Provinces produced 3.9million tons of oilseeds, or 156% of provincial demands (Annex 1, Table 1).8
5.9 Forest Products. Forestry activities are promoted under the projectprimarily for environmental purposes. Nevertheless, at full development the projectwill annually add 609,500 m
3 of timber and 40,500 tons of fuelwood for rural energyneeds. Most of the timber will be utilized in constructing rural homes and makingof furniture. Incremental forestry production is valued net of production costs atUS$34 million.
Xarketina Channels
5.10 Grains and Oilseeds. There are three channels for domestic marketing ofgrain and oil crops. Farmers must sell a proportion of their crop to the stateGrain Bureaus in accordance with contracts (pertaining to their land-leases)established at the beginning of each season. After fulfilling these contracts,farmer. may sell to the local Grain Bureaus at negotiated prices, and/or may sell inlocal markets. Regarding the first marketing option, the GMC sets annual targetsand purchase prices for staple crop contract procurement in consultation with theProvinces. County authorities have some flexibility in setting specific targets andprices for crops in accordance with local production patterns. The GOC has steadilyreduced precurement targets from 15-17% of total production in 1985 to 8-11% in1989, and, in the future, intends to reduce them further.' Secondly, graiii
' In 1989, despite th fac t at lianu mill agent purchaed between 30,000-75.000 tons of cotton lint from Anhui hrmers (and induceda biddg war between thw two provinces) nd cotton imports amountsd to 35,000-40,000tons, .aqnS fced a shortfall between 150,000-200,000tons. Anma Anl cotton demand is between 190,000-220,000ton but supply isa y 172,000 tons.
' Demad is cealcuted as 5 kS of edible oil per capita in urtn are and 3 kg in rul aeas, auuming that a ton of oilsedc yields 0.3 tonof edible oil.
'The actual poportion pabularfrmer conacts of a paicubr crop varies coniderbly depnding on county plns for meeting tgs.

49
procurement may be negotiated at prices pegged slightly below market levels; thistype of procurement now accounts for about 19% of total grain production and about20% of oilcrop production, again with wide variations (see Annex 3, Table 10).Finally, in the project area there are more than 800 rural markets handling inexcess of Y1.4 billion anrually. Between 2-30% of grains and 2-38% of oilcrops aremarketed annually in rural trade fairs. Subject to fulfillment of grain and oilseedcontracts and repayment of their project loans (see para. 6.5), project farmers willbe free to dispose of incremental grain and oil crop production as they wish. Tomonitor this arrangement, assurances have been obtained at negotiations that theProvinces will conduct annual reviews and analyses of contract and negotiatedprocurement targets for grain and oil crops in the project area and will furnishthem to the Bank/IDA by March 31 each year.
5.11 Cotton. In accordance with national policy, project area farmers willsell all of their cotton lint output to local Supply and Marketing Cooperatives(SMCs) at fixed prices (para. 5.14).
Prices
5.12 Output Prices. Beginning in 1984, the GOC has reduced the number ofgoods subject to state monopoly procurement, reduced the quantities of grainsprocurr'd under compulsory contracts, and increased producer prices as part ofongoing agricultural reforms. Additionally, the GOC has eased inter-provincialmarketing restrictions and sanctioned the establishment of free retail and wholesalemarkets, resulting in an annual increase of 7.7% in the volume of rural market tradein real terms between 1978-1988.10 Consumers have benefitted from the wideravailability and higher quality of farm products. However, agricultural pricereform has also been associated with rapid inflation, sharp price and supplyfluctuations, mounting state expenditures on consumer food subsidies, and growinginefficiencies in the allocation and sale of farm inputs. While affirming theirlong-term comnitment to continuing price and market liberalization, the threeProvinces have reverted to administrative control over prices and incentives in theshort term. Central price reforms expected in 1988 were deferred to 1990 (and then,except for cotton, to 1991 or later) and private inter-provincial trade in rice wasprc'tbited in Jiangsu in mid-1989.
5.1 Grain and Oil Crops. There are three sets of producer prices for grainand oil crops, linked to the three marketing channels described in para. 5.10 above:contract prices, negotiated prices with state grain bureaus, and free market prices.The prices set by the government for contract sales are the lowest of these. Freemarket prices are significantly higher than contract prices: for wheat by 56-140%,maize 95-127%, rice 94-112%, soybean 60-138%, peanuts 55-57%, and rape 39%. Pricesnegotiated with state grain bureaus are supposed to be pegged to market prices; inrecent years they have been about 15% below them.:: In project areas, negotiatedprices fluctuate more than market prices both regionally and annually. Thissugges.' that state agencies may on occasion negotiate procurement at prices closeto contract levels, so as to augment contract procurement. In order to monitorincentives to project farmers, assurances were obtained at negotiations that theProvinces will carry out annual review and analyses of market and negotiated prices
" Jiaqgsu mWl mno. t sales in current yuan deflated by OVAO. Tbi amumes that real growth trends in Anhui and Shandorng nral narketuapproximate thowe in Jiagm.
" However, good 1990 harvesc have reduced mrket prices below negoticted price levels, maintained at 'asured' price levels, for somecrops.
50
for grain and oil crops in the project area and furnish them to the Bank/IDA byMarch 31 each year.
5.14 Cotton. Cotton farmers are obliged to sell all their production understate procurement contracts. The GOC fixes cotton prices every three years. Cottonprices were raised 26.9% in late 1989, the end of the most recent three-yearperiod.12 Cotton production declined substantially between 1984-1986, before priceswere adjusted in 1987. Since 1987, cotton production has recovered somewhat inresponse to provincial (and local) incentive schemes, amounting to between 10-15% ofthe national price."3 Since the decision for price increase is at central level,the provincial Price Bureaus will continue to communicate cotton price analyses andrecommendations annually, prior to the setting of cotton prices by the State PriceBureau. At negotiations, assurances were obtained that each Province will annuallyreview and analyze cotton price and production incentives given to farmers and makerecommendations for such prices and production incentives for the coming year, andfurnish the results and recommendations to the State Price Bureau and the Bank/IDAby March 31 each year.
5.15 Imported Input Prices. Farm inputs are mainly distributed through thestate-run marketing system (SMCs). Farm inputs have been underpriced in the projectarea and throughout China for many years. The price structure for most criticalfarm inputs features at least three different price levels: low incentive prices,mid-level prices and local negotiated prices. Incentive input prices, for importedand domestic fertilizers, imported pesticides and domestic fuels, are linked tostaple crop contract production. In the project area, farm input sales of urea atincentive price levels amount to less than 5% of total demand. The residual demandis met from local production sold at mid-level prices, from SMCs at negotiatedprices, or from local (black) market purchases at market price levels. Theincentive urea price is only 63% Jf the border price but the weighted cost of ureaand DAP in project areas are 6% and 2% greater than their respective border prices.Inputs imported under the project will be sold to farmers through CATECs.Assurances have been obtained at negotiations that (a) the CATECs will charge pricesreflecting import costs plus distributors' margin, and (b) provincial governmentswill annually review the sales prices of imported inputs and furnish their findingsto the Bank/IDA by March 31 of the next year. Most seed companies in the projectarea are self-supporting enterprises, selling seeds to farmers at prices sufficientto maintain adequate profit margins.
"2 From Y 4728/ton to Y 6000/ton.
n Thesw incentives currently amount to about Y700/ton.

51
VI. ECONOMIC AND FINANCIAL ANALY8I8
Benefits
6.1 The major benefits of the project are incremental staple cropproduction and increased incomes for rural dwellers. Secondary benefitsinclude timber and firewood production, assured urban and industrial watersupplies in Jiangsu Province, and flood prevention and drainage control inAnhui Province. The project will provide incremental annual production of 2.5million tons of grains (wheat, maize, potatoes, soybeans, coarse grains andpaddy), valued net of on-farm costs at US$422.3 million; 56,300 tons of cottonvalued at US$80.5 million, 82,600 tons of oilseeds valued at US$15.5 millionand, 65,100 tons of other crops valued at US$9.4 million. The total value ofthe annual incremental crop output is US$527.7 million.
Table 6.1 Annual Incremental Staple Crop Production and Value Added
(thousnd tons, million USS)Grains Oil Crops Cotton Other
AnhuiAnnual Incremental Production 854.8 42.1 14.0 -1.0Annual Incremental Net Value 154.1 6.7 18.0 3.5
JiagsuAnnual Incremental Produ&tion 966.9 21.3 17.8Annual Incremct l Net Value 148.1 5.0 27.1 -
ShandongAnnual lncremental Production 641.9 19.2 24.5 66.1Annual Incremental Net Value 120.2 3.9 35.4 5.9
Total ProjectAnnual Incremental Production 2463.6 82.6 56.3 65.1Annul Increen Mal Net Value 422.3 15.5 80gS 9.4
6.2 Shelter belt and border row investments will permit annualproduction at full development of 609,500 m3 of t4.mber and 40,500 tons offirewood, valued net of production costs at US$34 million. Rehabilitation andexpansion of the Jiangdu-Nansi Yangtze water diversion will assuremunicipalities and industries along the route of an annual incremental supplyof 450 million m3 of water valued at US$2.2 million.t The reconstruction oftwo major Huai River tributary flood control and drainage systems in Anhuiwill provide improved flood protection for about 600,000 persons over some8,400 km2. These urban and industrial water supply and flood controlbenefits, while significant, have not been included in the project's economicanalysia. Other benafits not evaluated include improved inland transportationon the Grand Canal and Nanai Lake and the restoration of fishing and otheraquatic production in Nanai Lake.
1 Derived ssing an average induaal waterduty of 455n3 per YI0,000outputvalue, projected 1995 GVIO of Y 37.8 billion, avergeindustrial water utilization rate of 43.3%, projected 1995 utban populationof 4.02 nillion, per capite wban water consumption of 133 litres/dayand an averge water supply coat of Y 0.026/m3.

52
Emalovuent and Incomes
6.3 Em lovment The construction of project works will generate449,400 person-years of employment during the five-year period of the project.
As rural labor force in the project area is about 30-40% under-utilized,project construction can be easily undertaken by paying rural laborers to workduring the off-season.2 After the project is completed, 232,200 person-yearsof regular employment will be created: 178,900 in intensified croppingactivities, 16,200 in augmentation of agricultural extension and seedsservices, 16,200 in farm mechanization, 1,400 in seven new cotton processingplants in Shandong, 600 in project township staff positions, 6,700 inmanagement and 12,300 person-years in operation and maintenance of irrigationsystem. Again, existing labor resources are sufficient to meet project needs.
6.4 Incomes. Project investments would increase the productivity oflabor and incomes of project farmers who, as a group, earn only 75% of theaverage rural income in three Provinces (see para. 2.7 and Annex 1, Table 1).3
To estimate increases in family income, farm models have been developed fortwelve representative project areas in the three Provinces. A summary ofthese farm model analyses is presented in Annex 3, Table 3. In Anhui, theproject would increase farm household incomes by 40%, from Y2,138 (US$410) toY2,986 (US$572), in Shandong by 24%, from Y2,213 (US$424) to Y2,735 (US$524),and in Jiangsu by 42%, from Y2,119 (US$406) to Y3,014 (US$577). Averagereturns per man-day in Anhui would improve by 21%, from Y9.7 to Y11.7, inShandong by 14%, from Y11.6 to Y13.2 and in Jiangsu by 22% from Y9.2 to Y1l.2.
Cost Recovery
6.5 Cost recovery for the project takes several forms. Farmers willpay the full costs of chemical fertilizers, pesticides and plastic sheetingsold by the CATECs and SMCe. Farmers also will pay the full cost of seedssold by township seed stations and of machinery hire services provided bytownship and village agricultural machinery stations. The cost of investmentsin irrigation will be recovered through labor contributions for construction,operation and maintenance, and through increases in water charges. TheProvinces will gradually increase charges so as to recover 100% of the cashO&M and power costs of the irrigation works (para. 4.15). In addition, thethree project Provinces propose to recover from project beneficiariesapproximately 10% of the value of the incremental grain output as contributiontowards repayment of project cost. These project charges would yield a totalcost recovery index of 46% (see Annex 3, Table 5). Rent recovery averages 27%at full development of the project (discounted over the life of the project).That in, the public authority will recover only 27% of the surplus thatfarmers receive above the minimum return necessary to induce projectparticipation.
2 Every project asrnarm b borer is expected to comnmit 1215 days per year to water resoures work. However, in existng rigptedares actul contributed labor amounts to no mor tham 548 days per yer per taborer. Wags rtes for contributed labor of Y2.O+/day aeconsiderably ku than the avergc; commercial project aema rural wage rte of YSOl/day.
3 In 1988, nrtl per capita inconw was Y470 in the project area and Y623 in the three provinces overall.

53
Economic Analysis
6.6 An economic analy 's was dons for each of the three provincialproject areas, for each of fourteen representative irrigation schemes, and forthe project as a whole, using constant 1990 border prices. The fourteenrepresentative schemes were designed to reflect the range of croppingpatterns, yields, technologies, and investments in the project area. InAnhui, this necessitated the development of two surface water irrigationmodels, two drainage/irrigation models, and two well irrigation models -- oneusing earthen channels and one a sub-surface pipe delivery system. InJiangsu, models were created to depict the conversion of dryland to paddycultivation, the extension of irrigation to dryland areas, and therehabilitation of partly irrigated areas. In Shandong, models were developedfor two Yellow River diversions, one surface irrigation scheme, and one sub-surface pipe conveyance well irrigation scheme.
6.7 The investment cost of imported inputs such as fertilizers andagro-chemicals is excluded from the cash-flow analysis, since the cost ischarged as an annual farm production cost in the economic crop budgets. Thecost of processing paddy and cotton-lint have been estimated based on existingoperations and are deducted in the calculation of farm-gate prices in border-price terms. All other investment costs, including physical contingencies,and operation and maintenance costs, have been taken into account inestimating the economic costs of the project. Economic O&M costs include:electricity, valued at YO.4/kwh; contributed labor valued at the shadow wagerate of Y 3.3S per man-day (see para 6.8); and other labor, management,maintenance, repair, overhaul and replacement costs expressed as ecoromicvalues.
6.8 World Bank price projections were used to estimate farm-gateeconomic prices in constant 1990 terms for traded inputs and outputs (seeAnnex 3, Table 7). Economic prices for non-tradeables were estimated usingconversion factors (summarized in Annex 3, Table 6), based on an analysis ofthe deviation of social opportunity costs from actual prevailing financialprices induced by tax and price distortions in non-traded goods in the threeProvinces. All economic values were converted to local currency at theofficial exchange rate of Y5.22 to one US dollar. Farm and unskilled laborhas been valued at Y3.35 per man-day, representing 67% of the average ruralwage rate of Y5.00 per man-day in the project area. Annex 3, Tables 8-1 to 8-6 show the summary of economic analyses, sensitivity analysis, economic cropbudget models and cash-flow analyses.
6.9 Based on the above assumptions and a 25-year period of analysis,the economic rate of return (ERR) of the project is estimated at 26.5. Thenet present value of the project discounted at 12% exceeds Y 5.3 billion.These relatively high returns reflect the existence of significant sunk costsin irrigation infrastructure, which results in a low per hectare investmentcost. The project is not rendered unprofitable by significant changes incosts or benefits: benefits will need to be S0% lower than estimated orincremental costs 101% higher before the ERR will fall to 12%.

54
Risks
6.10 Project risks have been identified and measures incorporated inthe project to minimize their effect. First, on the question of lack ofinstitutional capacity and capability to implement the project, the threeproject Provinces had previous experience in implementating Bank Groupprojects. Project management has been established in all Provinces,prefectures and counties and staffed with experienced personnel. The projectwill also provide training to upgrade skills of staff at all levels. Second,the risk that future upstream development of the Yellow River will reduceflows available for the proposed Nansi Lake diversion project and theassociated risk arising from delay in construction have been reflected in the*conomic analysis. Third, during drought years Jiangsu may face water deficitduring the period April-June. The effect would be minimized through theprovision a contingency plan to increase tempoary pumping and storageregulation. In addition, the irrigation canal simulation system to beprovided under the project would optimize supply and demand of water. Fourth,the risk of depleting groundwater resources in Shandong project area will beminimized through investments in water-saving irrigation technology. Fifth,the risk that benefits will not be fully realized due to inadequate O&M ofproject works will be minimized by the increased provincial efforts to raisewater fees to fully cover O&M and depreciation costs, by the dissemination ofirrigation management systems appropriate to household-managed crop productionand by the provision of adequate investments in O&M machinery. Sixth, therisk that the projected productivity may not be sustained will be minimal asexpected yields are realistic and reflect the yields of large-scale extensicnefforts in similar areas on the North China Plain. The project's agriculturalpackage would ensure adequate agricultural support services. Moreover, theprovincial governments have agreed to provide price and production incentivesto encourage production of the major crops.
55
VII AGRZENS REACgED AND RECObHZNDMATOx
7.1 At negotiations, assurances have been obtained from the Provincesof Anhui, Jiangsu and Shandong that each Province will:
(a) furnish to the Bank/IDA by December 1 of each year an annualfertilizer plan showing the quantities of chemical fertilizersrequired and the plan for procuring them (para. 3.25);
(b) sell project fertilizer and other production input materlals tofarmers at full cost plus distributors' margin and operate arevolving fund using the sale proceeds which will be used topurchase additional quantities of required inputs (paras. 5.15,3.25,);
(c) cause each CATEC to prepare and submit a detailed extensionprogram to the provincial PMOs each year before December 31,showing the proposed activities and physical targets for thefollowing year (para. 3.28);
(d) carry out training according to program. agreed with the Bank/IDA(para. 3.36);
(e) obtain prior approval from the Bank/IDA for pesticides to beprovided under the project and follow the Bank Group guidelines onstorage, handling, distribution and use of such pesticides and,where applicable, the MOA guidelines on safe use. (para. 3.45);
(f) ensure that project activities will conform with environmentalprotection guidelines and standards satisfactory to the Bank/IDA(para. 3.44); maintain the environmental unit under its provincialPMO with acceptable functions and responsibilities and staffing;furnish an environmental management program to the Bank/IDA forreview no later than December 31, 1991; and furnish the results ofannual environment monitoring program to the Bank/IDA by March 31of the following year (para. 3.51);
(g) furnish a detailed annual budget and work program to the Bank/IDAby December 31 of each year, for project implementation in thefollowing year (para. 3.52);
(h) furnish the consolidated project accounts for annual auditing byan independent auditor acceptable to the Bank/IDA and theauditor's report to the Bank/IDA within six months of the close ofeach financial year (para. 3.68);
(i) maintain the PLGs with composition and responsibilities acceptableto the Bank/IDA and the PMOs with functions and responsibilitiesacceptable to the Bank/IDA, and staffed by competent staff inadequate numbers (paras. 4.4);
(j) evaluate county proposals to finance activities under the projectin accordance with models agreed with the Bank/IDA and inform theBank/IDA of those county proposals accepted for implementation andtheir respective economic rates of returns (para. 4.11);

56
(k) furnish a Plan of Operation and Maintenance (POM) for each of thelargo irrigation ar-as to the Bank/IDA for coment by December 31,1991, issue the POXM for trial use for a period of three years andre-issuo before December 31, 1995 after roview and revision basedon the results of the trial operation (para. 4.14);
(1) collect water charges at rates to be reviLed periodically asnecessary to meet at least the full annual operation andmaintenance costs of the completed irrigation schemes (para.4.15);
(M) (L) review and analyze annually and furnlih the results to theBank/IDA by March 31 of the next year:
(A) contract and negotiated procurement targets for grain and oilcrops (para.5.10); (B) the market and the negotiated prices forgrain and oil crops (para. 5.13); (C) the annual price andproduction incentives for cotton provided by provincialgovernments to farmers for the preceding year and the current year(para. 5.14); and (D) the sale prices of imported agriculturalinputs (para. 5.15).
(li) furnish the recommendations for cotton prices and productLonincentives to the Bank/IDA and the State Price Bureau by March'31of each year (para. 5.14);
(n) for Anhui and Shandong only, (l) ensure that no new tubewells aredrilled in project areas other than those included in the projectunless justified by availability of groundwater determined byfurther asresoment of groundwater resources (para. 3.6); and (ii)monitor and assess groundwater resources in the project areas eachyear and furnish the findings to the Bank/IDA by June 30 of thefollowing year (para. 3.40); and
(o) Jiangsu will carry out maintenance and periodic safety inspectionsof existing dams/reservoirs under arrangements satisfactory to theBank/IDA (para. 3.43).
7.2 Assurances have been obtained at negotiations that: (i) GOC willmaintain the CPSG with composition and responsibilities acceptable to theBank/IDA (para. 4.2) and (li) GOC will make the proceeds of the Bank Loan andIDA Credit available to Anhui, Jiangsu and Shandong on terms and conditionssatisfactory to the Bank/IDA (para. 4.7).
7.3 Understandings have been reached at negotiations on the terms andconditions for making project funds available to the final projectbeneficiaries (para. 4.7).
7.4 State Council approval of the Loan and Development CreditAgreements will be a condition of effectiveness of the Loan/Credit (para.4.10).
7.5 Subject to the above coqditions, the proposed project is suitablefor a Bank Loan of US$147.1 million with a maturity of 20 years, including a5-year grace period, at the Bank's standard variable interest rate and an IDACredit of SDR 139 million (US$187.9 million equivalent) on standard IDA termswith 35 years maturity to the People's Republic of China.

TMICATWD ACRIaA.TU IUIDIFICATION4 LOA"~
Basic Prowlaclsl aDot Project Area SLteta£ics. 19601
a----S&3ndang Province ---- 1 -- ---- Aadau Province -- a----- - Lanoe. Province - ------- Tots I---------* . : Project a a :~~~~~Project a :Project Three h. a Project* * a a ~~~~~~ ~~~Ar.. : a Ar.& Area aThres aProniace:Pro.iacea:At.aas asItem/Description ka tit Total ;Project :Project a of Total :Project :Pro*ct I of aTotal Project aProject a o f aPoicePoel;Project a I ofaPr9,i^c9:Cownt;.am Area aProw ince a.Pro,ince.Counties: Area :Pro.iaCe:Pro,1nCO:Cowatiaa*: Area :Proviawe lotal :Co..lm,005 Area :Pro,;nces;Total lend area a ala k. a £15.6 a 3.3 -. 0.7 4.5 13.9 a 3.0 a 0.6 4.1 10.3 a 4.3 0.7 a 7.2 39 IB a 11.4 a 2.0 a 5.1aMoal ara Ia sad a tWNla a 7.3 a
6.6 a 4.0 TotLc,ti tdla sonab he 6.9a I.?: 0.4: 6.3a 4.4: 2.2:. 0.3:. 7.3: 4.8: 2.0: 0.4: B.6a 15.: 5.9: 1.1: 1.2:E;fVcti,e Ir igpIte are ala he 4.3 a 1.1 a 0.3 a 6.9 a 2.5 a 0.6 a 0.3 3.7 3.5 a : 0.2 4.5 W 03 a 1.7 a 0.5 S .3
Forest a~~~~~~elah$ 0.0 a 0.9: 0.4: 0.0 4.3 0.9a 0.2 a .7~ 056 0.1Populatiom: s Total a al a 0.1: 20.1 SI1 6.4: 53.0: 20.0: 26 5.2 65.4: 2I.0 6.3a 399.2 61.0 12.0 6.0Af,icaltra.l a ae 67.0 a 11.0 . 6.9 : 45.7 a 0.2 a ? 7 S.B 51.6 :20.0 4.0 7.? 164.4 56 0 £1 2 6.0Fare laborere a ala, 32.3: 6.4 2.2 8.0: £0.0 0.5: 12 8.9 21.8: 10.2 .9 6.7: 76.0 25.2 5.3 6.6
FWValice a aa 17.6 a 4.5 1.2 6.6 1 1.2 a 4.7 a 0.6 S B 14.7 a I0 6.5 43.6 9.2 208 6.5aLo.g.~ea n. a 0: 26 26 35.0: 72: 21: 2£ 29.2 53: 24 24 46.3: 206 13 13 35.6
TooesbpeAp ae.. 2460 561 223 9.0: 3344: 3260: 211 6.3 1909: 61 254 13.3: 7721 2442 SOB 09:Administrative villages a no. a69393 IB190 4994 a S.6 31461 a 2082 11£969 6.3 3571? 12175 283) 7.9 a15657£ 44046 9014 6.3aCropped erase:a .. a aPeddg a000~~~lowhe 08.3: 30.3 2964 33.5:2304.2: £42.5: 305 1.6 2419.7: 763.0 0456 3.6: 4692.2 9n.0 149.6 32:
wheat a ~~~~~000 ha a4061.9 1 125.0 311.2 7.8 2016 6 1 406.5 202.4 £0.0 2353.5 1167.0 2363 1 0.0 a 422.0 3699 3 755.7 9.0Coro aOOObha 2323.?: 549.0 155?: 6.7: 210.4: 250.9: 166 56. 501.2: 315.0: 16.4: 15.2: 3113.3 1116.2a 24069 6.0:Cottial a 'OC ha. 1402.6 a332.9 72 9 5.2 a210.1 a149.3 1 4.1 5 2 535.2 a246.2 a 59.6 a 1.1l. 2207.9 a740.4 a 46.6 a 6.6aOil crops aOOObhe 791.4: 852.5 £704 2.2: 947.1: 253.9: 301 3.2 502.3: 16.2: 40.6: 7.0: 232.9: 512.6: 00.5: 3.6:Vagatebl./awlema aODDO16: 469.7: 134. 29.7 6.3: 22.3: .50 269 462.4: 22.0; 4.0: 1154.3: 134.9 a 51.5: 5.0:Total CVAO: a vi6aea 3095.0 :13430.9 2407.9 7.6 :31525.3 :3300.0 a 103 0 5.2 :49795.0 :10162.2 a2046.9 a 4.1 :312157.3 :44576.1 a 60T.0 a .4Crops a 9 mle a 21433.0 a 500.0 1601.0 7.6 :20M0.9 a 910.0.: 121£ 0 6.0 316467.0 :I3006.0 1367.0 8 .3 a50050.9 :25116.6 a4379.0 : 7.2 Forest a193 ala a 76.0: £93.1 51.6 7.6; 1663.3 7 00.0 a 73.5 * 4.4 271.0: 314.0 : 26.1 9.6 :2610.3 :1207.9 a 151.2 a 5.0aLivestock 06 sleab 5729.0 a 102.5 513.2 9.0 a7418.6 a2640.0 :267.6 3.6 5474.0 a2619.4 a 91.2 a 7.31 16621.6 7161.9 a1178.9 : .3Fiwbetas a 30 ala a 1305.0 a 3.9 2106 1.? 9518.a 240.0 a 24.7 2.6 1273.0 a 72.5 a 7.3 a 4.6 :3529.0 £1376.4 1 03.0 2.9Karol Per Capita eboc :U/Ta a 66.7: 419.0 491.0 04.1: 405.5: 419.2: 57690 7769 79.0: 544.2 100.5 63.6: 623.3: 402.9: 470.3: 7.4:Orsia alaS..: 32.3: 6.4: 2.2: 6.7: 23.1: 9.7: 1.5: 6.6: 32.0: 13.1: 2.2: 6.7 ft.2 38.2: .7: 6.4:CeLlo. Ialatoeo 1.1: 0.5: 0.1: 5.1: 0.2:8 0.4: 0.0: 5.3: 0.5: 0.2: 0.0: S 9.6: 3.0: 0.9: 0.1: 5.4:Oil cropseW sLaoa 2.0: 0.3: 0.0:i 1.6 s 0.9: 0.2:3 0.1: 5.0: 1.0: 0.4: 0.1: .1: 1.9: 0.9: 0.2: 4.5:a a. a . .a a a
scarce: Sceaodog gad Araaha figures are from ?oulaclsl "flO and 190 Chblaesa Statistical looseboela (Beijing: 31,90). Jiseaga proviaclal figure. from, £99 Chiaim.. StatisticalTsarbook gad from 1909 Jiarage Toagjs Hisajisa. (I"iarjeg. 1990) and Mla. Jiaopou couatg figures are taken from 1909 Jieegeua-e Sh.slat JIiagii. tIbajiag: 3909).

58
ANNEX 1Table 2
CHINA
IRRIGATED AGRICULTURE INTENSIFICATION PROJECT
PROJECT COUNTIES
Province Prefecture (City) County
Shandong Heze(P) Liangshan, Yuncheng, CaoxianDingtao, Shanxian, Chenwu Dongming,Heze
Jining(C) Jining, Qufu, Yanzhou, Zouxian,Weishan, Yutai, Sishui, Jinxiang,Jiaxiang, Wenshang
Taian(C) Taian, Feicheng, Laiwu, Ningyang,Xintai, Dongping
Zaozhuang(C) Xuecheng District, Yicheng District,Taierzhuar.g, Tengzhou City
(sub total) 28 (11 cotton bases, 17 grain bases)
Jiangsu Xuzhou(C) Fengxian, Peixian, Tongshan,Suining, Pixian, Xinyi
Lianyungang(C) Ganyu, Donghai, GuanyunYancheng(C) Binhai, Xiangshui, Funing, SheyangHuaiyin(C) Huaiyin, Huainan, Shuyang, Suqian,
Siyang, Lianshui, Sihong, Huaian,Hongze, Wuyi, Jinhu
(sub total) 24 (10 cotton bases, 14 grain bases)
Anhui Suzhou(P) Dangshan, Xiaoxian, Suxian, Llngbi,Sixian
Fuyang(P) Bozhou, Guoyang, Hengcheng, Jaishou,Taihe, Lixin, Linquan, Fuyang,Yingshang, Funan
Huaibei(C) SuixiHuainan(C) Fengtai, PanjiBengbu(C) Huaiyuan, Guzheng, Wuhe
(sub total) 21 (21 grain bases)
Remarks:(P) Prefecture(C) City

590000
AmfoAr-ps ow"vnzhtlt" PM41er
col-%if ft" A=EX LTable 3J- P.6 I%p A., POF J� A.# 00. C" 004* 0-iod
SS. I ago '40S ro 2 so, a &qvS.4SP" *0 3", ": t' : go
IYAPPA'tGN
PUP 6!0 ic r 73 la* 141.6 M. a L-4. It tv. r go. p 79.2 SLIO 39.0 -19"-4 LVFS-69"Ir 40 aL34: S, In.* 140.2 M.2 1-4.1 ff-S St. 2 0.3 30.2 12#4: r
M!�(d-*.C)
PI-v:.q tP.. 4. 1210:1 NA UK 's 211: " 110'..0 S14: I
tma ("M")
2" I U* 0 a S" I 908.0 4". 0 ISM.* Ift.2 "To. T tvrs. I",sh..; ,.:S' 11:1, 1141: .1 11: :2 USt" 02 193.0 IMI .0 &M. IUn.
"L.Artva -k"wz" cir) A..""
P., cr To of et a so do 76 73 a WSp.M SO at et S& n T3 ro 4.
VOC "La,-rf (W-1 A--"
ft,"q 2:1 1:1 1:1 1:1 2.1 2.12 2 t 2A 22 S 2.0 2.* 3' tv".19104
4.k.1 P�1-1.4 Skol*" of vo� R� ft-
04VIA
0-4- Ji-q-
tt,-0� 01- 4%. 0.6 1%, A.,I A" gas 14D. O" as%* W-1.d
M6&-* L 4-)
X. 34 3 ?s SO ITS IS:: 11:3 1971.0418X. , `S: '? ga N': Ru: S, 1:11 Ml22:p 3"I 432 OF, U0 S ON .1
-0 9 74 9all34.2 33I .3 ;A. .2 3 o 00.2 43.0 40:9 R.6 4010 2U. 4 24.4 3C.F 44-9 S2.6 1-0.3 22S. a 243,1 SI.* $7.8 21.2 W 0 136.2
nfmLrtm C.) -- 1X. L%., L-
so 0 rr 4 134, 2 OT 99-S ISSA Ug. 7 I AS. I IqGS.m44 S 44 0 &44a &M 'S ItS
I IS4 2 I" 944. 133.4 11f.9 W.0 Sd 4 1479,2...... $6 ST 7VI I M. a 0 Uv a LU-4 UZ ? PV Sti t'114.11
t., r a* m: sq..2 =1: IIS2 L ag: I LU-3 Lu4 "SS
0:1 1:12 1:1 11:1 1:1 1:1 1:: 1 2 1:SS I 3 2.2 44.3 Ort-10911
r 202.:3 S:111 r '3 o ' So 21 It 1:. 2.9 14A1.2 2.11 93.3 S 12.S 29.11 U.. U.0 MS 9.3 3.* 14.20.0 I.? U Ur 19.0 23.4 211.4 U. 1 24.4 15.7 0.4 2.2 LS. 6
X. 04 S 142:1 111:1 1:1 1:: 1:: 1:4 1:1 11 I 11: : lrv:3 t": I *M :0 tiTt.,"SL30:s &34.0 M 3 Sol 193 Us 41 M IM ISS.: I 0 2 2043ist .0 0 we" ':' ": , 3". 9 I" 22'.
LW. VQS on 02or4ig? US t"_?_ __2LS:!___24V:i WE S S" .2 Z" 2-in , 02.2 M., 1". 4 =21.3
RILArrW "WrrY M
X. L4- 42 46 so a ft M rt 67 a SO "TWINS
73 PS 71 n 72 III so at 77 73 T% ToT 4 ye 1. to To el W? 42 79 rA 72 rr
44 wr M r3 gy 74 66 as rr TO to 47 72
V** VIRACM2.4 3.0 8.4 3.6 3.3 3.2 S.* 2 r 2.2 2.1 2.2 t's 2.9 &M.&IMS1:1 1:1, 1 4:11 1:31 3:1 S.. 2:0 2.S 2.4SA 3 :I a 2 3 :: ':' ':'
1:1 2.8 2 2 It2. 3.2 3.3 N 3.3 11. 'L 2 2 V 2:; 1 3 CS 2.0 S.? 3.0
DWtGA?W ACPI"Pift Der"tncArlcpo PROJW
J- Fb mb. A., Mr Jw. JWI A" S" C" O" a." P-lz
10.3 W 9 sr.1 $-.L 40.9 129.8 202.4 tu. 0 "A 37.41 ot.? 14.2 "S. 191141.19011
Mr 19.4 ".11 39.2 0.3 ZIA 9". r 13.2 32 10.9 Me 719.31:30 0,00: S' WZ: I L2S: 74:1 41., 1:3 1: SI
td 331 40 224 SL" 73
=ArIO"
31 st.9 94.0 148.0 1". 3 2n. a 141.3 LEY. I US-0 too.* $6.9 41 1 P" I4"8.t"f43:12 43 3 I.: S' 1.11:: ":,' 1-1 163-3 t42.4 IIS.3 90.4 SI.& 39:4 U33: 237.2 Aq:F its 240.0 &SO. : Lat:31 11:1 I 11:1 31:01 111:137 .0 113.0 104.3.0 aI .:1
.L*s ma, too. ISO L" a 36 LM I
C4.9.c)
.0.6 LS 71S 14.1 20.0 24.9 20.41 21..' 21.3 U.3 8.0 1.3 W. 4 l"S.&OPS:& 7 3 14.2 20.2 22.4 21 to 0 20.? 14.0 ?.L 0.4 13
01:2, ?:L la S 20.4 2S.? 21 1: 31 111:1 1.2 6.11 La: S,-4.&.313:SN.4 24 7t
-2- 64 $.S .0.3 MS
M. 0 184.S 203. r 203.2 237 F 24?.S tqo. 4 223-S Ut. 4 104. a 11:4 11:1 Z;S-s 1446-to"tF4.9 IMF W4. t 212.4 230.S 2". 6 =I.* mi-f v-, s no. a IVA S ' ' "40
lr7.4 202.9 =41. 2 1". 2 S" 4 no 24A.& 212.2 =J. I MS.: 173.3 IM:*'_L92.4 216.6 Z". r Va. 2 2#4.8 Z13:8 2". L = .0 M L 4 to3a. 3
PILATTW Amf*M M A.-.*. 1%
so so so as 93 Is et W rs ?a ye 4141 9"4.1"6IS Oa 0SO so 79 so 74 So TOV97 go #4 It so 76 a 73 r2 72 7t toso 00 of itSO so ---- ?v 46 ol Go
2.7 3.0 2.3 3.8 3.3 9.2 I.? I.S 2.4 2.4 2 S.* 9"o-19"3.L S.11 4 0 4 3 3 0 a a 3.0 2.0 2.4 CO 12: I1-1 3:,l 1.31 3:,1 1:: 1:1,1 2:3 S., &.3a 3 S S 2
............ - --- # 2:1
S-0- lh-41�0 . . .....
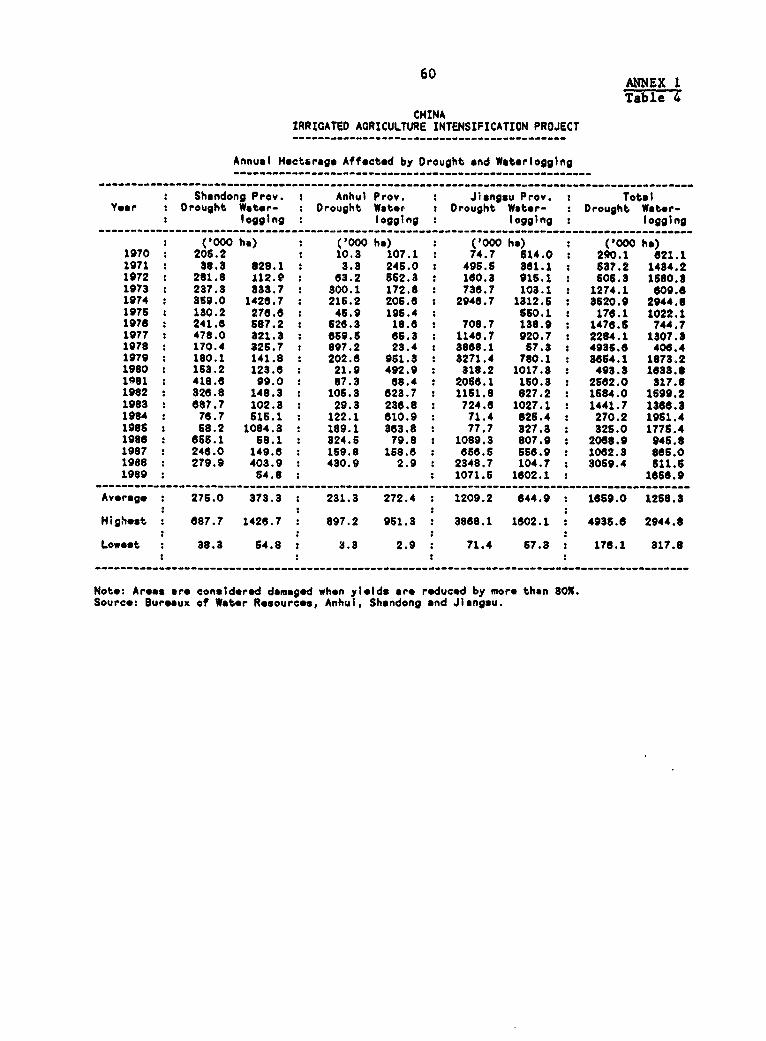
60 AMNEX I
Table 4CHINA
IRRIGATED AGRICULTURE INTENSIFICATION PROJECT-------------.-- _--------_-------_-------_-
Annual Hectorage Affected by Drought and Waterlogging
Shandong Proe. : Anhui Prov. Jiengu Prov TotalYear Drought Wator- : Drought Water : Drought Water- : Drought Wator-
logging logging logging : logging----------------------------------------------------- _---------_-_-__-------___-_---------_--
('000 he) ('000 ha) ('000 ha) ('000 he)1970 : 206.2 : 10.3 107.1 74.7 614.0 : 290.1 621.11971 86.8 828.1 : 3.3 246.0 : 496.6 861.1 : 537.2 1434.21972 261.8 112.9 63.2 662.3 : 160.3 916.1 : 606.3 1680.81973 : 237.3 838.7 : 300.1 172.8 : 736.7 103.1 1274.1 609.61974 3:9.0 1426.7 : 216.2 206.6 : 2946.7 1312.6 : 3620.9 2944.81976 : 130.2 276.6 : 46.9 195.4 560.1 : 170.1 1022.11976 : 241. 5687.2 : 526.3 18.6 : 708.7 138.9 : 1476.6 744.71977 : 478.0 821.3 : 659.6 65.3 : 1146.7 920.7 : 2264.1 1307.81978 170.4 326.7 : e97.2 23.4 3886.1 67.8 : 4936.6 406.41979 180.1 141.8 : 202.6 961.3 : 3271.4 780.1 : 3864.1 1673.21980 153.2 123.6 : 21.9 492.9 : 318.2 1017.3 : 493.3 1633.61q61 418.6 99.0 : 87.3 68.4 : 2066.1 160.3 : 2562.0 817.61982 826.6 148.3 : 105.3 623.7 : 1151.8 827.2 : 1564.0 1699.21983 687.7 102.3 : 29.3 236.8 : 724.6 1027.1 : 1441.7 1368.31964 76.7 615.1 : 122.1 610.9 : 71.4 825.4 : 270.2 1961.419865: 58.2 1084.3 : 189.1 363.8 : 77.7 327.3 : 826.0 1776.41986 : e66.1 68.1 : 824.6 79.8 : 1089.3 807.9 : 2068.9 946.61987 : 246.0 149.6 : 159.8 158.6 : 656.5 656.9 : 1062.3 s66.01988 : 279.9 403.9 : 430.9 2.9 : 2348.7 104.7 : 3069.4 511.61989 : 64.8 : 1071.5 1602.1 : 1656.9
Average 275.0 373.3 231.3 272.4 : 1209.2 644.9 1659.0 1256.3
High-st 687.7 1426.7 897.2 961.3 3868.1 1602.1 4936.6 2944.8
Lowest 38.3 64.8 : a.3 2.9 71.4 57.3 176.1 317.8
Note: Areao are considered damaged whon yt-lds ar* reduced by more than BOX.Source: Bureaux of Water Resources, Anhui, Shandong and Jiangsu.
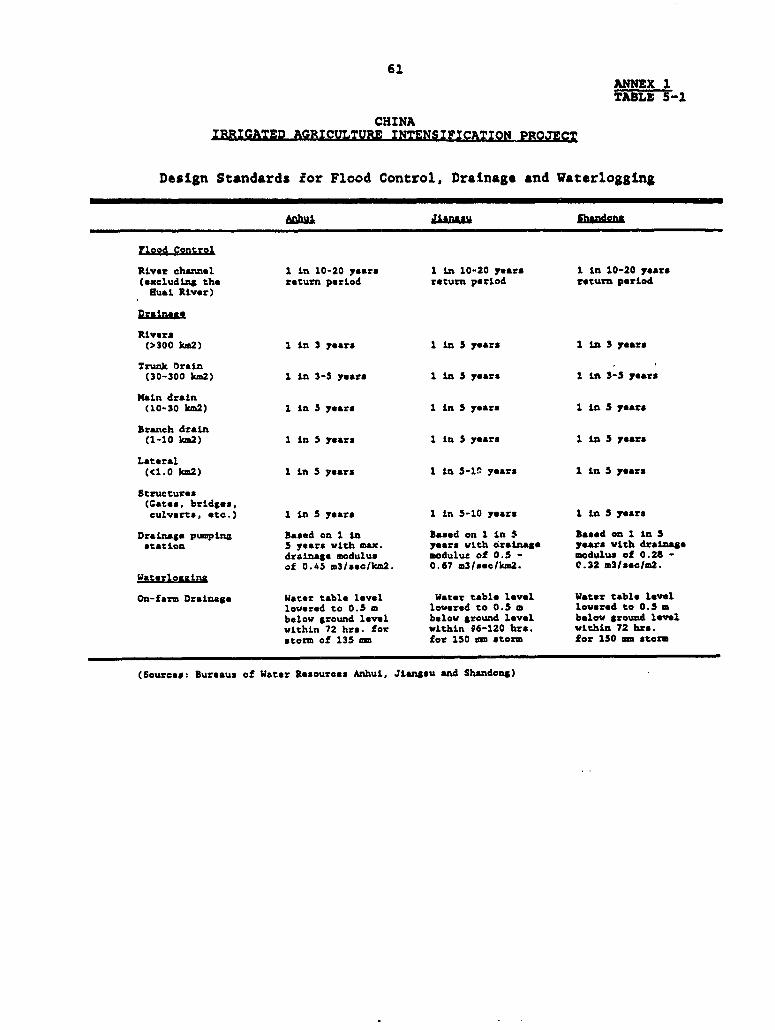
61ANNEX 1TABLE 5-1
CHINAIRRIGATED AGRICULTURE INTENSIFICATION PROJECT
Design Standards for Flood Control, Drainage and Waterlogging
Jians hndons
Floot Control
River channel 1 in 10-20 years 1 in 10-20 years 1 in 10-20 years(excluding the roturn period rcturn period return periodBuai River)
Draina so
Rivers(>300 km2) 1 in 3 years 1 in 5 years 1 in 3 years
Trunk Oraln(30-300 km2) 1 in 3-S years 1 in 5 yearn 1 in 3-S years
Main drain(10-30 km2) 1 in 5 years 1 in 5 years 1 in S years
Branch drain(1-10 km2) 1 in S years I in 5 years 1 in 5 years
Lateral<C1.0 km2) 1 in 5 years 1 In 5 -1 a years 1 in 5 years
Structures(Gates, bridges,culverts, etc.) 1 in S years 1 Ln 5-10 years 1 in S yearn
Drainage pumping Based on 1 in Based on 1 in S Based on 1 in 3station j years vith max, years vith drainazg years vith drainage
drainage modulus modulus of 0.3 - modulus of 0.28 -of 0.45 m3/seclkm2. 0.67 m3Isoc/km2. 0.32 d3/sec/m2
Waterlonains
On-farm Drainage Water table level Water table level Wator table levellowered to 0.5 m lowered to 0.5 lovered to 0.5 mbelow ground level below ground level below ground levelwithin 72 hrn. for within 96-120 hra, within 72 hrs.storm of 135 mm for 150 mm storm for 150 m sto
(Souroes: Bureaus of Water Resources Anhui, J-anssu and Shandong)

62ANNEX 1TABLE 5-2
CHINAIRRIGATED AGRICULTURE INTENSIFICATION PROJECT
Typical Drainage System Design (Jiangsu)
Kai& 3ranch Lateral Sub W"lLateral Drain
Comand Area (ha) 1500-2500 150-300 10-20 1-2 0.3-0.5
Spacing (m) 3000-5000 800-1000 100-200 100 50
Length (m) 5000 1500-3000 500-1000 100-200 50-100
Depth lo) 3-5 2.5-4.0 1.5-2.0 0.8-1.0 0.5
bed wv4th tm) 4-6 2-3 1.0 0.5-0.7 0.3
Side slope (t:y) 3:1 - 4:1 3:1 - 2.5:1 2:1 - 1.5:1 1:1 0.5:1
Velocity Cm/*de) 0.8-1.0 0.5-0.7 0.2-0.3 0.1 0.1
Discharge (m3Isec) 15-25 2-4 0.3-0.4 0.05 0.02
Typical Canal System Design (Jiangsu)
Main Branch Lateral Sub Lateral Channel
Command Area (ha) 1500-2500 150-300 10-20 1-2 0.3-0.5
Spacing Cm) 3000-5000 800-1000 100-200 100 50
Length tm) 5000 1500-3000 500-1000 100-200 50-100
Depth (m) 1.8-2.0 1.0-1.2 0.6-0.8 0.3-0.5 0.2-0.3
Bad vidth (m) 3-5 1.5-2.0 0.5-0.8 0.3-0.4 0.2-0.3
SLde slope 2:1 1.5:1 1:1 0.8:1 0.5:1
Velocity (.1Sc) 0.6 0.5 0.4 0.3 0.2
Discharge (m3/*sec) 3-5 0.6-0.8 0.04-0.06 0.01 0.003

CHINAIRP1OAT ACRICULTUME INTENSIFICATION PROJECT
Daa/jResorvolrs Required Periodic Safety lnspeetions \0
Ne. Pam/Roservier Lecatlon Vat. Surf Roservoir Storage Main Embankent (a) Wator Levels (i) Aroa Irrig.Mbe Area Total Operatienal top Width 1.i. Ht. Longth Oeoigned Operational Flood Designed Actual
Xuahou NMbacipelity (be) __(o00mo)-
Teegehem Cunty
1. Wao Tush leug iI 1.C 49t0 4700 6.0 6.5 95o0 41.0 30.0 1500.0 1333.32. Do Leoh" PeaJI 1.4 460E 4450 6.0 6.0 3O35 33.0 32.5 1000.0 600.0
3. Le a" Pajil 1.3 4030 4000 6.0 6.5 3130 35.0 34.5 300.0 466.74. Yams We zbe"jI 1.3 400 WOO 6.0 7.5 3100 34.5 34.0 1733.8 133.3S. Shuihle Zheigji 1.0 3200 2700 6.0 6.0 2060 34.0 33.0 300.0 600.0
6. Xilhu_ Fse"" 2.5 6500 6o0 6.0 6.5 4420 33.0 32.5 1200.0 1000.07. VuW" Famum 0.0 2600 2500 W.0 6.5 2800 32.0 31.5 *00.0 333.8
liayl Ceutty
3. Gujl 6..Jl 7.0 2100 390 5.0 10.0 1540 U 9.9 33.5 83. 5 560.0 2000.09. Sadial Kelie 7.5 5960 4210 4.0 7.0 4010 35.5 C6.5 35.0 686.7 200.010. Xie bua Tieqpisba 7.0 2950 1790 4.0 3.0 2000 33.4 37.5 37.5 266.7 166.?
Liamymgpeg Mmiclpallty
beaghaI Ceosty
11. Xix _h HNuisha 22.3 19140 16100 3.0 11.5 9O00 33.1 32.5 32.0 1833.3 360.712. Hmeshe Shihe 26.0 24300 12070 6.0 8.0 3600 40.0 33.5 83.0 1333.3 1466.7
13. Nheagk Heegh 42.2 26290 14300 5.0 12.5 1960 29.0 27.5 27.0 2666.7 1333.314. Cseegll XKumA4Od 4.0 22100 14060 6.0 15.0 1300 60.3 43.5 47.5 2660.7 1600.015. QRulg Chegte 18.3 5700 2240 4.6 6.0 1200 29.2 27.3 27.3 400.0 266.716. Zha"agge Ch est e 19.3 4500 630 3.5 5.0 1400 23.2 26.1 26.1 200.0 200.0
bmye Cet *y
17. Batielgi Jimnk 32.0 23100 14730 6.0 13.4 920 33.4 32.0 81.5 1466.7 1183.313. Iaeg I Shiqla. 4.8 2610 1060 3.0 13.6 1160 30.3 28.9 23.0 1000.0 300.0X
19. J.lagtkeA masham 5.0 8320 2670 5.0 17.0 760 87.2 36.1 35.8 1133.3 400.0I la Iccerdbnco with the World Bakhos Operational Manual Statement No.3.30.
Source: Jilumw Provilceal rear utof Water Reseerces.
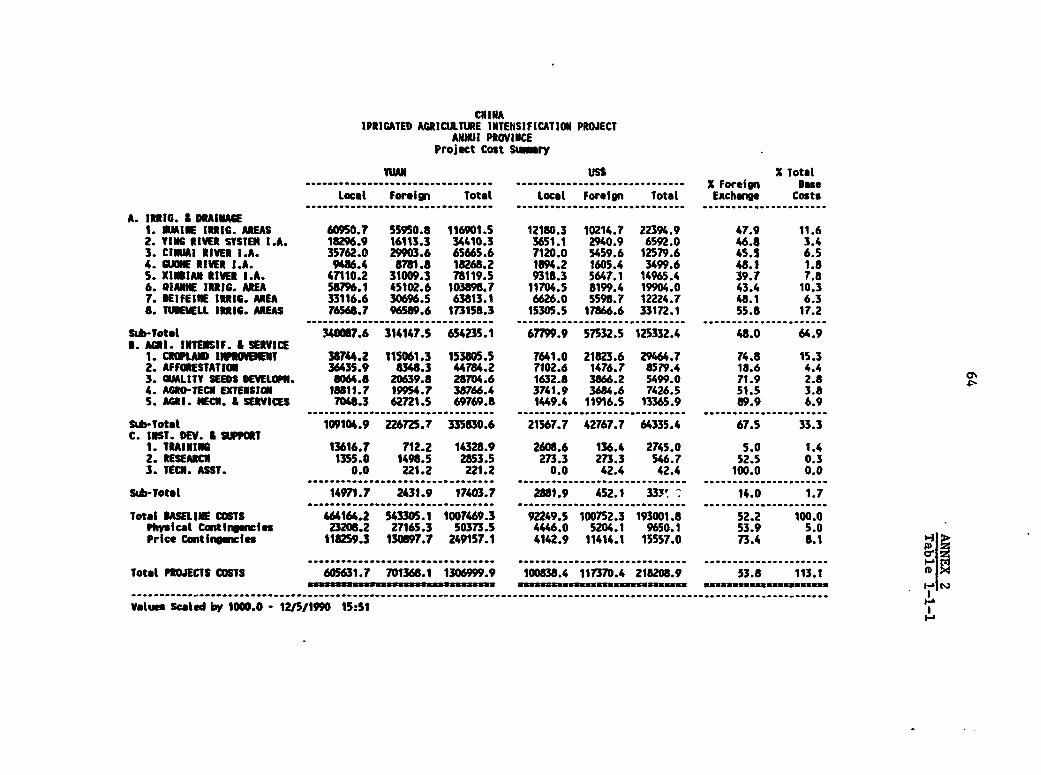
CHINAIPRIGATED AGRICULTURE INTENSIFICATION PROJECT
ANHUI PROVINCEProject Cost Sune ry
tAN USS X Total..*. .............. ..........-................... X Foreign gase
Local Foreign Total Local Foreign Total Exchange Costs
A. RIt3C. & DRAINASE1. NUAINE IuRIG. AtEAS 60950.7 55950.8 116901.5 12180.3 10214.7 22394.9 47.9 11.62. lIMO RIVER SYSTEM I.A. 18296.9 16113.3 34410.3 3651.1 2940.9 6592.0 46.8 3.43. CINUAI RIVER I.A. 35762.0 29903.6 65665.6 7120.0 5459.6 12579.6 45.5 6.54. CUOtH RIVER l.A. 9486.4 8781.8 18268.2 1894.2 1605.4 3499.6 48.1 1.85. XINSIAM RIVER I.A. 47110.2 31009.3 78119.5 9318.3 5647.1 14965.4 39.7 7.86. QAKNE I3RI3. AREA 58796.1 45102.6 103898.7 11704.5 8199.4 19904.0 43.4 10.37. KEIFEIE 1I31G. REA 33116.6 30696.5 63813.1 6626.0 5598.7 12224.7 48.1 6.38. TuENEULL IRRIG. AREAS 76568.7 96589.6 173158.3 15305.5 17866.6 33172.1 55.8 17.2
Sub-Total 340087.6 314147.5 654235.1 67799.9 57532.5 125332.4 48.0 64.9S. AGRI. INTENSIF. S SEtVICE
1. CROPLAI INPOVEENT 38744.2 115061.3 153805.5 7641.0 21823.6 29464.7 74.8 15.32. AFFORESTATION 36435.9 0348.3 44784.2 7102.6 1476.7 8579.4 1a.6 4.43. QULIT' SEED DEVWLOPH. 8064.8 20639.8 28704.6 1632.8 3866.2 5499.0 71.9 2.8 0%4. AGRO-TECI EXTENSION 18811.7 19954.7 38766.4 3741.9 3684.6 7426.5 51.5 3.85. AGRI. hECN. A SEtVICES 7048.3 62721.5 69769.8 1449.4 11916.5 13365.9 89.9 6.9
................................. .............................. ................... ...............................................................
Sub-Total 109104.9 226725.7 335830.6 21567.7 42767.7 64335.4 67.5 33.3C. INST. DEV. S SUPORT
1. TRAINING 13616.7 712.2 14328.9 2608.6 136.4 2745.0 5.0 1.42. RESEARCH 1355.0 1498.5 2853.5 273.3 273.3 546.7 52.5 0.33. TECN. ASST. 0.0 221.2 221.2 0.0 42.4 42.4 100.0 0.0
........ ......................... ............................. .......... ............
Sub-Total 14971.7 2431.9 17403.7 2881.9 452.1 333 14.0 1.7
Total ASELIUE COSTS 464164.2 543305.1 1007469.3 92249.5 100752.3 193001.8 52.2 100.0Physical ContingencIes 23208.2 27165.3 50373.5 4446.0 5204.1 9650.1 53.9 5.0Price Contingencies 118259.3 130897.7 249157.1 4142.9 11414.1 15557.0 73.4 8.1
_ .......................... .................. ............---..-....
Total PROJECTS COTS 605631.7 701368.1 1306999.9 100838.4 117370.4 218208.9 53.8 113.1---- ----- -- - -- ---------- ----------- ----- ---------=-_-_ Y- -------- _s---Y-Y-Y----- s
Value Scaled bvr 1000.0 - 1215/1990 15:51
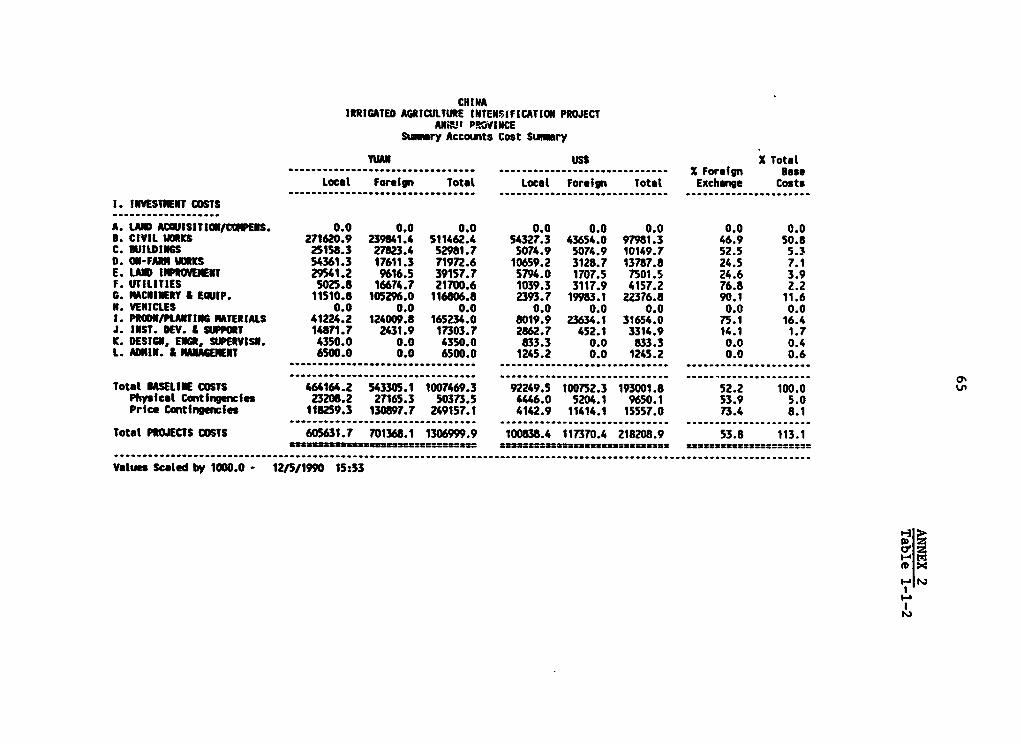
CHINAItRIGATED AGRICULTURE INTENWIFICATION PROJECT
ANiWI PVININCESunmry Accounts Cost Summary
YUAN USS X Total.............................. ...........---.-------------------X Foreign pase
Local Foreign Total Locat Foreign Total Exchange Costs
1. INVESTHENT COSTS...................
A. LAND ACWISITIGNIcoNPENS. 0.0 0.0 0.0 0.0 0.0 0.0 0.0 0.0D. CIVIL WORKS 271620.9 239841.4 511462.4 54327.3 43654.0 97981.3 46.9 50.8C. UVILDIIIS 25158.3 27823.4 5291.7 5074.9 5074.9 10149.7 52.5 5.30. 01-FAIN ItKS 54361.3 17611.3 71972.6 10659.2 3128.7 13787.8 24.5 7.1E. LANID IWl"NEhT 29541.2 9616.5 39157.7 5794.0 1707.5 7501.5 24.6 3.9F. UTILITIES 5025.8 16674.7 21700.6 1039.3 3117.9 4157.2 76.8 2.2G. NACRIIERm & EQUIP. 11510.8 105296.0 116806.8 2393.7 19983.1 22376.8 90.1 11.6W. VENICLES 0.0 0.0 0.0 0.0 0.0 0.0 0.0 0.01. PRODh/PLAXTING MATERIALS 41224.2 124009.8 165234.0 8019.9 23634.1 31654.0 75.1 16.4J. INST. DEV. & SUPPORT 14871.7 2431.9 17303.7 2862.7 452.1 3314.9 14.1 1.7K. DESIe, ENGR, SUIERVISN. 4350.0 0.0 4350.0 833.3 0.0 833.3 0.0 0.4L. ADN8I. & NANAMEUIT 6500.0 0.0 6500.0 1245.2 0.0 1245.2 0.0 0.6
,,, ...................................... .............................. ...... I............. -. .. -------*---a
Total BASELINE COSTS 464164.2 543305.1 1007469.3 92249.5 100752.3 193001.8 52.2 100.0 hPhlsical Contingencies 23205.2 27165.3 50373.5 4446.0 5204.1 9650.1 53.9 5.0Price Continge ies 118259.3 130897.7 249157.1 4142.9 11414.1 15557.0 73.4 8.1
... ... __.. ............. ............. ....... ........ _ ................ ................................. .....
Total PROJECTS COSTS 605631.7 701368.1 1306999.9 100838.4 117370.4 218208.9 53.8 113.1U22sSzZ3SZ33z3zzu2zzguuu_ 33zzz23=23U333323332zzsz= U3*2*UxxzzUU ==3..
ValeScae 1...0.... ..... - 1./59 ........./19.0 15:53,,,,,,,,,,,__,,,,,,,,
V tues Scaled bV 10100.0 - 12/5/1990 15:53
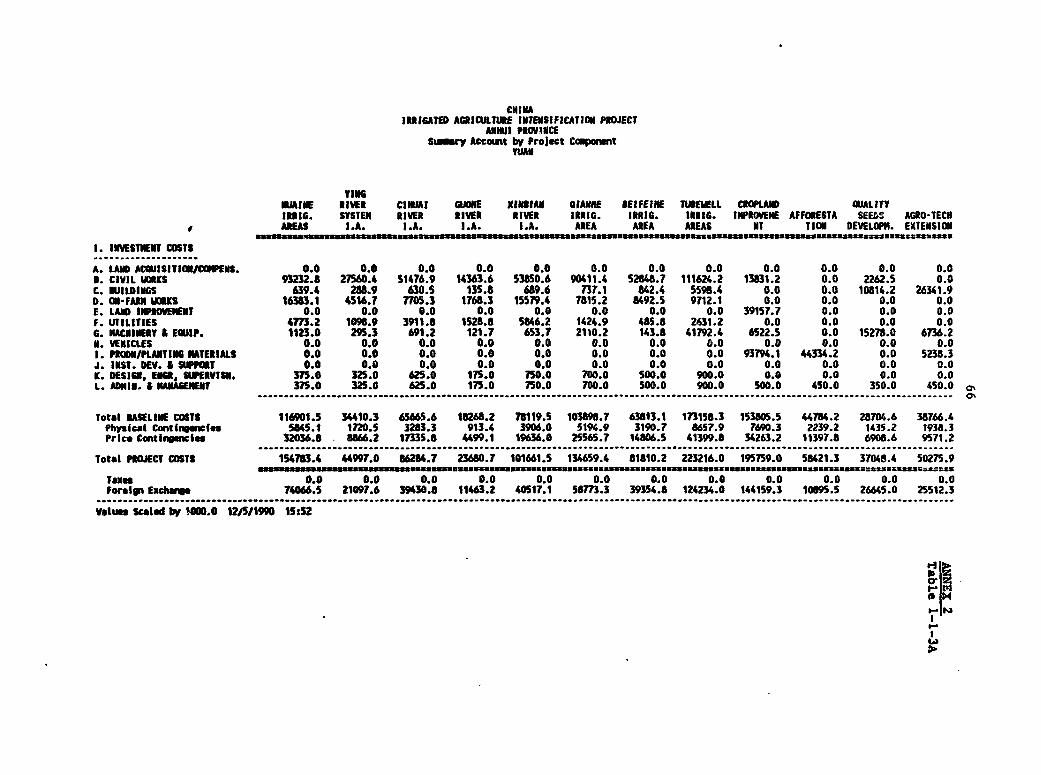
CHINAIRIGATED ACRIALTURE INTENSIFICATION PIOJECT
ANUI PROVINCESumry Account by Project Cowponhnt
vUiv
YIN.MUMINE RIVER CIHUMI GUONE XIILA QIAINNE BEIFEINE TUWEIELL CROPLASD QUALITYIRRIC. SYSTEM RIVER RIVER RIVER IRI6. IRF1G. IRF16. INPROVENE AFFORESTA SEEDS AGRO-TECHAM"AS l.A. I.A. I.A. I.A. AREA AREA AREAS NT TION DEVELOP$. EXTENSION
1. INVESTNENT OOSTS...... ......... _. .,
A. LAND ACQUISITIONCOMPENS. 0.0 0.0 0.0 0.0 0.0 0.0 0.0 0.0 0.0 0.0 0.0 0.0I. CIVIL VOWS 93232.8 27560.4 51476.9 14363.6 S3850.6 90411.4 52U88.7 111624.2 13831.2 0.0 2262.5 0.0C. BUILDINGS 639.4 2W8.9 630.5 13S.8 689.6 737.1 842.4 S596.4 0.0 0.0 10814.2 26341.9D. ON-FAIN VOKS 16383.1 4516.7 7705.3 1768.3 15579.4 7815.2 8492.5 9712.1 0.0 0.0 0.0 0.0E. LAND IOW0VENENT 0.0 0.0 0.0 0.0 0.0 0.0 0.0 0.0 39157.7 0.0 0.0 0.0F. UTILITIES 4 M .2 1098.9 3911.8 IS28.8 5846.2 1424.9 485.8 2631.2 0.0 0.0 0.0 0.0G. ACUIKIEY & EQUIP. 123.0 295.3 691.2 121.7 6S3.7 2110.2 143.8 41792.4 6522.5 0.0 15278.0 6736.2L. VEHICLES 0.0 0.0 0.0 0.0 0.0 0.0 0.0 0.0 0.0 0.0 0.0 0.01. PR7ON/PLAITING NATERIALS 0.0 0.0 0.0 0.0 0.0 0.0 0.0 0.0 93794.1 44334.2 0.0 5238.3J. INST. DEV. * SUPPRT 0.0 0.0 0.0 0.0 0.0 0.0 0.0 0.0 0.0 0.0 0.0 0.0K. DESIGI, ENGR4, SWUIVISN. 375.0 325.0 625.0 17S.0 750.0 700.0 500.0 900.0 0.0 0.0 0.0 0.0L. HIIN. 4 NANAEUIENT 37S.0 325.0 625.0 17S.0 750.0 700.0 SOO.0 900.0 50o.0 450.0 350.0 450.0 a.......... ........... _-................. ---.... ......----............ -----................ ----------.--...................................................... - o
Total ASELINE tOSTS 116901.5 3410.3 65665.6 18268.2 78119.5 103898.7 63813.1 173155.3 153805.5 4784.2 28704.6 38766.4Physical Contingu cres S845.1 1720.5 3283.3 913.4 3906.0 5194.9 3190.7 8657.9 7690.3 2239.2 1435.2 1938.3Price ContI ancIes 32036.8 81866.2 17335.8 499.1 19636.0 2SS65.7 14806.5 41399.8 34263.2 11397.8 6908.6 9571.2..... ....... .......................... ...................................................... ....... ............ ................... ..................... . ........... ..... .....Total POECT COSTS 154783.4 4997.0 86284.7 23680.7 101661.5 134659.4 81810.2 223216.0 195759.0 S8421.3 37048.4 50275.9Taxes 0.0 0.0 0.0 0.0 0.0 0.0 0.0 0.0 0.0 0.0 0.0 0.0foreig exdhae 74066.S 21097.6 39430.8 11463.2 40517.1 58M.3 39354.8 124234.0 144159.3 10895.5 26645.0 25512.3.............. .......................... ..................................................................
__.......... _... ... ........... ..................... ............................... ............................... .. .. values Saled by 1000.0 12/5/1990 15:52
I.

CHINAIRRIGATED ACRICULTURE INTENSIFICATION PROJECT
ANNUI PROVINCESumry Account by Project Co;poant
YUAN
Physical PriceAGRI. Contingencies ContingcnI es
RECN. * TECH. ......- ..................SERVICES TRAINING RESEARCH ASST. Total X Amount X Mouit
1. INVESTMENT COSTS....................
A. LAND ACUISITIOU/CONPENS. 0.0 0.0 0.0 0.0 0.0 0.0 0.0 0.0 0.0O. CIVIL WOIRS 0.0 0.0 0.0 0.0 511462.4 5.0 25573.1 25.2 129033.1C. SUILDIUS 6263.5 0.0 0.0 0.0 52981.7 5.0 2649.1 22.7 12037.00. CN-FAiN WKS 0.0 0.0 0.0 0.0 71972.6 5.0 3598.6 25.6 18447.0E. UAIN IWROVEIENT 0.0 0.0 0.0 0.0 39157.7 5.0 1957.9 28.8 11275.1F. UTILITIES 0.0 0.0 0.0 0.0 21700.6 5.0 1085.0 25.2 5476.6G. MACNIhRT & EWIP. 41339.0 0.0 0.0 0.0 116806.8 5.0 5840.3 24.7 28836.8N. VEHICLES 0.0 0.0 0.0 0.0 0.0 0.0 0.0 0.0 0.01. PIO)UIPLANTING MATERIALS 21867.4 0.0 0.0 0.0 165234.0 5.0 8261.7 21.9 36174.0 0'J. INST. KEV. * SUPPORT 0.0 14228.9 2853.5 221.2 17303.7 5.0 865.2 28.0 4837.1K. DESIGN. ENO, SIERVISN. 0.0 0.0 0.0 0.0 4350.0 5.0 217.5 28.0 1219.0L. DNIN. Z NUANCENENT 300.0 100.0 0.0 0.0 6500.0 5.0 325.0 28.0 1821.5
Total IASELIVE COSTS 69769.8 14328.9 2853.S 221.2 1007469.3 5.0 50373.5 24.. 249157.1Phyical Contingencies 3488.5 716.4 142.7 11.1 50373.5Price Continge lnes 18005.3 4029.6 779.8 55.7 249157.1 4.8 11864.6
Total POJECT COSTS 91263.6 19075.0 3776.0 288.0 1306999.9 4.8 62238.1 19.1 249157.1
loxes 0.0 0.0 0.0 0.0 0.0 0.0 0.0Foreign Exchwnge 82018.6 929.3 1983.0 288.0 701368.1 4.8 33396.5
-------........ ......... ............. ....... ................... .......... .................. .............. .,,,,,,,, ........... :..
Values Scaled by 1000.0 1215/1990 15:52
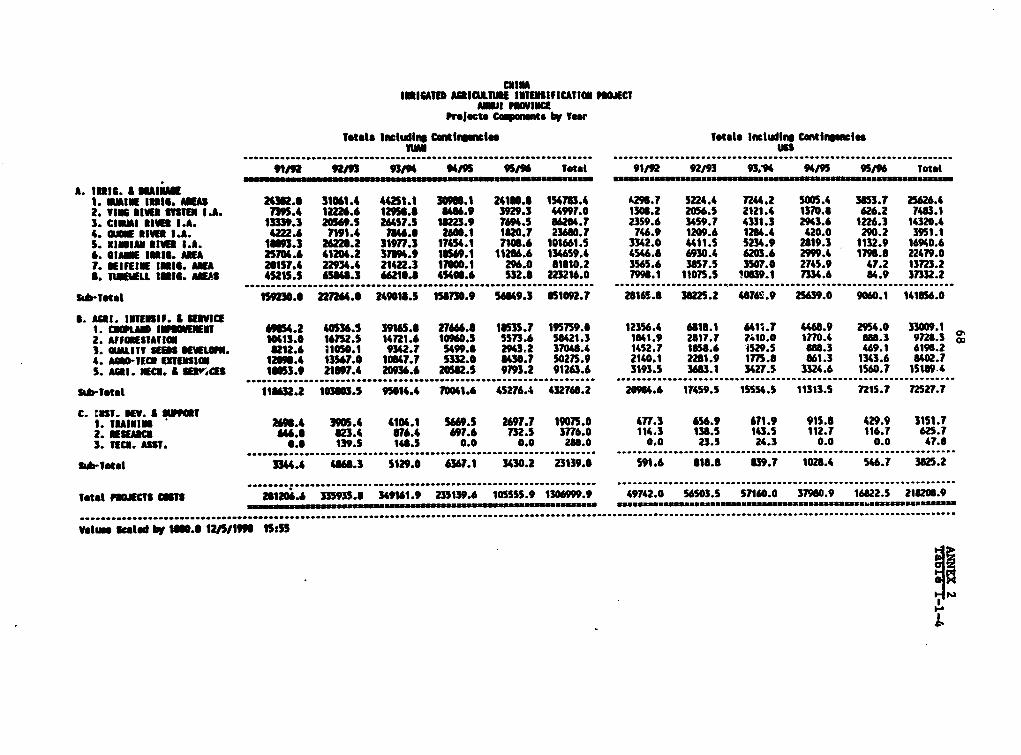
CUIMAIIATS AICILTURE IUINSIFICATIU0 "JtCT
"rjects Caqup s by veer
Totat. Inctulln Csntiranctlee Ttatl Illnudirn Conti rgmmlee11 us55
................................................................... ..........................................................................................................................................
9/ 929 9 941/ 95/96 Total 91/92 92/93 n ,94 94/Uf 9/ Total
A. tole. a 3111o11. manIntI. U11 24362. 31061.4 44251.1 30961.1 24130.6 154783.4 296.7 5224.4 7244.2 50054 353.7 2626.42. TIIS *l1i Mg1 .A. 735.4 12226.6 12956.6 4.9 3929.3 44997.0 06.2 2056.5 2121.4 1370.6 626.2 7483.13. CIMIMI 413 I.A. 13339.3 2569.5 2e452.5 1122.9 7694.5 56264.7 2359.6 359.7 4331.3 2943.6 1226.3 14320.44. UIE mIVII l.A. 4222. 7191.4 5.6 2600.1 120.7 23660.7 74.9 1209.6 12U1.4 420.0 290.2 3951.1S. xnluu *l3 *.A. 193.3 22.2 31977.3 17454.1 7106.6 10161 3342.0 4411.S S234.9 2619.3 1132.9 16940.66. OUIII IUll. AMA 2576S.6 41204.2 37594.9 I59.1 11286.6 13459.4 446.6 90.4 603.6 2M9.4 1796.6 22479.0T. KIEIWIi IlN . U 21ST7.4 224.4 21422.3 17000.1 296.0 01310.2 3565.6 3 7. 35so7.0 2745.9 47.2 1372.2*. tWIZ ELL IUIS. AME 4S21S.5 6551.3 66210.5 45406.6 532.5 223216.0 79.1 1107S.5 '0639.1 7334.6 84.9 37332.2
................................................................... .................................................................................................. ...............................
S-Total 15923.6 22764.0 249618.5 157.9 569.3 3S1092. 26165.5 3822.2 40M6.9 25639.0 9060.1 141156.0
B. A£5I. IKIEIf. £ KICE1. CUUt I IWll EET 69M.2 40536.5 3916S5. 27666.8 1553S.7 195759.0 12356.4 6815.1 U11.7 4468.9 2954.0 33009.12. AfFIUSTATIIU 10413.0 16752.5 14721.6 1Of0.5 s573.6 5421.3 1641.9 2517.7 7.410.0 1770.4 88.3 9m 5 X
5. ALITY 1KEN SIWIU. 62.6 110S0.1 942.7 5499.0 2943.2 370".4 1452.7 15. 15293. 885.3 469.1 6196.24. A0-TECU IIISN101 12696.4 1357.6 1G4?.? 5332.0 6430.7 50275.9 2140.1 2251.9 7A.6 861.3 1343.6 602.7S. AGRI. ECU. a M3,cEs 10053.9 21097.4 23.6 20582.5 979.2 9126.6 3M.5 363.1 3427.5 3324.6 1560.7 1S169.4
Sab.Totel 111332.2 1363 I .s 95014.4 760. 45276.4 4527".2 20964.6 17459.5 1SS54.5 11313.5 721S.7 M25.7
C. tEST. KEV. A MONPIT1. TuMIEIS 269A.4 3915.4 4104.1 569.5 2697.7 1905.0 477.3 6S6.9 671.9 915.8 429.9 3151.72. KEAC 646.0 623.4 576.4 697.6 72.5 3776.0 114.3 136.5 143.S 112.7 116.7 625.73. TEC. ASSt. 6.6 139 148.5 0.0 0.0 285.0 0.0 23.5 24.3 0.0 0.0 47.6
... ... @*o@w@wo............................................................................ .................................... . ^v.v@* .................... , ,,.......... ,Sb-ttat 344.4 4165.3 S129.0 6367.1 3430.2 23139.6 S91.6 518.5 U39.7 1025.4 S46.7 3825.2
.........................................*.*o*....................................................................... .. .................................................. ..............
Toatl nWCTs CWST$ 21206.6 3M935.8 39161.9 23539.6 1OSSS5.9 1306999.9 49742.0 565os.5 S7160.0 37980.9 16522.5 2182.9
................................................. ....................................................................................................... w6...... *sev*Xvvv@@@v*@6*.@@.............................................. @s.
Volum cald by 183.0 1215/1"9 lsss
FIi
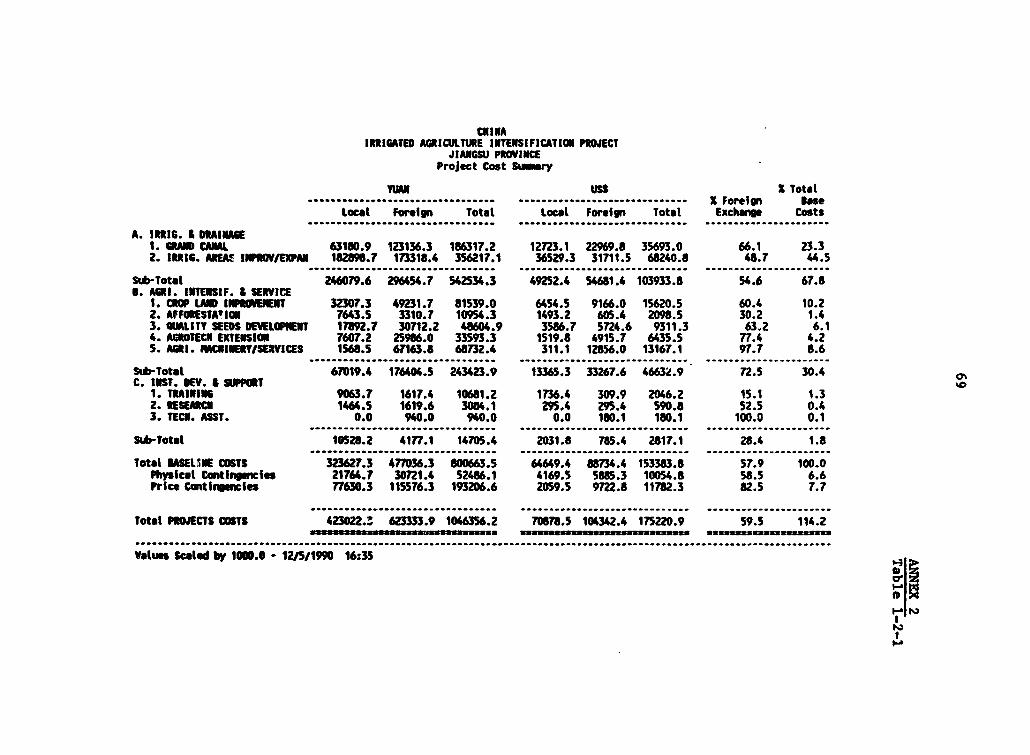
CNINAIRRIGATED AGRICULTURE INTENSIFICATION PROECT
JIANGIC PROVINCEProject Cost Sumnmry
VWS X Total...... ,....................... ...---.-......................... X Foreign BaseLocal Foreign Total Local Foreign Total Exchange Costs
A. IRIG. I DAINAE1. GRAJ CAL 63180.9 123136.3 186317.2 123.1 22969.6 35693.0 66.1 23.32. IRtIG. AREMT IOV/EXPM 1829.7 173318.4 356217.1 36529.3 31711.5 68240.8 48.7 44.5
Su*-Total 246079.6 296454.7 542534.3 49252.4 54681.4 103933.8 54.6 67.8B. ASG. INTEISIF. I SERVICE
1. CRW LAW INROVEIENT 32307.3 49231.7 81539.0 6454.5 9166.0 15620.5 60.4 10.22. AFFItESTA'IU 763.5 3310.7 10954.3 1493.2 605.4 2098.5 30.2 1.43. OMLITY SEEDS DEILOPNINT 17892.7 30712.2 48604.9 3586.7 5724.6 9311.3 63.2 6.14. AGROTECN EXTENSION 7607.2 2596.0 33593.3 1519.8 4915.7 6435.5 77.4 4.25. AGRI. ICINEPY SERVICES 1568.5 67163.6 68732.4 311.1 12856.0 13167.1 97.7 8.6
Sub-Totel 67019.4 176404.5 243423.9 13365.3 33267.6 46632.9 72.5 30.4C. INST. OEV. & SUT '01. TRAINING 9063.7 1617.4 10681.2 1736.4 309.9 2046.2 15.1 1.3
2. ItESEARCI 146.5 1619.6 3064.1 295.4 295.4 590.8 52.5 0.43. TECI. ASST. 0.0 940.0 940.0 0.0 110.1 180.1 100.0 0.1Sub-Total 10528.2 4177.1 14705.4 2031.8 785.4 2817.1 28.4 1.8~~~~~~~~~~~~~,. .. i; ..... ii ..... .................... ............................................. ........... ......................
total ASELIIE COSTS 323627.3 477836.3 800663.5 6469.4 8874.4 153383.8 57.9 100.0Phpical Contliencies 21764.7 30721.4 52486.1 4169.5 5885.3 10054.8 58.5 6.6Price Conting-ies 77630.3 115576.3 193206.6 2059.5 9722.8 11782.3 62.5 7.7
.......... ............ ..................... . ............. .............................. .........................................................
Total PRECTS COSTS 423022.3 623333.9 1046356.2 70678.5 104342.4 175220.9 59.5 114.2...........................................................................................................................
Value Scaled by 1000.0 - 12U5/1990 16:35

CHINAIRRIGATED AGRICULTURE INTENSIFICATION PROJECT
JIANGISU PROVINCESu_ery Accouats Cost Stary
YUAN USS X Total., ........................... ....------........................ X Foreign ease
Local Foreign Totat Local foreign Total Exchange Costs.................. ...................................... .............................. .........................................................
1. IINESTEI IT COSTS...................
A. LAW ACQUISITION/C(WENS. 200.0 0.0 200.0 38.3 0.0 38.3 0.0 0.0B. CIVIL WORKS 170898.0 199085.4 369983.4 34462.1 36416.0 70878.0 53.8 46.2C. WILDIICS 21129.2 23367.5 44496.7 4262.1 4262.1 8524.3 52.5 5.6D. CU-FARN UWORS 50662.3 17397.0 68059.3 9945.9 3092.3 13038.2 25.6 8.5E. LAW IIfOVEJENT 15254.3 5220.6 20474.9 2994.5 927.9 3922.4 25.5 2.6F. ELECTRICITY SlPPLY 4134.4 13716.9 17851.3 854.9 2564.8 3419.8 76.8 2.2G. COUWhICATIO 0.0 0.0 0.0 0.0 0.0 0.0 0.0 0.0N. MACHINERY & EWUIPNENT 14700.3 160168.8 174869.1 2920.9 30578.9 33499.8 91.6 21.81. VENICLES 0.0 10092.3 10092.3 0.0 1933.4 1933.4 100.0 1.3J. PRODN./PW NTING NATERIALS 26259.9 43810.6 70070.6 5249.9 8173.5 13423.5 62.5 8.8K. INST. DEV. & SUPPORT 10528.2 4177.1 14M.4 2031.8 785.4 2817.1 28.4 1.8L. DESIGN, ENGR.. SUPERVISI. 4093.3 0.0 4093.3 784.2 0.0 784.2 0.0 0.5N. A11. * MANAGENENT 5767.3 0.0 5767.3 1104.9 0.0 1104.9 0.0 0.7
.......................................................... .............................. ......................
~~~~~~~~~~,.......................................... .............................. ............... ...
Total BASELINE COSTS 323627.3 47036.3 800663.5 64649.4 8734.4 153383.8 57.9 100.0Phyuical Continpgncres 21764.7 30721.4 52486.1 4169.5 5885.3 10054.8 58.5 6.6Price Contirngecies 77630.3 115576.3 193206.6 2059.5 9722.8 11782.3 82.5 7.7
.... ....................................... .................. ......................................... ......................
Total PROJECTS COSTS 423022.3 623333.9 1046356.2 70878.5 104U42.4 175220.9 59.5 114.2uuz sag mzz= =X uSZs=XzzzzXzXt-SSXs=ws=Xu
...........................................................................................................................
Values Scaled by 1000.0 - 12/511990 16:37
m0
I-as
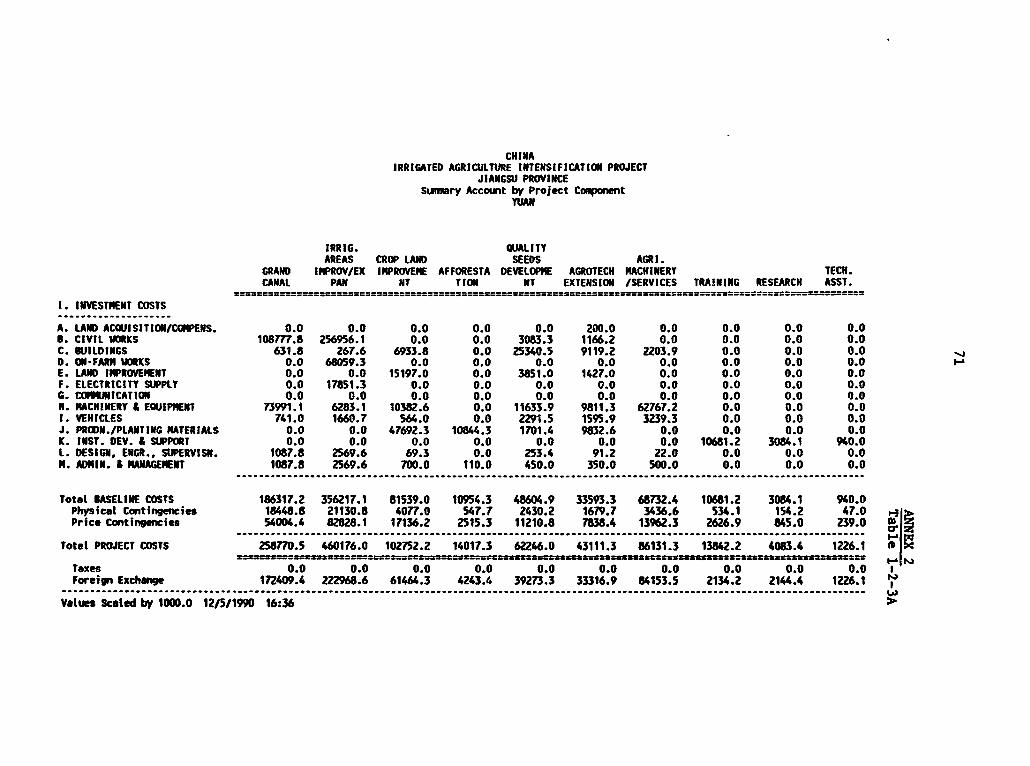
CHINAIRRIGATED AGRICULTURE INTENSIFICATION PROJECT
JIANGSU PROVINCESumiary Account by Project Caqonent
YULAN
IRRIG. QUALITYAREAS CROP LAND SEEDS AGRI.GRAND IMPROV/EX IMPROVEME AFFORESTA DEVELOPHE AGROTECH MACWINERY TECH.CANAL PAN MT TION NT EXTENSION /SERVICES TRAINING RESEARCH ASST.
1. INVESTNENT COSTS..... ....... .. ........
A. LAND ACQUISITION/CONPENS. 0.0 0.0 0.0 0.0 0.0 200.0 0.0 0.0 0.0 0.0B. CIVIL IMKS 108M.8 256956.1 0.0 0.0 3083.3 1166.2 0.0 0.0 0.0 0.0C. WUILDINGS 631.8 267.6 6933.8 0.0 25340.5 9119.2 2203.9 0.0 0.0 0.0 _D. ON-FARM WOIRKS 0.0 68059.3 0.0 0.0 0.0 0.0 0.0 0.0 0.0 0.0E. LAND IWPROVENENT 0.0 0.0 15197.0 0.0 3851.0 1427.0 0.0 0.0 0.0 0.0F. ELECTRICITY SUPPLY 0.0 17851.3 0.0 0.0 0.0 0.0 0.0 0.0 0.0 0.0G. CO"UMICATION 0.0 0.0 0.0 0.0 0.0 0.0 0.0 0.0 0.0 0.0W. MACHINERY & EQUIPMENT 73991.1 6283.1 10382.6 0.0 11633.9 9811.3 62767.2 0.0 0.0 0.01. VEHICLES 741.0 1660.7 564.0 0.0 2291.5 1595.9 3239.3 0.0 0.0 0.0J. PROWNIPLANTING MATERIALS 0.0 0.0 47692.3 10844.3 1701.4 9832.6 0.0 0.0 0.0 0.0K. INST. DEV. & SUPPORT 0.0 0.0 0.0 0.0 0.0 0.0 0.0 10681.2 3084.1 940.0L. DESIGN, ENGR.. StUERVISR. 1087.8 2569.6 69.3 0.0 253.4 91.2 22.0 0.0 0.0 0.0M. ADMIN. & MANAGEMENT 1087.8 2569.6 700.0 110.0 450.0 350.0 500.0 0.0 0.0 0.0...............................................................................................................
Total BASELINE COSTS 186317.2 356217.1 81539.0 10954.3 48604.9 33593.3 68732.4 10681.2 3084.1 940.0Physical Contingencies 18448.8 21130.8 4077.0 547.7 2430.2 1679.7 3436.6 534.1 154.2 47.0 .. sPrice Contingencies 54004.4 8Z828.1 17136.2 2515.3 11210.8 7838.4 13962.3 2626.9 845.0 239.0Total PROJECT COSTS 258770.5 460176.0 102752.2 14017.3 62246.0 43111.3 86131.3 13842.2 4083.4 1226.1 0 Xs=s ------- RZss=z====s==s===s=rs=ts=S=tsswssssssssssssss sr=rrsss2:=s=== FrTaxes 0.0 0.0 0.0 0.0 0.0 0.0 0.0 0.0 0.0 0.0Foreign Exchange 172409.4 222968.6 61464.3 4243.4 39273.3 33316.9 84153.5 2134.2 214.4 1226.1 '
Values Scaled by 1000.0 12/5/1990 16:36
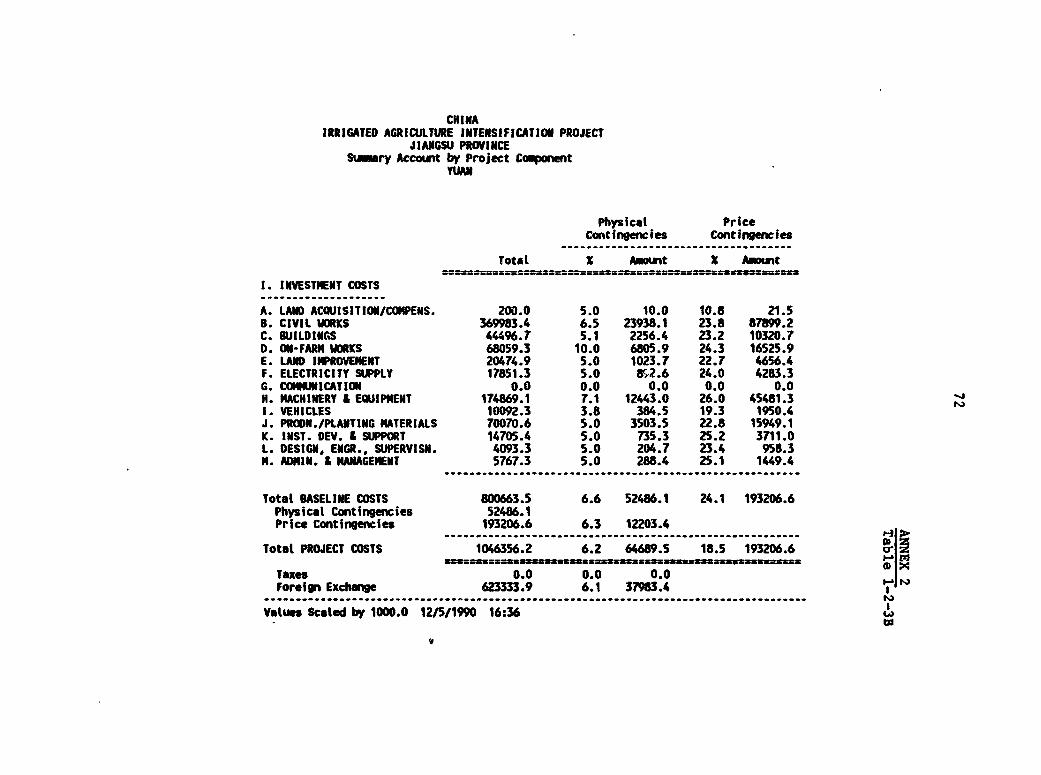
CHINAIRRIGATED AGRICULTURE INTENSIFICATION PROJECT
JIANGSU PROVINCESuimry Account by Project Coqponent
Physical PriceContingencies Contingencies
Total K Amount X Ainnt======== …===== ======SS # =========-3sUSS---=S
1. INVESTMENT COSTS
A. LAND ACQUISITION/COMPENS. 200.0 5.0 10.0 10.8 21.5B. CIVIL WORKS 369983.4 6.5 23938.1 23.8 87899.2C. BUILDINGS 44496.7 5.1 2256.4 23.2 10320.7D. ON-FARM WORKS 68059.3 10.0 6805.9 24.3 16525.9E. LAND IMPROVEMENT 20474.9 5.0 1023.7 22.7 456.4F. ELECTRICITY SUPPLY 17851.3 5.0 892.6 24.0 4283.3G. CONJUICATION 0.0 0.0 0.0 0.0 0.0M. MACHINERY & EQUIPHENT 174869.1 7.1 12443.0 26.0 45481.3I. VEHICLES 10092.3 3.8 384.5 19.3 1950.4J. PRODN./PLANTING MATERIALS 70070.6 5.0 3503.5 22.8 15949.1K. INST. DEV. & SUPPORT 14705.4 5.0 735.3 25.2 3711.0L. DESIGN, ENGR., SUPERVISN. 4093.3 5.0 204.7 23.4 958.3M. ADMIN. & MANAGEMENT 5767.3 5.0 288.4 25.1 149.4
Total BASELINE COSTS 800663.5 6.6 52486.1 24.1 193206.6Physical Contingencies 52486.1Price Contingencies 193206.6 6.3 12203.4
Total PROJECT COSTS 1046356.2 6.2 64689.5 18.5 193206.6
Taxes 0.0 0.0 0.0Foreign Exchange 623333.9 6.1 37963.4
_ _ _ _ _. . .. . . .. . . .. . . .. . .. . . .. . . .. . . .. _ .. . . .. . .
Values Scled by 1000.0 12/5/1990 16:36I,)

CrNIA1RI1GATED AGRICULTURE INTENSIfICATION PROJECT
JIAUGSU PIOYINCEProjects Caxnents by Tear
Totals Including Contingencies Totals Including Conting nclesTMR us,................................. ...................................................................................................... ......................... ..........................................
91/92 92/93 93/94 94/95 95/96 Total 91/92 92/9m 93/9 94/ns 95/96 TotalA. IRRIG. S DRAINAGE
1. GRAND CANAL 24851.7 66624.7 84461.6 54692.2 28140.1 258770.5 4396.0 11206.1 13826.9 8834.1 4484.7 42747.62. IRRIG. ARS IPWRO/EXPAN 125904.7 122844.2 112869.2 75767.9 227900 460176.0 22271.0 20662.1 16477.4 1Z236.4 3632.1 m80.9...... ............................................................. ........................................................................................................
........ ............................ .Stb-Totel 1S0756.4 189468.9 197330.9 130460.1 SO030.1 7189S. 26667.0 31868.1 32304.3 21072.5 8116.7 120028.?6. ACZI. INTENSIF. £ SERVICE
t. CROP LAND IIPROVEHENT 36510.4 30089.5 18720.0 12486.1 4946.1 102752.2 6508.2 5061.0 3064.6 2016.8 788.3 1IT88.92. AFFORESTATION 3237.8 4670.7 3570.7 2357.5 180.5 14017.3 572.7 785.6 584.6 380.8 28.8 2352.43. UALITY SEEDSODEVELOPHENT 14474.2 19787.5 17515.9 8681.3 1787.2 6224.0 2560.3 3328.2 2867.5 1402.2 284.8 10443.04. ACROTECO EXTENSION 11176.9 11296.3 11794.5 6562.2 2281.5 43111.3 1977.1 1900.0 1930.8 1060.0 363.6 7231.4S. AGRI. PAUOINERY/SERVICES 26438.6 32106.6 25392.6 1238.s 955.0 86131.3 4676.7 5400.2 4156.9 200.0 152.2 14586.1............... ............................ ....... .................................... ..................................................................................... ...................................................-Sub-Total 91837.9 979S0.6 76993.7 31325.5 10150.4 30828.1 16245.0 16475.0 12604.4 5059.8 1617.7 52001.9
C. INST. DEV. * SUPPOUT1. TRAINING 2M.1 3896.0 3721.3 2743.s 707.3 13842.2 490.3 65S.6 609.2 443.1 112.7 2311.0 "2. RESEARCH S96.1 942.9 1003.7 979.6 561.1 4083.4 105.4 158.6 164.3 158.2 89.4 676.03. TIEC. ASST. 0.0 558.0 666.1 0.0 0.0 1226.1 0.0 93.8 109.4 0.0 0.0 203.2.... ,,.............. ........ ....... ............ ..................... .......................................................Sub-Total 3368.1 5398.9 5393.1 3723.2 1268.3 19151.6 595.6 908.1 882.9 601.4 202.1 3190.3
.................. . ..... ..................................Total PROJECTS COSTS 245962.4 292818.4 279717.7 165508.8 62348.9 1046356.2 43507.8 492S1.3 45791.5 26733.8 9936.6 175220.9gsm-- ------ - s smaumm.a s -=g uw- *-cXt - # -#- __ t 1 --,,,,,,,,,..,,,,,,,,,,,,,,.....................................................................................................
.................................Values Scaled by 1000.0 12/5/1990 16:37
I. .
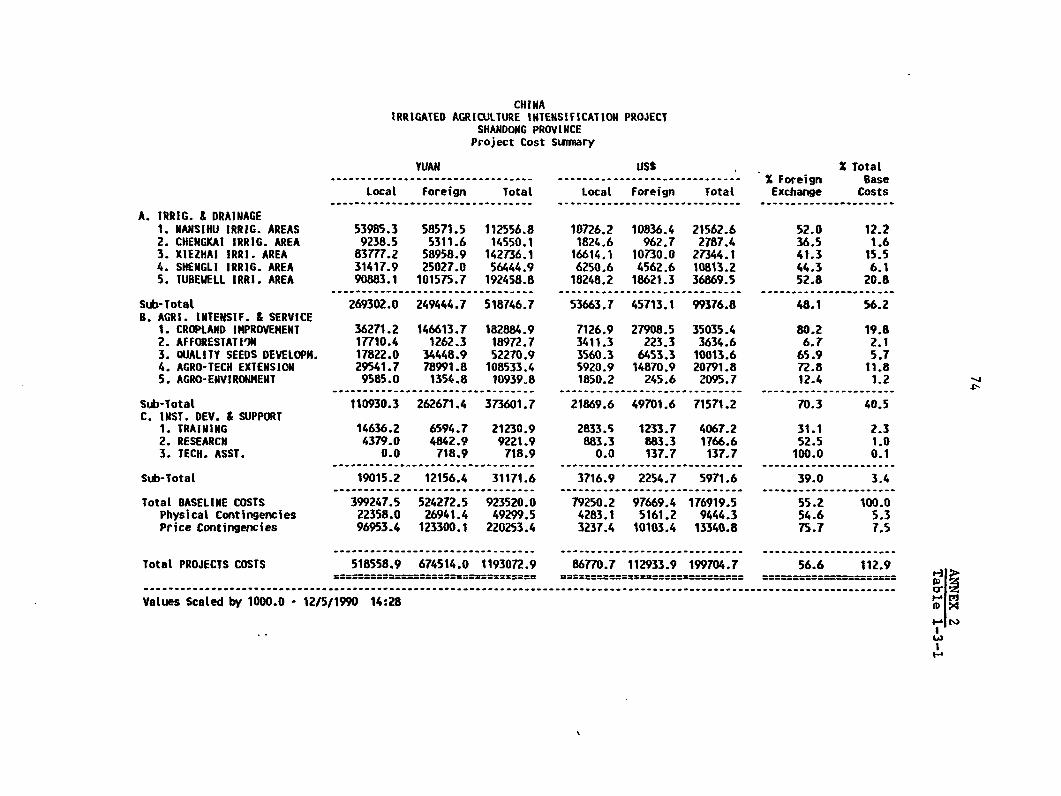
CHINAIRRIGATED AGRICULTURE INTENSIFICATION PROJECT
SHANDONG PROVINCEProject Cost Sumnary
YUAN USS X Total------- '~------ ----------------- ------------------------------ X Foreign Base
Local Foreign Total Local Foreign Total Exchange Costs
A. IRRIG. & DRAINAGE1. HANSINU IRRIG. AREAS 53985.3 58571.5 112556.8 10726.2 10836.4 21562.6 52.0 12.22. CHENGKAI IRRIG. AREA 9238.5 5311.6 14550.1 1824.6 962.7 2787.4 36.5 1.63. XIEZHAI IRRI. AREA 83777.2 58958.9 142736.1 16614.1 10730.0 27344.1 41.3 15.5
4. SHENGLI IRRIG. AREA 31417.9 25027.0 56444.9 6250.6 4562.6 10813.2 44.3 6.15. TUBEWELL IRRI. AREA 90883.1 101575.7 192458.8 18248.2 18621.3 36869.5 52.8 20.8
Stb-Total 269302.0 249444.7 518746.7 53663.7 45713.1 99376.8 48.1 56.2
B. AGRI. INTENSIF. & SERVICE1. CROPLAND IMPROVEMENT 36271.2 146613.7 182884.9 7126.9 27908.5 35035.4 80.2 19.82. AFFORESTATIOW 17710.4 1262.3 18972.7 3411.3 223.3 3634.6 6.7 2.1
3. QUALITY SEEDS DEVELOPH. 17822.0 34448.9 52270.9 3560.3 6453.3 10013.6 65.9 5.74. AGRO-TECH EXTENSION 29541.7 78991.8 108533.4 5920.9 14870.9 20791.8 72.8 11.85. AGRO-ENVIRONMENT 9585.0 1354.8 10939.8 1850.2 245.6 2095.7 12.4 1.2
Sub-Total 110930.3 262671.4 373601.7 21869.6 49701.6 71571.2 70.3 40.5C. INST. DEV. & SUPPORT
1. TRAINING 14636.2 6594.7 21230.9 2833.S 1233.7 4067.2 31.1 2.3
2. RESEARCH 4379.0 4842.9 9221.9 883.3 883.3 1766.6 52.5 1.03. TECH. ASST. 0.0 718.9 718.9 0.0 137.7 137.7 100.0 0.1
Sub-Total 19015.2 12156.4 31171.6 3716.9 2254.7 5971.6 39.0 3.4
Total BASELINE COSTS 399247.5 524272.5 923520.0 79250.2 97669.4 176919.5 55.2 100.0Physical Contingencies 22358.0 26941.4 49299.5 4283.1 5161.2 9444.3 54.6 5.3
Price Contingencies 96953.4 123300.1 220253.4 3237.4 10103.4 13340.8 75.7 7.5
.......................................................... -----------------.....-----------..............--............................----............---------------...............
Total PROJECTS COSTS 518558.9 674514.0 1193072.9 86770.7 112933.9 199704.7 56.6 112.9
Values Scaled by 1000.0 - 12/5/1990 14:28

CHINAIRRIGATED AGRICULTURE INTENSIFICATION PROJECT
SHANDONG PROVINCESummary Accounts Cost Summary
YUAN USS X Total--------------------------------- ------------------------------ X Foreign Base
Local Foreign Total Local Foreign Total Exchange Costs
1. INVESTMENT COSTS...................
A. LAND ACQUISITION/COMPENS. 30095.2 0.0 30095.2 5765.4 0.0 5765.4 0.0 3.38. CIVIL WORKS 186538.8 185552.3 372091.1 37433.2 33848.6 71281.8 49.9 40.3C. BUILDINGS 38225.6 42075.9 80301.5 7709.0 7674.5 15383.4 52.4 8.7D. ON-FARM WORKS 56857.8 22383.6 79241.4 10191.5 3988.8 15180.3 28.2 8.6E. LAND IMPROVEMENT 35871.2 13108.8 48980.1 7050.3 2332.9 9383.2 26.8 5.3F. UTILITIES 477.0 1582.6 2059.6 98.6 295.9 394.6 76.8 0.2G. MACHINERY 6 EQUIP. 10076.6 100328.5 110405.2 2077.9 19072.5 21150.4 90.9 12.0H. VEHICLES 0.0 9383.7 9383.7 0.0 1797.6 1797.6 100.0 1.0I. PRODN/PLANTING MATERIALS 12970.0 142356.7 155326.7 2484.7 27271.4 29756.1 91.6 16.8J. TRAINING 11461.2 1524.0 12985.2 2195.6 291.9 2487.6 11.7 1.4K. RESEARCH 5254.0 5257.6 10511.6 1056.3 957.4 2013.7 50.0 1.1L. TECH. ASST. 0.0 718.9 718.9 0.0 137.7 137.7 100.0 0.1M. DESIGN, ENGR, SUPERVISM. 2605.0 0.0 2605.0 499.0 0.0 499.0 0.0 0.3N. ADMIN. & MANAGEMENT 8815.0 0.0 8815.0 1688.7 0.0 1668.7 0.0 1.0
Total BASELINE COSTS 399247.5 524272.5 923520.0 79250.2 97669.4 176919.5 55.2 100.0Physical Contingencies 22358.0 26941.4 49299.5 4283.1 5161.2 9444.3 54.6 5.3Price Contingencies 96953.4 123300.1 220253.4 3237.4 10103.4 13340.8 75.7 7.5
........ ........... ................. .............................................. -- - - - - - - -- - - - - - - ------- ------ ------
Total PROJECTS COSTS 518558.9 674514.0 1193072.9 86770.7 112933.9 199704.7 56.6 112.9
Vatues Scaled by 1000.0 - 12/5/1990 14:31 IEU

CRINAIRRIGATED AICICULtUtE IIEIMSIFICATICU PROECT
SImm t Accmnt by Project CCqplfnt
UANSIU 'IFNGIC1AI XIEZUI SIIEICEI tBEfELL CaPLIAD WALITY12116. 1i311. l1l3. 11116. lltt. IWOINEIE AFFOIESTA SEEDS AMtO-TECN AIElO-ftAEAS AIIEA AlA mA ARE VT TlION KVELOPN. EXTENSION lrO I IEIT TtAIRINl RESEAlR
1. IlVESWTT COSTS
A. "LA' A'CUIISIi I/CONWElNS. 10439.2 1102.5 4813.5 1260.0 0.0 0.0 0.0 4050.0 6330.0 2100.0 0.0 0.0B. CIVIL WORKS 74895.7 8167.1 83947.3 28198.3 176132.7 0.0 0.0 0.0 0.0 0.0 0.0 0.0C. UILDINGS 5256.4 438.0 11902.1 1045.8 2902.2 0.0 0.0 24296.1 36430.9 1290.0 6159.9 0.00. ON-FAIN UIS 0.0 4596.5 46202.5 22614.? 0.0 0.0 S827.7 0.0 0.0 0.0 0.0 0.0E. UIID INPICEENEUT 0.0 0.0 0.0 0.0 0.0 48980.1 0.0 0.0 0.0 0.0 ?.0 0.0F. UTILITIES 701.6 54.0 323.8 647.7 332.5 0.0 0.0 0.0 0.0 0.0 0. 0.0G. PACNIREE? S EQUIP. 20069.6 32.1 4215.8 119S.5 8819.S 0.0 0.0 20619.0 S161T.8 2000.0 1350.8 0.0S. VENICLES 294.2 0.0 2S1.0 207.9 1721.9 0.0 0.0 2005.7 4102.8 0.0 0.0 0.0I. PlI/KlAETIS; NATERIALS 0.0 0.0 0.0 0.0 0.0 133504.8 12970.0 0.0 U51.9 0.0 0.0 0.0J. ItAIMIUG 0.0 0.0 0.0 0.0 0.0 0.0 0.0 0.0 0.0 0.0 12985.2 0.0C. RESEARCN 0.0 0.0 0.0 0.0 0.0 0.0 0.0 0.0 0.0 1289.7 0.0 9221.9L. TECN. ASST. 0.0 0.0 0.0 0.0 0.0 0.0 0.0 0.0 0.0 0.0 0.0 0.0 -N. DEtlUI, ENS, PERVISN. 450.0 80.0 S00.0 275.0 1300.0 0.0 0.0 0.0 0.0 0.0 0.0 0.0 a,M. ADNIN. & NANGEIEIT 450.0 80.0 S00.0 250.0 1250.0 400.0 175.0 500.0 1200.0 3760.0 250.0 0.0
, ...................................... I...................................................................................
Total BASELINE COOS 112SS6.8 14530.1 142736.1 564.9 192408.8 184.9 18972.7 S2270.9 108533.4 10939.8 21230.9 9221.9Physicai Continctes 5627.8 957.3 946.9 95f3.0 9536.8 914.2 948.6 2613.5 5426.7 S47.0 1061.S 0.0Price Continmiles 27856.8 3907.2 35500.6 1478.4 46327.4 46S5.9 S675.5 6174.6 20937.9 273.7 5238.8 2404.4
.Jtal POECT COSTS 146041.4 19414.7 187683.6 75181.2 248323.0 23S594.1 2SS96.8 63061.0 134890.0 14210.5 27531.2 11626.2
Taxes 0.0 0.0 0.0 0.0 0.0 0.0 0.0 113.5 0.0 0.0 0.0 0.0Foreion Exchown 75141.2 7043.3 77209.6 33071.3 13054S.1 190936.5 1703.2 41727.8 99416.8 174T.8 6154.8 6105.5
....................................................................................................................................................................
Vlues Scaled by 1000.0 1215J1.90 14:29
Ii
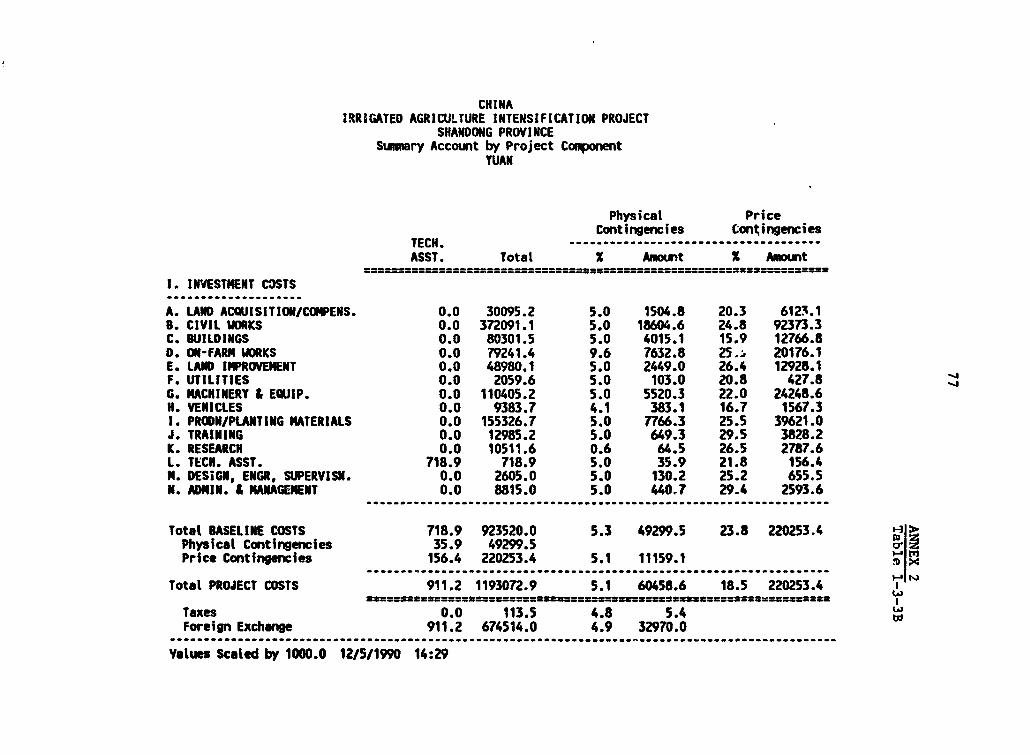
CHINAIRRIGATED AGRICULTURE INTENSIFICATION PROJECT
SHANDONG PROVINCESummary Account by Project Component
YUAN
Physical PriceContingencies Contingencies
TECH. .....................................ASST. Total % Amount X Amount
I. INVESTMENT COSTS......... .................. ..
A. LAND ACQUISITION/COMPENS. 0.0 30095.2 5.0 1504.8 20.3 6123.1B. CIVIL VORKS 0.0 372091.1 5.0 18604.6 24.8 92373.3C. BUILDINGS 0.0 80301.5 5.0 4015.1 15.9 12766.8D. OW-FARM WORKS 0.0 79241.4 9.6 7632.8 25., 20176.1E. LAND IMPROVEMENT 0.0 48980.1 5.0 2449.0 26.4 12928.1F. UTILITIES 0.0 2059.6 5.0 103.0 20.8 427.8G. MACHINERY & EQUIP. 0.0 110405.2 5.0 5520.3 22.0 24248.6H. VEHICLES 0.0 9383.7 4.1 383.1 16.7 1567.31. PRODN/PLANTING MATERIALS 0.0 155326.7 5.0 7766.3 25.5 39621.0J. TRAINING 0.0 12985.2 5.0 649.3 29.5 3828.2K. RESEARCH 0.0 10511.6 0.6 64.5 26.5 2787.6L. TECH. ASST. 718.9 718.9 5.0 35.9 21.8 156.4M. DESiGN, ENGR, SUPERVISN. 0.0 2605.0 5.0 130.2 25.2 655.5N. ADMIN. & MANAGEMENT 0.0 8815.0 5.0 440.7 29.4 2593.6
Total BASELINE COSTS 718.9 923520.0 5.3 49299.5 23.8 220253.4 KPhysical Contingencies 35.9 49299.5Price Contingencies 156.4 220253.4 5.1 11159.1 n x
.... ....... . " .......................... ...................................................................
Total PROJECT COSTS 911.2 1193072.9 5.1 60458.6 18.5 220253.4
Taxes 0.0 113.5 4.8 5.4Foreign Exchange 911.2 674514.0 4.9 32970.0
... ............. .................................. ...... .............. ............................ Values Scaled by 1000.0 12/5/1990 14:29

CHINAIRRIGATED AGRICULTURE INTENSIFICATIOIN PROJECT
SHANDONG PROVINCEProjtcts Components br Year
Totals Inctuding Contingencies Toteal Inctuding CantInmnciesVUAN Lil
.......... ................. ................................................ ............................................................................................................. ........................ ...............
91/92 92/93 93/94 94/95 95/96 Total 91/92 92n93 93/94 94/5 95f96 Total
A. 13G16. A DRAINAGE1. VANSIIWJ IRRIC. AREAS 25239.6 4598.5 42973.4 22820.2 9023.8 146041.4 446.6 7734.5 7035.0 3686.0 1438.1 24356.22. CHEOGrAl IRRIC. AREA 2699.4 5651.7 4989.8 4021.4 2052.4 19414.7 47.5 950.6 816.9 649.6 327.1 3221.63. XIEZNAI IRRI. AREA 34093.1 6476.7 46470.7 26803.2 15549.9 187683.6 6030.6 10693.6 7607.5 4329.4 2476.2 31339.34. SHENGLI IRRIC. AREA 11265.4 23962.7 19189.4 13893.4 6870.2 75161.2 1992.7 4030.5 3141.4 2244.1 1094.9 12503.65. TUSEWELL IRRI. AREA 59617.4 66715.9 64022.3 33416.0 24551.4 248323.0 10545.6 11221.4 104O8.9 539r.5 3912.8 41558.2
...... .... ....... .......................................................................... ..... .......... ................... ...... .......... ................
Stb-Tata 132914.7 207081.5 177645.8 100954.2 58047.6 676643.9 23511.0 34830.5 29061.7 16306.6 9251.1 112961.0
O. ACRI. INIENSIF. * SERVICE1. CROPLAND IPROEIMT 11341.3 100252.0 105353.9 14U5.6 6761.2 238594.1 2006.1 16862.1 17247.1 2404.4 1077.5 39597.32. AFFORESTATION 3429.6 4120.5 5631.3 4748.3 7667.2 25596.8 606.7 693.1 921.9 767.0 1221.9 4210.S3. SMLITT SEEDS OEWtLOP. 38517.9 15426.1 8584.4 384.6 148.0 63061.0 6813.3 2594.6 1405.3 62.1 23.6 10899.04. AGRO-TECN EXTENSISo 55865.0 39223.7 27499.2 11138.9 1171.2 134898.0 9881.8 6597.3 4501.8 1799.2 186.7 22966.85. AG0o-ErVIROaHIENT 3372.2 3140.0 3749.5 2261.S 1687.3 14210.5 596.5 528.1 613.8 365.3 268.9 2372.6
.......... ................................. .......................................................................... ------------.......................... - A
Stb-Tetat iizszfi.o I ;,l 6.3112526.0 162162.3 150618 .3.3 33418.8 17435.0 476360.4 19904.5 27275.3 24669.9 5398.0 27m7.6 80046.2 0
C. INST. DEV. & SUSNOT1. TUINIHC 5916.3 S8.5 5007.6 3761.4 3936.4 27531.2 1046.5 1495.2 619.8 610.3 627.3 4599.62. RESEARCH 1625.3 2719.4 2894.6 3039.3 1347.7 11626.2 267.5 457.4 473.9 490.9 214.8 1924.43. TECH. ASST. 192.0 418.5 222.7 77.9 0.0 911.2 34.0 70.4 36.5 12.6 0.0 153.4
Sth-Totea 73.e 12027.3 8124.9 6896.6 5284.1 40068.6 1366.0 2023.0 1330.1 1114.3 U42.1 6677.5
................................................................... .........................................................................................................................................
Total PIOJECTS COSTS 253174.4 361271.1 336589.6 141271.6 80766.8 1193072.9 44763.5 64128.6 55101.7 22816.9 2871.8 199704.7
.................... ................................................. .... ...... .. ._ ........................ .........................................................................................................
V.lu1 Scaled by 1000.0 12/5/1990 14,32
.4
I-.w

CHD" 79Vt' ATW A01110AMAK LIff"IMAISON PVOJWr
----------- ANNEX 2Table 2-1
10"W.'amen,%- - ------------- - - --
it" U.; t U., t IM L19 tLCO :Oth.,* �a sTot. I t
t (VO00) (Y'000) CY'OOO) I(V 1000)t t(01 Cmn4%,vcti0.! I I I Ictees t" ISODO! 1.04 275W.0 0.00 0:0 0-0 27"O.0.aent "A 220= g 0 0 4,510 0 0 0
'r; as, I &S= O:, I "51-0.0.3 o 90 a3:,.o 0:0 O.Q 0:0 14US.,
PR lh� 220 S. 73 L2 5.0 0 0 0.0 0:0 121111.0PVC ... 2" S.75 12:a.0 0:0 0.0 0 0 Ul.-O
ll.b-total C.) t 649,115.0 0.0 A41510.0 0.0I930S.0t
P104.0t;en: I 11 I'ILP F.,%;! ;as, %ow,t 41000t 1.38 $2100.0 0.0 0.0t 0.0 62100.0Age*-chaoicals, t" 315i 43.70 L37".3 0.0 0.0 0.0 W". 3
TM3.3 o-o O.O 0.0 73"S.S
Total CZ) 1:70M.5 O.O "10.0 0.0I16"40.9
__!tg1.6 WWFt
(ml C4-.tftc%;sft and U"! Iweefoor 20 .3/he no I 3ts.00 0:0 315 0 0.0 315:00
U.9 eash!.. 0:0, 00 220 0 0.0 210es' to 21 CO o-0. -2 2615 0 0 1102t a 40 0 0 0.0 ':O 671.T.b-. I I e I ... i.s sachi. . S S71..2 . .2
Lma-v,-ow,. Piv. yatee smastp. owl* s.% t 001 0.42 0.0 0.0 37.8 0.0 87.8I t I
sub-total (0) I a 3 0.0I 0.0 2236.S 0.0 um.111
(b) IW.Iomaet- -------- - t
tfie.. 00 no t 1494t 2.80 3430.2 0.0 0.0 0.0t 3430.2
041-4 fie.. 6*4 he:I 800t 3.43 M5.0 0.0 0.0 0.0 1?2S.OA.i me.t 1111411t S.16 3032.4s 0.0 0.0 0.0 3032.4.. 1:11 M OM.t 0 27:31 218.11 9.0 0.0 0.0 210.3C�%,;fv go. 3- a 60 die f-D SM 075 T144.& 0.0 0.0I 0.0 71". I24-0111. pwwo. twb�;lq W9 0.90 015.4 0.0 0.0I 0.0t 013.6
-0 it" t &.04 LIWS 0 O:," ' : o'"::: "' , "A, I 0 0 im'ba. 10-22 IN "a " " :O o.0 U-40 kw me toll 4 1 793 .0 0.0 763.0IftemIs. 30 :Go o O.*
95 k 192 4 67 LOW 0 H, 00in kw 110 14:93 368:7 HO ti 0 0S"
Hot*,*. ISO-2110 kw Om 1 242 0.0 9.0t :0IDie" I Si.". 12 hp 71`73: "I: 7631 =65,1140:03 0:00 O.* O.. InOL04.5t0;4-1 0001000. 6 kp I NW t 2.04t 3105 .0 0.0I 0.0 0.0 3105.0
S.b-botal (1) I 9 O.* 0.0 0.0 V133.9
T,vnAa,=an vabolo bw I 700S 38.40i WHO.0t 0.0I 0.0I 0.0t 011410.0jT".0foFoope SO-SO kV,% no.a 112t CIsa SSU. II 0.0t 0.0I 0.0I SM.1ITro.ofe,oo,.: 10-160 bVA 00.I 101 12. Ui 1M.S 0.0 0.0I 0.0 M.STe"efeforro, 200 kVA no 74i If 94 I='r feesse,g, dw kVA U 21 ' : ,19"s, 00:; ay: :5 0:00 O S 00 216TI"Sfor"la: JOOD_jvw ilvA 0M.I go. to 2.61.S 0.0 0:0 0.0 241-S
Swb-tesel (11) I =M .1 0.0 0.0 0.0 2=524
Off;a. wJ Laboratory, wtv.
office 0";P, S.Fe C..= 20 112.00 0.0 sea.* I 0.0I 0 C 690.0Typea'i 14's S 100t 6.74t 0.0 $73.0 0.0I 0.0 $73.0
ch I 00: 43.70t 0.0 1M.0 0.0I 0.0 3,311.0gn, .1n:X., no.I 11 2r. 50 0.0 297.8 0.0I 0.0 297.5AOLI i lLeborar; t t
not 9 217Sv 0.841 0.0t 0.0I 0.0IOM .8 2002.0fish 0 0:01 121:1S." 2 92 L2110 im 2'resi.;ASr a lo. me.I SM I 1.69I 0.0I 0.0I 0.00 t1111,011.411 64096.6
O.* M3.8 O.* IO-1s.2 t tun-7,
(I.) �del S"do 11,64spat"S vAgh/lkulot
Se-d seed;.* 04m;p. seft de Lt.$* 0.0 0.0 02.0 0.0 M.0Good &.Y;.o ows"P. 00 0so 2.80 0 0 0:0 0,9.04 4,;8weent oftip, z 10 0-74 O: :00 49 0 0gocrwamm eels. 6.2,1 24110 &A11I 0.0I 0.0 2m .0 2m .0
I.b.botal I ':'0.11 0.0 43U.9 I 0.01 -312
'e"'l- 20 "P 134I C1.901 4221.0 0.0 0.00 I 0.0 42n.0fte... 12 2in 4 8.46 010 0.0 337n. 1 0.0 U72 AAsel. me4ki.ery sumake"twal 9 I
S ''2's U' 0': 'O ':3 H,':Free,/ *be sters, soll, 41" ofC, 10.814,213004 #Filters 00. 4143 0 aI 4L63 fs"'I'll,, O:" 0:00 422111:6, : :Poddy/Whost ho-.8tolo O InCombine ko"oawwa, Golf-p-wollod Z I 00 1 J.13181 O.-O 101.9 no .3I U11:.:Thresh Pa -,W 1 2317I 1.21I 0.0a O'O12797.6 1 0.0t 2747.8Iftall, =vdiors, no.1 2m 1 &.01I 0.0I 0.0I2496.4 1 0.01 2496.46(.8902ch opmyoft -Plabeelf.d sprayers Ua S M": 9, O,:00 82'"': 9,
aft.0 ca sm-.& 0.0 Sosw$
16b-S."I (b) 284141.3 $9,37.0 LO-16.2 t&V-2. 1-I
M77.0 2863.3 11173.5 1041S.1 UT09.1
TOTAL DAIG CW (I 11) WOOD) 19331117 -8 2083.8 W011111.2 10494 07319.7
-3,27AME tw,OOO 4126.0, Us. I inn. 3 &915.2 SW2.t.......... .1_ ....... I....... . . I......... ...... . ..

MiSIMMST 80 ALNNEX 2
TabL* 17ACuLnom octeumet, m4w-
....................
1.64 VON.*LSOCOc kma�t 250ow 1 0.22 0.0t 0.0 SS&2S.O- 0.0 SSL=.*
as 220001 O." 217111111.0t 0.0 0.0 0.0 21?54. a
0.0 "123.0 0.0 104AW. 0
W. 37101 0 71 2114S. I 0.0 0.0t O.*t 264111.1
gee to" 31W 1: 19 4LSm.O 0.0 0.0t 0.0 41,5111.0
U,04 MR 44d0O 0:81 39767:0 0 0 0 Sq7�?._S, 1, 0 411:0 0:0
to- 122 2 1 0 0 8 411.
-;"I* %*. 1,33 to. 9- 3511141.0 0.0 0.0 0.0 SSSI 0
=11.sh,fam. to.t 301 0. gs 0.0 0.0 21.4 0.0 29.4
Swb-totai Cb) so .1 O-o .O. I 0.0 sofa*. 3
Totel ct) t o-a US45. 1- O.* M1,32.3
tt. 1'e;fpstid" Machine.,
0,..d Canal SwicawPwol-I sess-161b 1179%.3-t.o3dis. 30 dm 2 344t-OO YM-0t 0.0 0.0 0.0 TM.O
V-P-41901 I0 .1, a dig. 20 ons 0. Is- 7 W&L.00 20147.0 0.0 0.0 0.0 24"? 9
v "1; I .;.*di t.4 a die. Lo 4"s2 St W111.30 6m.S 0.0 0.0 0.0 sm.2
30,;s $04 0
so/to US& $04.0
273,20 C': M, :0 0:0 V3.0
20/5 tons II 23L:OO 0.0I 0.0 z3t.0 0.0 231.0
pa�vsaqks wid 10 29.40 0.0 0.0 294.0 0.0 294.0
3 290. SS 0.0 0.0- 841.1. 0.0 BA1.1,
to olublems, %b owot t 3370.00 0.0 0.0 SS70.0 0.0 31170 0
armses, "O: 4 0 0 2100:00
A.g I.,y 525:00 3:00 11.1 L37S
be 3, LM 00 15711.0 0 0
MRSL.st 0.0 4M. L 0.0 90339. S
(b) 1"; Wom";.od
2tl- is 1O.LS O.* 0.0 0". 2 0.0 944-3
La.4-to. On 3." 0.0 0.0 33ar. 6 0.0 33a?.g
V.,% 2042 LAS 0.0 0.0 339.3 0.02 334.3
i311 AS20 1:01 2M:3 O.. :3 201IS: 3
342 72 0 2M 2 a 22" 2
fte.9 4.01, 0.0 0.0 443.4i 0.0 4.3.4
coa Sri fu I PM-as; I3.46 0.0 0.0 lq2.49 o,o 1,n.9
yle:b =1 ::IC' I": 11 0:101 IW: 63
$1 S Lo 73 0 0. 0 70:3 0 0:0 39.3
Lo 0:0s.b IS S, 0 S
0 0 At
oeftet fte. do 3.28 0.0 0.0 LN.2I 0.0 UIC.2
&W-260 igw 7
LBO kw no: 01:1 1: 21 ::1 ::O :1 0:001 43 .OL30. " S 42 "I a a a , "t 2
?111-tof) kw ry 6. SIPt Ilm.$I 0.0 0.0I 0.0 41110. Sso M kw Us SJ11 t 124S.01 0.0 0.0 0.0 t242.0
0:4 kw fte.S Lin t 3.411 t 4232.3 0.0 0.0 0.0 4232.5
7.6- to tgw me. 'I S 2.26 Is "7.9 0.0 0.0 0.0 40r.:
Saco, ces.." lice swoot 0.
L2 ho29 h 3 U H 00: C -(O'so h: LOS to. 0 0. Lo
3. v.= au 9 0.0 0.0 0.0 2111:09t t 0
Suk-telfal (b) a IM.0t 12=1.11I O.*t
'rotat C. b) 495".s I, rtut.tCs) W.6%,i4al fllmmlo-MR.
4". No S?. 'O sm.0 0.0 0.0I 0.040111 4 $3.19 212.41 0.0I 0.0I 0.0t 11272:10,
at"VA an, . TOO.* I, O.*f 0.0 I, 0.0 Mo.*
,VA ": U, WO N "I .:
to0OC, b" Z US 00 345 0 0 S"
Om WA . 0. .0 :S4400: 9. '12 M SS U, C.: :.O
ON-LOCO %VA au S". S
gaft S" -A ad.t 21 Q. L3 t 06.3i 0.0t 0.0 I, 4.01 44.3i
240:400 INVA fte.I 01 st.14 1 240.51 0.0I 0.0t 0.01 240.2t
100-1100 fi.VA30-00 %VA, 9"" .1 10401, 12"0: 10, Uo, OL40:11 1.T. S.-tah a 0,
0.0I 0.0IaLiouO #.v 13.9.011 1111110.* 0.0 on 04
r toolstoo tot U Ull, 0 0.0 0.0I 0.0I LLS.Of que,00% 9,
;.;me",VISO lkv 3 34:80 . tG3.S 0.0 O.C, 0.0 103.4
tommemse'. tio %v 3 34-80 a W.$- 0.0 0. tj 0.0 L03.9
immi'lests, 9 be&8 32 11.20 1 34.S 0.0I O,* MOI 34k 5I4.t,s I 40 =.O* 411104Se as - C., .OL .06 010 0.0 on
aso., .III a , on O
S.b-tetal (a) tsm.tf O.* et-3.2 O".0 tean. 3
Get. (jrU44............. LOS 00 0 a tos a
Ha U tos.0
�:to S11 9 of 0 "Ji. S 0.0 4Q. S
2I tgu 1.26 0.0 0.0 2040,'L 0.0 IM. t
O S - I I to.. au 0 30 0.0 0.9 017.5 0 0 $??.S
0 0 0 0 3204 1 0 0 31.94 L
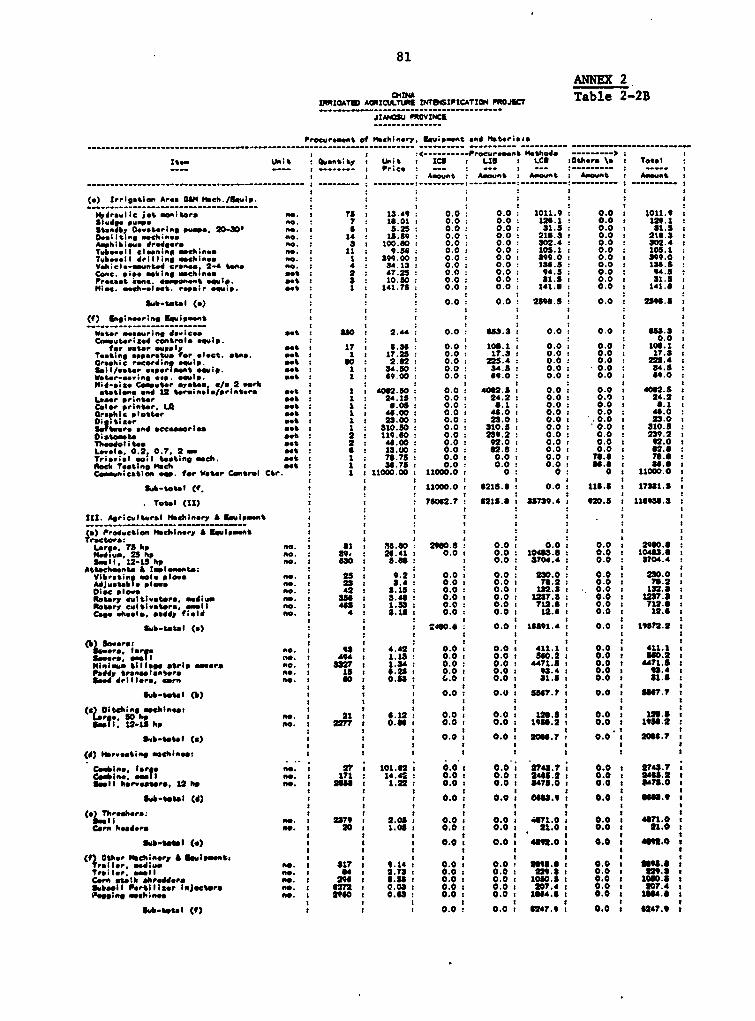
81
ANNEX 2.
I~10A7E A~cL1M ~ItAl4~JTable 2-2B
P'rocur*~%n of MacNinarY. Uqipaent andi lsta.040d
It.. ~~~~~~UR; 0sent;"ty 2 wi.t iIC11 Ls U Ls :at.aro \a i Tots2- - .--- F2 P.co - -- -
I~~~~~ AanZ Ant t :6 Asaunt A.nt' AZ;.
(a) Irrigatiw.n Area 0OL4 Mmeh./Equip. 222.2
i 1r~i 7iS6: no~ A. 2 78 13.49 : 0.0 0.0 1011.9 2 0.0 I 1011.9 Stude noeA. 7 to.01 2 0.0 : 0.0 : 126.1 00: 1261
Standby ceetarig pue. 2-30' ~ .6 3.23 0 .0 : 0.0 3 1.5 0. 2 1.Occilting machin., no. : 1 * 1.59 0 .0 : 0.0 2 216 .3 0.0 216 .32Amphibiewo drodg.ra no. 3 2 100.60 00 0.0 2 302.4 2 0.0 2 302.42Twbe..aI cleaning machines no. 2 1 9.56 0.0:0 0.0 105.1 2 0.0 2 105.1Tybo.oll drilling aiiabinea no. 2 I 390.00 : 0.0 ; 0.0 309.0 0.0 2 890.0
Vehicle-meunted Crensa 24 ton. no. 2 z 34.13 2 0.0 0.0z 2 laS 0.0 136.5Coen. vice SOk1iAS ushinca mot 2 2 47.25 0.0: 0.0: 04.5: 0.0 94.8Precoot icong. ee.mnct equip. set : 3 10.50 : 0.0 2 0.0 2 1.5 0.0 O 31.5 Nie. neak-elect. race,rcu,.86 141.75 0.0 2 0.0 141.6 0.0 141.6
Sub-total (e) . 0.0 : 0.02 2864.5 0.0 2 2806.5
(f) OngiAgerine Rou;p.ent 2 2 2 22 2O
Waesr .caeuring do.ioea 566me 2 80 2.44 0.0 : 653.3 2 0.0 2 0.0 2 6:8.CnaPUteri84d controls eqip22 22 0. 2
for ester supply *.t 2 17 3 6.36 0.0 2 106.1 0.0 2 0.0 106.12Testing apparatus for .l.ct. *ta&. st O2 12 17.25 0.0 2 17.3 0.0 2 0.0 2 17.3Orashi re4ordiAg equp.se 2 0 2 2.62 0.0 225.4 : 0.0 0.0 225.42soil/ester expe.l en eqfui 8t2 12 34.50 0.0 2 34.5 0.0 0.0 2 34.5 Water-**.;O%* *.p, movie. sot 1 9.00 0.0 2 9.0 2 0.0 2 0.0 2 0.0216d-oizo CepUtr eyetes eIe 2 ork 2 O satethns and 12 toroiASfe/P,1E2tSrw St 1 2 06.50 2 0.0 i4062.5 0.0 2 0.0 2 406.5 L5842 printer 84t I 24.15 2 0.0 2 24.2 0.0 0.0 24.2Cole*rprlnt.r.LA "t I 2 .06 0.0: 6.12 0.02 0.0 2 .12Graphic plotAter as 1 : 446.00 2 0.0 2 48.0 2 0.0 2 0.0 2 46.0Ol gtler setA 2 I 28.00: 0.02 28.02 0.0: I .0.0 2 28.02OSoftwareO end ccceeariea set O I 3 10.50 0.0 3280.5 2 0.0 2 0.0 2 310.5 o..teomto 0.4 22 119.60: 0.0: 259.2: 0.02 0.02 289.22Theodol itee ac 2 46.00: 0.0: 92.0: 0.02 0.02 92.02Locela. 0.2, 0.7.2 t2 6 2 13.100 0.0: 62.6 0.0: 0.02 626 Triani,il gowl teatin. -Ci,. aet 1 : 76.75 0.0 2 0.0 2 0.0 2 76.6 76.6Pock TootInge Mech not : 12 36.75 2 0.0 2 0.0 2 0.0 2 8.6 2 8.6 Commnication eqp. for lEster Control Ctr. 2 1211000.00 211000.0 2 0 2 0 : 0 211000.0
Sub-totol Cf. 11000.0 O 6215.6 0.0 2 115.5 217381.5 2
Total (11) 2 2766.7 26215.6 2 3573.4 2 00.5 11619361.32
U?1. Agricultural Neehbinary A £euipsn "%22 22O
4a) Production Machinery A Ecuipmant2222222Tractors: .22 . 222
Larg.. 75 hp, no. O 1el PA6. 0 2100.6 2 0.0 : 0.0 : 0.0 2 2960.6 Medium. 25hp no. 2 89 26.41: 0.0: 0.02 10463.6: 0.0 210463.62Sma l. 12-LS hp no 30 2 B."6 2 0.02 8704.4: 0.0 2 70.42
Attachaents a rapl.gente: 222222Vibratjing male plows no.. 25 t 9.2 0.0: 0.0 280.02 0.0 2 20.0AdJustable Place A.. 2 23 : .4: 0.02 0.0 76.2: 0.0 76.2aOleC pI*-e no. 2 42: 8.15: 0.0: 0.0O 132.3: 0.02t 132.83:Rotery cultivators. madiumi A.. 2 358 O 3.46 2 0.0 2 0.0i 2 1237. 0.0 2 125.8 2
Platary cultivators. asall no. : 465 2 1.53 0.0 : 0.0 71,2.6 2 0.0 2 712.0 OCage wheel.. paddy fieldi no. 2 4 I 8.18 0.0 s 0.0 2 12.6 2 0.0 s 12.62
Sub-total (a) .2,460.0 0.0 216591.4 2 0.0 219872.22
owers. for ono.: O 8: 4.422 0.02 0.02 411.12 .2 411Sewers. noI2 94: .3 0.0: 0.0 560.2: 0.0 660.2:Mini... tillegc strip amore AO. 2 SW7 1.34 2 0.0 2 0.0 2 471.3 O 0.0 2 4A71.Icaddy transplantrer A. so1 I 6.232 0.0:I 0.0 2 3.4 t 0.0 2 98.4 ISeed drillers. corn no.: 600 0.83: 0.0 I 0.0t 2 1.5 2 0.0 I 81.5 I
Sub-tetal (b) * .02 0.O) 556.?: 0.02 5667.
(a) 01itc;n ahings ee:oo O I I 2 soge hp1, no. 2 212t 6.12: 0.0:S 0,0O 126.8:1 0.0:I 126.5:z
S.'VI. 12-13 hp no. 2 2277 0.66 0.0 I 0.0 2: 1986. 2 0t .0 2: 1956.2
SgWb-tetel Ci) I0.0: 0.0: 2M6.7i 0.03I 20661.7:
(d Breecting aahigl,qer
Casting. laI no. t 2? ; 101.62;1 0.0:I 0.0: 2748.7:i 0.02t 2748.7 Combine: bas .. I 1,1: 16.42 I 0.0:I 0.0: 24461.2 2 0.0:2 2468.2tSmall hervaateae 12 hp 2. 66 2 1.22 2 0.0 I 0.0i 2 475.0 v 0.0 2 6478.0 I
Sub-total (d) O I 0.0:O 0.0: "66. 9 0.02 66.92
C Th.aare; 2 2 21 2 22gaail A.~~~~~~~~~~~00. O 287921 2.08:1 0.02I 0.0S 4871.02I 0.021 4671.02
Corn .eed.re n0.21 20:a 1.06:t 0.0:I 0.0: 21.0:t 0.0 : 21.02I
Sub-ftbata(O) 22 2 .0 0.0: 460.0 0.02 469.0
C121.P. ediu Po. 8 17 2 9.1421 0.02I 0.0' 9111411IS 0.0 6695.6 Traifar. asamll no. 2 64 2 2.732i 0.0 2 0.0a2 229.8 O 0.0 , 529.6 ICorn afteik shredders me. 2 296 2 6.88 I 0.0 I 0.0 2 1080.81 2 0.0 a 1060.5 2subsoil pertiliger Injector. no. 2 627 I 0.08 2 0.0 I 0.0 2 207.4 2 0.0 6 07.4 P"O.ingeechh.oe o 29640 2 0."3 0.02t 0.0: 16S4.6: 0.0 2 1664.06
Sub-t.tal (f) 2 2 2 ~~~~~~~~~~~~~0.0 2 0.0 2 6247.9 2 0.0 2 64.

82
TRR,CATD A 04CUL NE 1?4T9GSi!CAITZ PR0JEC ANNEX 2J1Al:su -vI--Sc Table 2-2C
Procurmnt of Machi'e.y Euvipmnt *nd Materials
---------- Procurement Method … --------- >rte- Unit Quant;ty Unit iCe LIS LCS Others \a Total
---- --------- : Pric _ _-- __- -- -Amount Amount Amou^t: Amount: Amunt
_______------------------------ -- -- ----- ----- - -- --- ----- ------- ------
(e) Age -mechanization & Sorricea Equipment:Seocialized woeica/reasir *ovio. \b 'um 1 1575.00 0.0 0 0 0.0 1575.0 1S750O-rdinry av.icelrfofir 0iu;a \b 1u I 9450.00 0 0 0 0 0 0 9450.0 9450 0Agri machinery toetiflg *cuig b u I 1312.50 0 0 0 0 0.0 1312.5 1312 5Agri. machinery testing apparatus \b aMa 1 703.50 : 00 00 0 .0 703.5 7035STraining equio. \b set I 630.00 0 0 0 0 0.0 630.0 630 0Soars parts aUm 1 6352.50 0 0 0 0 0.0 86352.5 6352 5
S.b-total (g) 00 00 0.0 20023. 20023 5
(h) Seeds Oclepoeent Equipment:S*ed rocwsina/gradins equiYp set 211 8 .62 0 0 0 0 1818.9 0.0 s 1610Seed drying equip.e.t set 3 210.00 0 0 0 0 630.0 0.0 630 0Seed tat.in? equipment t S1S 2.02 0 0 0.0 1038.2 0.0 1016 2Soil tnolyse *equip. aet : 133 7.77 0.0 0.0 1033.4 0.0 : uS3.4Fe-t.liser *nalysis equp. get 31 35.87 0 0 0.0 1111.9 0.0 lIL3.9Fertilizer commounding Machines set 2 393.75 0.0 0.0 787. 0.0 767.5Plant analysis equip, *t 1to 18.69 0 0 0.0 299.0 0.0 299 0Plant quarantine eaup. set 30 8 .28 0 0 0.0 248.5 0.0 248 5Agro-chemical teating equip, st. 22 16.3 4 0 0 0.0 403.6 0.0 403 6Agri. mach. eer.icing equip (epecial) met 349 7.40 0.0 0.0 2583.5 0 0 256335Agr;. mach. a eriCing equip (ordinary) *-t 333 5.SI 00 0.0 163S. 0.0 1835.7AC,. *sch checking/testing equip, aet 118 6.0 0.0 0.0 602.9 0.0 602.9Soare part set .I 614.25 0.0 0.0 614. 0.0 614 3Fertilizer formulation equip. set 5 354.90 0.0 0.0 1774.5 0.0 t774 5Seed conreymrs set 24 7.21 0 0 0.0 173.1 0.0 133 1Packin/bagging mechiee set a 29.61 0 0 0.0 236.9 0.0 236.9Package/bgeg sealing machineo get 6 4.20: 00 0.0 : 25.2 0.0 25 2Air .*esmel got 5 : 1.05: 0.0 00: 5.3: 0.0 : 5.3Other miC. msch ./equip se-t 313 1.94 0.0 0.0 .C 608.0 608.0
Sub-total (h) 0.0 0.0 15422.3 608.0 16030.3
Total (111) 2960.8 0.0 9491.9 20631.5 83104.2
Iv. Off;co end Laboratory equip.
.f ice equipment:Micro-commuters no. 22 23.00: 00 06.0 0.0 0.0 S 06.0Cosying each-no no. 3 43.70 0.0 l31.1 0.0 0.0 131.1wordopoce.sors no. 2 23.00 0 0 48.0 0.0 0.0 48.0
Audio-ni4ual training equI.: Exteion/beeds de.elooment \b -s 1 787.50 0 0 0.0 0.0 7687.5 767.Agri. echanization Xb su 1 105.00 0 0 0.0 0.0 1OS.0 105.0 Water cone.rrancy \b dum 0 0.00 0.0 0.0 0.0 0.0 0.0
WNF Communication equip:CraF d Canal Pumvinq stations got 6 5750 S 00 4S0.0 0.0 0.0 460.0Irrigation area. got 73 3.80 0 0 277.: 0.0: 0.0 277.0
Total (IV) 0.0 1420.1 0.0 692.5 232.6
TOTAL eASE COST (r - IV) (Y 000) 178610.6 7635.90 150796.4 224445 S 359487.4
6 Y5.22/VSS USS OOO 34216.6 1452.6 2888 .2 4299.7 : 68867.3\: :t e i e lo I : : : :
\e: Include ahooeing on bami of *t least three bid quoctatone end direCt yurchase\b: Oet.ailed equipmet l;t and eatimated coete in project file

83FILE!SHeNmLST
CHINAIRRI0ATM A(RICULJ.tl.R INTE85IFICATION PRJE' ANNEX 2
ItCE ~~~Table 2-3A-------------- C-
Procurement of Machinery, Equipment end Materials
* (~~~~~~~~~4------Procurement Methodls----->Item Lin ;t Quantity Lk,ni t 1c8 LIB LCS 'Othler, \a Total
* ~~~~~~~ ~~Amount Amount Amount Amount Amount
I. Materials. (Y'ODO) (Y'000): (Y'O00) (Y'000) (Y'000) : (I'000)
(e) Construction:..Steel ton 11624 1.84: 213882: 0.0 0.0: 0.0 :21388.2
Cement ton :247820 0.22 00: 0.0 54644.3: 0.0 S 4644.3
Timber mS 17254 0.92 15873.7 0.0 0.0 : 0.0 : 15873.7
Sub-total (a) 37261.8 0.0 54644.3: 0.0: 91906.2
(b.PFeroutionz* ton 109600 1.27 :139644.0 0.0 0.0 : 0.0 138644.0
Agro-che.icels ton : 230 40.25 :9257.5 : 0.0 0.0 : 0.0 : 9257.5
Sub-total (b): 147901.5 0.0 0.0 0.0 147901.5
Total (I) ... 165163.3 0.0 54644.3: 0.0 239807.7
II. Mmchlnery and Equipment..
(a) Construction and O0Mt~draulic backhoe excavator, 1.6 .3 no. 6 : 98.00: 31588.0 0.0 0.0 0.0: 3588.0Bulldozer. 160 hp no. S 364.55 : 162.8 : 0.0 : 0.0 : 0.0 : 182.8
Oredger:60 .3/hr no. 2 :1460.50 2921.0 0.0 : 0.0 : 0.0 : 2921.020 .3/hr no. 4 241.50 0.0 : 0.0 : 966.0 0.0 : 966.0
Tug Boat.:120 hp no. 1I 138 50 : 0.0 : 0.0 : 136.5 : 0.0 : 136.5
SO hp no. I : 63.00:z 0.0: 0.0: 63.0: 0.0 63.0Self-propelled Scrapers 6-e .3 no. 10 3 64-55 : 3845.5 : 0.0 : 0.0 : 0.0 : 3645.5
Front-end Loaders 1.7 .3 no. 1I 437.00 i 437.0 0.0 0.0: 0.0 437.0
Sub-total (a): : 12414.3 : 0.0: 1165.5 0.0 13379.8
(b) Vehicles: ...
Fork-lifts no. 5 : 23.00 : 0.0 : 0.0 : 115.0 : 0.0 : 115.0
Water r.sources monitoring vehicles n.: S : 68.00 : 315.0 : 0.0 : 0.0 : 0.0 : 315.0
Agricultural monitoring vehicl a no. : 4.0 : 50.0 : 2200.0 : 0.0 : 0.0 : 0.0 : 2200.0
Trucks. S tons no. : 45.0 : 53.0 :2385.0 : 0.0 : 0.0 : 0.0 : 23e5.0Trucks. 2.5 tons no. : 23.0 : 30.0 : 90.0 : 0.0 : 0.0 : 0.0 : 690.0Tamo-cab pickups. 1.5 tone no. : 72.0 32.0 :2304.0 : 0.0 : 0.0 : 0.0 : 2304.0Motor cycles with side cerriags no. : 35.0 : 13.0 : 0.0 : 0.0 : 455.0 : 0.0 : 455.0
Sub-total (b) :: 7894.0 0.0 570.0: 0,0 8464.0
(c) Equipment. ...
( bevol pumping sets, sin. set : 4003 : 1.50 : 5984.5 : 0.0 : 0.0 : 0.0 : 984.5
Venious no. : 190 : 13.68 2622.0 : 0.0 : 0.0 : 0.0 : 2622.0
Sub-total i): :860.6. 0.0 : 0.0 : 0.0 : 8606.5
(ii) Electrical:.....Motors >100 kW no. : 48 : 23.40 :1123.2 : 0.0 : 0.0 : 0.0 : 1123.2Motors, (100 kW no. : 140.0 : 10.5 : 0.0 : 0.0 : 1470.0 : 0.0 : 1470.0
Trs.,formors no. : 73 : 16.10 :1175.3 0.0 : 0.0 : 0.0 : 117b.3
Sub-total (;I): : 2298.5 0.0 1470.0 0.0 8?368.5
(titi) Office and Laboratory equip. ....
Office equipsent:. ...
Micro-computers no. 3 4 : 23.00 : 0.0 : 782.0 : 0.0 0.0 : 782.0
Copying mechinles no. : 2? : 43.70 0.0 : 1186.2 : 0.0 0.0 1186.2Word processor no. : 32 : 28.78 0.0 M 2.0 : 0.0 : 0.0 : 920.0
Facsimile no. : 2 : 17.25 0.0 : 4.8 0.0 : 0.0 : 4.5En ineer Ing equipment:...
=.epter terminal no. : I :262.20 : 0.0 : 282.2 : 0.0 : 0.0 : 262.2
UJPSPower Pack no. 1 69.00: 0.0 69.0: 0.0: 0.0 : 69.0oraphic plotter noc. 1 51.75 : 0.0 51.8 : 0.0 : 0.0 : 1.8Grein size analyser no. 1 105.00 : 0.0 0.0 : 0.0C 105.0 : 10.0Bed load sampler ilo. 2 57.76 0.0 0.0 0.0 : 115.5 : 115.5Liquid sempler no. 2 57.75 0.0 0.0 : 0.0 : 115.5 : 115.5VW set, no. 19 68.00 : 0.0 0.0 : 1197,0 : 0.0 : 1197.0
AgrI, cLaborstory Equipment:Eletronic balance no. 20 5.25 0.0 0.0 : 105.0 : 0.0 : 105.0Inse.:t breeding equip, no. 15 10.50 : 0.0 0.0 : 157.5 0.0 : 157.5Culture chamber no. 18 5.99 0.0 0.0 : 107.7 : 0.0 : 107.7Nitrogen analyser no. 17 13.300 0.0 234.6 : 0.0 : 0.0 : 234.6Seed germination chamber no. 2 4.83 : 0.0 0.0 : 89 3 : 0.0 : 9.5
Trainting Equipment: .
Video camcorder no. 1 210.00 : 0.0 0.0 : 210.0 : 0.0 : 210.0
Projectors no.: "1 : 9.81 0.0: 0.0: 603.4 : 0.0 : 503.4
Othersno 26000 : 032 : 0.0 0.0 0.0 : 190,0 8190.0
Sub-totael (Mi) : 0.0 : 490.8 2369.9 OM852.0 : 14386.1
(iv) Quality Seeda Proctessing Maich/Equip: :
or:in seeds grading mechinem no. 19 21.0 0 .0 0 0.0 399.0 : 0.0 3 99.0Crai seed orceseln lin st : 19 : 45.00: 6855.0: 0.0: 0.0: 0.0 655.0
Cotton del inting mchinesat : S: 0.0: 0. , 24366.0 : 0.0 : 2436.0
Cotton Vrocaessin equip, set : 7 : 7.15 0.0 : 0.0 : 10.1 : 0.0 : 610.1Seeds, treatment Qguip. set : 9 : 78.00 : 0.0 : 0.0 :84M02, 0.0 3 402.0Colttor atrend testnge.quip, set a 26.85 0.0 : 0.0 : 226.6 : 0.0 : 226.3Fire fighting eq ip, fr seed Ctrs. eat I 8 140.70 : 0.0 0.0: 1125. 0.0 1125.
Conrerao gtset : 90 184.0 0.0 : 0.0 I 386.0 00: 16.
Sub-tot-al (iv) : 655.0 : 0.0 :955.5 a 0.0 : 16140.5
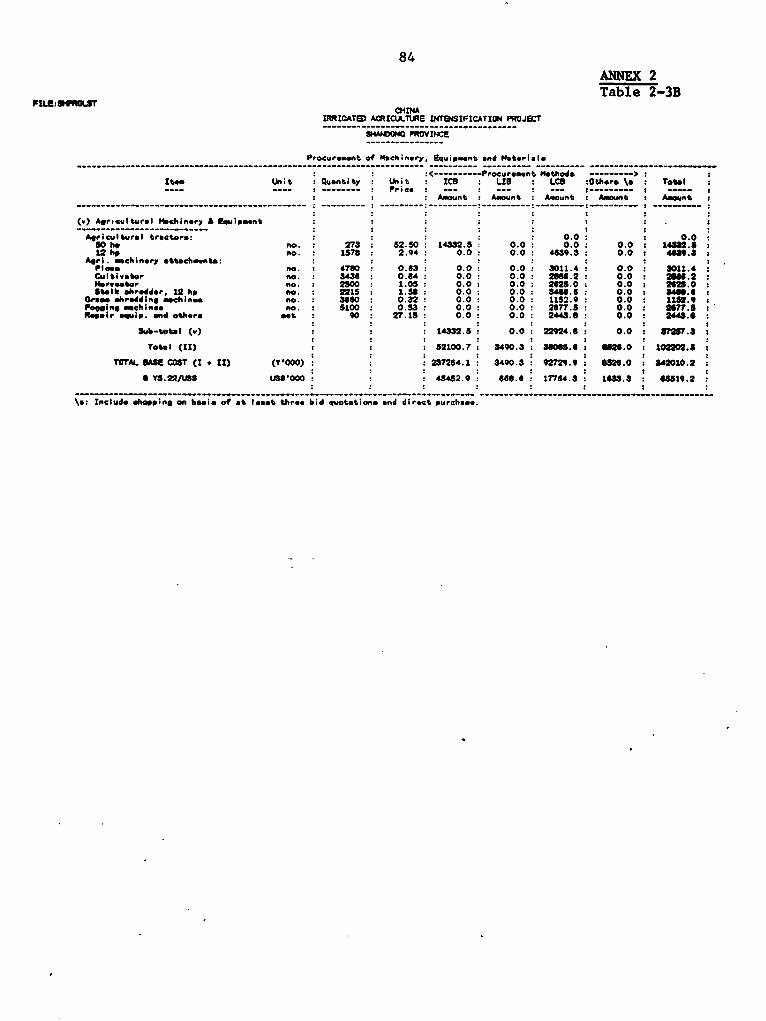
84ANNEX 2Table 2-3B
RME:SPROLSTO4IN
Inl!fTD A°IClA.1tA INT9ESIFICATIO. PRO0JET
Prcwemnt of Maehinery. Equipment and Mat.e;a1____________ -- --- - -__ _ _ ----------------- __- __-_-- _---_._-------_--- ---------- ---------- ---------- ---------- ___ -___-
< ---------Procurement Method- >item Unit Quantity Unit ICB LiU LC8 :0thUer \' : Totl____ --- _ __- I Pri; e_ : ---- :--- - t - s I
: . … .- .Amount Amount Amount Amount Amunt-- -- - -- - --- - -- - -- - - - - -- - -- -- - -- - -- - -- -- - -- - -- -- - -- - -- --------- …
(v) Agr.cultu.al Machinery A &Wuin.nt .
Aericultural tractors: 0 0S0 h no. 273: 52.50: 14332.3: 0.0: 0.0: 0.0: 148t2.512hp no. 1578: 2.944 0.0: 0.0: 4d39.3: 0.0: 483.38
Aeri . mch.ne.y *ttach..nt-.lowv no. i 4780 0.83 : 0.0 0.0: 3011.4 : 0.0: tO11.4
pultivtor no 343 o 0.0.0: 2686.2 0.0: 2U0.2MI. ae no. 2s0 1.05 o 0.0 0.0: 2625.0 0.0 2625.0Stalk ahredder 12 hp no. 2215 1.68 0.0: 0.0: 34"6.6 0.0 6419.6
Cr.. shredding machine. no. 0360 0.32 : 0.0: 0.0 1152.9 0.0 1112.9Fogeing machine no. 5100 0.53 : 0.0: 0.0 2677.5 0.0 2677.5KagIr emuiC. and others met 90 27.15 0.0 0.0 2443.8: 0.0 244t.6
Sub-total (a) 14332.5: 0.0 22924.8 0.0 8727.3:
Total (II) * * . 82100.7 : 3490.3 316068.6: 62.0 . 102202.5
TOrAL IASE CT (I * II) (Y'OOO) * 287264.1 * 3490.3 9272.9 526 .0 : 42010.2
0 YS.22/WS 1 000 O 45452.9 : 66.6: 17764.3: 163. : 319.2
\a: Include alo o,.; on baa of at loast thre bid quotat;on, and direct purchaas.

~~-0100 otrIer2.00geR 5.' .
IT"ept FersiliIer ICS 9.49 -- - = -t9cow
A. First y.&S'5 W LC--5-
(FetSiliser) 25.00 cme 1W 5.84 memo.-
fi Srstd low's 1W
axes" rersilis-. IC 9.09 W V r__
3 . Thirdi yew's ICS J. .C
exe Coa rsX 2 Q .3t "f__4XWm i MlItM, l (r r ills ) le. tolo IQI 4 . _ i g g RL:Cf i_f ll f l f l i -i _4_ H
S. ThIrd yew's IC I0I.FSee ye r's LQC .1_
*SC*" Came" LCR ~2.0I1
2. nigd *w" seb Io cs 3.1. _ iE iA_[e e _ _ ii.- n I 33g1 _6g
asit" cow" um 2.9,..egces..immmlU. umi,..J..m
| ^c ..0c. ,. ftwt la La us =si ft. 1.1u-e
s_____* _-
IP-- .m.P-b 5I 43.01~~~~~~~~~~~~~~~~*.

a0-
~~~~~~~~~~~~~eniETUU~* _SIWMW ~Slt_D MATES IStSPl - Ii __wte
¢;e~~~¢ Feru|11"r ln 5.5 ^_ " tz~~~~~~~~ m- m i it1. Iri fit yea@ |]--T1-___dr _far-- i]tiil + i
1.first year's LCI Y- -~~~~~~~~~ - -~ ~~~~~~~~~~T i -
: il1,r--72? i 10P.
_______|__ _ lCDs__sN _aaal 5. 0s wa I@~ -e
._"_. "_ - - - - - - - -* *- --
B. air's "or's vimeXcept FerlLitESSr Ice 1..
1. ThIrd year's W
sainspi Ierl. IIisr 10 7.a5CWp.
9. ThIzJ pest'sd 1.0-".~M.esinspi Cini 1.0 5.3 ' ~ ~ ~ ~ ~ ~ ~ ~ ~ ~ ~ ~ ~ ~ ~ -mdwow
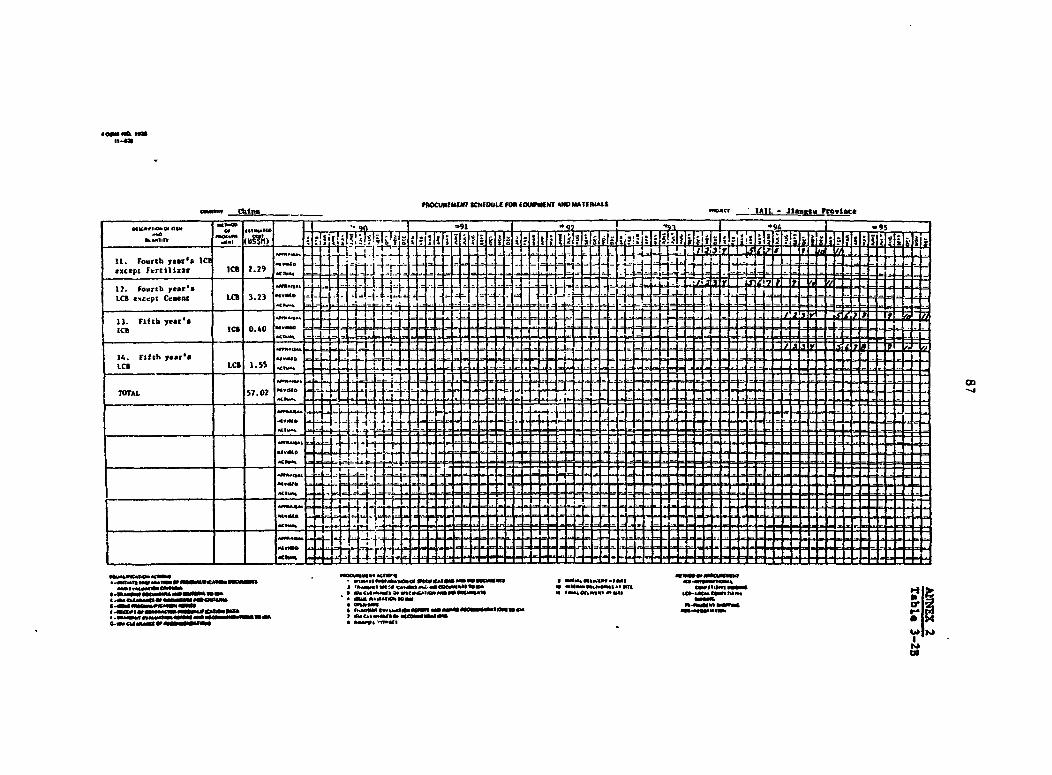
fOCUnInEN? lstOUU fOI EOUVWUM? kWSIATERIALS*^oCw IA^L - Ji.apa Fl m'
at. i =gSt lw M ' ifliga
*_n_ s__ e_ ez~e_-X_______*w_____ | (Ul) e~-I d i I i it
11. Fourth y*araa I* _ 't l;!x~cpz hartiliztt ice 2.29
*2. Fourth yt r'sLCB encept Cement LCB 3.23 wo~-
13. Fifth year'.
'Cl~~~~~~~~~~~~~~~~~~~~~~~~~~
11.. Fifth year's LCI -A~.. 0
LCR Lca 1.55...I~ S..IhIn m.. s.u..Sn
I~~~~~~~~~~~~~IdV .a.een ume.s00
ow*mg 01~~~~~~~~~~~~~~~~~~~~~~~~~~~~~~~~~~~~~~~~~.MINA 6-im 8.~~~~~~~~Mdo*NM ~ ~ ~

_hlea .0u m JAIL - Jisagsu Provisc.
1. Illlaa 110. } p_p vs1 _ e _ e _ _ _ __ _ i I i fflll9 1 YisI: rq 1 1 1 fi/ IX I 1. H&aiaa. so. 3. gusp J .
S'ataion _ 2.55 I I I
E.x~Peninafitoa SlyangPump SIaLtOB LCS 3 02
3. Shall PMP fLatIca L(3 1.60 .u -;
L. LiU LAOjI10 IW ?pSt- kom LCB 4.38
J - A
S. Zboogyunhe tOddlecanal L . l T
6. strengtheaaag South 1941ke. Luoma Lake LCB 2.83 A-j-
. atr control Centel. - -- - --!.einjg Les 0.54 '
TO3TAL 1.0L -
0*4_RI__|_,ar * * l 0u, ,1
~ ue~meumm~ 4 - a,j.I~,eel ,
a ~~~~~~~~~~~~~~~~~~~~ -~~~~~~~~~~~o1.4 e,.mrin~~~~~~~~~~~~~~~~~~~~~~~~~~~~~~~~~~~~~~~~~~.A1in~~~~~~~~~~~~~~~~~~~~~t* a ~ ~ ~ ~ ~ ~ ~ ~ ~ ~ ~ ~~~~~~~~"V
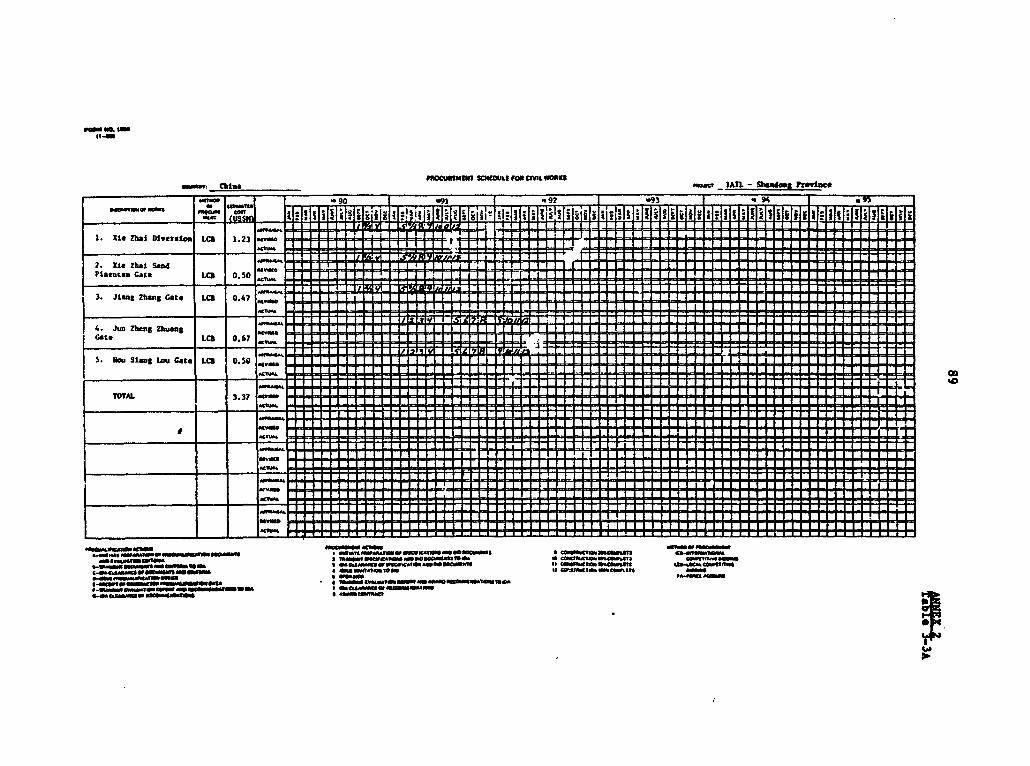
ge m
IDOCUSIMfuT SCHEME1 FO CrVL OWKSr. Cldt IAn - SEno froylac*
_ _TS-RR ; ldT T_ TI f01 11]ll 11- I I I I R I Ix I Il 1. Us Thai Diversion LCD 1.23 _-IL
2. Use Zhai SandPlagOea GaCg LCI 0.50
I II
3. Jlag Zanbg Gate LCD 0.47 I
4. Jun Zheng Ziwang IGa te LC 0.67
S. Noa SIAM& tau Cat LCB 0.50
0 _ -+4l ilMTI I: -~~~~~~~~~~~~~~~~~~~~~~~~~~~~ . . Lll llTOTAL 3.37
.~~~N~wMrnwinmam,ammetgws , mwe,agvrneewsc.w.'inm.*mnais comk "'t w
meuImY _ I I W~Oi5 tltO 1 1C~tS I.. I : -1.4li T mm 11 11I IIII I S I I I~~~~~~~~ I4ma4w,4w,nimsi n 1r T Nlll L S I I sm.mi.A,,,,,,,, § ff t Z |S IIII111L_..
I ina 11s . 1v|IB ... _ ma 1 1.... ,,,,*,
.Prm ~ ~ ~ ~ I4m0A innU.45t.1 U im~om acmewemi_ ,o w" w " I o I I I I I [ I I I I I I I rT .... f 9 I 1 r I IT y I rr I a . Tl Tl rT ...... _ o I ....... f I I w I f I I I f I
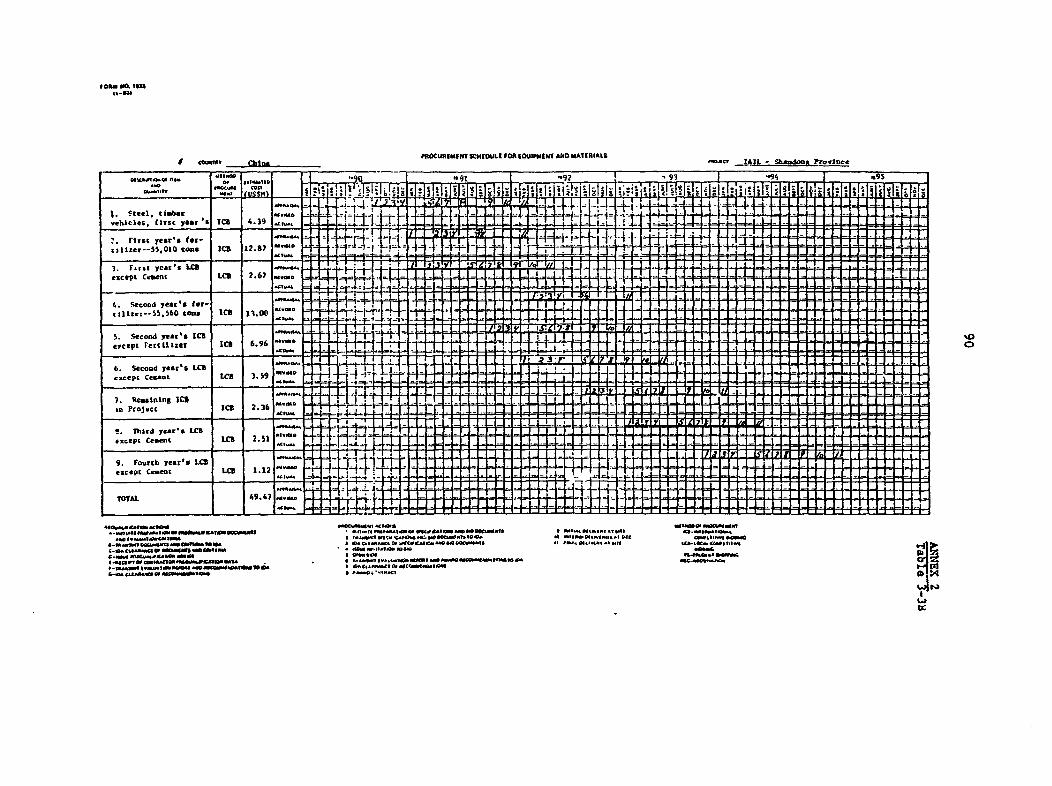
I uaws ai. MOCURIMINT SCNOULI. FORi IOUiUtNiADI AO AUfRILS -.ocl ____ha__g,Prvl
9I9I -
teler-I,I Cboxa lCDo 22.87- Shnj -ro- -
WiXi3. First year's LC - .. 4..
except Cegeot LCD 2.67 ft
,;_i,e Ieca|**%"
S.Second year's ICBencept rencilizer Ica 6.96
6.Second years& LCDexcept cewtut LCD 3.59 - j
7. estains IC$in Project lCD 2.36
8. Third year's LCB Aevce Pt Ceamet LCD 2.51
9. Fonrth year's LCD
except Ce..nt LCB 1.12-
IOA! 1.947 .e1a --lo"
a~.M.aC.l M44
b:s a.Q5O.5afftsaS ftastnn.,i .I..m.

7IRICATU A(aRaLLniE ixwIFlCAT76 TW.W
_ _ ------- _ _ - _ -- _ _ --- _ _ _ _------~~------ _ _ - - ------------ - _ __ - _ _ - - _ - - - - - - - - - _ _ __Dishurmmmmmt Shd
51edJo.g Cenomn1 Aghe Coponet JIa 6., Coa_aeet . Totel Project190/IDA Di,mbrse.ebt Di"urement oieberammmt Oislpur-tsomui Disbutemet Prft /Fisc Yea - --- ------ - - ------------ *mmd Semter Smetrsl Cwelw.i,m Cumulu3ski S....Lral Cmulabtive Cwwl.t.ve Sosbtral Cueoloti,. Ctbtive Smm.trml C.uWlti o CumlaLi., Year/ Cr.lsvbl.--C s .Ua' I I io)---- (5) ---- (t6 SiS Iliom)---- (3) --- (L68 mil l o)---. (2) ---- (US6 e.ililo )---- (5) Seambot CS)
Fl 399 Year IAJu-D.c 91 lb 6.3 6.3 7 10.0 10.0 9 e.0 5.0 * 26.3 2 3 6 1mb 0Jam-h.0n 92 6.s 16. 10.0 20.0 1t 6.0 U60 i 26.3 V2 6 36 d1
FT 1993 year 2.oul-Do 92 16.5 33.3 29 35.0 35.0 30 12.0 26.0 2t 435 96 1 29 l etJam-A. 93 16.5 49.6 44 15.0 50.0 43 12.0 40.0 36 43.5 139 6 42 2.4 43
FT 3994 Year 3FYD.l03 35.3 614.9 5? 12.5 62.5 53 12.0 52.0 so 306. £?9.4 54 lot 53Jam-k. 94 18.3 60.2 71 12.S 75.0 54 32.0 64.0 SI 36.6 219.2 OS 2.4 62
FT 399 Year 4Il-J)e 94 6.0 63.2 76 9.0 84.0 72 30.0 74.0 7i 27.0 246.2 73 lt 73 Jeo-A_ 95 6.0 95.2 65 9.0 9.0 79 10.0 ".0 s0 27.0 273.2 62 24 6 t
FT 1996 Year SJFl-01 5s s.0 101.2 69 7.0 300.0 as 7.0 91.0 7 1.O 292.2 ?7 lot sojobm-d. 96 5.0 106.2 94 7.0 107.0 91 7.0 96.0 9a 39.0 333.2 93 2md 93
FY 1-D 96 3.6 110.0 97 5.0 112.0 96 3.5 303.5 9T 12.3 323 S 97 lot SsJm.-a.h.m 673.5 113.5 o00 5.0 117.0 100 5.0 104.6 100 11.i 335.0 1oo 24 n0o_~~~~~~~~~~~~~~~~~~~~~~~~~~~~~~~~~~
- - __ -- -__----- -------------- __ _ _------ - -_ -__ComplmLlon date: Jme 30. 1996Cleolm &Let JSm 30,. 3I97
/a: OD -_s_m.t preflle for agriceltratml sector is Cui. compiled by eWH.i . cldilmm retroactive flinaciag effmctive from Novembe 1. 1990 to signing of Loon/Credit Agreemnt.
ii

IIOAT1 A1t u SEltFWICATIM PND.T
Xlies Sojocto Total Tota P1.81 by Ys Prte so
Io_o_- C t _ _ _ _
_ _ _ _ _ _mot. (Y'OO) 1 1993 19194 3,stPJV PrN"-----
--------- --__m-------ITltAIMUt-:1 o lc; lt C..tpIT o ihlp/I Le1d
1. Oeg.aiszee: Pteovei.ial sA Coutf rm. is iajmci_ *ath
-- _-_----_----------------------e/Dartot
of Agri.cltere.
I s)C..liurol t.cbalqsoo to ocr.... Ie. to sod,... *1.5l 2S00 750 SW0 400 600 60 Om 2, Ibjor crwp coar .0.0.. cor. cottoo, ocyboos aed r_s$t
bCelewoel tocbdi.. to imcc,. ser-- ilo to hig lisld 2500 750 300 400 600 G6 60 S. Seor snd esporioecd sgramaxiset _. estsion officer.
c) a-fr, d tie boiqo for _sia crop. 2500 750 S00 400 600 600' 600 w;1l b. o " as instructss.Fortsilil.ti_ lic tion t o i 2500 750 100 400 600 60 600 4. Troli. a ill II Coaductod duew oiots idi isog priod.
Pose cstres/proweotiom A satf appiiectles of P"tticlds 250 750 SW 400 00 S 600 600 Ie l 10-30 days dsp la te toi-eC.
fYbrid corn msd sultiflicatios sd floating 2500 750 300 400 SOO 600 600 S. Ttaisio obec et*a are to d*eoietro tome.ec r*MIS o lt a
)Cotbma "ad pt ritw/armetal im,ov.sat. toctoI 450 135 50 55 115 is 115 cu.aatiam goebiai .S6b-to te 156I0 4635 1sS0 24S l715 S71S 37152. Forotr AJrot1ecico
(el Ciltosal tochftiqso for _ia ertop 12000 1600 120D 1500 3100 3300 3200bbeid cot. eool _tioplicatio, aod plsatiog 1200D 1o6 1200 1500 3100 3100 3100
Safe opplistios of postici4 S" soet Centrol 12000 1600 1200 500o 3100 3100 3300Sub-total 35000 5400 a00 400 9300 0300 9300S. scieti;o Staff-. -_--_------ S All traii.., to ho co_docto at Prviaciail Schoolof water Consorvancy.
tr iooli.s .e,- p1_iosol sod dosIgs 240 o 320 120 0 0 0 Two batch., of 120 po_ems sck. te ootl dorOtios
(I.W ios-t,-ssueo pip. o1pel.. dosios 50 20 0 50 0 0 0 .O. sOt A.roliam foe 60 pore_s.p ierstios £ Sot_ neo . for too.ehiplvitl.g. staff 670 200 0 a5 335 0 0 Oh. moth duretioa for 670 pre.
Cli str.,etis re tOtfor e ti ,res .teff 120 46 sO 40 0 0 0 0. sot. duration ter 12D psesos.t Coosissosig ; tootiog of puop i ag o~.ip. 355 134 0 0 U5 0 0 HIb-osot dwrtio fort 670 Versa.VsLsr*f-so.i iee.go;tio ted...tu.s 40 11 0 0 40 0 0 i.l month drstios for 40 p.r....
(a flioh Isogooge te.iaimg 30 20 0 ti30 0 0 0 Five prses for Smths at SShandase T..ctr Trrimiop li,vrsity. to
01e-itr,.l 14il1 52 M 7 Ps 710 0 04. Project ihas_met Mt ice Staff
pro'c wasoosst * . oisioe 1 125 60 20 20 20 0F;;scisl s;isetr.t;_ * mioa
sodso 40 40 20 0 0 0d ist-i!l sodeatlo
6 O _ 40 sO 40 20 0 0 0SObtetlt p*eoerome. s; saos-.jnt 40 s0 30 tO 0 0 0Ccwots.i sgplicetime is project eanagoeaat so 90 30 20 0 0 0Sub-_tel 310 26t 190 SO 20 20 0
Torl Training 524 11419 S640 7510 I4 35 IS 1301511 SIIDT Tf
1. Lal Stody Tootrs
*iso See Project doolgo A lt,ss.ssea S 4 2 1 0 0 0 10-4.1 ur for 9 por*oos.China N..sorc0 11 Froies'ct, .eeog t _
4 2 1 0 0 0 10 -
dsy to er toe 9 sreem._Autmtic ac ral.l; lowf P roaur*e piPe spot. 5 a 0 a 0 0 0 15-day tur for 30 pe... to Wioql C ;tpi. Tisil..
141 lte.tiom areon I 9 7 0 0 0 0 60-dsp to..r for I poriem to hajiNOMps ItripsL,om Arna* %iiism,
I,rirg tie ith Yelolw river, se. ilsoeslos 4 * 0 4 0 0 0 15-do tur for J porem to osolo. Irriest.m Am. Shasasi.
tf lasooL Oft ofi projeit 4 6 4 0 0 0 0 16-day tooe for a Versa to nhoe Vol Il X;oor Irwigetios Areo.SA-td ol 26 i5 i5 i1 0 0 02. Ortro" $%Oh fe*_
(a So;l spro.ossot a fOet I§Or oppt;.otio, 8 202 0 S 0 0 0rOe Of * poem for 1U dsaJp o cetry to be detosd).tb C.ItyfxI o..ds mltipbioiioo tetoleso J 202 0 0 0 O 0 a,,.J of 6 poerm for 16 days tI coetr to io " dots-;.). I
Qoitw oaf o of * od-igols; 3 o p
202 0 O a 0 0 O Cf e prsose for If dajysto coo"trto ho dats raimd).
tlrl A st ta"of for a scacro-pb s 3 202 0 0 6 0 0 Group of Poest f* 1s dra to coIetry, to ho de"t ;e).
re g;ertio_ toeloo for qeld rogioss 2.5 370 0 J .5 0 0 0 ote.p of S psomw for 20 days to iSA.
teges. d ain;. te_..olog Is dovolopiegcouir;0 a" W Projecto management. 4 I6O 0 0 4 0 0 Group of S poem fo 60 dasp So Pakistos sod" 1.41.al) Sioivisd 1 r jeomoest ochniqueo 32 W0 0 0 2 0 0 C oepf t :oems for 12 doye so 1S.
) Ireigs tism osi roig sok Os"WOOMS 6 15 0 .5I 0 0 0 Gr ofp too"f r for 20 fose tso luotl is.Sob-tatal 2 3i7 0 16 9 0 0Tlo it Iy Tor 51 143 is5 27 9 0 0INS. MVUUQ trvll32 ism 32 iW5O 76T7 i114 130iS ii3s
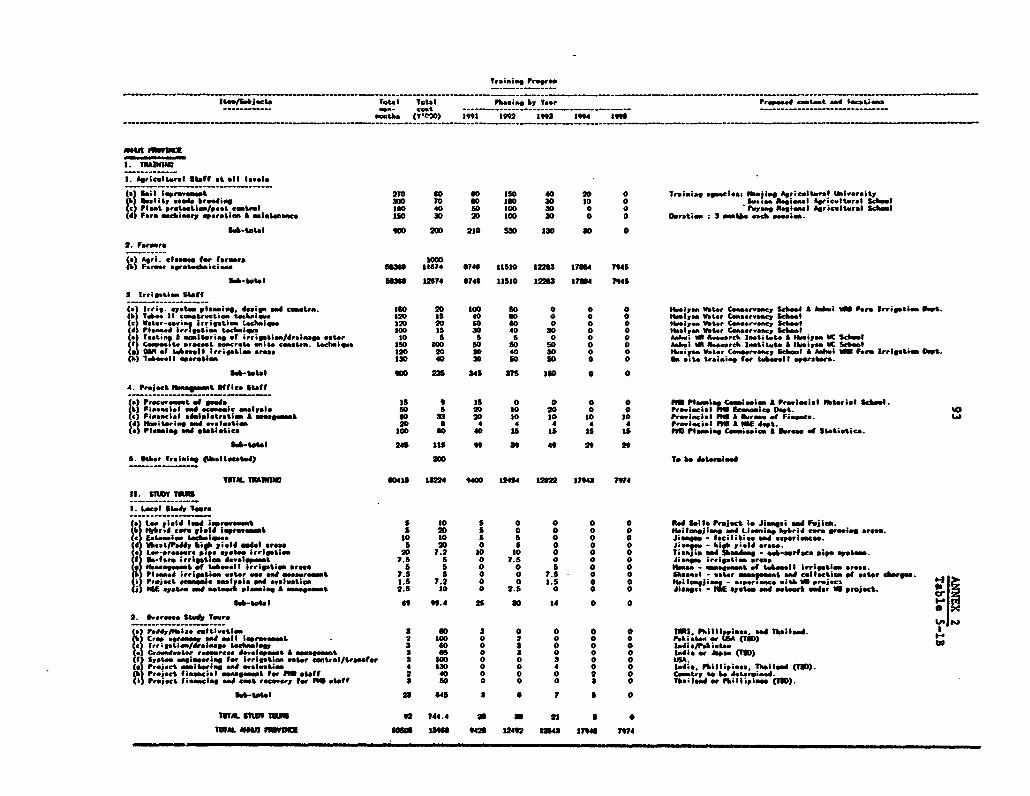
_- _ _ - --- --cost ---------------- ……------
*tb (Y020) 991 1992 1993 1294 *995
1. I SaEND0
1. AgEriwlt.rat Staff tall *a..le*1
(4 S;lt, a. b.270 sO sO IS 40 20 0 Training agnelo: bajiog Agricl.tsl uil.sraitylt!", prstctl= 1s.1 di 300 70 60 1600 30 So 0 Iso.aft asiomol Age.ew0ttral SIomPI net p'Otactloali_ ss, control l@O 40 50 100 30 0 0 * isl Agrcultral School4 Farm .acb ry op.r*sice A o.imtema.c 1o 30 20 I00 30 0 0 Suretieo 3 am * *ack sorsio.Sok-totol 900 200 210 S30 130 30 0
2. Frmetr
a) Ai. clsa. for frmers 1000(5) Farms. agroret.oto4oom Sm 116si 6745 11510 12263 1704 945SA-totel Ss314 12674 6746 11510 122 1784 7945
3 Irrigalim Staff
taj Irri;. *l_t-; plemmoi. assign NW cetra. I6 20 100 s0 0 0 0 N-alae Wator C.wamwg School A Dm5..2 Farm Irrigatio Ot.(5 Tb.. of eaatra.ties letAwqv. 120 15 40 6o 0 0 0 bsl1 - Water Conservancy Satmel(c< Wte-swria If rrigation tetbmiq 120 20 s0 6O 0 0 0 .,,- Wet., C.ma....ram Sed._di Po*-.a irr;gation t*chmlv too Is5 30 40 30 0 0 beSrs WYLter Conservaney ScoIsla s 1..tj A moelorims ofJ4.r;$?Liem/drsi*sIe water to 1 5 5 0 0 0 AOl.i. SAsevret lm 1-tjtoS A aboipe C Sdc_I(4 CaOs.t_ arees*t emiacet. -. L. constra. techmlvq ISO 100 50 s0 50 0 0 AmIu a Kooparh Smwtteto AL Ilaive WC Scblhse OIJ4 of tobs..ll irrist;imr areas 120 20 30 40 30 0 0 ,,-iym Water Cemoor.a..q Solut L A*i W Far% Irrigation Dest.(5 lab*easI o".prmsl 130 40 30 s0 so 0 0 so it*e traimio for teoboell pera%ot.St-totl 900 235 345 S5 ISO 0 0
4. Projoct _mooent 6flce Staff
Prcwrmt of se 25 9 i5 0 0 0 0 tl Plaiwm Cainiv.. A Provineial ibterisl Scbosl.Fisa;mal sod _comoic amiols sO 5 20 10 20 0 0 Pseemelal Fhl Ecommico bet. . Fosacial admislostrtiem L amsogmemt O 33 20 so so to to Prm"amcl no6 ai r._ t Fi P.m..) Ib;itori md _ a.se"ti; 20 a 4 4 4 4 4 pft_ e;il PM A "if dept.*s PrS-i.. NW ototietice 100 so 40 is 15 is is no rPosis. Commeioom & b .ras of Sttistic.sab-totl 245 1IS 99 a 4 29
S. Other Traimiag Cbalge.sftd) 20 cOo d e terslSd
TiiT6L 1353006 6041 14 9400 124I4 1794 m4II. Snm Tai'l Lcl Sadv lo
(a i . e. 1 lo Sad i.r.emo t S 30 5 0 0 0 0 P.4 Sael* Project la Jlimgi _A ftjias.(bhbi core viold impr"oem.m S 20 5 0 0 0 0 N.jismojimmo sod LImimoi hybrid cars gromies ors...E.tonelo t.dssi..o 10 to 5 a 0 0 0 Jio aOga - fscilitit sad *. ri_ema.Cd k*atIrPsU hiqh gld4 mdel mros S 20 0 5 0 0 0 J ;a,o - high Ni.Id areas.e Le.-prvore pepo sapet irrigation 20 7.2 l0 30 0 0 0 TisajiaN s_d 5tdmg - oub-Iurfaco pipe atess.f O.-farm irrlgation h.l_poemt 7.5 5 0 7.5 0 0 0 J;vaga. irrigation ar*.*C lomeag..amt ov tdbooll irrigati.. aro,o S 5 0 0 o 0 0 O asa. - --- t of tebo.1l irrigatios areos.Pead iript; *ati o vter a. "ad os.r. t 7.5 5 0 0 7.5 0 0 SMGRaa - water so,owmet a cellectios of dsa cbarge.Project ocomomle *asolpisd N avalustleo I.5 7.2 0 0 I.S 0 H0 NlaopJiang - a.p*r.svc *lit VD praac%ode syoteo MO not-MR siammae a _Avsment 2.5 10 0 2.5 0 0 0 J; .a - Me too *vd .. t.. . "..d.. U praojct.Sat-00"I ff 9.4 25 so 14 0 0
2. Seos S Terr L(a * ddylvia, clti.atos 3 So 3 0 0 0 OI. Msplle . A Thalad.C Cr. w p _J al lroI t 2 100 0 2 0 0 0k; *a JSA tTiD)C.) lrig.timdraio o tehmaleao 3 G0 0 3 0 0 0 Iedla/PtataOL"tCa) 0.osmdst *v _roe-re- de oo t3 0 0_* 0 2o4 Jopba (TD)t Stea ems;eoirmas fo r fec rritime wster entrel/trofor r3 100 0 0 3 0 0o WSA.Project ;ietorlmo seo oealwatiae 4 130 0 0 4 0 0 lad;*. 0111iMpia., ThsillW (TIO).Ptoje.t f;i.aac,al mos et far me staff 2 40 0 0 0 2 0 C,tv, to to datei_ProJect financis "A coae recovery fo no tdtJ 50f0 0 0 Thailad * Ft; llipsp (1i 0).
SWt-tUV"l 22 645 a 6 7 a 0
TMi W71II TOM 744.4 2t 2.i 5 0
TOTAL i n_or saws 19 "42 92 124 1794 7M7
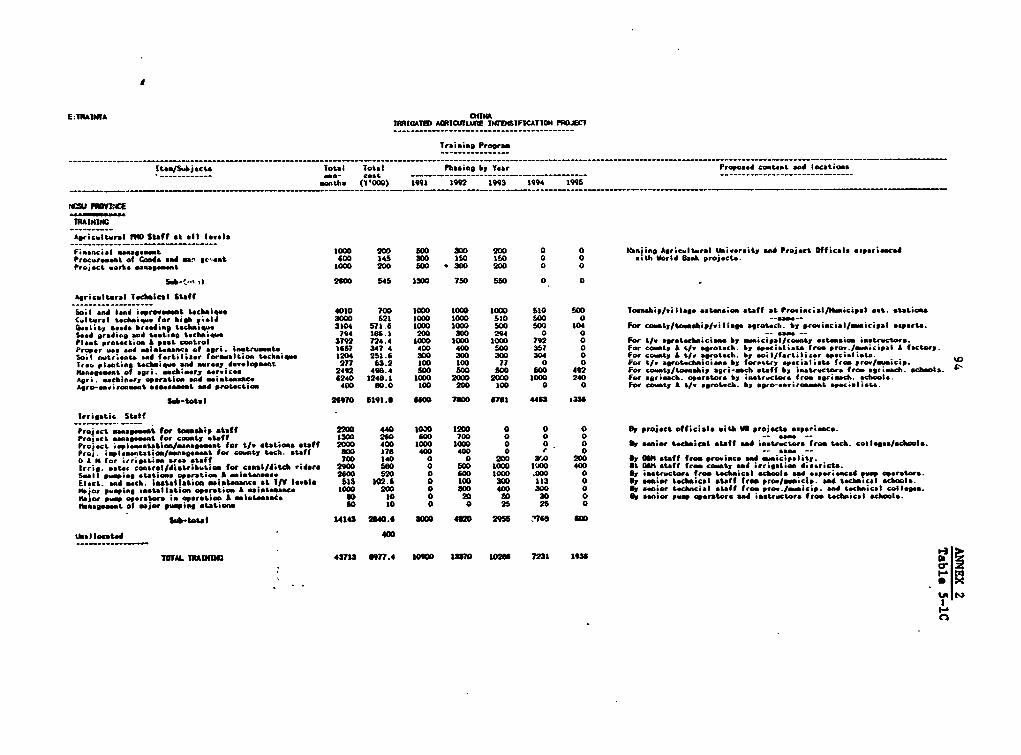
E:TRAtfI A CHINAkIRMICATIED ACRICLNbLLE IS4TDEIFICATION PRDIECT
TIrinima Prograo
It.. Sujects Total Total Pbhsimg by Year Proposed content sad locations______------ Rem- cost - - - - ----
_e____ ___ ) 19__1 1_92 19_3 1__9_ _ 1 ____ __ _______
PRAINIIC
Agricu.ltral R1 Staff at all levels
Finsacial *nua 0eet 1000 200 50O 300 200 0 0 l6siine Agric.ltaral University *od Project Officals *psrieeacsdProcareseut of oods l dr m* n gCeat 600 145 300 150 150 0 0 *ith World Bani projects.Projoct aorks ssnaWemst 1000 200 500 * 3C0 200 0 0
S.h-t-'. i 2600 645 1300 750 550 0 0
Agricultural Techlcl Staff
Soil sd lend iapro t t.cha.que 4010 700 1000 1000 1000 610 500 loenihip/.illsge extens;on staff at Pro,, imcisl/hicipal sat. stationsColral tochaiqa fot higb 1 ;.lJ 3000 521 1000 1000 520 500 0 --es--QuaIty 6ea4d breading tedchique 3104 57116 1000 1000 500 500 104 For com ty/toemsbipfvillage iSrotech. by prov.mc.slImicipal *sporte.Seed goradig ad testing technique 794 155 . 200 300 294 0 0 -- ea" --Plant protection a post control 3792 724.4 1000 1000 1000 792 0 For t/I agrotecl; ianc by imaicipal/coumty estiaftos instractors.Proper us. sad as4iotMacse of agri. instrueemte 1657 347 4 400 400 500 351 0 fot coet, a te seotech. by specialists fro prov.Iseipsl factory.Soil nutrientsa "d fertilier lormsltion techniqui 1204 251.6 300 300 300 304 0 fot coaty A, t/v asrot.ch. by eul/fertil.c.r spslissIre., pleatin t*schise, en4 series development 277 63.2 100 100 71 0 0 For t/v agrotchuiciess by foreutry specialists from prov/isicip.Management of egri. mchiry services 2492 496.4 500 500 500 500 492 For cousty/toa;hip agri-moch staff by imtractors, fto egrisach. schools.Agri. macbhiery opiratio, mid m*i-teaamce 5240 1248.1 lO00 2000 2000 1000 240 For gr,iach. operators by in-trctors from sgr_s.. schools.Agro-enviroamiot assessment sad protection 400 60.0 o00 2DO 100 0 0 For covaty A t/. igrotch. by igro-eneiroast pelist
SfA -tote 26970 6191.0 am00 7i00 67l 4463 .335
srrigatic Staf
Project *ams9 1et for towip _ ta;tff 2200 440 IO!D 1200 0 0 0 fy Project officials with W projects experience.Project mass..aat for county staff 1300 260 600 700 0 0 0 -_ _ -_
Project ila tiom/nms_st for t/w stations staff 2000 400 IO0O 1000 0 0 0 or senier tecnical stiaff sa istrctors from tech. colleges/chools.Peroj. ip lenttion/ensgsaat for conty tech. staff 0OO 178 400 400 0 r 0 __ ae __0 a ii for rigaton areea staff 700 140 0 0 200 3VJ0 200 By GAN staff fro provisce sd municipality.Irri aat contrl/d ihutio for camal/dit ders 2900 560 0 500 1000 1100 400 at Gl staff fron count, and itrigstion 4isericts.Sl Ipu isi stations operation a maiateesoce 2500 520 0 600 1000 300 0 ab istructor frOm t.chnical schools sd speriencd poperetors.
Elect. end smok. latilation maimfenanu at TPV lvelos 513 102.6 0 100 300 113 0 o seniot tecnictil staff ron prow/mumncip. sad technicl school.major pu.pims eetellation operetion A. omiatease 1000 200 0 300 400 300 0 ey senior tchc;al staff from po"./masmicip. and teclnic ls
aior poo operato is operationa mi_tnand- s0 10 0 20 30 30 0 ly, senior pwop operators ad ikstroctors. fro tschnicsl schools."esageasat of "ajAe pimping station 50 10 0 0 25 25 0
1mb-tolal 14143 2540.6 3000 4620 29 7s6 60
IMallocatod 400
TOTAL TiMlD 43713 8977.4 10600 1370 102K 7231 2o n-
4,511.3
iC)
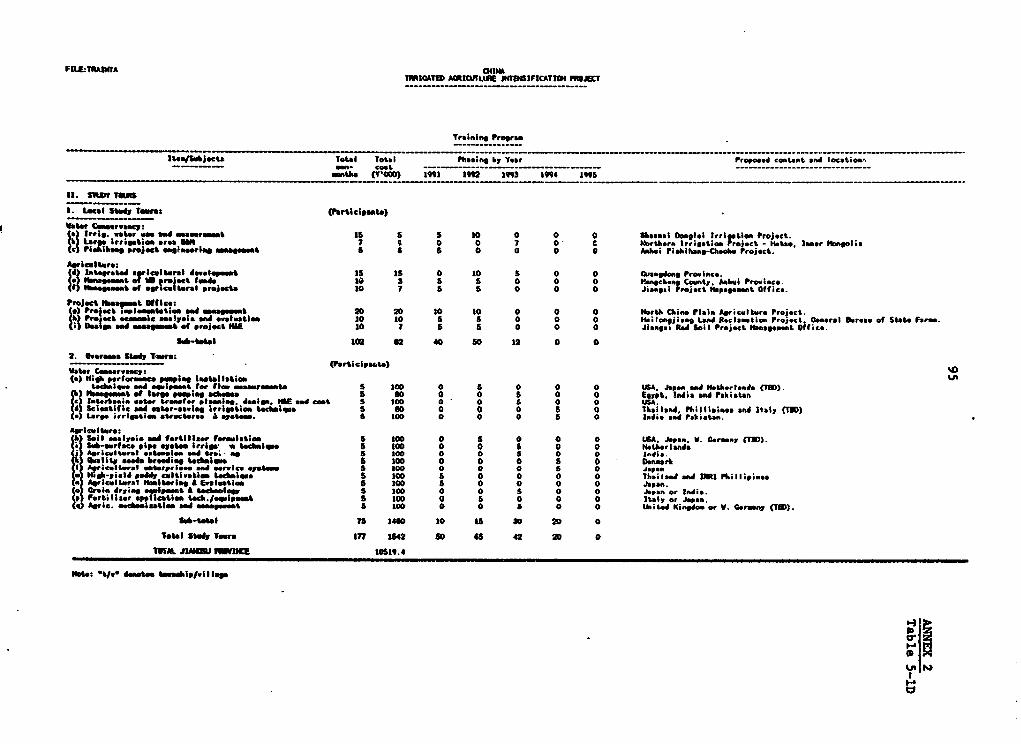
FiE TRiA1TA CHIMll ICATED Aitiuje Zwl6lFICATTON .Itr
ItrewsjeacV 1otal Total hain$ by Year Proposed content and location,Man- cost ------------------- _____________________________mnte Mt000) 1911 199 I99 194M I95
1I. ShtD Tam
A. Local Sthdy Tows &Pmrtlclpnt)
Water Ce.oer'aaac:swel. walter mm vad _ rwr t "I 5 S 10 0 0 0 SUmamai COnglei lrrigetion Project.
) Lrge irgtis. area Ut 7 4 0 0 7 0 C Northern Irrigation Preojct - Hata. lan.r Ibhnolia*c) Plabihe proiect eagim6*reO. maaeast 6 6 5 0 0 0 0 An&ei Pie&ihang-Chae. Project.
4 inegrald agrcalteral dale_psas 15 15 0 10 S 0 0 C d Prowince.(a) lhnageeag,l of W pro fade 20 3 5 5 0 0 0 Itnechtan County. Dehui Proolce.
(I) NbaEgat gt gcal Wert projace 10 7 5 5 0 0 0 Jiaaat Project Hapaseeant Office.
Projec lha_at Offtice:)Project in oleeaetatiem ad mo _emgmes 20 210 10 10 0 0 0 North Clii. Plala Agriculture Project.Pro Jct ec*mmec maalyc; ad eaolvatlu. 10 10 5 0 0 0 tkuloajiaaJg Load Paclantio Project. Geeral 6area of Slato FParm.
t)aig aed seasamt of projecL NIE 10 I S a 0 0 0 Jlaa.1 Red lodl PrjecLt tbnhgeeLnt Office.
$*-tol eS2 62 40 S0 12 0 0
2. Ovarems. tIeu tast:2 bfe ~~~~~~~~ 't: o~~~(PrtiCipele)Valo Cameervecy(a 4 Hgb potrfruse p_ia metal ll;
lechaigee aed _equlpoet for flea eaaeeramete s too 0 6 0 0 0 UA. Japan an NeUerlande (TBD).i Shaege t g l.. rge. p l e .d m eo 1sa $ - .............................. 5 60 0 0 S 0 0 Eg pt. India ans Pa1ti ta n
Cc aetas ee rmfe llg aeego. MAE sod cost S to0 0 0 a 0 0 WA.J Scietif _c aSr-aevig igti t; c i a OD 0 0 0 5 0 Thailand. Phillipiteo nd Italy (TOD)* Lrg irrigate rwree S* 100 0 0 0 a 0 India and atxi tan.
o ll analysis A frtillsr ferelati. S 100 0 5 0 0 0 UA. ape... W. Cer any (1).Sub-erface pipe aaste irig' * lchi 5 to0 0 0 * 0 0 Netierland.Agricmlt.wel eatemele aed ot' as 5 to 0 0 o 5 0 0 Inia.
(I.) beaUty ooedg Irsediag techaiqa. t00 0 0 0 5 0 benathm(I) A,e£celteral eetatprieee and aerwice Sy.tema 5 100 0 0 0 S 0apltsgb-yield paddy celtlvalie.a leioqme 5 100 £ 0 0 0 0 Thailad ad iml Pillipm...
a Agrxicellrat 11 NamIteriag 4 Ewaleal 5 100 5 0 0 0 0 Japan.c.o Craig dryieg eqm£peast 4 te1_1gv S £00 0 0 5 0 0 Japan or India.
p Forlili er appllgaotiga.teoh./b _q.ipeeet S IOD 0 5 0 0 0 Italy or Japan.ej Agrie. eocte.lanlem _Jd _ *oegams.t 56 00 0 0 a 0 0 Utild Kindom r W. Grmny (TOD).
311110-1610"1 75 1460 10 is i0 20 0
Total stey Twra 77 1542 50 65 42 20 0
TMAL JI*IUU U#ltI I0t19.4
Ha: CtISo demote em, _omeipIvllage
FRiD |t
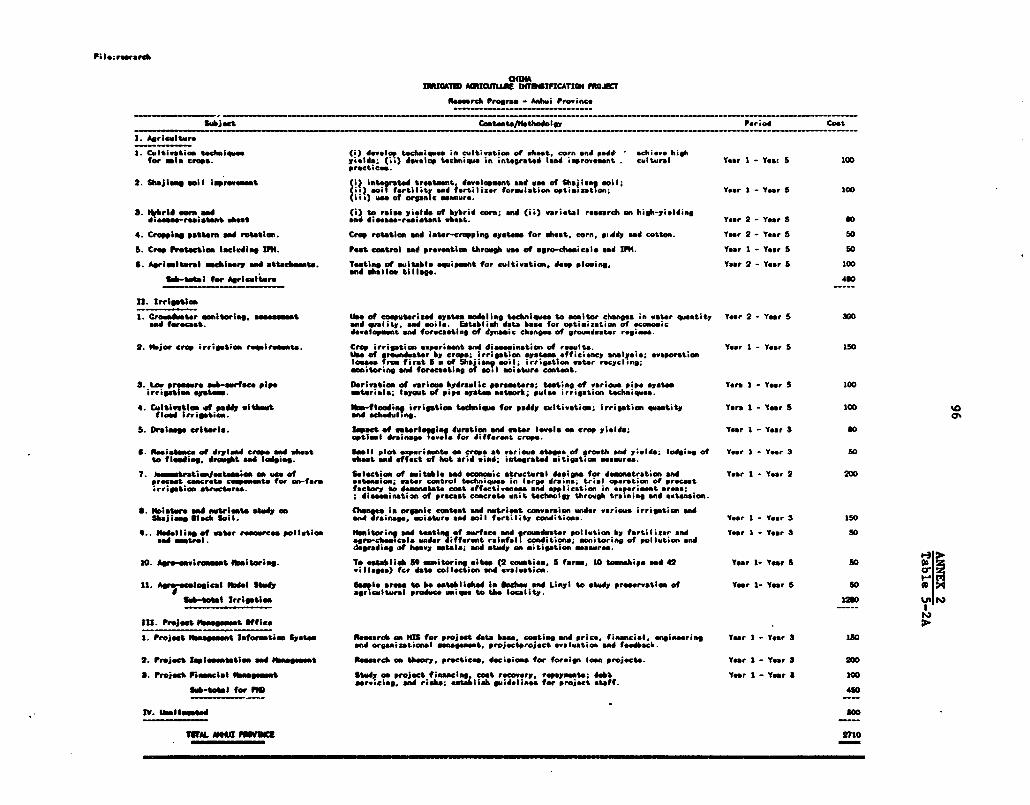
Fil; reera
CDiI11ID1 AIItlU ifN IICATION Pr0.JT
Reserch Prora.. - Anhl Prow inc.
Subiect Contont/llethadolgy Period Cost
1. Agriclture
.Cultivaslo techniqusG develop teclniques in cwwlt.vation of wheat con and peadd chiew. highfor mim crops. yieldb, (a,) develop t ocnie in integrated aInd improvement cultural Year 1 - Yeas 5 100
. hisoi el islprewea I integ1rated treateent developsiont and wase of Shaeiiaa, soil;2 Shi j_ lfortilit and fert,Iisesr formlation ortisixation; Y.r 1-YearS 10i)u of organic mansro.
3. "ibd cam Ad (i) to raise yields of hybrid corn; and (ii) varietal rosarch on high-yiellingdlseses-resistaat whet and dieaee--resistant wheot. Yar 2 - YearS )o
4. Croppig pattern sad rotation. Crop rotation and icter-crppirng system for wheat, corn. pildy and cotton. Year 2 - Year 5 50
S. Cra Protwstls clcdig l. Piat control ad prevention through us of agro-ch;eicals an IF". Your 1 - Year S 50
S. Agwrieatm.al Imbi sry sad abtaecata. Tsting of eulteble equipstnt for cultivation, deep plowing. Year 2 - Year 5 100
Sek-tatal for Agriculture I salwtle.410
n. Irrigetla
1. lr aduater emitoe, asaseaseat Ule of coapterizad systee modeling techninues to aonitor changes in water quantity Yeur 2 - Year 5 300W ferecast. and qwulity, ad oila. Estalieh data bhee for opticitation of oconosic
dlevelopeant sa forecastina of dynnic change of aownadater regiass.
2. "ijer crop irrigatlee r iremnt. Cro irrigtion experieent and dissemination of results. Year I - Yea 5 1SUe of rou ater by creope irrigation system efficiency aalesie; evaporationlome f row first S a of Shajiang eoil 'irrigation water rocycl.ng;abitoring an forecastina of soal moistur contnt.
3. LA1 preeers sub-surfs" pipe Deriwaticn of wariou bydraulic param_ters; te-ting of variou pipe yste verb I - Yer 5 lOirrigatief system. noterials; layout of pipe systm network; puls irrigation techniques.
4. Cultivatioe 4f pad; without iha-flooding irrigtion technique for paddy cultivation; Irrigation queatity Yers I - Year 5 1OD 'fled irriation, Nd echidlIns
5. ralt&W criteria. lnwwat of weterlig tw en erop yie. Year I - Year 3 SOOptimal drsinga l evel for differant crope.
S. Meie-teace of dryiad crop ad wheat Smil plot expvrimente on crepe at variueo stasip of growth and yields; lodeins of Year I - Year 3 SOto fleaiag, droout sd lodging, whet wad effect of hot arid wind; integrated sitigatmon aesaur".
7. Jemaetiatien/euteasion wu of Selection of suitable asd economic structural deailpN for demsntration an Year I - Year 2 200trcast m rat c t for on-farm eaaion; eater cntrol techniqu in large dramna; trial operation of procatirrigation structerse. factory to d_om etat cost effctiv,ones and application in e.periaent ares;
d; esesination of precast concrete unit tcholigy throuh training and estension.
S. Wbiatere wad nur;iat study on Chag ia organic content and nutrient conrvemion under various irrigation andShajiem 101ac Soil. ad drainage, soistura and soil fertility cond;tions. Year I - Year 3 150
e.. ttdelline of water reeources pollution Hmitoriag ad testing of surface an groundeater pollution by fmrtilixer and Year I - Year 3 StNa emtrol. Lro-Aemical. undor different rainfall conditions; aonitoring of pollltion and
degrading of heavy mtals; ad study on witigetion _omars.
10. Agro-eawiraomat iaitwriag. To *tablib 59 onitoring site (2 cowties. 5 f rm. 10 toen;yips and 42 Year 1- Year 5 50willag") f*r date collection wa evaluateion.
11. Agro-ess4egical Nbdl Study Seapo ares to be eatebliheid in Niobue and Linyi to study pr-eervaties of Year 1- Year 5 SO
SIII. rI Ihage ent; 1ff iceSub-total Irigatlee agricultural poueunione to the locality.
IIJ. P.-jea i _ke~ Wifcet
1. Projet I 4asemwA afor_tion System Resarch on Hi for project data bse, moating and price. finacial. engimeering Year I - Year 3 15oand organiuational pnget projctotoject *valuation and feedback.
2. Projec lpleetetea wd Il g t et Reserch on theory, practices, decisions for foreign loan pro;ecte. Yer I - Year 3 200
S. Prejeet leancial aes_m_t Stuy on project financing, met recovery, repay_st-; det Year I - Year a lOfjl_1o"l fw M erviciag, an resk establish g0deliae, for projct staff. 490
TV. Ihellestuwd n
MTAL Mot i _ 2710
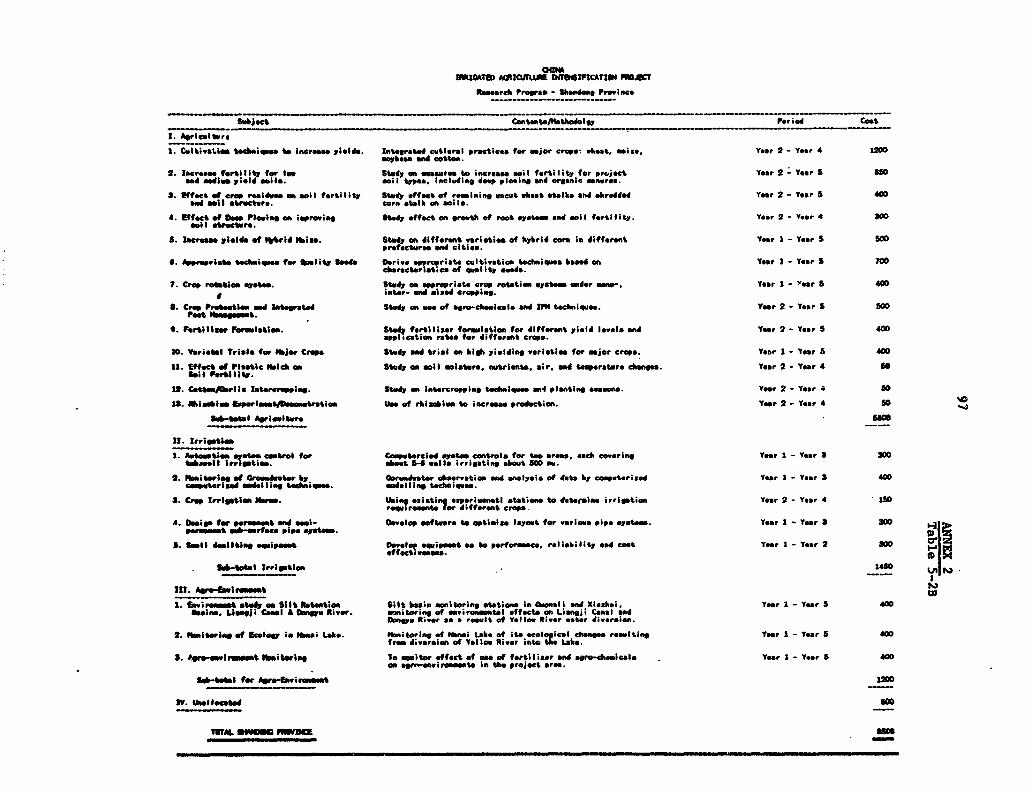
aumVtIUATlD AItIIU4LE D4ilU cATIION PROAJT
Research Program - shne Province
___________ __b_ect _ _ _ _ _ __t Period cost.Agricultvre C 2 - Yenr 4 120C
2 C'Oltl9;i.leS technsquee to increase yields. Integrated cutlgral prsctices for mioer creop Wheat, mis Ya 2 - Y 200soybean and cottO..2. Icrease fertilly for low Study .n measures to increase soil fertility for Project Year 2 - Year 5 no"a soim yie soile. *oil t"ea. inclwding de" ploins nd organic manures.
S. Effect .1 crop r-Jaide am soil forti gIy Study effect of remining uncut weat *talks sed a.*rdded Your 2 - Year 5 400Nd eil structure. corn *tlk oan 0ell.
4. Effect ef Deep Ple_l o mIproving Stuy effect on grout of root syste- end 1ol I ferti YI r 2 - Yea r 4 300emi I structre.
S ilncrse yelde of 11#1id lbis.. Study on diffcrent varieties of hybrid cor,n i different Yr I - Year S SOprefectres end cities.
*. prseprtiso techmque fa r .eiity seed Derive * prcpriate cultivation techniques based on Year I - Year 5 700charactreritice of quality aseed.7. Crp rotftiso sstemo. Study ao apropriate crop rotation syste, under opnum Year I - year 5 400
AS ~~~~~~~~inter. end sised cropping.S. Crop Protwecion aN Integrated Study On ue of egro-chesicl en Iti" techniques. Yr 2 - Year S 50Pet Imemetm.
*. Fertilizer FelatSen. S" fertilizer formlation for different yield levole snd Yser 2 - Year S 400pli ecation rot" for different crops.
10. Yarietal Trivs, for hijer Crep Study _a trial on his. yielding veriletie for mior crops. Year I - Year S 40011. Effet of Platic Ibid on Stuy on sail sisature. trlenta. air. aind teqersare dhage. Yoar 2 - Year 4 sIeil Fertiolt.
12. CsttohrieC Interrepping. Study on ltercropp;ng techniques enS planting season4. Year 2 - Year 4 s013. Slaium xprisemdhmstrto Use of rhilaobi_ to ierese production. Year 2 - Year 4 50
II. Irrigatio
1. Aete _tlon ejetm omberol for Cooputeraled syAtem controls for t*o areas, each cworing Your I - Year 3 300t_bar.lt irrigstion. bsot W-S eelIs irrigating about 0W i.
2. Ihe;itrirg of Oreu*dater by Gorwadwater obervation en analysis of data by cooterized Year I - YVsr 3 400cemouterized sadllisg techniqu. mode Sing tecbnique.
S. Crop Irrition Shru. Us' n isiting esper;unatl station to determine irrigation Y er 2 - Yar 4 110r i r_nts for different crops.
4. D eigs for peranset and *m- Ovelop eftuare to optimize layout for various pipe system. Year I - Year 3 300penman"eAt serfac pipe system.
S. ldsltino sq;past covelop equipment as to p-rforesce, reliability eW cost Year I - Your 2 300
terlstheF _4ffi0ectvemoss114-10tsl Irrigation
1450Il.Are-Selreent
1%1. fr;_t study eN Silt IRtention Silt basin soitaoring sttions in OupaI I ad Xiezh.i, Year I - Yer S 400telens. Liengil Ceal A Osnu River. snitoring of sr vironeentel effects, on Liangji Canal andSonoo Silver sa, a result of Yellow River watar diversion.2. leltewing f feoloWy ;i Shal L e. iOnitoring of lheei LA of Its eol i cal change resulting Year 1 - Year 5 400from dveraion of Y.llos River into 2: Lake.
3. Asr siw lrmoet Iiterlng To elter effect of us of fertilizer and sro-cheels Year I - Year S 400on go-environente In ths, project sres.
Sh-e-tal for Agro- _i n
T3TM am s P Da

OINQAIRRIGATED AGFICUrLE INTW4rIFICATION PRtJEr
Research Pregram - Jiangsu Pr,v ince
Subject Contents/Methodolay Period Coot
I. Agriculture
1. Incroeu fortility of low-yield soil. Study of moil and fertilizer *Mendaent te.hniquea. Year 1 - Year S 480
2. Ecological benefits of tree planting Study effect on different species and spacing of tree on Year 1 - Year 3 100on crop fields, crop yields.
3. Increas yielde through Quality Seed. Study cultivation techniques and use of quality seeds to Yar 1 - Year 4 400increase yields and production.
4. Sub-surafee pipe drainage for yield Study effsct of sub-surfoce pipe druiengn on yield increases. Year 2 - Year 4 240increase.
5. i"e of fertilizer application equip. Study rsults of equipsnt using injection and broedeasting Year 1 - Year 3 100techniques for applying fertilizer.
Sub-totsl for Agriculture 1320
II. Irrigation
1. Irrigatijn Operatienal Policy. Based on existing conditions, to study beet operational policy Year 1 - Year 2 15which should be simple and applicable to larIe areas.
2. Itter-saving Irrigation Technique. Study different techni4 e-s ost euited to different conditions Year 1 - Year 3 40and acceptable to farmers.
3. Field drainage to improvo soil Study sole hole technique for field drainage improvement; Year 2 - Year 4 20alkalinity-salinity, depth spacing and formation for different soils.
4. Stabilization of canls/drains To study various engineering end biological techniques Year 2 - Yeor 4 20constructed in sandy soils, for soil stabilization.
5. Major Pumping Statiorn:
(a) Pumping sttion efficiency Study station layout, entrance conditions end pump configuration Y*ar 2 - Year 4 114to mximize efficiency end cost effectiveness.
(b) Discharge _muremnt techniques. Study various techniques - ultraonic, manestic and eddy-&trees methods. Year 2 - Year 4 100 Co
(c) Speed-reduction torque converter Study different torque converters to increase efficiencyand reduce energy consumption. Year 2 - Year 4 100
(d) High efficiency Internal Circuit Study system for control, detection, monitoring, storage, Year 2 - Year 4 100detction and monitoring, feedback, re7orting and warning.
(a) Installation Skill of lXin Equip. Study technique and equipment to improve installation. Year 2 - Year 4 100
6. IMjor Irrigation Structures Study *pplica ility of different mjor canal structures not 200yet used in Jinngeu through model testing.
Sub-total for Irrigation 809
III. Agro-Envi ronm_nt CD
1. Water Resources Pollution Monitoring and evaluation of water pollution in project Year 1 - Year 5 200*rac and recommendation of control/mitigation masures toappropiste authorities. U% t
2. Agro-Ecology Study Establish samplo areas for agro-cological study. Year 1 - Year 5 200
Sub-total Agro-rEvironmnt 400
IV. Unallocated 400
TOTAL JIAJ PRIVDICE 2929
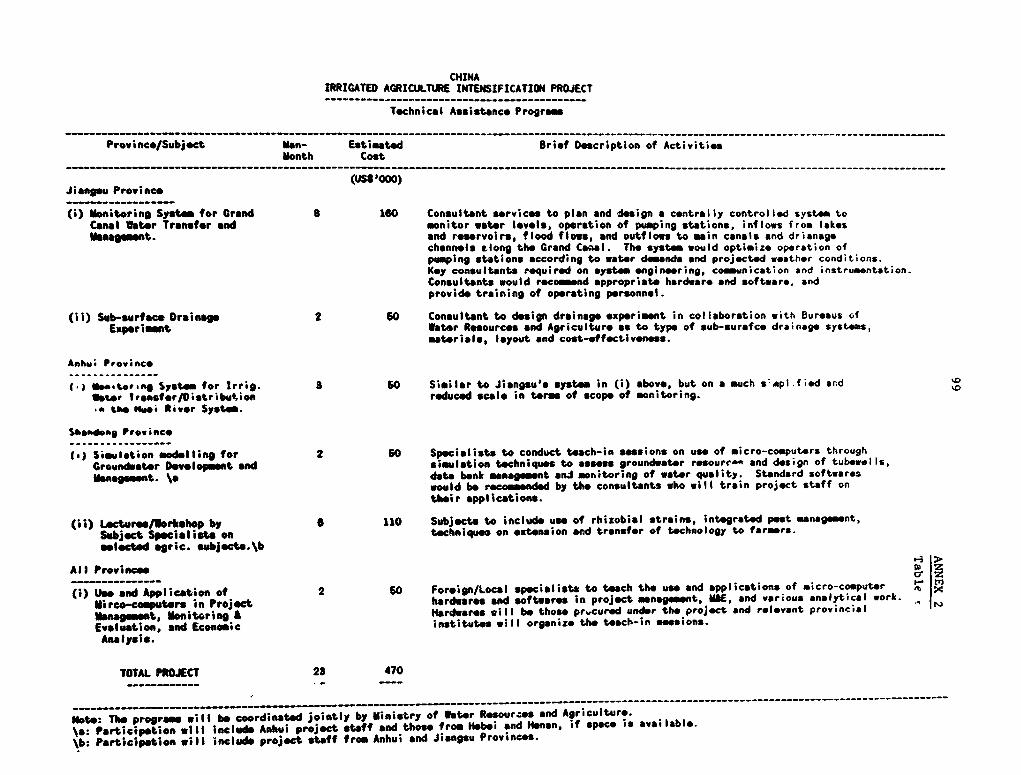
CHINAIRRIGATED AGRICULTURE INTENSIFICATION PROJECT--------------------------------------------
Technical Assistance Program
---------------------------------------------------------- ___-----------------__---------------------------------------------------------__--------
Provinc-/Subject MUn- Estimated Brief Description of ActivitiesMonth cost
(UN '000)Jiangsu Province
(i) Monitoring Systm_ for Grand 8 160 Consultant services to plan and design a centrally controlled system toCanal Water Transfor and monitor water lovols, operation of pumping stations, inflows from lakessangemsnt. and reservoirs, flood flows, and outflows to main canals and drianage
channels tlong the Grand Canal. Th system would optimize operation ofpumping stations according to water demands and projected weather conditions.Key consultants required on system engineering, communication and instrumentation.Consultants would recommend appropriate hardware and software, andprovide training of operating personnel.
(ii) Sub-surface Drainag 2 50 Consultant to design drainage experim;nt in collaboration with Bureaus ofExperim_nt Wator Resources and Agriculture ac to type of sub-surafce drainage systems,
materials, layout and cost-effctiveness.
Anhw; Province
I) ea".ot.ng System for Irrig. 3 b0 Similar to Jiangsu's systm in (i) above, but on a much s*plIfied andOtntr Irenssfr/Distribution reduced scale in terme of scope of monitoring.*m the Muti River System.
S&oam.eg Province_ _ _ _ _ _ _ _ _
le) Simulation modelling for 2 b0 Specialists to conduct teach-in *sesions on use of micro-computers throughGrounduater Development and simulation techniques to asses groundwater resourc- and design of tubewells,Management. Xe data bank m*noagemnt *nJ monitoring of water quality. Standard softwares
would be recommended by the consultants who will train project staff ontheir applications.
(i) Lecturee/Vorkshop by 0 110 Subjects to include use of rhizobial strains, integrated pest management,Subject Specialists on techniques on extension and transfer of technology to farmers.*elected agric. subjecte.\b
All Provinces
(i) Use and Application of 2 60 Foreign/Local specialists to teach the use and applications of micro-computer , XMirco-computers in Project hardware and softwtros in project managent, MHE, and various analytical work.Managomnt, Monitoring IL Hardwares will be those prvcurod under the project and relevant provincialEvaluation, snd Economic institutes will organize the teach-in seesions.Analysis.
TOTAL PROJECT 23 470
… ~ ~ - - --- -------- --- ----- ------ ------ ----------- --------------…----------…
Note: The programs will be coordinated jointly by Ministry of Water Resources and Agriculture.\a: Participation wlI include Anhui project staff and those from Hebei and Henan, if space is available.\b: Participation will include project staff from Anhui and Jiangsu Provinces.

100
ANNEX 2
Table 7A
CHIN
iRRIGATED AGRICULTURAL INTENSIFICATION PROJECT
Key Monitoring Indicators
Indicators Unit 1991 1992 1993 1994 1995 TotnlPlen Act Plan Act Plan Act Plan Act Plan Act Plan Act
,Irr-i-tltonArea t roved:
Surface water haGroundwater ha
Nov area d-veloped:Surface Water haGroundvater ha
On-Farz works ha
Soil IinrowementLand lev.lin# haDeep plowLng bhFortiliser:DAP ton-eL tonUrea tonGypsum ton
Agroceb icals tonPlastic flL ton
PrgotuctlonWheat: Area ha
Yield t/haProduct, ton
Rice: Area haYield t/haProduct. ton
Corn: Area haYield t/haProduct, ton
OllseedtArea haYield t/-1aProduct. ton
Cottont Aren haYield t/haProduct. ton
AmIrast&tNursery haTres planting '000Forest belt haSurvial rate XForest cover X
Aarotech. ExtonaonCATBCUTATS (now) No/NoCATZCITUAT
(rehab) molsoTech:Nousshold RatioPost forecast et&.
staffing soNewv ar, release NoNew tech extend. goiPM haPa_hl-t No
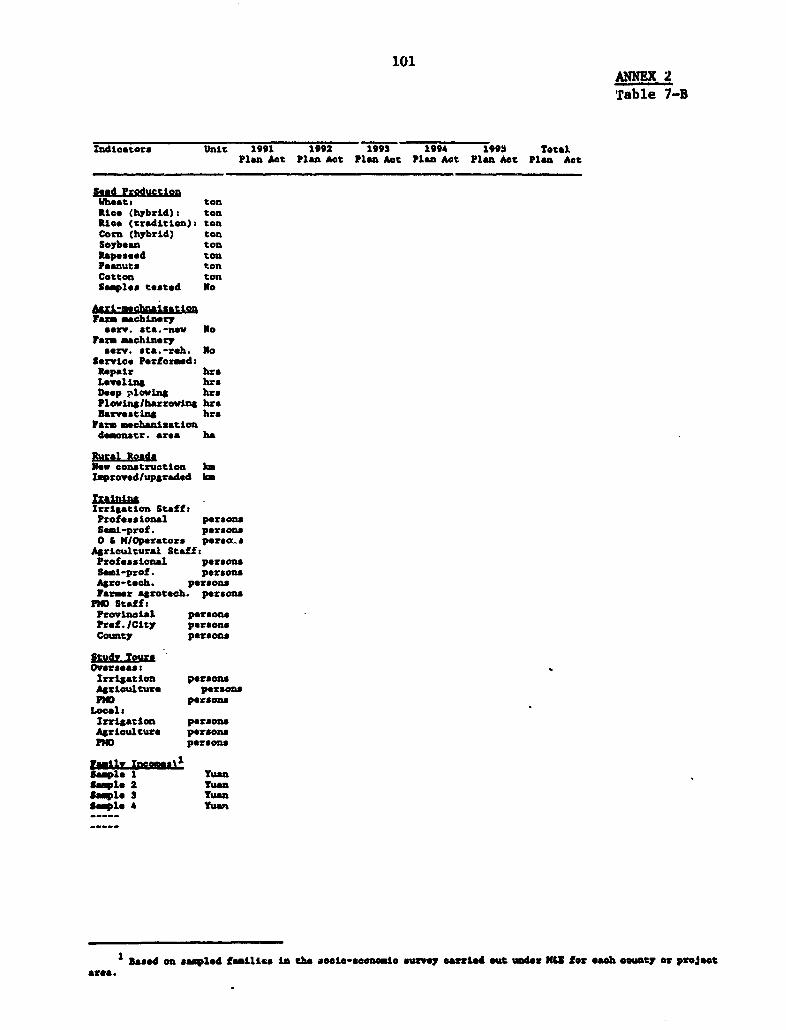
101ANNEX 2Table 7-B
Zndicators Unit 1991 1992 1993 1994 199l Total.Plan Act Plan Act Plen Act Plan Act Plan Act Plan Act
Seed ProductionWiheat: tonRice (hybrid)t tonRice (tradition): tonCorn (hybrid) tonSoybean tonRapeseed tonPeanuts tonCotton tonSamples tested so
Acri-mcbnaisatiomarm machineryt*erv. St& -new No
Farc machineryserv eta. -reh. So
Service Performed:Repair hraLevelins hr.Deep ploving hraPlowlnS/harrowing hraHarvosting hra
Farn mochanisationdeon-tr. &rea ha
Rural RoadsNev construction kmZmproyedlupgraded km
Irrigation StaffsProfessional personsSemi-prof. persons0 & H/Operators perao.K8
4Aricultural StaffsProfessiLol personaSsml-prof. personaAgro-tech. personsFarmer agrotech. persons
PMQ StaffsProvincial personsProf./City personsCounty persons
Study ToursOversoas:
Irrigation persons4Ariculture personsPHO persons
LocalsIrrigation personaAgriculture personsPHO persons
r mil XncomealSspl 1 YuanSmple 2 YuanSmple 3 YuanSample A Yua
1 Based on sapled families in the sooio-aeonlo survy Carried out under H4U for *a4h countY or pro tearea.
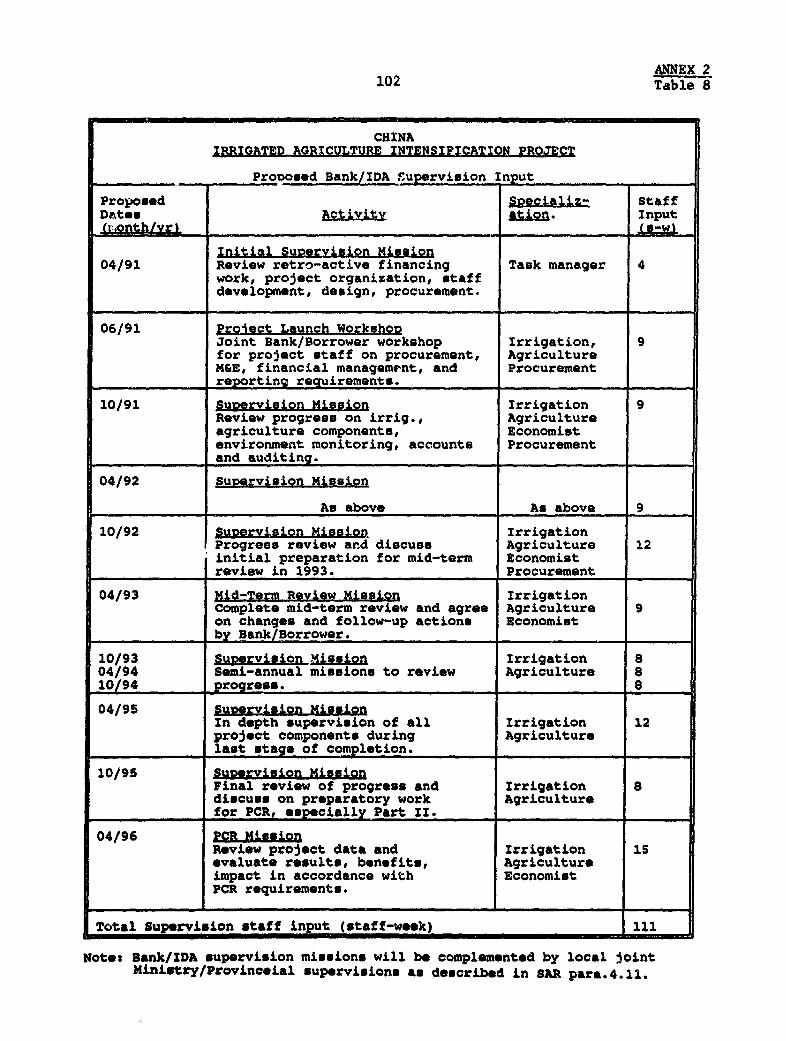
ANNEX 2102 Table 8
CHXNAIRRIGATED AGRICULTURE INTENSIFICATION PROJECT
Procosed Bank/IDA Suporvision Input
Proposed SReci&liz- staffDates Activity amon Input(tIgonthly , _ w
Initial Supervision Mission04/91 Review retro-active financing Task manager 4
work, project organization, staffdevelopment, design, procuremont.
06/91 proiect Launch WorkshooJoint Bank/Borrower workshop Irrigation, 9for project staff on procurement, AgricultureM&E, financial management, and Procurementreporting requirements.
10/91 Su2ervision Mission Irrigation 9Review progress on irrig., Agricultureagriculture components, Economistenvironment monitoring, accounts Procurement
_____________ and auditing. ___
04/92 Su ervision Mission
As above As above 9
10/92 Suorvaijon MissioL IrrigationProgress review and discuss Agriculture 12initial preparation for mid-term Economistreview in 1993. Procurement ___
04/93 Mid-Term Review Misslon IrrigationComplete mid-term review and agree Agriculture 9on changes and follow-up actions Economistby Bank/Borrower.
10/93 SuervisinRI .asioa Irrigation a04/94 Semi-annual missions to review Agriculture 810L 94 _ progress. __ ___ _ 8
04/95 SuoervisLon MissionIn depth supervision of all Irrigation 12project components during Agriculturelast stage of completion.
10/95 Suservision MissionFinal review of progress and Irrigation 8discuss on preparatory work Agriculturefor PCR, especially Part II.
04/96 pCR MissionReview project data and Irrigation 15evaluate results, benefits, Agricultureimpact in accordance with EconomistPCR requirements.
Total Supervision staff input (staff-week) 111
Notes Bank/IDA supervision missions will be complemented by local jointMiniLtry/Provincoial supervisions as described in SAR para.4.11.

CHINA: IRRICATED ACRICULTURE INTENSrFICATrON LOAN Anhui Provincial Project Area: Cropped Area, Yields and ProductionCropped Area Yield Production IncrementalDegre of (1000 ha) X (Tons/ha) (1000 Tons) I ProductionCrop Irrigation Present Future Change Present Futuro Present Future Change (1000 tons)
Wheat Fully Irrigated 220.3 4.2 92S.1Partially Irrigated 6S.3 3.7 216.8Rainfed 144.1 3.0 432.3Subtotal . .202.4 220.3 9 648.1 92S.1 43 277.1Maile Fully Irrigated 47.6 4.6 213.8Partially Irrigated 4.8 3.8 18.4Rainfod 12.0 3.5 41.8
Subtotal ..... ............ 16.8 47.6 183 80.2 213.8 265 153.8Rice Fully Irrigated 101.4 6.8 689.7Partially Irrigated 35.8 6.6 199.2Rainfed 0.0
Subtotal . . 3.6 101.4 185 199.2 689.7 246 490.6Soybean Fully Irrigated 28.0 - 1.8 61.6Partially Irrigated 21.6 1.2 26.9Rainfed 63.4 1.0 51.2
Subtotal . .74.9 28.0 -63 77.1 51.6 -33 -25.8Peanuts Fully Irrigated 9.7 2.4 23.2Partially Irrigated 1.8 1.7 2.7Rainfed 4.0 1.6 6.3Subtotal .. . . .6 9.7 74 9.0 23.2 169 14.3S. Potato Fully Irrigated 70.6 5.2 366.6Partially Irrigated 26.6 4.3 114.3Rainfed 65.7 4.2 272.9Subtotal . . . 92.3 70.5 *.4 387.3 366.6 -S -20.6Cotton Fully Irrigated 21.0 1.1 23.1Partially Irrigated 4.1 0.8 3.3 oRninfed 10.1 0.6 6.9
Subtotal . .14.1 21.0 49 9.1 23.1 153 14.0Vegetables Fully Irrigated 11.9 30.0 35S.0Partially Irrigated 3.0 24.1 72.3Raintod 7.4 23.7 175.4
Subtotal . . . 10.4 11.9 1S 247.7 368.0 45 110.3Coarse Grains Fully Irrigated 18.7 1.8 30.0Partially Irrigated 10.1 1.4 14.2Rainfed 26.0 1.4 36.0
Subtotal .... . 35.1 19.7 -53 50.2 30.0 -40 -20.2Rape Fully Irrigated 21.0 1.8 37.9Partially Irrigatod 3.1 1.4 4.4Rainfed 7.7 1.0 7.5
Subtotal . .10.9 21.0 94 11.9 37.9 217 .2S.9Ssa Fully Irrigated 11.2 0.8 9.0Partially Irrigated 3.0 0.6 2.4Rainf-d 9.7 0 6 4.7 I.Subtotal .13.7 11.2 -18 7.0 9.0 27 1.9Jute rully Irrigated 4.2 2.0 8.4Partially Irrigated 1.7 1.6 2.?Rainfed 4.2 1.6 6.7
Subtotal 5.9 4.2 -28 9.4 *.4 -11 -1.0Total Cropped Are Fully Irrigated 0.0 663.6
Partially Irrigated 174.6 0.0Rainfed 348.2 0.0Total 517.7 5s8.5 9Het Cultivated Are 320.0 320.0 0Cropping Intensity 162X 176S 9
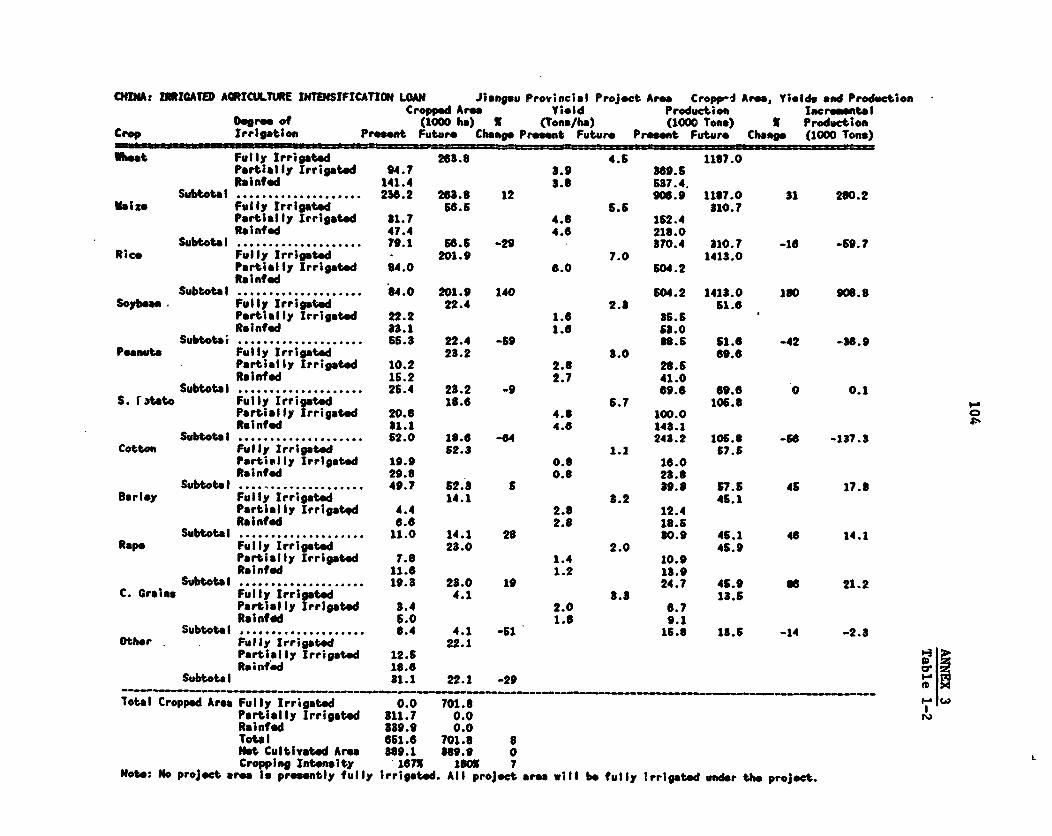
CHDMA: ZUICATED ACRICULTtME INTENSIFICATION LOAN Jiangsu Provinci;l Project Area Cropp- Are, Yields and ProductionCropped Aro Yi-ld Production Increm_ntalDngre of (1000 he) I (Tons/ha) (1000 Tons) X ProductionCrop Irrigat;on Proent Future Change Present Future Presmnt Future Chan" (1000 Tons)Ohet Fully Irrigated 263 8 4.6 1137.0Parti ally Irrigated 94.7 8.9 369.6Rainfed 141.4 3.3 637.4.Subtotal ..... 236.2 263.8 12 906.9 1187.0 31 2t0.2maize Fully Irrigated 66.5 5.6 810.7Partially Irrigated 31.7 4.8 152.4Ralnfed 47.4 4.6 218.0Subtotal . .. 79.1 66.6 -29 370.4 310.7 -16 -69.7Rice Fully Irrigated 201.9 7.0 1413.0Partially Irrigated 84.0 6.0 604.2Rainfed
Subbotal .. .8. #.0 201.9 140 604.2 1413.0 1I0 906.8Soybean Fully Irrigated 22.4 2.3 61.6Partially Irrigated 22.2 1.6 356.Rnanfed 83.1 1.6 5J.0Subtot i . ... S63 22.4 -69 38.6 51.6 -42 -36.9Peanut Fully Irrigated 28.2 3.0 69.6Partially Irrigated 10.2 2.8 28.5Rainfed 16.2 2.7 41.0Subtotal . .. 26.4 23.2 -9 69.6 69.6 0 0.1S. rAatto Fully Irrigated 16.6 6.7 106.8Partially Irrigated 20.3 4.3 100.0Rainfed 31.1 4.6 148.1Subtotal . . 2.0 16.6 -64 243.2 105.8 -56 -137.3Cotton Fully Irrigated 62.3 1.1 57.5Partially Irrigated 19.9 0.0 16.0Rainfed 29.8 0.8 23.8Subtotal . .49.7 82.3 S 89.8 7.S 45 17.3Barley Fully Irrigated 14.1 3.2 4S.1Partially Irrigatqd 4.4 2.8 12.4Rainfed 6.6 2.8 18.6Subtotal . . 11.0 14.1 28 80.9 46.1 46 14.1Rape Fully Irrigated 23.0 2.0 45.9Partially Irrigated 7.8 1.4 10.9Rainfed 11.6 1.2 18.9Subtotal . .. 19. 23.0 19 24.7 46.9 so 21.2C. Grains Fully Irrigated 4.1 8.8 13.6Partially Irrigated 8.4 2.0 6.7Rainfed 6.0 1.6 9.1Subtotal .. ...... 6.. 04 4.1 -61 1.68 13.6 -14 -2.30thar Fully Irrigated 22.1Partially Irrigated 12.5Raoinfd 16.6
Subtotal 81.1 22.1 -20
Total Cropped Area Fully Irrigated 0.0 701.8Partially Irrigated 811.7 0.0Rainfed 339.9 0.0Total 661.6 701.3 6Not Cultivated Area 339.1 U9.9 0Cropping Intensity 167W 1sox 7Note: No project area is preontly fully Irrigated. All project area will be fully irrigated under the project.

0quA: IRRIGATED AGRICULTURE INTENSIFICATION LOAN Shandong Provincial Project Area Cropped Area, Yields and ProductionCropped Area Yield Production IncrementalODgree of (l0o0 ha) S (Tons/ha) (1000 Tons) f ProductionCrop Irrigation Present Future Change Present Future Prosent Future Change (1000 Tons)
_heat Fully Irrigated 327.8 4.2 1376.7Partiolly Irrigated 270.1 3.7 996.6Roinfed 45.7 3.0 138.9Subtotal .31.8 327.8 4 113S.6 1376.7 21 241.2maize Fully Irrigated 1l9.8 6.5 878.9Partially Irrigated 136.0 4.2 569.7Rainoed 19.0 3.3 63.1Subtotal .................... 166.0 169.8 3 632.8 878.9 39 248.1Rice Fully Irrigated 38.2 6.2 224.7Partially Irrigated 29.6 4.9 144.7R'ninfed
Subtotal .29.6 38.2 23 144.7 224.7 65 80.0Soybean Fully Irrigated 45.0 2.0 90.0Partially Irrigated 45.2 1.4 83.7Rainfed 6.2 1.2 7.6Subtotal5 1.4 45.0 -12 71.2 90.0 26 18.1Peanuts Fully Irrigated 18.7 3.0 65.1Partially Irrigated 13.7 2.1 28.9Rainfed 4.1 1.9 8.0Subtotal .17.8 18.7 5 6.9 56.1 62 19.2S. Potato Fully Irrigated 38.4 6.5 200.0Partially Irrigated 29.1 4.3 124.5Rainfed 8.6 4.2 38.0Subtotal .37.6 38.4 -3 160.6 200.0 2S 39.6Cotton Fully lIrigated 80.9 1.0 80.9Partially Irrigated 66.3 0.8 4S.0Rainfed 16.6 0.7 11.4Subtotl .72.8 80.9 11 56.5 80.9 43 24.5Vegetable Fully Irrigated 19.2 38.0 730.2Partially Irrigated 20.1 33.7 677.1Rainfed 1.6 27.7 48.3Subtotal .21.7 19.2 -11 720.4 - 780.2 1 9.8Melons Fully Irrigated 8.3 31.4 262.1Partially Irrigated 6.9 26.8 167.9Reinfed 2.2 21.8 47.9Subtotal .8.1 8.3 3 206.8 262.1 27 56.3C. Grains Fully Irrigated 17.1 2.2 37.5Partially Irrigated 10.3 1.5 15.4Rainfod 4.0 1.S 5.9Subtotal 14.2 17.1 20 21.4 t7.S 78 16.2
Total Cropped Area Fully Irrigated 0.0 749.4Partiolly Irrigated 616.1 0.0 9-3Rainfod 107.9 0.0 °Total 724.0 749.4 4 zaIXNot Cultivated Ares 483.a 433.3 0 I'Cropping Intensity 167w 1735 4
Note: No project area is presntly fully irrigated. All project area will be fully irrigated under tho project.

O0 IIMICATED AatICULTlE 1NT8iIFTCATION LOA ANUI PROVINCE-WIOE PROJECr AREA Economic Crop Budget at full Dorelopl_nt: (Yuan/ha)
Unit Wheat #aiz. Rice Soybean Peanuts S. Potato Cotton Vegetable Coarse (Ireins Rape Sesame Jute
Ita a Unit Price Amount Value Amount Value AsAunt Value Amount Value Amount Valua Amount Value Amount Value Amount Value Amount %alue Amount Value Amount Value Amount Value
A. Presen; Without Project-Rainfed Condition
Yield ton 3.0 3.5 1.0 1.6 4.2 0.6 23.7 1.4 1.0 0.5 1.5S
Price Y/t 1392 1004 1051 1370 1302 420 9806 200 244 1200 2900 2600
Product Value Y 4176 S516 1370 2083 1743 56884 4?40 33S 120D 1450 4030
yprod. Value V 210 735 240 208 378 208 0 442 100 150 930
Total Value Y 4386 4251 1610 2291 2121 6172 4740 '' 131UD 1600 4960
Oraf t An. ha 60 90 90 105 90 10 75 106 90 105 106
Tractor Serv. kg 45 15 15 0 IS 1 0 15 1S 0 0
See" kg 180 234 30 90 90 162 112.5 225 225 135 75 150 7.5 90 60 96 7.5 19 4.5 18 22.5 135
Fertiliaern kg 61.90 127.5 242 75 143 0 55.5 1OS 4S 85 180 342 60 114 3S 57 1OS 200 22.5 43 15 29
P205 Ig 83.25 82.5 268 30 96 45 146 30 96 45 146 120 390 37.6 129 30 96 67.5 219 12 39 67.5 219
Peaticides kg 820 1.5 30 4.5 90 1.5 So 0 0 0 0 12 240 1.6 30 1.5 30 0.5 9 0 0 0 0
Other 45 45 30 0 45 60 0 0 0 0 0
Subtotal 924 570 473 533 517 1347 431 401 552 205 486
Lala.r edagy 3.35 169 533 n17 573 107 357 296 990 170 568 359 1201 525 1759 120 402 144 482 144 482 138 462
Net Vale 2929 8106 780 768 1036 3624 2550 -25 266 913 4010
Return per Neaday 18.4 1U.2 7.3 2.6 6.1 10.1 4.9 -0.2 1.6 6.3 29.1
9. Pr.*est VitmOut Project-Parially Irrigated Condition G
Yield to 3.7 3.8 5.6 1.2 1.7 4.3 0.8 24.1 1.4 1.4 0.6 1.6
Pric V/ 1392 1004 I101 137O ISD2 420 9606 200 244 120D 2900 2600
Product Valu Y 5060 3617 S525 1576 2265 1785 7796 4827 336 1692 1740 4160
Dyprod. Value Y 256 798 316 276 226 387 382 0 442 141 180 960
Total Value Y S6 4615 6241 1852 2492 2172 6177 427 778 1833 1920 5120
Inputs
Draft An. ha 60 90 106 90 105 90 150 75 106 90 * 10S
Tractor Sor. ha 45 15 15 15 0 15 15 0 15 15 0
Se*ds kg 180 234 30 90 22.5 90 90 162 112.5 225 225 135 75 150 7.5 90 60 96 7.5 19 4.5 22.5 135
FertilizerH kg 81.90 i27.5 242 90 171 165 314 7.5 14 57 106 67.5 128 195 371 75 143 45 6 120 228 22.5 43 150 285
PXS kg 83.25 82.5 266 45 146 49.5 161 45 146 30 96 45 148 75 244 37.5 122 30 96 67.5 219 12 39 75 244
Pesticides kg 120 1.5 30 4.5 90 7.5 150 1.5 30 0 0 1.2 24 12 240 1.5 30 1.5 30 OS 9 0 0 0 0
Other 45 45 60 30 0 45 60 0 0 0 0 0
Irrigation .3 256 a 533 17 6649 199 51 1 S1 1 0 0 533 17 691 111 0 0 191 6 0 0 0 0
Subtotal 932 664 1093 489 S37 S84 1246 570 429 S66 205 769
Labour aday 83.35 159 533 171 573 239 794 107 357 296 990 170 568 359 1201 525 1759 1O 402 144 4b2 144 482 138 462
Not Value 3671 5378 4349 1007 965 1020 5730 2496 -53 764 1233 3889
Return per lbnday 24.3 19.8 18.2 9.5 3.3 6.0 16.0 4.6 -0.4 5.3 8.6 28.2
I-
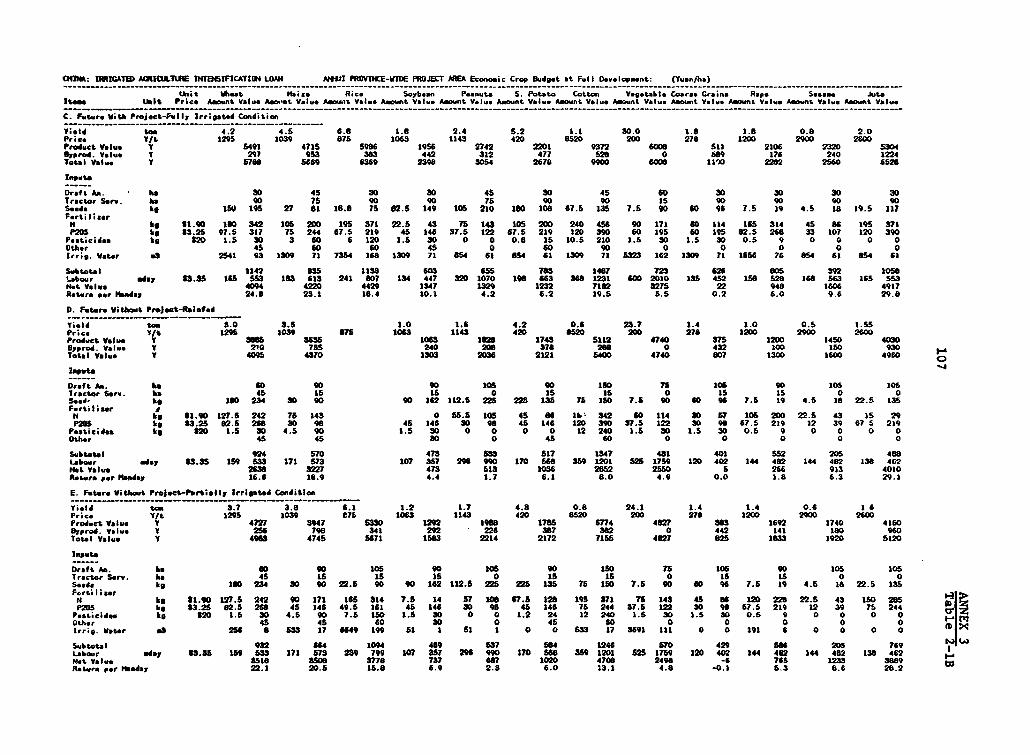
"TlN: DICLATlD ACRICUL71AE INTE8SIPICATIO4 LOAtN NMI PItOVTNCE-VTI)E PROJECT AREA Economic Crop Budget at Full Development: (Yuan/ha)
tA,.t Wheat Ne.zso Rice Soybean Peanuts S. pottow cotton Vegetable Coers. G'ains Rap. Seas"m JutsItems wsit Price Amount Value Aeo.-nt Value Awoutit Value Amount Val.. Awount Value Amount Val.. AmounL Volvo Amount Valu. Amount Value Asmout Value Amount Volue Amount Value,C. Future With Project-Fully Irrigated Condition
yield ton 4.2 4.5 6.8 1.8 2.4 5.2 1.1 30.0 1.0 1.8 0.0 2.0Price V/I. 1295 1039 875 1063 1143 420 8520 200 278 1200 2900 2600Product Valuo v 5491 4715 59o" 1956 2742 2201 9372 600e 511 2106 2320 5304Syprod. Value 1 297 953 383 442 312 477 52 0 589 178 240 1224'Fatal Velua v 5700 5669 6369 2398 3054 2678 9900 6000 11)0 2202 2560 6528
DrfA.. ha 30 45 30 30 45305603 30 30 30lractw Serv. ha 90 75 g0 90 75 90 90 Is 90 90 90 90seeds kg 150 195 27 81 18.8 75 82.5 149 905 210 to0 100 67.5 13 7.5 90 60 95 7.5 19 4.5 la 19.5 117FertilizerSt kg 31.90 1SO 342 106 200 195 371 22.5 43 75 143 106 200 240 456 90 171 60 114 165 314 45 06 195 371P205 kg 83.25 97.5 317 75 244 07.5 219 45 146 37.5 122 67.5 219 120 390 60 195 0.0 195 82.5 268 33 107 12 390Psot;cides kg: 020 1.5 30 5 60 6 120 1.5 30 0 0 0.8 15 10.5 210 1.5 SD 1.5 30 0.5 9 0 0 0 0other 45 60 60 45 0 so 90 0 0 0 0 0Irr,g. vater m2 2541 93 1209 71 7354 168 1309 71 054 61 054 61 1309 71 f323 162 1309 71 1I56 76 054 61 654 61
subtotal 1142 835 113s 603 635 703 1407 723 626 005 392 l0s0Labour odor 03.35 163 553 183 613 241 607 134 447 320 1070 190 663 300 1231 600 2010 135 452 158 528 160 563 165 553Net Valuo 4094 4220 4429 1347 132 1232 7162 3275 22 940 1606 4917Return par HNeada 24.6 23.1 10.4 10.1 4.2 6.2 19.5 5.5 0.2 6.0 9.6 29.0
0. Future Without Pr.ject-Rainfmd
Yield tom 3.0 3.5 1.0 1,0 4.2 0.6 23.7 1.4 1.0 0.5 3.55Price 'fIt 1295 1039 076 1063 11.43 420 am2 200 270 1200 2900 2600Product Vaiue V 386 3635 1063 102 1743 5112 4740 375 1200 1450 4030Bygrod. Value v 210 735 240 200 376 266 0 432 100 130 930Total Value V 409 4370 1303 203 2121 5400 4740 607 1300 1000 4950
Draft Am. ke so 90 90 105 90 1S0 75 108 90 105 105Iractor Sery. ha 45 15 1s 0 15 is 0 Is 1s 0 05ee40 kg 1SO 234 20 go 90 162 112.6 225 225 135 Is 130 7.5 go 60 96 7.5 19 4.5 28 22.5 135Fertilizer ItN kg 61.90 127.5 242 75 145 0 55.5 lOS 45 N 06 1 342 60 114 30 57 105 200 22.5 43 1s 29P285 kg 63.25 02. 20 30 90 45 146 30 90 45 146 120 390 37.5 122 30 90 67.5 219 12 39 67 S 219Pesticides kg 62 1.5 30 4.5 90 1.5 30 0 0 0 0 12 240 1.5 30 1.5 30 0.5 9 0 0 0 0Other 45 45 30 0 45 60 0 0 0 0 0
Subwtotl 924 570 473 533 517 1347 431 401 552 205 480Labour Edgy 63.35 359 5S3 171 573 107 357 296 990 1.70 560 359 1201 5s5 1759 120 402 144 482 144 482 138 462Net value 2638 3227 473 513 1036 285 2550 5 266 913 4010R.turs per lwWady 16.6 10.9 4.4 1.7 6.1 8.0 4.9 0.0 1.8 6.3 29.1E. Future Without Project-Partislly Irrigated Condition
Yield ton, 3.7 3.8 6.1 1.2 1.7 4.3 0.0 24.1 1.4 1.4 0.6 1 6Price fIt 1295 1039 875 1063 1143 420 8520 200 276 1200 2900 2600Product Value V 4727 3947 5380 129 1it8 178S 6774 4627 265 1692 1740 4180Syprod. value v 256 796 341 29 226 387 302 0 442 141 360 960Total Value v 4903 4745 5671 1503 2214 2172 7135 4027 82 1033 1920 5120
Draft Am. ha s0 go 105 90 106 90 IS0 75 106 go 105 105Tractor Ser,. ka 45 Is 15 15 0 15 15 0 i5 t5 0 0Seude kg 160 234 30 90 22.5 90 90 162 112.5 225 225 135 75 150 7.5 90 so 96 7.5 39 4.5 18 22.5 135f6rti Ii irN ~~~ ~~kg 51.901IV.5 242 90 171 165 214 7.5 14 5710O667.5 128 195 071 76 143 45 66 120 228022.5 43 150 265PM0 kg 83.25 62.5 266 45 146 49.5181 45 146 30 90 45 146 75 244637.5 122 30 96 67.5 219 12 39 75 244 ~Pesticide. kg M2 1.5 30 4.5 90 7.5 150, 1.5 30 0 0 1.2 24 12 240 1.8 30 1.5 30 0.5 9 0 0 0 0Other 45 45 s0 30 0 45 60 0 0 0 0 0Irrig. Water lal 256 0 833 176649199o 51s I 51 1 0 0 833 17 3091 III 0 0 191 6 0 0 0 0
Subtotal 932 664 1094 489 837 564 1246 S70 429 56 205 769 Labour edgy 62.35 19 532 171 873 239 799 107 357 296 9"O 170 S68 359 1201 525 1759 120 402 144 462 144 482 138 462Met Valvo 3516 85061 3770 7137 0647 1020 4700 2490 '4 76S 123 3089 Reture pef NOAndY 22.1 20.5 15.0 6.9 2.3 6.0 13.1 4.0 -0.3 5 .3 8.6 20.2 U

O(DlI: ~I0AJT6 AMSO.LIM DI1UGIICATION LOAN JXAICSU, PIlOVUE WmD PRojScT AREA Ecmonoic Crop Oudget at Futl Development; (Yusn/ha)Lits Wheat ma.Z.- -Ri ce ------ "ean- Peanute .Pto Cotton --------- A... Caos. Cram.
It,. unit Pries Amount Voluo Anoint Voluo Asmont Vulvo Amount Value Asownt Value Amount Voluo A~ant Voluo Amount Value Amount Value Amount Valuo
A. Preaemt Without Projoct-Ra.gfedYield too 3.8 4.8
1.8 2.8 4.6 0.8 2.8 1.4 1.8
Price V/t 189 1004 1061 1370 1302 570 9006 698 1202 244
Product- a Y 8289 4641 g12 3648 268 7355 1906 is"7 439
0IN.nDd. Vt. v 289 262 112 142 16 699 225 t2o 110
1.1.1 Va)u 1 ab1e 4903 2286 878 2818 8064 2131 1oo1. 549
Ibouts
seed, kg 240 884 54 181 100 180 200 700 480 455 60 150 240 360 7.5 28 53 105
Hi troge kg 10.632 780 498 73 465 180 98 195 123 180 114 790 499 660 417 406 256 150 96
P205 kg 10.335 890 131 330 III 230 7" 225 78 180 60 488 145 390 131 30D 10! 150 so
Potaseice heg*0.7'05 15 11 1s 11 is 11 60 42 80 21 15 it 0 80 21 is I1I
Organic lhnu'. V 620.00 14.3 285 9 160 7.5 180 10.5 210 10.5 210 16.5 830 12.6 255 9 180 2.3 45
Peeticid. kg 814.50 4 88 3 44 2.1 30 4.2 61 1.5 22 11160O 4 58 3 44 2 29
Crafrt An. wday *7.25 10.4 75 13.5 90 14.8 108 10.7 77 15.6 113 11.1 s0 7.5 84 11.4 83 3 22
Sheeting Its 10.00 0 0 0 4.5 45 11.6 LI16 25.6 258 0 0 0
Ag. Neck. Sarv,.Plowing 1 67 92 83 94 48 55 65 88 40 50 6 1122 74 100 59 96 8 7
S.;.,' S*78.0 19 is 3 2 8 2 19 18
#hrveeking S 197.50 17 17 0
6 $Subtoual
1.560 1184 69? 1492 1180 1745 189 6on 368
Lekour m.dt 13.35 173 576 171 574 145 486 206 686 21 718 488 1626 154 518 159 56A 124 415
No.t Vale. 3380 3143
1073 1580 94 4*8 -2 462 -2890
Return par #NNdaY 19.6 18.4
7.4 8.2 4.4 9.7 1.4 2.8 -1.90
8. Present Without Pro.ect-P.rtialpfljt rrigated ConditionVield to. 8.9 5.0 5.4 1.6 2.8 4.6 0.8 2.6 1.4 2.0
Price et. 389 1004 1051 1870 18 570 an6 9 1202 244 8
Product Value 5866 am2 567 2124 8145 2w3 7453 1940 17C48
Neprod. Volvo 1 28 262 288 132 142 165 C"992 125 110
To%* Ift alue 1 5598 828 5961 226 878 2818 65 2166 1801 596
Inputs
Seeds kg 240 384 54 181 33 215 100 180 200 700 480 455 60 150 240 860 7.5 28 58 105
FertilIizerk,troge. kg 10.682 7810 498 735 465 810 512 180 95 i95 1so ISO 114 790D 499 66) 417 405 256 1S0 95
PM0 kgp 10.335 890 181 S30 III 89 181 230 70 225 75 180 60 485 146 890 131 300 101 1.5 50
Potassium kg 10.705 1s 11 15 it is 11 1s I1I 60 42 30 21 Is 11 0 80 21 is is
Organic Manura T *20.00 14.8 205 9 180 15.5 270 7.5 180 10.5 210 10.5 210 16.5 330 12.8 258 9 18 2.3 45
Pesti C;de., kg *14.50 4 Be a 44 4.5 65 2.1 30 4.2 51 1.5 22 11160O 4 Ss I 44 2 29
Draft An. wday *7.25 10.4 78 18.5 90 22.7 164 14.8 106 10.7 77 15.6 113 11.1 80 7.5 54 11.4 83 8 28 c
Sheeting kg *10.00 0 0 6 60 0 4.5 45 11.8 116 25.8 258 0 0 0 .iz
rArinck.er S 67 92 83 94 81 94 48 55 65 as 40 so 61 112 74 100 59 96 S 7
Sewing 8*78.00 19 is 3 2 0 8 2 19 15is1*
Nerveet 1 *97.50 17 17 0 28 21 8 6I
lrrig. Vater s3 60.003 150 a 900 3 1207 36 480 1 900 3 90M 3 18 8 1440 4 la00 4 900 3
Subtotal 16 1167 I87 699 1426 1158 174* 1400 Ws66
Labour maui *3.35 173 578 171 574 252 843 M4 486 205 806 218 713 485 182* 14 115 1*9 56* 124 415
Not Value a4m 85124 8am 1072 1I7" 943 4773 251 429 -183
Return per Nandai 20.0 20.6 14.1 7.4 8.2 4.4 9.8 2.6 2.5 -1.8

Ca3NR. Isim A3610L11M IIIDSIICTI LOWn .iIm93j F1NC3 VW OWJE AM Ebomale crop sweet at full ev.luosolm: (T.Om/be)Shill Wiost hug~Ws Nice. s"bhm Pooot.. S. Peotao Cellos orief hae" Come". Oreips
C. Fv.1.. Wita.h o.tFSi ris C4sdlllss
Welid too 4.i 6.0 7.2 2.3 3.6 5.9 1.1 3.2 2.0 3.2Price V(, 129 1039 61 1063 1143 S70 am2 6on i32 276prodo" Val" s666 6Om 6301 2467 4114 am6 9713 324 2406 onkppr.. Value. V 276 323 326 373 936 26 169 270 16 IS5Total Value V 61so 66M 662 2661 6am 661 10 11 257 no6
seed. kg 16026662.6 176 30 M9 90 162 2276M M6 264 U4 136 160 270 6 t1o so 9Noi rg. kg 60.632 945 5t7 9OM 669 9 61 191 123 496 613 265 12 1065 673 3 589 460 26 240 toI's k 60.335 570 its 463 I56 495 166 360 121 405 1al6 115 1o6 600 201 110 171 40 in6 240 s0Poteeeiu on to1.705 106 74 S0 21 135 9 90 63 160 106 120 as 1i5 95 30 21 60 62 20 23Orgosic IHaure I 62.00 19.5 390 13.5 270 19.5 390 10. 210 Ls 600 16 300 21 420 is SW0 12 240 5.3 iCCP-eekIcidie &M Sl4.30 3.0', 73 4.0 so 6 67 4 so 6 73 2 29 9131 6 73 3 "4 2 29Draft Am. weyi 67.25 3,', 26 4.7 34 12.9 94 10.1 73 4.6 35 9.5 69 7.1 St 5.3 311 7.7 05 2.3 16IshetiIs kg 610.00 a 7.5 75 13.6 116 6.3 63 22.5 226 14.3 14- 36.9 369 0 00"P-iulag 1 62 113 76 116 91 106 66 76 64 113 63 is 67 136 79 107 76 1In is 20Saeig 1673.00 45 16 17 is I 1 22 17 4 6 23 1sShrwees, 1 697.60 45 6 0 42 41 13 13Irrig. Viler .3 60.0047 2775 13 Iw00 6 10260 46 900 4 1600 a 1600 6 32210 11 210 13 2230 I1 MM0 6
5.lital 1647 146 197 990 209 1161 3234 156 957 "I1Labour M.d 53.36 179 o60 166 61 2 63O 146 496 215 72 234 76 490 1642 1I4 646 170 97 my s 424Hot. Valu. 3711 4445 3796 1178 3234 1443 602 - S1016 IN6Rotw.. per- thadle, 20. 7 24.2 14.6 7.9 10.4 6.2 12.3 2.2 1.7 1.0
D. future VIWile Pre)cl-Aeimfod
Vield ter 3.8 4.6 1.7 2.6 4.6 0.6 2.3 1.4 1.6Price 1 19 s0on 676 1063 1143 670 63m 69 I20 276routVolvoI1 492 479 163 at9" 2633 w16 1606 1677 SW0Oveto. Val". 1 32 262 132 142 1U5 699 225 12 I10Teolt Volvo V 5131 606 1966 334 2611 7116 2131 1301. 610lapel.l'
Seeda be 240 U4 64 Is& 100) 1110 92 711 40 45 6 4 60 10 SW0 N60 7.5 23 a3 me '0Pteril ler %Itro.s k 60.632 7110 493 M6 465 130 is It5i 198 3 60 104 760 49 6"D 417 406 266 130 95P93 kg60~~~~~.335 s90 131 no011I 210 TO 226 75 160 60 436 146 M9 13l 10 3010 160 60Potamli. kg 60~t.7 35 I I I is I I 15 1 I 60 42 s0 21 is I1I 0 so 21 is 112Orgernic Ihasre 1 2.00 14.3 265 9 16 7.5 150 10.1 210 10.1 210 Ws. 320 12.6 23 9 160 2.3 41Peoillede he 614.60 4 s60 3 44 2.2 30 4.2 62 1.5 22 is 160 4 51a 3 44 2 29Oroll Am. wdiy 67.25 10.4 73 13.1 96 14.3 105 10.7 77 15.6 113 11.1 so 7.5 64 11.4 U3 3 22so".p. k he610.00 0 0 0 4.6 43 11.6 116 23.6360 0 0 0
2 6~~7 92 GI 94 46 as 66 a 40 60 61452 74 130 69 GO a 7Sma I673.00 29 18 3 2 a 2 is 1lhrv.eli.g 6 3197.60 17 a? 0 665.11.1.1 116 3116 67 1309 1160 0745 136 6Lelser m.d MI.SS 173 676 171 574 144 452 206 666 212 713 43 16m 134 13 189 666 12 438not Value 3013 am0 767 1146 946 4145 209 432 -166Roet.., per Shaodo, 17.5 16.3 685.6 4.4 6.3 1.4 2.6 -1.41. V.1.w. WilIest Pr.j.ct-P.rtll.l Irrlu.od Ceidllosef
Yield mer 4.0 5.0 5.4 1.7 2.6 4.6 0.6 2.6 1.4 2.0 2pric. Vi 129 6069 67 I0103 1143 570 M6M 66 12012 217,6 a,Prtodut Vi.I. V 316 319 472 124 S1t" 263 "16 It40 1i77 S"6 F S"rprd. Volvo V 226 262 26 132 142 166 699 93 125 110 (D.teUI Vil.. V 3410 64m 6014 1966 3a4 2615 731 2166 130 S"
Sued* kg 240264 34161i 2320 m 1012 93766n 460 45 601NO240260 7.5 22 1616 FertliIgr"Iigrowmi Ikg MAN6 760 493 ?25 468 310 S12 130 95 195 12 13 114 790 49 NO0 417 406 266 10 ISFMS hg 60.338 690 052 330 III 390 131 210 70 293 75 Igo 60 425 146 no Sal 200 101 I60 s0P.leo.is. he 30.706 IS a I is I I is as I5 I1I 40 42 so 21 15 13 0 0 21 Is 13aOrasC Io T. 1 62.00 14.3 265 9 16 1.5 270 7.6 nSo 10.5 210 10.5 210 16.5 230 12.6 26 9 130 2.8 46Poilield. $gI624.3 6 66 3 4 73 2.1 20 4.2 61 1.6 22 11 160 4 60 3 44 2 29Draft As. ideg S67.5 10.4 75 1.3. 96 22.7' 164 14.2 1US 00.7 77 15.6 113 11.1 60 7.5 U4 11.4 a6 3 22?SS.eeii kg 610.00 0 0 6 so 0 4.5 456 11.5 126 26.6 266 0 0 0ApIe.9 S 67 92 a 94 61 94 46 65 65 a 40 60 6t 112 74 no0 so 9 S 7$wrine S 67600 19 1s 3 2 0 a 229 1Ohi,,eet 6 697.0 17 37 0 32 21
Irrig. vat.r Ms69.00? 1300 7 "D 4 3207 67 460 2 600 4 960 4 106 S 1440 7 1300 960 4$vbtw%a$ S56 1126 lo 700 1514 1164 2704216Lates m.d 661.31 113 Ws 171 674 262 642 14 462 306 21 713 46611" M626 1 4 5139 169 666 16 2416Ski %elp. me5 a6m 266 76 13m 942 4340 248 427 -116Router per Shsdt 14.9 21.6 10.2 1.1 1.6 4.4 6.6 1.6 2.5 -0 9

C1INA: IMICATED ACRlCULTURE NT8E!IFICATION LOAM HA4NDONG PROYVICE-WIDE PROJECT AREA Crop Budget at Full Development: (Yuan/ha)
Unit Wheat "aize Rice Soybean Peanuts S. Potato Cotton Vegetable Mlons Coarse GrainsItem Unit Price Amount Value Amount Value Amount Volue Amount Value Amount Value Amount Value Amount Value Amount Value Amount Valuw Amount Value
A. Present Without Project-Rainfed Coendition
Yield ton 3.0 3.3 1.2 1.9 4.2 0.7 27.7 21.6 1.5Price Y/t 1392 1004 1061 1370 1302 673 9806 200 400 244Product Voulo Y 4205 3315 1644 2474 2827 6864 5540 8640 353Byprod. Value Y 161 198 72 317 532 87Total Value Y 4387 3513 1716 2791 2827 7396 5540 6640 440
Inputs
Draft An. he 45 75 30 45 45 75 30Tractor Serv. ha 60 30 4S 60 45 90 90 45Soeds kg 150 300 35 68 75 180 200 340 225 75 120 1.5 60 1.5 375 37.S 90Fertilizer kg 80.50 1050 525 900 450 150 75 225 113 15O 75 1025 525 1500 750 750 375 450 225Pesticides kg $40.00 3 120 2.5 100 2 8O 3 120 1.5 60 9 360 4.5 180 1.5 60 1.5 60Other a5 85 30 90 90 90 120 S50 30Irrig. Water m3
Sutotal 1135 798 425 753 555 1215 1200 1450 480Labour mnday 83.35 154 516 155 519 103 345 197 660 199 667 378 1266 216 730 355 1189 75 251Net Value 2736 2196 946 1378 1605 4915 3610 6001 -291Return per Mandey 17.8 14.2 9.2 7.0 6.1 13.0 16.6 16.9 -3.9
B. Present Without Project-Partially Irrigated Condition
Yiold ton 3.6 4.2 4.9 1.4 2.1 4.3 0.8 33.7 26.8 1.5
Price Y4t 1392 1004 10S1 1370 1302 673 9806 200 400 244Product Value 5011 4219 5095 1891 2695 2874 7S51 6746 10720 353Byprod. Value Y 216 252 291 83 346 S5O 87Total Value Y S227 4471 S386 1974 3041 2874 8136 6748 10720 440
Inputs
Draft Am. he 49 a8 60 34 48 57 7S ils 112 33Tractor Serv. he 82 120 30 52 73 63 135 122 51Seeds kg 147 294 36 90 80 160 75 180 207 352 150 225 75 120 1.5 60 1.S 375 36 86Fertilizer kg 30.50 1253 627 1026 614 1425 713 284 142 312 156 247 124 1260 .630 1766 693 1009 505 469 235Posticidos kg 840.00 3.9 156 3.0 118 4.5 10 2.7 108 4.2 168 1.5 60 10.5 420 4.5 160 1.5 60 1.6 63 . i
Other 129 125 225 70 136 113 127 140 150 41 - 8Irrig. Water *3 60.030 2935 87 1583 47 8899 265 58B 18 8C0 24 327 10 1119 33 6953 207 2253 67 872 26 r
Subtotal 1424 963 1723 S82 936 661 1466 1741 1391 534 r' 4oLabour mnday 83.35 154 516 165 519 270 905 103 345 197 660 199 667 378 1266 216 730 8SS 1189 75 251Net Valve 3287 2969 2759 1047 144S 1546 56u1 4276 6140 -345 WReturn per Handay 21.3 19.2 10.2 10.2 7.3 7.8 14.2 19.6 22.9 -4.6 >
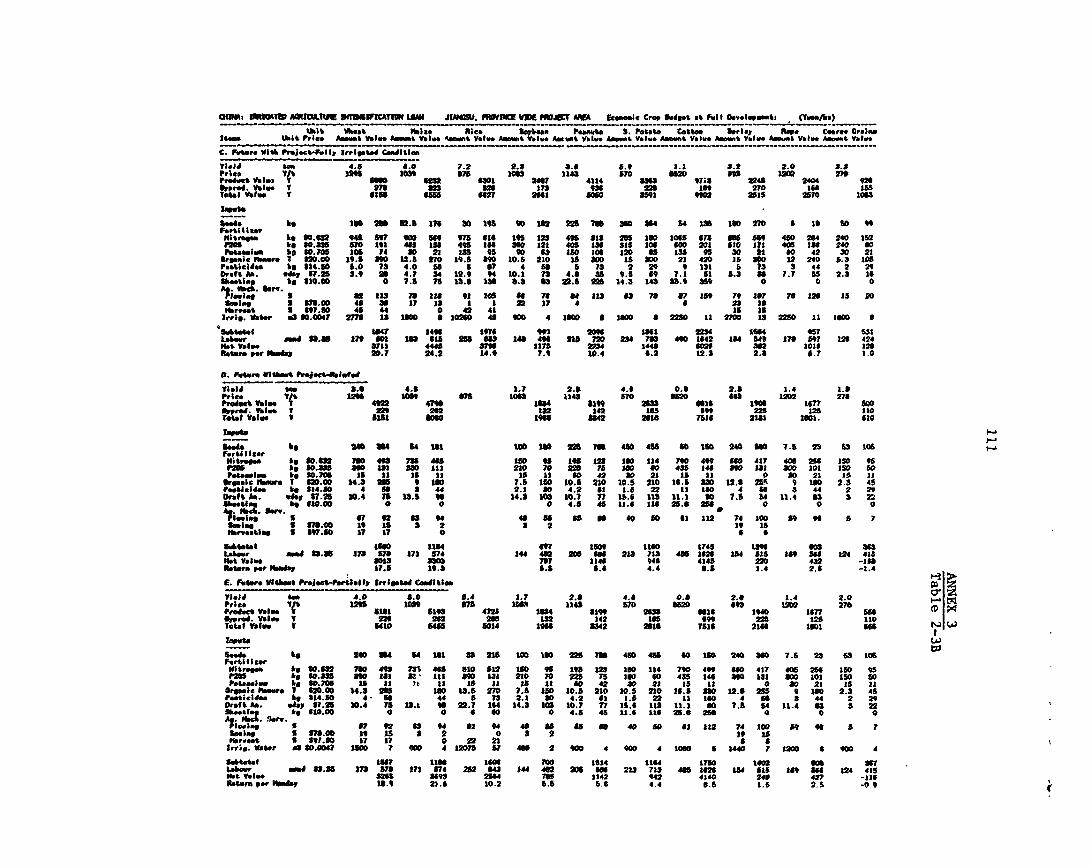
04a16i O1641W AIMML1IM DEN3TCAMT6 LOM J1MMW. FPa6YI VWI MWl AM IC... Crop 11wlle% as FtI 3 "opmt ('t.../p)stom ~~vft$% Vaeat "Al&* llit& III.a eu.aI PP.11. Cl. rio)j hae. comr.. Crin&e
thtPrice AD.l VAlve Amommt V.lo. Amugmt Val*e Amml Volvo Amwuet Va1v. Amu..t V.3., Ammumt Volvo A A Volvo Auwavt Val"e J..u.t Vat".C. rut.r. With Pr.ject-ful i rrigated CoodltlesY3ied Wm. 4.5 6.0 7.2 9.3 3.* 6.9 3.1 1.3 2.0 3.8
Pr).. '11 129 1030 675 106n II443 "5m70i "a20 395 120 27 92
.4.06" VWl. am59 GM3 6n01 243? 4114 583 41 24 24104 6
OprPrd. Volos V 27 82 523 175 in8 26 1ft 20 I6" l55
Tolt# Wtin I 6216 "a5 6627 2661, 606 8591 9402 2515 2670 low3linde h~Ie too go 82.5 116 30195t 401628 25 7is 380 64 14135 15027 a to6 30 "lais hs 60.63 944 567 00 664 75 16 1S" 123 4166 1 285 160 1063 6T3 665 56 450 394 240 182
3265' be 60.3135 *70 1 445 IN6 448 366 NO0 321 405 1S6 318 10 00 I 201 530 37l 406 IN 240 60
360.681.. he 50.705 306 ?4 30 21 138 5 40 63 ISO 306 120 88 1335 98 30 13 OD 42 30 23
ariak3 Vamors 7 62.00 14.5 M 59 3.5 27 14.5 S90 10.5 210 is Soo i5 300 21 420 i5 390 12 240 3.3 106
F..t3id.ss Is heSIOS0 5.0 73 4.0 5 a 67 4 516 5S 78 2 29 94131 3 73 3 44 2 29
Draft 14. w4ey 67.25 3.4 2 4.7 34 12.9 44 10.1 73 4.8 85 9.8 69 7.1 81 5.3 66 7.7 55 2.3 16
1h..t1s Ia 610.00 0 7.5 75 13.0 1*8 3.5 58 22.5 225 14.3 143 35.4 159 0 0 0% .le St 6 231 7331s6 o 9305 66l 76 of113 63 76 67 159 791it? 73126 35 20
se.1*g S 6711.,0 45 n 35 7 Is I 3 22 37 4 6 93 Is
Varwoat U 6471.80 43 44 0 42 41 is as
Itrrl. Valor .3 60.004? 2775 13 1600 10260 46 400 4 1600 a 3600 6 220 1 2700 13 2280 11 2600 6SAtelale
my4 3446 9 1690" 204 Su6l 2284 1664 48 631
Lalour am. 85.385 179 o60 163 15 205 U38 14 496 21 72 234 768 490 1642 1644 549 173 597 16 424
11, t Vale 3r11, 4445 am6 3175 2234 1443 602 362 1015 126
R.tur. pet Ibmapt 20.7 24.2 14.9 7.4 10.4 6.2 1.2. 2.3 5.7 1.00. Puwt.r Vitheet PmJ..-btleed
yield lWm 5.6 4.6 1.7 2.5 4.6 0.6 2.5 1.4 3.6
Price 146 126 1069 6 1063 1143 570 am2 S93 1202 278
Produck Va.1. 46Z2 4746 1954 319" 2633 916 196 1i7" 500
epprod. value I 226 262 IN2 142 IN, 6S" 225 i2n 110
T.143 Valve v flat N06 1466 SW4 2616 756t 21*3 1601. 610Seeds ~ be240660
5416 10018 2 76 450 485 60180O24068 7.1 39 1510tog11;e. be 60.62R 760 443 736 468 to0 IS Its 12o 3 114 74 449 60 417 406 236 380 9
ri be 50.33 s90 1311 no0 1l 230 70 125 75 *60 40 435 146 390 ai a00 303 I80 80
PO&Nasle ft60.70 Is 11 is 11 to is 60 42 30 21 15 13 0 s0 21 is 11
Orgaalcthur O62.0 34.3 265 I 16 7.8 1I0 10.1 230 70. 5 210 16. 5 330 12.8 M~ 9 160 2.3 45
Cuelicdee be 614.90 4 9 3 44 2.2 60 4.2 61 1.6 27 12 ISO 4 n 86 5 44 2 29
Onft As. whyp 67.28 10.4 75 13.5 IS 14.5 103 30.7 7? 15.6 113 11.1 60 7.5 54 11.4 63 3 22
Eheelima be 610.00 0 0 0 4.8 46 11.6 116 23.6 286 0 0 0
A,.eibgS. S f 6 92 63 44 46 0 a es6 40 60 61 112 741IOD so 96 a 7
1MN 67.00 19 15 3 2 3 2 14 is
Ibry.,tlmg 1 647.9 17 17 0
6 68.L"11ul
g36 3164 697 180 1160 1748 166 6an 36
LA~ou sad 33.36 173 573 171 574 144 462 06 "6S 233 713 481 1626 154 515 16 S66 124 415
"at Values S013 a30 76 1146 946 4145 2 432 -169
bouts wa Monday 17.5 10.3 5.5 6.6 4.4 6.5 1.4 2.6 -1.4
E. Future Vlikiutu P.et.t.lf, rlgatd Ca.odStlefviola "ae 4.0 5.0 5.4 3.7 2.6 4.6 0.S 2.6 1.4 2.0 p.
Price fI 16 on5 WA8 1no 1H4s W70 6O2 63 1I0 275
product, Vol.. fl56 5343 472 1654 3199 2633 9516 3940 1677 S"6 m X
00red. Volvo V 226 262 "66 132 242 365 699 225 125 110
TobEf Volvo v 6410 "a* 6034 It"6 3342 2616 7516 2166 1901 66S"- S"e" Le 240664 6455 l 52t 1018 2 251O6O6Mt480 465 60 160 240360 7.5 23 3 106 t
FortMIlgrlotrege be 60.682 760 443 73 465 SW 512 150 95 195 1139 10 114 740 49 660 437 406 266 10S
=395 69610.335 360 as3 5 Ill *90 131 230 70 228 75 360 60 435 346 890 131 300 101 I50 80
p.1...). he 50.706 1sI5 I1 I As S5 I Is 1I I 4t 42 80 21 is a1 0 0 23 Is I1I
Crg.3c beer. I 620.00 14.8 265 16 13.5 M 20 7.5 1HO 10.5 230 10. 5 210 16.5 330 12.5 285 9 18 2.3 45
Pealigide kg 834.50 4 56o 44 5 73 2.1 OD 4.2 62 1.5 22 1 1 3GO 4 s66 3 44 2 29
Croft As. why 67.25 10.4 78 33.1 4 22.7 164 14.3 130 10.7 77 15.5 112 11.1 80 7.8 54 11.4 95 3 22
64..IIa kg610.00 0a 6 so 0 4.5 4581,1.611626.6 256 0 0a
A~~lb43ierv. 6~~7 92 63 44 51 44 43 so a a 40 50 6 1132 7430 to 9 66 S 7
SewIng 5 576.00 1o Is 3 2 0 a it1 is
l4erveat 5 691.60 37 37 9 22 21 6 6
;ri.watr .36$0.0047 1I00 7 060 4 32075 57 460 2 400 4 400 4 1060 6 1440 7 3200 90 4"tout1.
16 i16" 16o" 700 1514 1164 1710 1402 6on 36
Lthewr amod 63.15 173 575 373 574 392 6143 S4" 462 206 "6 213 713 466 I62 114 75 i6n N6O 124 415
flat Value 8265 363 2864 765 1142 942 434 245 427 -116
Return per l1lamia 151.9 21.6 10.2 5.5 5.6 4.4 6.5 1.6 2.5 -099

CHINA
IRRIGATED AGCICULTURE INTENSIFICATION LOAN
Su mary of Fore Household Model Analysis
Present Future Without Proj-ct Future With. Project
Returns Per Returns Per Returns PerFamily per Capita Family per Capita Family per CapitaIncome Monday Income Incoe Manday Income Income Monday Income
mode ls (Yuan) (Yuan) (Yuan) (Yuan) (Yuan) (Yuan) (Yuan) (Yuan) (Yuan)
1. Anhui, Total Project 2138 9.7 611 2362 10.3 564 296 11.7 713Huai River Irrigatlon 1583 10.3 392 1726 11.2 432 2482 12.8 620Mid-Niualbet River Irrlgation 1344 9.5 336 1426 10.0 3S6 1886 11.4 471Traditional Well Irrigation 1201 9.8 300 1266 10.1 316 1731 11.2 433Water-saving Well Irrigation 1243 9.9 311 1370 11.0 344 1603 11.6 451
2. Jiangsu, Total Project 2119 9.2 424 2324 9.4 466 3014 11.2 603Paddy Converslon, Fengxlan 2268 8.6 464 2693 9.2 619 2924 10.4 686Newly Irrigoted, Sihong 2236 11.8 669 2607 12.3 862 3246 13.0 811Rehabilitated Irrigation, Guanyun 1925 8.4 481 2057 9.0 614 2171 9.1 643Rehabilitated Irrigation, Xiangshui 1696 11.7 399 1980 11.7 496 3201 12.2 800
3. Shandong, Total Project 2213 11.6 55i 2449 12.2 612 2736 13.2 684Nansi Lake Yellow R. Diversion 2360 11.3 476 257a 11.6 515 2626 10.9 605Shengli Canal Irrigation 2927 15.4 585 3184 16.5 637 3431 18.0 686Xiezhai Yellow R. Diversion 1613 0 404 1676 6.6 409 2247 8.6 582Water-saying Well Irrigation 2211 15.6 664 2482 16.6 620 2926 18.3 731
_ _ _ _________________________________________________________---------- w
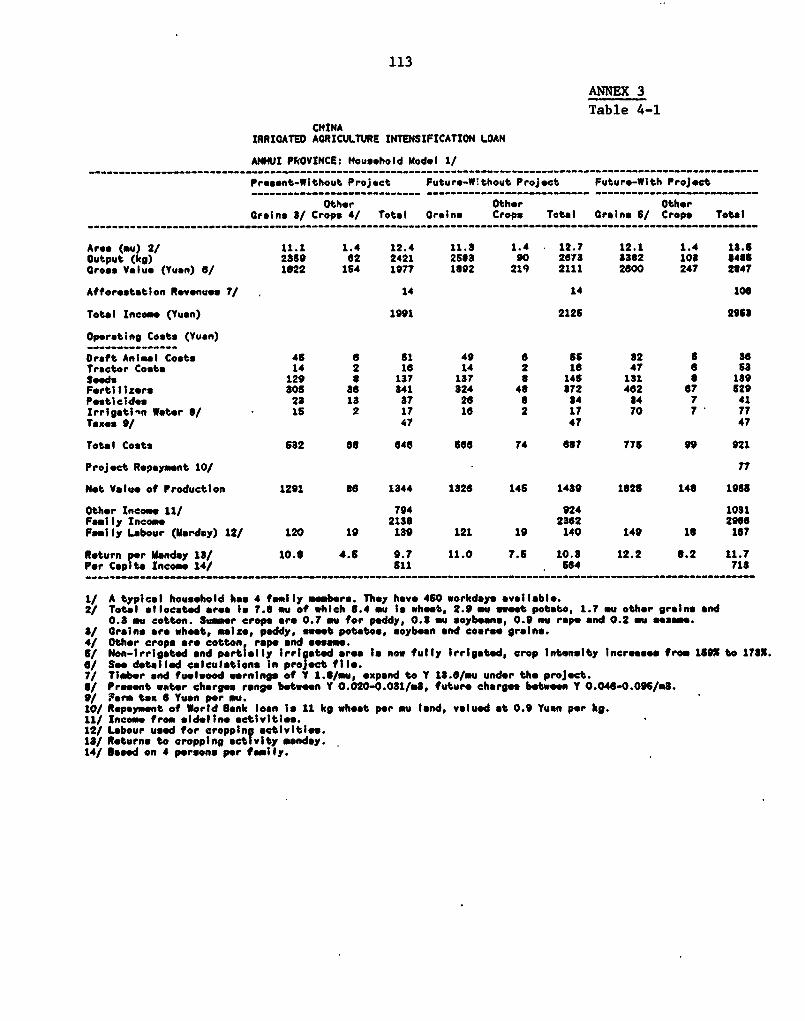
113
ANNE 3Table 4-1
CHINAIRRIGATED AGRICULTURE INTESIFICATION LOAN
ANNUl PROVINCE: Household Model 1/
Preaent-Without Project Future-W!thout Project Future-With Project
Other Other other
Grain* 3/ Crops 4/ Total Grains Crops Total GIrains 6/ Crops Total
Area (mu) 2/ 11.1 1.4 12.4 11.8 1.4 12.7 12.1 1.4 18.5Output (kg) 2869 62 2421 2568 90 2673 8862 108 4846Gross Value (Yuan) a/ 1622 154 1977 1692 219 2111 2800 247 2647
Afforestation Revenues 7/ .14 14 106
Total Income (Yuan) 1991 2125 2968
Operating Coats (Yuan)
craft Animal Costs 45 a 51 49 a 56 82 6 86Tractor Coats 14 2 16 14 2 16 47 6 58USeda 129 6 137 137 a 145 181 a 189Fertilizers 805 86 841 824 46 872 462 67 529Pesticides 23 18 87 26 6 84 84 7 41IrrIgstIl%n Water 6/ 15 2 17 16 2 17 70 7 77Taxes 9/ 47 47 47
Total Coats 582 as 646 s68 74 667 775 99 921
Project Repayment 10/ 7
Net Value of Production 1291 56 1344 1826 145 1489 1625 146 1965
Other Income It/ 794 924 1081Family Income 21386 2862 29166F.i 1y Labour (Marday) 12/ 120 19 189 121 19 140 149 16 167
Return per Monday 18/ 10.6 4.5 9.7 11.0 7.5 10.8 12.2 6.2 11.7Per Capita Income 14/ 511 564 718
I/ A typical household has 4 family me-rer. They have, 450 workdays available.2/ Total allocated area Is 7.8 mu of which 6.4 mu Is wheat, 2.9 am sweet potato, 1.7 mu other grain. and
0.8 mu cotton. Summer crop. are 0.7 mu for paddy, 0.8 mu soybean. 09 mu rope and 0.2 mu aaaame.8/ Grain. are wheat, maize, paddy, sweet potato*, soybean and coarac g'rasin..4/ Other crop. are cotton rape and sesame.5/ Non-irrigated and partially Irrigated area to now fully irrigated, crop intensity Increases from 150W to 1783.6/ Seam detailed ealculation n1 1 project file.7/ Timber and fueiwood earnings of Y 1.6/mu, expand to Y 18.6/mu under the project.6/ Present water charges range between Y 0.020-0.031/m8, future charges between Y 0.046-0.095/oS.9/ Farm tax 6 Yuan per mu.10/ Repayment of World Sank loan Is 11 kg wheat per mu land, valued at 0.9 Yuan per kg.I1/ Income from sideline activities.12/ Labour used for cropping activities.18/ Returns to cropping activity manday.14/ feaed on 4 persona per family.

114
ANNEX 3
Table 4-2
CHINA: IRRICATED ACRICULTURE INTENSIFICATION LOAN
JIANGSU PROVINCE: Household Model 1/
Present-Without Project Future-Without Project Future-With Project
Other Other OtherGrains 3/ Crops 4/ Total Grains Crops Total Grains 6/ Crops C/ Total
Area (mu) 2/ 7.7 4.3 12 7.9 4.3 12.2 9.9 3.0 12.9
Output (kg) 4690. 2210 60o0 4901 2367 7286 7657 220n 9765
Cross Vslue (Yuan) 6/ 1767 758 2626 167 616 2605 2979 716 3897
Tot-l Income (Yuan) 2526 208S 3697
Operating Costs (Yuan)
Dreft Animal Costa 49 14 63 45 21 68 36 10 46
Tractor Costs 64 24 78 a6 2t 93 97 24 121
Seeds 135 31 16 123 30 13 129 22 161
Organic Manure 107 43 150 134 54 166 240 34 274
Fertilizers/Feed 242 98 340 279 106 387 369 148 517
Pesticides 31 36 67 32 386 6 48 23 72
Irrigstion Wster Lift Cost* 62 26 s6 66 26 92 118 9 127
Wster F- . 7/ 6 1 7 10 2 12 17 2 19
Taxes / 20 11 31 21 11 32 20 9 36
Other Coats 9/ 48 19 67 sO 20 70. 140 16 1S6
Total Costs 753 So$ 1067 024 336 11i 1220 296 116i
Proj3ct Repayment 10/ 66
Net Value of Production 1015 464 1469 1043 431 1524 1769 420 2114
Other Income /11 6O6 . 6OO 900
Family Income 2119 2324 3014
Family Labour (Monday) 12/ 102 57 169 104 S8 162 146 44 189
Return per Monday 13/ 9.9 6.0 9.2 10.0 6.3 9.4 12.1 9.6 11.2
Per Capita Income 14/ 424 465 603
1/ A typical household has 8 family members. Th-y have 676 workdays avellable.
2/ Total allocated area io 7.2 mu for which 6 mu Is wheat and 3.1 u cottoo.Summ8r crops are 1.2 mu rape and 1.7 mu paddy.
3/ Grains are wheat, paddy and barley.4/ Other crops ar cotton, rape and soy.5/ Non-ierigated and partially Irrigated area Is now fully lirigated, cropping Intensity lneresses from 167W to 179X.
Paddy expands te 3.7 mu and barley to 2.2 mu. Wheat ales shrinks to 4 mu, cotton to 2.6 mu and rope to 0.5 mu.
6/ Soo detailed calculations In project file.7/ Water fees ore asseeosd et present rates of Y 0.001/mi an4 future rates of Y 0.0047/mi.8/ Form tax 3 Yuan per mu.9/ Costs of sprayers and other small form tool purchases.10/ Repaymnt of World Bank loan Is estimated as 1OX of the value of incrementel output.11/ Other Income from sideline occupations.12/ Labour used in cropping activities.13/ Return pr moandry In cropping activity.14/ Sased on 6 persona per family.

- 115
ANNEX 3Table 4-3
CHINA: IRRIGATED ACRICULTURE INTENSIFICATION LOAN
SHANOONG PROVINCE: Household Model 1/
Present-Without Project Future-Without Project Futuro-With Project
Other Oth.. OtherGrains 3/ Crops 4/ Total Groins Crops Total Crains 5/ Crops Total
Area (au) 2/ 9.0 2.5 11t. 9.2 2.6 11.7 9.4 2.6 12.0Output (kg) 2279 653 3132 2464 926 3363 3060 1131 4190Cross Valu, (Yuan) 6/ 1782 674 2356 1938 625 2683 2269 7S9 3018
Total Incoa (Yuan) 2366 2563 S'1S
Operating Costa (Yuan)
Draft Animal Costs 28 9 37 26 9 37 s0 11 41Tactor Coats 44 a 62 46 10 66 66 15 71S*eds 128 26 16S 12S 23 156 112 29 142Organic Manuro 24 27 61 25 27 62 37 32 09
ertilizers 449 63 632 610 94 003 641 117 758Poesticides 23 25 48 23 26 49 29 26 54Irrigation Water 7/ 6o 7 68 62 ? 09 91 14 106Taxes 6/ 21 21 21Other Costs 9/ 93 26 11 92 25 11S 97 27 124
Total Costa 650 211 102 914 226 1161 1096 270 1306
Project Repyment 10/ 69
Net Value of Production 932 368 1276 1024 $99 1402 1164 489 1673
Other Income 11/ 938 1047 111Family Income 2213 2449 2736Family Lsbour (Monday) 12/ 135 65 190 143 so 201 150 58 206
Return per Monday 18/ 11.6 12.2 13.2Pe. Capita Income 14/ 65a 612 664
1/ A typical household has 4 foally embers. They have 460 workdays available.2/ Total allocated area to 6.9 mu for which 6.6 mu ts wheat and 0.8 mu is cotton.
Summer crops are 3.6 mu for maes-, 0.7 mu soybeans, 0.2 mu peanuts, 0.2 mu for a vegetable plot and 0.5 mu other.3/ Ors:ns are wheat and maize.4/ Other crops are soy, cotton, peanuts, veetables and other.5/ Non-irrigated and partlilly Irrigated area to now fully irrigated, cropping Intensity Incro*es, from 1671 to 17436/ See detailed calculations In project file.7/ Water chorges ar presently Y 0.012/ms In Nanoi Lake, Y 0.0137/mi In Xieshai, Y 0.024/mi In Shongil
and Y 0.066/mi in well areas. Under the project these charge. will be raiend to Y 0.036/mS3 Y 0.036/mS,Y 0.044/mi and Y 0.0327/mi reepectively.
8/ Form tax 3 Yuan per mu.9/ Costs of sprayers and other small form tools.10/ Repaymnt of World Sank loan is 10 kg whoot per mu lond, valIed at O i9 tuoiu per kg.11/ Income from sidelino occupationa.12/ Labour used in cropping and sideline activities.13/ Return per manday In cropping and *idelin- activities.14/ Sasod on 4 peroono per family.
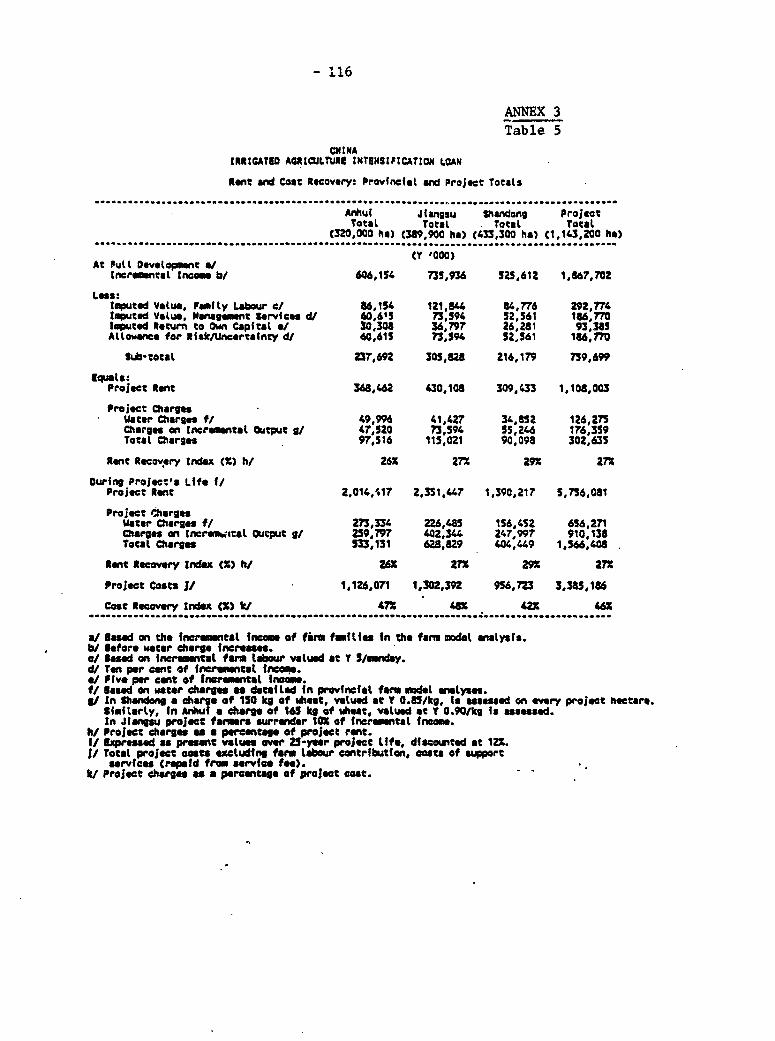
- 116
ANNEX 3Table 5
CNINAIRRIGATUI ARUIULTURI INTEMSIFtCATION LOAN
Pent and Cost Recovery: Provincafl *nd Project Totals
Anihuil Jiangsu Shandong ProjectTotal Total Total Total
(320,0a0 ha) (389,9o0 ha) t433,3O0 ha) (1,143,200 he)... .......... _ .. .. ........... _...... ........ ...... ..
CtY 000)At Pull Oev*topment ac
InerementaL Income bt 606,154 735,936 525,612 1,J67,702
Less:tnouted Value, Famity Labour ci U6,154 121,U4 64,776 292,774
touted Value, Managemet Services d/ 40,615 73n594 52,561 186,770
l utod Return to Own Capital e/ 30,30a 36,797 26,281 93,383Attowance for Risk/Uncertainty di 60,615 73,594 52,561 1667,70
Sub-otat 237,692 305,62 216,179 719,699
Equats:ProJect Rent 368,462 430,108 309,433 1,108,003
Project ChargesWater Charges fi 49,996 41,427 34,8S2 126,275Charges en tncremental tutpu gi 47,520 73,594 55,246 176,359
Tocat Charges 97,516 115,021 90,098 302,635
rent Recovery tndezx t) hi 26X 273 29 27z
Ourfng Project's Life f/Project Rent 2.014,$17 2,331,447 1,390,217 s,6,081
Project ChargesWater Charges ft 273,334 226,4aS 156,432 656,271
Charges on tncru_.-Itat Otput gi' 259,797 402,344 247,997 910,138
Total Charges S3 ,131 628,29 404,449 1,566,408
Rent Recovery tndcx CI) hi 26X 2Vs 29s 27X
Project costs I/ 1,126,071 1,302,392 956,723 3,36S,186
Cost tecoewry tbInde CM) ki 471 41A 421 46S
a/ eased on the Inerwmental Incom of firm fmtiles In the fans modl analysis.
bi Before water charge Increes.c/ Beasd on Ineremental farm tabor vcuhd at Y S/mnday.di Ten per cent of Incrmentl Ircxo.*i Five per cent of Ineremental Inrome.fi Eased en water charge. as detafLed In provincale farm mrodl nalyses.gi In Shand>ong a charge of 150 kg of wheat, valued at Y 0.85/kg, f. assened on every project hectare.
Simitarly, In Ar.uf a charge of 165 kg of wheat, valued at Y 0.90/kg is asessed.In Jiansu proJect farmers surrender 10t of Incr_mentat Incom.
hi Project charges as a penscntag of project rent.f/ Ezpresaed as proesnt values over 25-year project Life, dIscounted at 121.i Total project costs eludlfng farm Lbour contribution, mosta of apport
services (repaid from serfvie fee).ki Project charges as a percentage of project ca t.

117 ANNEX 3Table 6
CHINA
IRRIGATED AGRICULTURE INTENSIFICATION LOAN
Main Conversion Factors Used a/
…________________________________- _________________-______________________Standard Conversion Factor b/ 0.95Consumption Conversion Factor c/ 1.33Labour - Ut-skilled d/ 0.67
- Skilled 1.5l- Management 2.00- Technical 2.00
Energy - Coal 2.12- Gasoline 1.55- Diesel 1.13- Electricity 5.00
Transport - Road 1.10- Rail 4.00
Cement 3.53Steel 2.19Timbe: 0.93Construction 1.60Structu :es 1.02Machinery/Equipment e/ 1.50Others 0.90----------------------------------------------------------------- __---------
a/ The conversion factors are based on IBRD's Economic Pricesfor Project Evaluation in China, January 23 and July 12, 1990and actual financial prices prevailing.
b/ SCF - (Official Exchange Rate)/(Shadow Exchange Rate) - 5.22/5.50.cl Weighted average of ratios of 1990 economic and financial
project area prices of wheat, corn, rice, other grains, cotton and ollseedswith the v-ights based on 1988 project area rural per capita consumption.
d/ Based on S02 of the project area market wage (Y5/manday) times theconsumption conversion factor.
e/ Based on a conversion factor of 1.0 for imports under ICB and 1.5 forlocally made machinery and equipment.
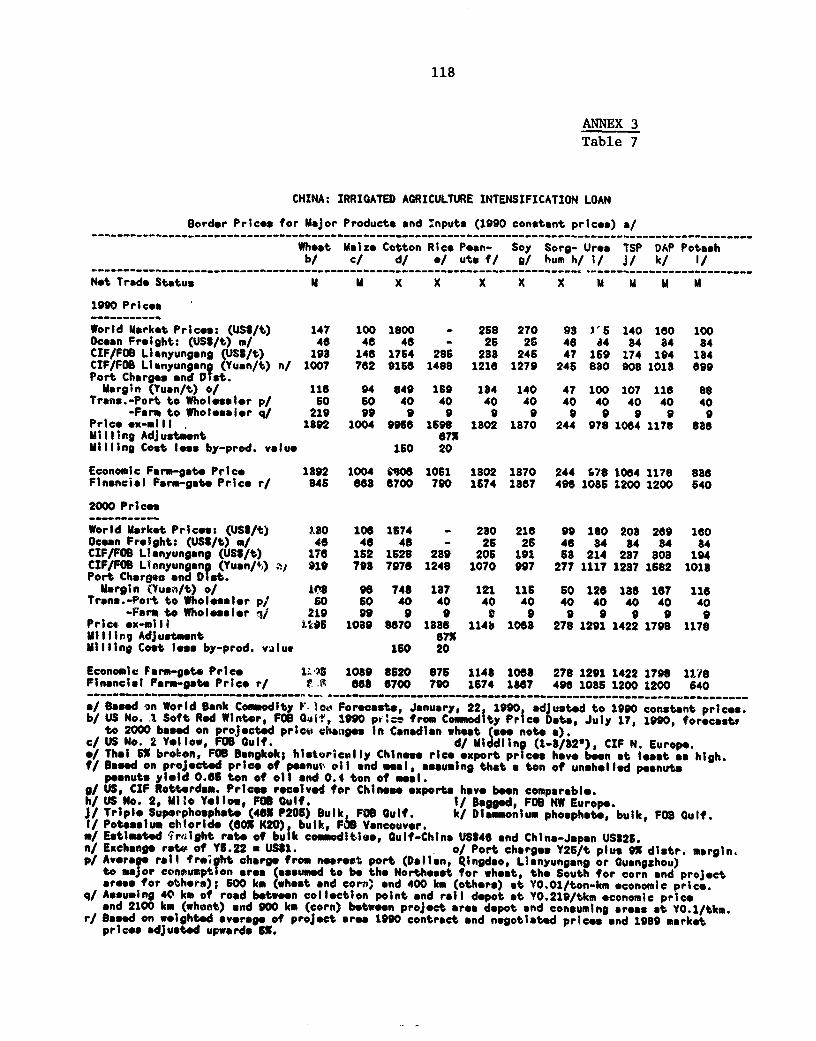
118
AMEX 3Table 7
CHINA: IRRIGATED AGRICULTURE INTENSIFICATION LOAN
Border Prices for Major Product* and nputs (1990 constant prices) a/
Wheat Maize Cotton Rice Poan- Soy Sorg- Uroo TSP DAP Potashb/ c/ d/ */ uts f/ 9/ hum h/ I/ J/ k/ I/
Not Trade Status m M X X X X X m U m U
1990 Prices-- _--------
World Market Prices: (USS/t) 147 100 1800 - 268 270 98 V'S 140 160 100Ocean Freight: (USS/t) m/ 46 46 46 - 26 26 46 d4 34 84 84CIF/FOB Lianyungang (USU/t) 193 146 1764 286 288 246 47 169 174 194 184CIF/FOB Lianyungang (Yuan/t) n/ 1007 762 9166 1488 1216 1279 246 880 908 1018 699Port Chaesor and DOtt.Margin (Yuan/t) oJ 116 94 849 1S9 184 140 47 100 107 116 88
Trans.-Port to Wholesals r p/ 50 50 40 40 40 40 40 40 40 40 40-Frm to Wholesaler q/ 219 99 9 9 9 9 9 9 9 9 9
Price *x-mill . 1892 1004 996S 1598 1802 1870 244 978 1064 1178 886Milling Adjustment 87%Milling Cost less by-prod. valuo 150 20
Economic Farr-gate Price 1892 1004 Seo06 1061 1802 1870 244 v78 1064 1178 8a8Financial Farm-gate Price r/ 846 866 6700 790 1674 1867 496 1086 1200 1200 640
2000 Prices
World Market Prices: (USl/t) lB0 106 1674 - 230 216 99 180 208 269 160Ocean Freight: (US1/t) m/ 46 46 46 - 26 26 46 84 84 34 84CIF/FOB Lianyungang (US$/t) 176 162 1528 289 206 191 68 214 287 808 194CIF/FOB L?anyungang (Yuan/*,) tj 919 798 7976 1248 1070 997 277 1117 1287 1682 1015Port Chargms and Dist.Margin 7uaa/t) o/ WP8 96 748 187 121 116 60 126 186 167 116
Trans.-Port to Wholoealer p/ 60 50 40 40 40 40 40 40 40 40 40-Frt to Wholesaler I/ 219 99 9 9 9 9 9 9 9 9 9
Pric. e,x-mili It05 1089 8670 1886 114b 1068 278 1291 1422 1798 1178Milling Adjustment 67XMilling Cost less by-prod. value 150 20
Economic Farm-gate Price 1a715 1089 8620 876 1148 1068 278 1291 1422 1798 11/8Financial Form-gate Price r/ r fi 668 6700 790 1674 1867 496 1085 1200 1200 640
*/ Baeod sn World Bank Commodity 6. lo Forecasts, January, 22 1990 adjusted to 1990 constant prices.b/ US No. .1 Soft Red Winter, FOB Quit, 1990 pf c. e from Cowmmodity Prjce Data , July 17, 1990, forocost,
to 2000 baed on projected priec chaniges in Canndln whoet (see note a).c/ US No. 2 Yellow. FOB Gulf. d/ Middling (1-8/520), CIF N. Europe.o/ Thai OX broken, FOB Banokok; historically Chinese rice export prices have been at leoat as high.f/ Based on projected price of peenui' oil and mel, assuming that a ton of unshelled peanuts
p anuts yield 0.65 ton of oil and 0.4 ton of meal.g/ US, CIF Rotterdam. Prices recolved for Chinese exports have been comparable.h/ US No. 2, Milo Yellow, FOB Gulf. i/ Bogged, FOB NW Europe.j/ Triple Superphouphote (463 P205) Bulk, FOB Gulf. k/ Diammonium phosphate, bulk, FOB Gulf.I/ Potsoolum chloride (60% K20) bulk, FOS Vancouver.m/ Estieted fettilght rate of bulk commodities, Gulf-China USS46 and China-Japan US825.n/ Exchange ratt of YS.22 a USII. o/ Port charges Y25/t plus 9X distr. morgin.p/ Average rail freight charge from nearest port (Dollon, Qingdao, Lianyungang or Ouongzhou)
to major concumption area (assumed to be the Northeast for wheat, the South for corn and projectareos for others); 50 km (wheat and corn) and 400 km (others) at YO.01/ton-km economic price.
q/ Assuming 40 km of rood between collection point *nd roil depot at YO.219/tkm economic priceand 2100 km (whont) and 900 km (corn) between project area depot and consuming areas at YO.1/tkm.
r/ Based on weighted average of project area 1990 contract and negotiated prices and 1989 morketpricoo adjusted upwards 53.

119
ANNEX 3
Table 8-1
IRRIGATED AGRICULTURE INTENSTFICATION LOAN
Summary of Economic Analysis
-------------------------------- _-_--------------------------.-----------
Switching ValueNPV at Base at 1221ZZ Case ------------------
Models (Y'O0O) ERR Benefits Costs------------------------ _--------------------------.----------_.---------
1. Anhui, Total Project 2363009 26.35? -61.192 157.66ZBeifei River Drainage/Irrigation 108657 20.77Z -48.48? 94.09?Qian River Drainage/Irrigation 231705 28.66Z -60.91? 155.812Huai River Irrigation 257563 25.022 -52.47? 110.38ZMid-Huaibei River Irrigation 703312 41.14Z -62.77? 168.61ZTraditional Well Irrigation 186292 21.54Z -54.192 118.29?Water-saving Well Irrigation 245170 28.07? -61.69? 161.00Z
2. Jiangsu, Total Project 1933656 28.67Z -43.10? 75.752Paddy Conversion, Fengxian 5062 26.85? -55.00? 122.002Newly Irrigated, Sihong 29166 22.58? -47.87? 91.85?Rehabilitated Irrigation, Guanyun 51501 35.67Z -84.90? 562.502Rehabilitated Irrigation, Xiangshui 9100 23.54? -68.60Z 218.00Z
3. Shandong, Total Project 982828 24.01Z -44.90? 81.50?Nansi Lake Yellow R. Diversion 124419 21.02? -33.22? 49.74?Shengli Canal Irrigation 106436 26.59? -46.45? 86.75?Xiezhai Yellow R. Diversion 338878 26.99? -56.57? 130.28?Water-saving Well Irrigation 600278 28.56? -61.90? 162.45Z
TOTAL PROJECT 5311206 26.53? -50.26? 101.00?--------------------------------- _---------------------------__--_-------

120
ANNEX 3Table 8-2
CHINA
IRRIGATED AGRICULTURE INTENSIFICATION LOAN
Summary of Sensitivity Analysis
…--------- ._------------ _____________________________________________________________Base Yield Price Investment BenefltsCase Increase Falls Costs Inc. Lag
Models ERR (Z) by 102 by 102 by 10 1 Year--------- _--_----------_--_------------------_-------_----------------__-----__-------
1. Anhui, Total Project 26.4 28.0 24.6 24.9 22.8Beifei River Drainage/Irrigation 20.8 22.6 18.8 19.8 18.3Qian River Drainage/Irrigation 28.7 30.9 26.4 27.1 24.2Huai River Irrigation 25.0 27.0 22.7 23.5 21.3Mid-Huaibei River Irrigation 41.1 47.8 35.4 37.6 30.7Traditional Well Irrigation 21.5 22.9 20.1 20.6 19.3Water-saving Well Irrigation 28.1 30.1 26.1 26.3 23.9
2. Jiangsu, Total Project 28.7 33.2 23.9 26.8 22.2Paddy Conversion, Fengxian 26.9 29.9 23.4 24.1 23.0Newly Irrigated, Sihong 22.6 56.3 21.1 21.3 19.5Rehabilitated Irrigation, Guanyun 35.7 34.7 37.0 34.7 32.3Rehabilitated Irrigation. Xiangshui 23.5 25.3 21.5 23.4 22.1
3. Shandong, Total Project 24.0 26.2 21.8 22.0 20.0Nansi Lake Yellow R. Diversion 21.0 23.2 18.7 19.2 14.3Shengli Canal Irrigation 26.6 31.6 22.0 24.1 21.1Xiezhai Yellow R. Diversion 27.0 29.7 24.3 25.2 22.7Water-sav4 ng Well Irrigation 28.6 31.0 26.1 26.5 24.0
TOTAL PROJECT 26.5 29.1 23.7 24.8 22.0-------------------.----------------------------------------------- __ -------- __ -------

OClKA: KII ATD A tWICUL1IE D1TB1T KICATI LOANIAIL F R AA: Economic Cash Flow (Y millI;c)
Project Year 1 2 3 4 S 6 7 a 9 10 11 12 IS 14 15 1s 17 to 19 20 21 22 23 24 25Net R.weAUe Will Project
Croig Crops 2041 2345 3458 3ass 4591 5290 5540 5769 5769 5769 5031 5032 5031 51 5031 5031 501 5031 503 5031 51 5031 531 5032 5031Cettla 337 413 60S 688 801 940 967 992 992 992 826 826 825 826 826 826 826 628 826 O2a 826 M 626 8 826Oi jIae. 41 6 100 117 132 149 158 1S 165 1 65 162 162 162 162 162 162 362 162 165 162 162 162 162 162 262Cash Crops tO7 96 116 140 180 221 227 233 233 233 109 309 109 109 109 109 109 109 109 109 109 109 109 109 109Forestry -13 -30 -41 -28 -48 -32 -24 S5 -S 90 171 25S 320 220 291 808 326 330 34s 303 59 37 14 -1I -1ITotl NHt Reveau 2513 2ns 4239 4911 5S57 4568 6 3 7153 7249 629 G8 6448 6348 6419 6436 6454 6438 6473 6431 61U7 6164 6242 6117 6117Not Revese VltIot Project
Craig Crope, 2041 2514 3120 S50 3658 3814 2814 8814 3634 3814 3395 O 3395 339 S 39 3395 " 3395 3395 3395 3395 339529 3395 3395 3395 3395Cotten 337 405 495 6S6 594 63 630 630 630 630 569 669 569 569 569 569 59 569 569 569 5369 S69 569 569 569Oilseeds 41 61 65 72 74 75 76 75 76 75 77 77 n 77 77 77 77 77 77 77 77 77 77 77 77Cosh Crops 107 Is3 l59 262 297 214 214 214 214 .214 102 102 102 102 102 102 102 102 102 102 102 102 102 102 102Foerstrylotal Neb Rvemme 2527 8103 89 4313 4523 4733 47W3 4733 4733 4733 4144 4144 4144 4144 4144 4144 4144 4144 4144 4144 4144 4144 4144 4144 4344lncremental Not Reve...I
Ceais Crop. 0 -16 SW 493 aa 1476 725 1955 955 19SS 1636 136 1636 1636 163 1S6 I63 166 1636 1S3 163 163 1636 1636 1636Cotton 0 0 110 130 207 310 337 362 62 J62 256 256 256 256 256 256 256 256 256 256 256 256 256 256 256OU ased4 0 17 35 45 5s 74 82 9 89 6s9 a6 5s as a5 6s a8 85 as 5s 5s as 8s as as asCao Crop, 0 -3 -43 -41 -17 7 13 19 19 19 7 7 7 7 I 7 7 7 7 7 7 7 7 7 7Forestry -J -30 -41 -20 -48 -22 -24 SS -S 90 171 255 320 220 291 306 326 310 345 303 s9 ST 34 -11 -12Total l.cr Oet Rew. -13 -208 400 s6s 1134 8634 2184 2490 2420 2515 215 29 2305 2204 2275 2292 2310 2294 2329 227 2043 2021 198 1974 1974Cast.s
Iaweta.tCost 96 12S 1197 702 317 0 0 0 0 0 0 0 0 0 0 0 0 0 0 0 0 0 0 0 0Operating Cot 0 69 140 212 281 341 352 851 351 351 351 351 351 352 351 351 351 851 362 36 J 351 253 352 351 352Total Coat. 96 130 23 914 NO 341 351 351 351 351 354 352 351 351 351 351 351 351 351 S11 351 351 351 361 353et mbesf it -0 -1615 -937 -n1s 562 1493 17S4 2140 2070 2165 1806 M 1N9 1954 1S4 19 1941 1960 1944 1979 193 1 1670 1648 1623 162
EW (1 iII ) 1511
fJR ~~~~21.835
ILA

IU18817 AGRICATME INTEUIIICATICU ONMWl1IV PROVIltC; Ecou.lc tash flOg fV '000)
.................................... I.............................................................................................................................. ........... ..............................Elca ic IchlysI latr I 2 3 4 5 6 7 a 9 10 11 12 I3 14 1S 16 19 20-21 22 23 24.25..................................................... .......................................................................................................................................
........................................................... *. Net Revwsa Witgh Projectr..in.;...................
Grain Crps R455912 502954 83857 105906 117559 134121t 10so86* 1676513 1676513 1676513 1676513 1676513 1676513 167651S 1676513 1676513 1676513 1676513 1676513 1676513Cason 24056 45276 7561 90553 105645 120737 13529 150921 150921 I5MI 150921 150921 150921 150921 150921 150921 15021 150921 15092I 150921oiseada 10615 15246 25411 30493 35575 40657 679 50s21 50821 so581 S0821 5021 50521 50621 s5021 Sou2 50621 Su21 50I 50t21Cash Crops 24910 87941 29902 35883 41863 41843 53824 5904 s 59604 5S9804 59804 59804 59s84 59004 590D4 5904 59604 59004 59"04shelter tlls Sorder Won -6840 .14640 -16410 -1187 -1973 -3580 4120 92162 21090 1163S5 122380 122380 124730 -5590 -5590 2500 5915 36520 U3910 .17lo0c II) 505656 567n 950620 116169 1336912 154866 1748374 2030222 199150 54410 206040 2O640 2U790 1929470 1M9247 1946 199210 19455O 195I2K0 92125not Baana iltbA Project...........................
Grain Crops 455912 6277 620642 911825 9118S 911825 911825 911625 91812S 91182S 911325 911825 9115U5 9115 911 911tl25 "IB 91152S 9112 "1182SCrston 240S6 33673 43301 48112 48112 48112 48112 46112 48112 48112 481)2 48112 "4112 40112 48112 48112 48112 48112 48112 £5112eitsead 10615 14665 19112 2123S 21235 21235 2125 21235 21235 21235 21235 2)235 21235 21235 21235S 21235 2123S 2123S 21235 2123SCash Crops 24910 34874 448 49620 49820 49*0 496*0 49020 49820 4980 498O ,9820 49320 4962 4982 4962O 4950 49*2 49520 49m0shekler Belts. Border low 785)Total 12) S15496 121694 921392 1030991 10309910309 1030991 1109510 8031100991 0309 1 030991 1 030991 100 1530 803M0 03991 10309 1 9 103 0991 12wIncrmanatl Stl Eatmn................... .................. .
Grain Crops 0 -135323 1761S 9403 26175 429386 597037 76489 76469 76489 7646s9 764w6 764W9 764689 764 -9 764689 7t6468 746489 76449 7689CoIom 0 11598 32160 4244) 57533 7262s a77)a 102010 102810 12810 102810 102810 1028)0 102810 102L£Q 102810 1025)0 102810 102810 102810OaIaseda 0 3U 6299 9257 14340 19422 24s54 29586 29586 29586 29586 2958 29586 2s958 2958 29586 29586 29586 29536 29586Cash Crops 0 -16933 -14936 -13937 -7957 -1977 4004 4 6 9 94 99 9904 994 9 99K4 9 9964 9984 9964 9s8 99t4shelter aells. Border tows *6040 14640 -18410 -1167 -19730 -358 4120 1343 21090 116350 122380 1220 12470 -85J9 -0590 200 5950 36520 1390 -10780lot0t 03)a1)M -6640 -854916 22un8 130658 30921 515877 713 920712 928159 1023419 8029449 1029"49 913 39419 89479 909569 966219 93I589 921049 9289Costs
In att Coat (4) 340238 4365s5 45682 305218 12833Operating coatl S) 9214 IU25 27641 3685 4069 46046 4646 6 4 9 46069 46469 46069 460 469 46069 46069 46069 6069 46069lol.t Cass 16)x14)*(S) 340238 4S77 475256 -332859 146668 460 46069 46069 46069 46069 46069 46069 46069 46069 44069 46069 46069 46069 46069 6069Not Sawfit (7*133-(6) * 34t07s -600687 -452528 202201 139M 46980 67131 074643 MM2090 9750so 930 930 730 852410 352410 830 9M15 8120 874960 S522WV 6V0o0) 2360093tt 26.35X
................................................................. ...................................................................................................................................................sw**^***^ves*****v*w - *bv@^***
s-a
IDX
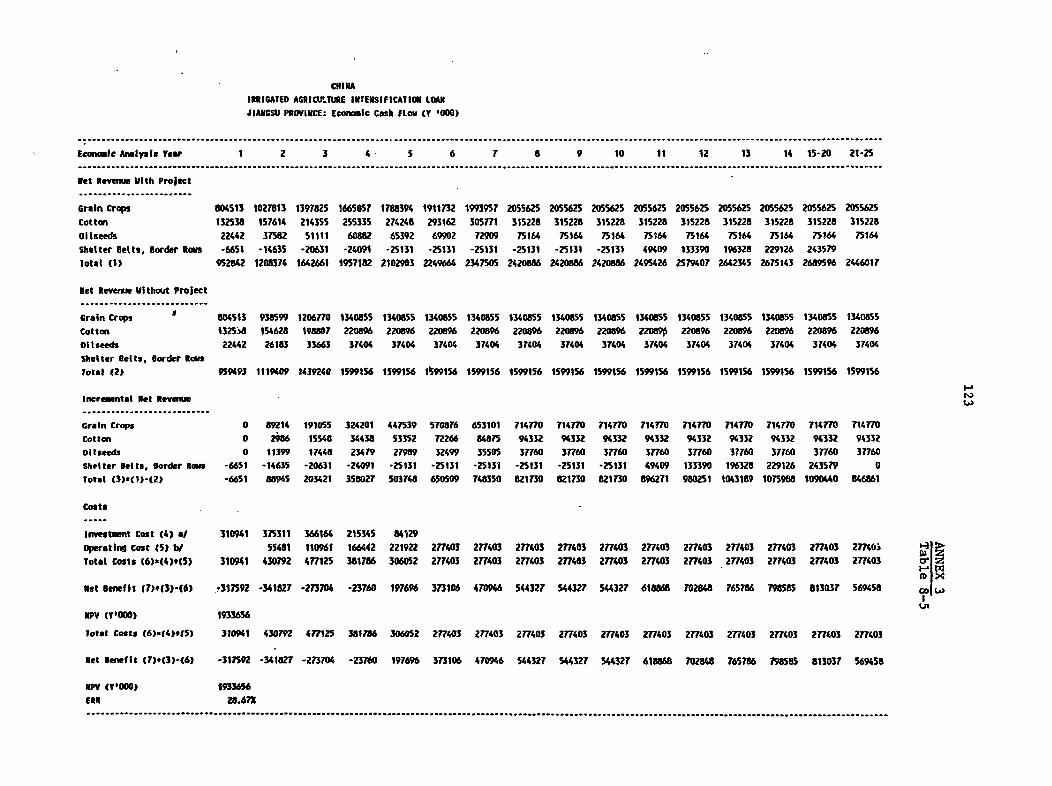
CUINAIRRIGATED AGRICILtttE EINTENSIFICATIOU LOAUJIANGSU PROViNCE: Econoic Cash fLow (Y 000)
........... ................. ................................................... ...............................................................................................
...... ............................................... ...... ...Ecnmic Anolysls Y.ar 1 2 3 4 5 6 7 8 9 10 11 12 13 14 15-20 21-25...........................................................................................................................................................................
get Revenue Ulth Project........................
Grain Crops 804513 1027813 1397825 1665057 1788394 1911732 1993957 2055625 2055625 2055625 205625 2055625 2055625 2055625 2055625 2055625Cotten 132538 157614 214355 255335 274248 293162 30577 312S28 31S228 315228 315228 315228 31522 31528 315228 315228Oltseeds 22442 37582 51111 60882 65392 69902 72909 75164 75164 75164 75164 75164 75164 75164 75164 75164Shelter Belts. Border lems -6651 -1463S 20631 -24091 -25131 -2531 -2531 -25131 -25131 -25131 49409 133390 196328 229126 243579lotat (1) 952842 1205374 1642661 1957182 2102903 2249664 2347505 2420886 2420886 242086 2495426 2579407 2642345 2675143 2689596 2446017
let leve,ve Vithout Project...........................
Grain Crops f 804S13 938599 1206770 1340855 1340855 13408SS 1340855 1340855 1340855 1340855 1340855 1340855 1340855 1340855 1340855 14855Cotton `132SA 154628 198807 22086 220896 220896 220896 220896 220896 220896 220890 220896 220896 220896 220896 ZZ896oilseeds 22442 26183 33663 37404 37404 37404 37404 37404 37404 37404 37404 37404 37404 37404 37404 37404Shelter Betts. Border RowsTotal (2) 959493 1119409 t439240 1599156 1599156 19S156 1599156 1599156 1599156 1599156 1599156 1599156 1599156 1599156 1599156 1599156
Inerental get u...........................
"rain Crops 0 89214 191055 324201 447539 570876 653101 714770 714770 714770 714770 714770 71477 714770 714770 714770Cotten 0 2986 15548 34438 53352 72266 84875 94332 94332 94332 94332 94332 94332 94332 94332 94332Oilseeds 0 11399 17448 23479 27989 32499 35505 37760 37760 37760 37760 37760 37760 37760 37760 37760Shetter Betts, Border Rows -6651 -14635 -20631 -24091 -25131 -25131 -25131 -25131 -25131 -25131 49409 133390 196328 229126 243579 0Totat (3)-(1)-(2) -6651 88965 203421 358027 503748 650509 748350 82173O 2u1730 82173O 89627 980251 1043169 1075958 1090440 e46861
Costs
Investent Cost (4) eJ 310941 375311 366164 215345 84129Operating Cost (5) bt 55481 110961 166442 221922 277403 277403 277403 277403 277403 277403 277403 277403 277403 277403 27740.Total Costs (6)s(4).(5) 310941 430792 477125 381786 306052 277403 277403 277403 277403 277403 277403 277403 277403 27403 277403 277403
Net Benefit (7)+(3)-(6) *317592 -341827 -273704 -23760 197696 373106 47W46 544327 544327 544327 61868 702848 765786 798585 813037 569458 co L
IPV (VtODO) 1933656
Totat Costs (6).(4)#5) 310941 430792 477125 381718 306052 277403 277403 277403 277403 277403 277403 277403 277403 277403 277403 277403
Net Bmnefit (7).(3)-(6) -317592 -341827 -273704 -23760 197696 373106 470946 544327 54327 544327 618868 702848 765786 79858 813037 569458
6PV ( ooo) 1933656ERR 28.67X

041I4: 12 3 A36t0TUI ITT 8W TSIFICATION LO113HUUC #&MLYSIS: S1W8Q FIIINCO IL HMIX
G ic c Aslj'.i eriod 1 2 3 4 5 a 7 a 9 10 11 12-14 is 1is 17 IS le 20-5sRewne Witb Psoject
Orgies 730746 614720 to7s 1323919 16249 203799 20s67s9 20167W 2036799 2036799 1250 126s50 12 0 1296500 1296500 129500 129So 129sCott. 160546 210340 3S1S10 341302 42060 52650 5256 5255 325850 2 52560 s59s59 359519 359519 359519 359519 359519 3s5919 359519Di lose" 6403 16576 23364 25311 31152 33940 38940 3840 36940 38940 ss6369 3636 3 9 3639 a3639 3638 3639 3869Comb Crops 61654 79576 66496 105795 138394 17292 172992 17292 172992 17292 49427 49427 49427 49427 49427 4942 W 49427 *9427ftwtr- un-69B -1465 -2457 -272 -3451 -2071 -2243 -1323 -1151 -1030 -144 55756 61573 79700 638 9s6s0 0Total (t) 1051549 1119s14 1645965 179271 22168 2771130 2771710 277233e 2773258 2773430 1742786 1742972 1799674 159 1623516 1607697 1842306 1743616"et Revnu Vitlout Project
Graino 780746 93696 109305 1249194 1405343 1561493 166493 13149 131493 1661493 1141060 1142060 1142060 1342060 1142060 1342060 1142060 1142060Cotton 180546 2165 252765 28874 324984 861093 61093 361093 361095 381093 300250 300250 300250 300250 300250 300250 300250 300250Oi seeds 6403 1006S 11764 13444 12 16806 16806 1606 160 106 18612 16612 18612 18612 18612 16612 18612 16612Cash Crope 81354 96224 114595 10966 147337 163707 163707 163707 13707 163707 5246 52465 52465 52485 52411 52485 524S5 52465ForestryTotal (2) 0os5149 L6as3 14m72 162479 192789 2103099 2108099 210809 210609 2103099 3L1340 1513408 1I51400 1513406 1515406 1513406 IS13406 1513408Incrwngtal 0 It *
Crailc 0 -12176 129034 74725 22409C 4706 4753 470 475306 47536 156440 15640 156440 156440 156440 156440 156440 156440Cotton 0 -6316 62745 62926 969 164757 164757 164757 164757 164767 s5926 596 69269 59269 59269 59269 59269 59269Oil ased 0 549 11600 11367 16027 22135 2213 213 22135 22150 17757 17757 17757 17757 17757 17757 lm775 177Cash Crop 0 -164 -2399 -27171 -94 925 9255 925 9285 92 -3056 -305 -3056 -3056 -3058 -3056 -3056 -3036Forestry 0 -696 -146 -2457 -2772 -34SI -2671 -2243 -1323 -1151 -1030 -644 s575s 6175 79700 6361 9690e 0Total (5) 0 -142545 173616 10s92 24104 66032 646312 s240 670160 670332 29376 29W64 2M66 29196 310106 294239 329393 2300cZts
nwestasat Cot. S15171 42M2 873967 132 10267Operating Cost 4329 11092 17535 224S5 17P 2704 274 27064 2706 2706 4 270 04 27064 2054 2 4 204 7054 27064*otal Sh ando MoIdel (6) S16171 430221 6S6s6 191911 125127 17636 27054 27054 27064 27054 27064 27064 27054 27064 27064 270S4 2701.4 27054"at Smnfl t ())i -) -315171 -57256 - 43 4901 19697 60176 641Y53 64216 643100 643270 202324 2 10 259112 264929 203054 267235 302X44 203354Nf tY;0OO) Cs) 988t8 246012
Ia

125ANNEX 3
Table 9CHINA
IRRIGATED AGRICULTURE INTENSIFICATION PROJECT
Annual Net Trade in PrLncival Proiect OutRuts, 1988-89
Anhul Jianguu Shandong China
Not Annuol Not Annual Not Annual Net AnnualTrade Not Trade Net Trado Net STrade N-t
Commodity Unit Status Trade Status Trade Stetus Trade Jtotus Trade
YJsSUrJr *t National LevelWheat 'OOot X 7291 X 1,369 N 281 N 14,550Naito 'OOOt - - - - X 363 M 300Rice 'OOOt - - - - N 72 H 1,200
ZThns _ t -RAt4analevalSoybean 'OOOt - - - - X 3 X 1,320Cotton OOOt M 562 X 144 M - X 468
Oilseeds 'OOOt X 12 X 234 X 6 X 322
aotes: I Project counties net trad- in grains, wheat, maize, rice, soybean and others.2 Project counties not trade.3 arosa provincial out-sales and out-allocations of unprocessed grains, wheat, maize, rice,
soybean and others.4 Gross out-sales and out-allocations.
Sourcst SORO ehAnssa ztatistical YasrboPk (Beijing: SSB, 1990) for national 1988 data. MaizeImport data from s vi.w f Commoditv Marks s, January 22, 1990. Provincial data from PMOs.
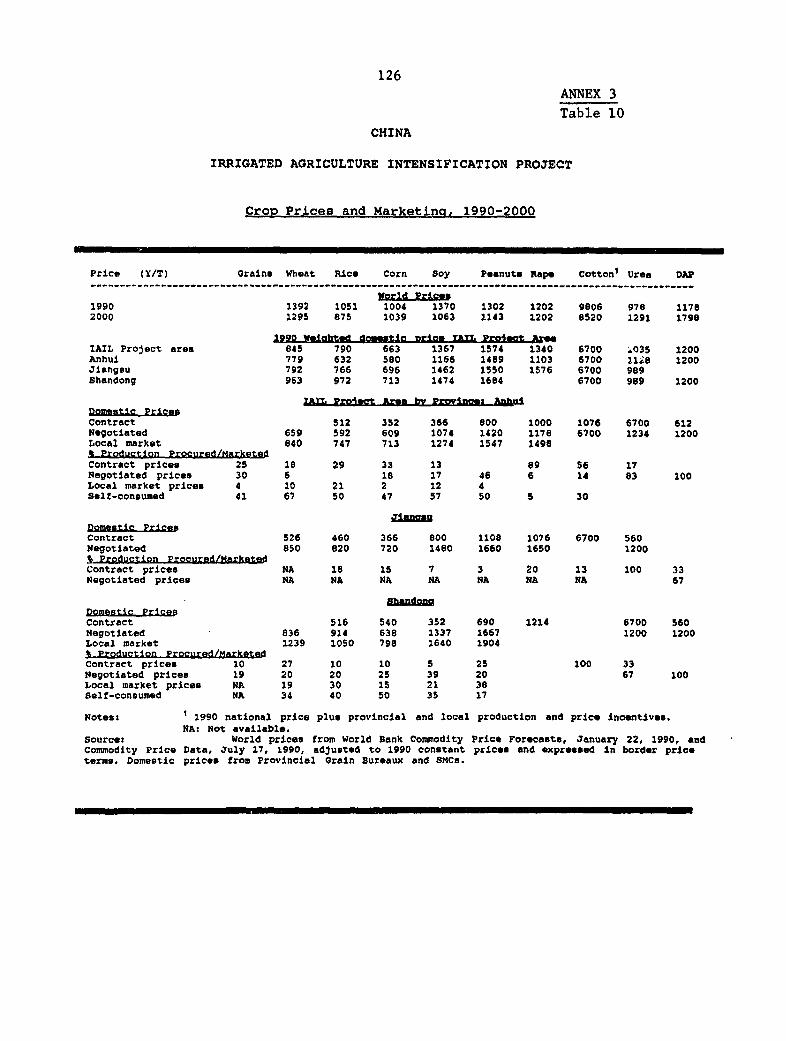
126ANNEX 3
Table 10CHINA
IRRIGATED AGRICULTURE INTENSIFICATION PROJECT
Crop Prices and Marketing, 1990-2000
Price (Y/T) Grains Wheat Riee Corn Soy Peanuts Rape Cotton' Urea DAP-------------------------------------------------------------------- _ ------- __-----------------.------
1990 1392 1051 1004 1370 1302 1202 9806 978 11782000 1295 875 1039 1063 1143 1202 8520 1291 1798
1990 Weighted doetlic price 1ATL Proia-t A.seIAIL Project area 845 790 663 1367 1574 1340 6700 .035 1200Anhui 779 632 580 1166 1489 1103 6700 1l8 1200Jiangsu 792 766 696 1462 1550 1576 6700 989Shandong 963 972 713 1474 1684 6700 989 1200
lpAm Project Area by Provinoet AnhuiDomntic Prie-scontract 512 352 366 800 1000 1076 6700 612Negotiated 659 592 609 1074 1420 1178 6700 1234 1200Local market 840 747 713 1274 1547 1498C Production Procured/MarketedContract prices 25 18 29 33 13 89 56 17Negotiated prices 30 6 18 17 46 6 14 83 100Local market prices 4 10 21 2 12 4Self-consumed 41 67 50 47 57 50 5 30
DomestiC PrXeerContract 526 460 366 800 1108 1076 6700 560Negotiated 850 820 720 1480 1660 1650 1200% Production Procurgd/MarketeaContract prices NA 18 15 7 3 20 13 100 33Negotiated prices NA NA NA NA NA NA NA 67
Domestic Pri cesContract 516 540 352 690 1214 6700 560Negotiated 836 914 638 1337 1667 1200 1200Local market 1239 1050 798 1640 1904% Production Procured/NarketedContract prices 10 27 10 10 5 25 100 33Negotiated prices 19 20 20 25 39 20 67 100Local market prices NA 19 30 15 21 38Self-consumed NA 34 40 50 35 17
Notes: 1990 national price plus provincial and local production and price incentives.NA: Not available.
Source World prices from World Bank Commodity Price Forecasts, January 22, 1990, andCommodity Price Data, July 17, 1990, adjusted to 1990 constant prices and expreased in border priceterms. Domestic prices from Provincial Orain Bureaux and SMCs.
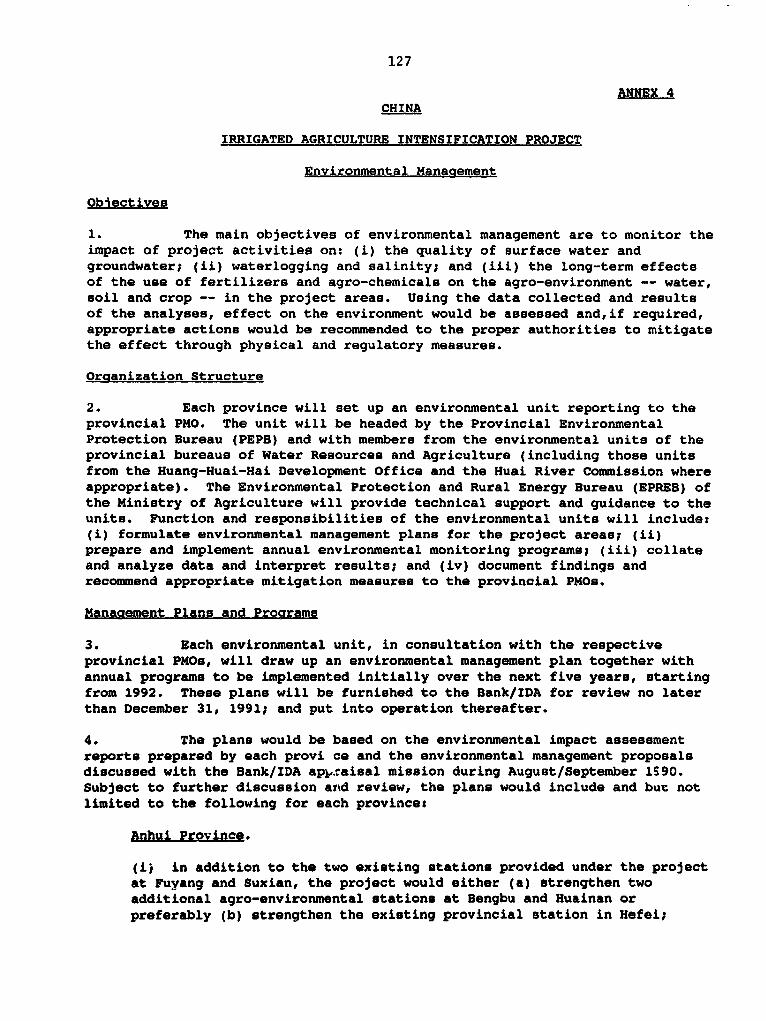
127
ANNEX 4CHINA
IRRIGATED AGRICULTURE INTENSIFICATION PROJECT
Environmental Management
Objectives
1. The main objectives of environmental management are to monitor theimpact of project activities on: (i) the quality of surface water andgroundwater; (ii) waterlogging and salinity; and (iii) the long-term effectsof the use of fertilizers and agro-chemicals on the agro-environment -- water,soil and crop -- in the project areas. Using the data collected and resultsof the analyses, effect on the environment would be assessed and,if required,appropriate actions would be recommended to the proper authorities to mitigatethe effect through physical and regulatory measures.
Organization Structure
2. Each province will set up an environmental unit reporting to theprovincial PMO. The unit will be headed by the Provincial EnvironmentalProtection Bureau (PEPB) and with members from the environmental units of theprovincial bureaus of Water Resources and Agriculture (including those unitsfrom the Huang-Huai-Hai Development Office and the Huai River Commission whereappropriate). The Environmental Protection and Rural Energy Bureau (EPREB) ofthe Ministry of Agriculture will provide technical support and guidance to theunits. Function and responsibilities of the environmental units will include:(i) formulate environmental management plans for the project areas; (ii)prepare and implement annual environmental monitoring programs; (iii) collateand analyze data and interpret results; and (iv) document findings andrecommend appropriate mitigation measures to the provincial PMOs.
Management Plans and Programs
3. Each environmental unit, in consultation with the respectiveprovincial PMOs, will draw up an environmental management plan together withannual programs to be implemented initially over the next five years, startingfrom 1992. These plans will be furnished to the Bank/IDA for review no laterthan December 31, 1991; and put into operation thereafter.
4. The plans would be based on the environmental impact assessmentreports prepared by each provi ce and the environmental management proposalsdiscussed with the Bank/IDA appraisal mission during August/September 1S90.Subject to further discussion and review, the plans would include and but notlimited to the following for each province:
Anhui Province.
(i) in addition to the two existing stations provided under the projectat Fuyang and Suxian, the project would either (a) strengthen twoadditional agro-environmental stations at Bengbu and Huainan orpreferably (b) strengthen the existing provincial station in Hefei;
128
(ii) to establish 59 agro-ecological experimental sites within theproject areas in 2 counties, 5 farms, 10 townships and 42 villages, andone or two conservation areas for plant species unique to the locality;
(iii) to operate and maintain the existing 50 water quality monitoringstations on the tributaries of the Huai River where most of the projectsurface water irrigation schemes are located, in order to complement thewater quality monitoring in the main Huai River channel being carried bythe Environmental Protection Unit of the Huai River Commission; and
(iv) to operate and maintain the existing, and establish newobservation wells to monitor changes in groundwater regime - quality,drawdown, specific yields, water level etc. - in the groundwaterirrigation areas;
Jianasu Province.
(i) to upgrade, operate and maintain the existing 43 monitoringstations (see Map in Appendix 1) operated by Jiangsu 8WR on the GrandCanal, main irrigation canals and drainage channels in northern Jiangsu,with provision to cover the standard range of parameters for waterquality monitoring; and
(ii) to strengthen the existing agzi-environmental monitoring stationnetwork in Huaiyin, Lianyungang, Xuzhou and Yancheng municipalities'project areas and as well as the main provincial station.
Shandong Province.
(i) to establish 15 new county stations, one for each county, inaddition to the 13 existing county agro-environmental monitoringstations to be operated and maintained under the project;
(ii) to strengthen the existing provincial station in Jinan to enableit to coordinate and supervise the activities of the 28 county stationsmore effectively;
(iii) to operate and maintain the existing observation wells andestablish new ones, if necessary, to monitor changes in thegroundwater regimes - water level, drawdown, specific yields, qualityetc. - in the project groundwater irrigation areas;
(iv) to establish water level observation wells along the Liangji Canalin the Nansi Lake Diversion Scheme and the Dongyu River in the XiezhaiIrrigation Scheme to monitor potential rise of water table level and theassociated secondary soil salinization; and
(v) to establish monitoring stations to monitor changes in thelimnology of the Nansi Lake, including silting sections to monitorsilting of the Lake deposited by the diverted Yellow River water.
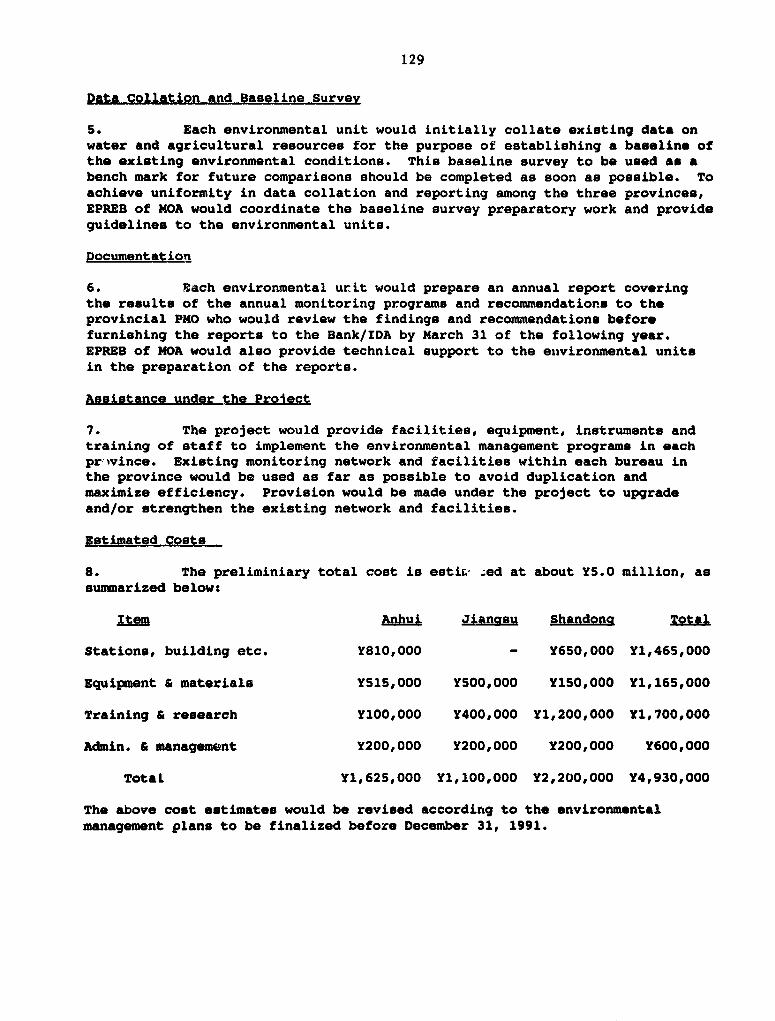
129
Data Collation and Baseline Survey
5. Each environmental unit would initially collate existing data onwater and agricultural resources for the purpose of establishing a baseline ofthe existing environmental conditions. This baseline survey to be used as abench mark for future comparisons should be completed as soon as possible. Toachieve uniformity in data collation and reporting among the three provinces,EPREB of MOA would coordinate the baseline survey preparatory work and provideguidelines to the environmental units.
Documentat ioy
6. Each environmental urit would prepare an annual report coveringthe results of the annual monitoring programs and recommendations to theprovincial PMO who would review the findings and recommendations beforefurnishing the reports to the Bank/IDA by March 31 of the following year.EPREB of MOA would also provide technical support to the eivironmental unitsin the preparation of the reports.
Assistance under the Prolect
7. The project would provide facilities, equipment, instruments andtraining of staff to implement the environmental management programs in eachprovince. Existing monitoring network and facilities within each bureau inthe province would be used as far as possible to avoid duplication andmaximize efficiency. Provision would be made under the project to upgradeand/or strengthen the existing network and facilities.
Estimated Costs
8. The preliminiary total cost is estic ;ed at about Y5.0 million, assummarized below:
Item Anhui Jianasu ShandQna Total
Stations, building etc. Y810,000 - Y650,000 Y1,465,000
Equipment & materials Y515,000 Y500,000 Y150,000 Y1,165,000
Training & research Y100,000 Y400,000 Y1,200,000 Y1,700,000
Admin. & management Y200,000 Y200,000 Y200,000 Y600,000
TotaL Y1,625,000 Y1,100,000 Y2,200,000 Y4,930,000
The above cost estimates would be revised according to the environmentalmanagement plans to be finalized before December 31, 1991.

130ANNEX a /APPDIX 1
WATER QUALITY MONITORING STATION NETWORK
NRNTHER JIANGSU
,- AR t ) I z a
-'A" '% j< m
Ut a~~~~~~~~~~~~~t
* >X
Groundwater station
Surface water station
Source: Bureau of Water Resources, Jiangsu Province.
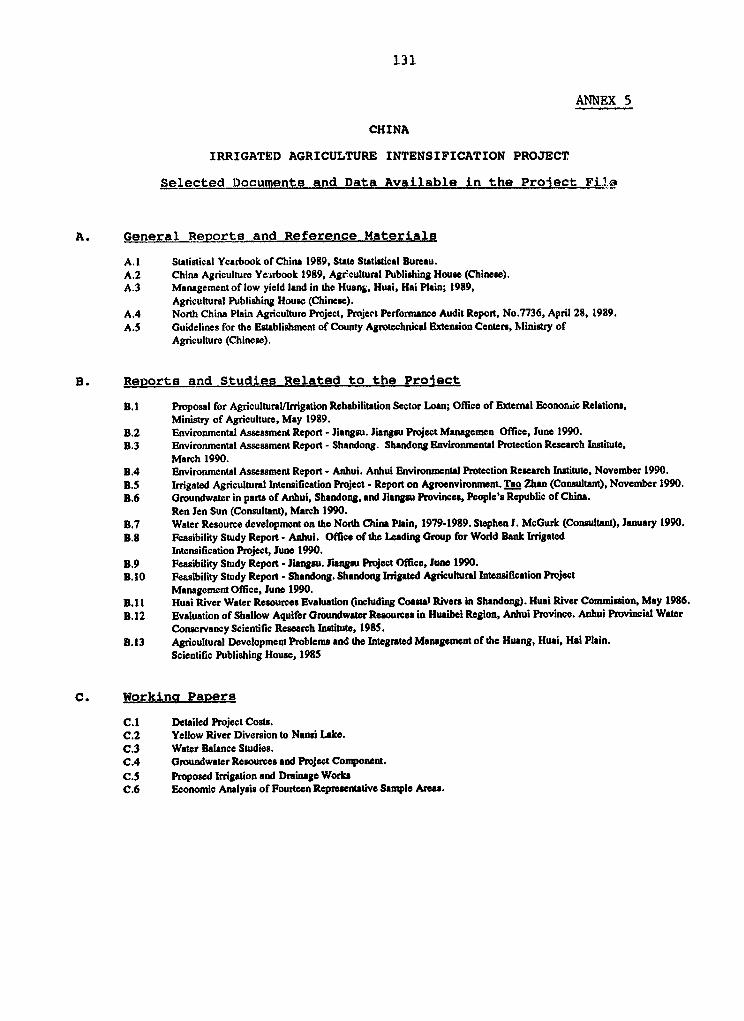
131
ANNEX 5
CHINA
IRRIGATED AGRICULTURE INTENSIFICATION PROJECT
Selected Documents and Data Available in the Pro ect FiZ,
A. General Reports and Reference Materials
A. 1 Statistical Yearbook of China 1989, State Statistical Bureau.A.2 China Agriculture Yewrbook 1989, Agrecultural Publishing House (Chinese).A.3 Management of low yield land in the Huang, Huai, Hai Plain; 1989,
Agricultural Publishing House (Chinee).AA4 North China Plain Agriculture Project, Project Performance Audit Report, No.7736, April 28, 1989.A.5 Guidelines for the Establishment of County Agrotechnical Extension Centers, Minidry of
Agriculture (Chinese).
B. Reports and Studies-Related to the Proiect
B. Proposal for AgriculturaUlrrigation Rehabilitation Sector Loan; Office of External Econoruic Relations,Ministry of Agriculture, May 1989.
B.2 Environmental Assessment Report - Jiangsu. Jiangsu Project Managemen Office, June 1990.B.3 Environmental Assessment Repont - Shandong. Shandong Environmental Protection Research Institute,
March 1990.B.4 Environmental Assessment Report - Anhui. Anhui Environmntal Protection Research Institute, November 1990.B.5 Irrigated Agricultural Intensification Project - Report on Agroenvironment. Tao Zhan (Consltant), November 1990.B.6 Groundwater in pats of Anhui, Shandong, and Jiansu Provinces, People's Republic of China.
Ren Jen Sun (Consultant), March 1990.3.7 Water Resource developmnnt on the North China Plain, 1979-1989. Stephen 1. McGurk (Consultant), January 1990.B.8 Feasibility Study Repot - Anhui. Office of the Leading Group for World Bank Irigated
Intensification Project, June 1990.B.9 Feasibility Study Report - Jiangsu. liangsu ProJect Office, June 1990.B.10 Feasibility Study Report - Shandong. Shandong Irrigated Agrieultural Intensification Ptoject
Managenent Office, June 1990.B.11 Huai River Water Resources Evaluation (including Coastal Rivera in Shandong). Huai River Commission, May 1986.B.12 Evaluation of Shallow Aquifer Groundwater Resourees in Huaibei Region, Anhui Province. Anhui Provincial Water
Conservancy Scientific Research Institute, 1985.B.13 Agricultural Development Problems and the Integrated Management of the Huang, Huai, Hai Plain.
Scientific Publishing House, 1985
C. Workina Papers
C.1 Detailed Project Costs.C.2 Yellow River Diversion to Nansi Lake.C.3 Water Balance Studies.CA4 Groundwater Resources and Project Component.C.5 Proposed Irrigation and Drainage WorksC.6 Econoniic Analysis of Fourten Repruentative Sample Areas.
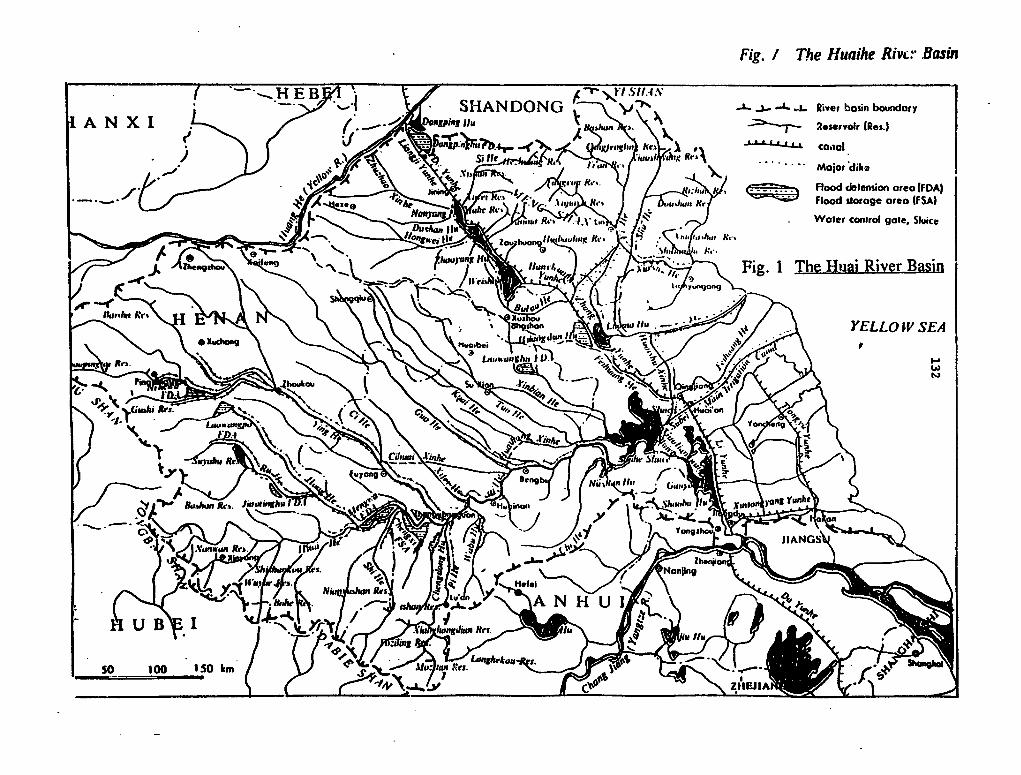
Fig. / The Huaihe RivMu Basin
7 HEB1 '- 7-trsr...'-1/ _ { t SHANDONG -J- -A- JL River basin boudary
DeA N X In.< t f . _ . - S llu k ~ , , , p. \ 2eservoir lReL)
~~~~~~4' > ~. ~ .( '*J" +'NI'>U ,> * / JfJtLL LLJ co.io
) <.' gEAS S*l,. -R.. ~* wwl ahrg R Major dike
~~* ' 1 ~ ~~~~ 1k.. ,:I,., ~~~~~~~Flood delension areo (FDAl
* 'h" ~~~* 4' .~~~uii*i R*~~~ ,uJ.wa Rr ~ ~ ~ Flood storoge area IFSA)
1a eua, Re% 1. I * t Woter control gale. SlWice
Fig. 1 The Hua iRiver Basin
0 Xud" Jun.YELLOIVSEA
50 100 150 km .tlu: sun Rn.~ ~ ~ ~ ~~n
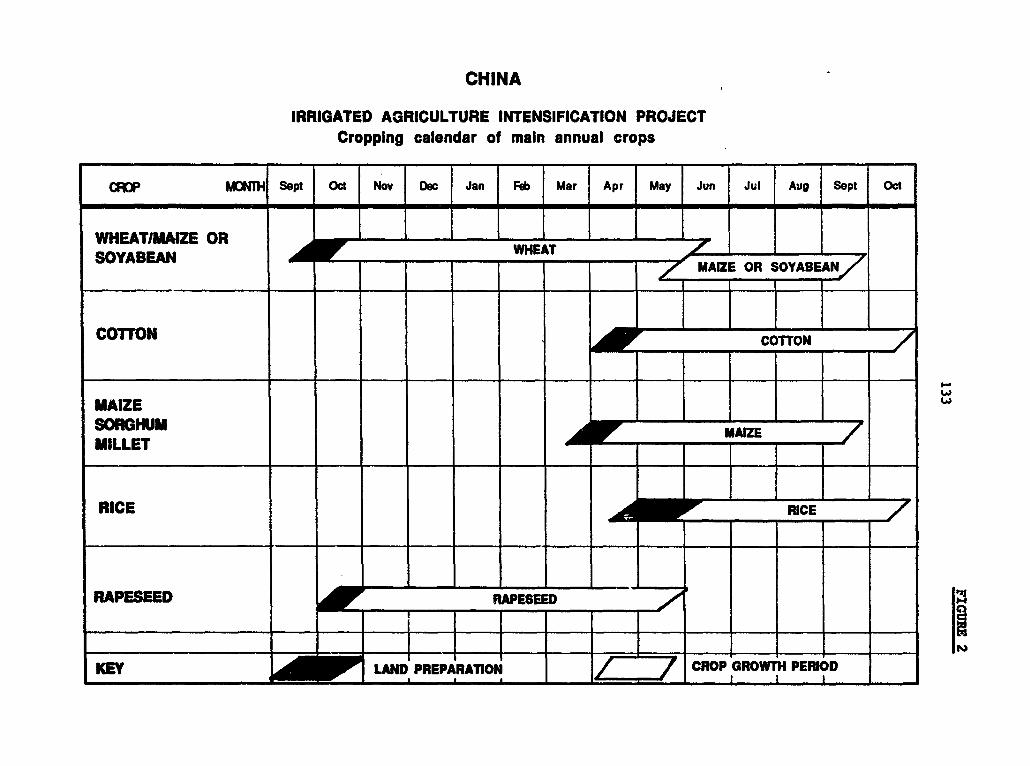
CHINA
IRRIGATED AGRICULTURE INTENSIFICATION PROJECTCropping calendar of main annual crops
CFK)P MOITH Sept Oct Nov Dec Jan Feb Mar Apr May Jun Jul Aug Sept _
WHEAT/UMZE OR - = = = - _ _SOYABEAN ~~~~~~~~WHEATSOYABEAN -- - WH- -T ii E OR SOYABEAN
COTTON JLLCOTTON
MAIZE
MILLET - M 1+
RICE i -CE-
|RPESEED - -3EE
_EY . _ _KEY _ LAND PREPARATION 1//CROP GROWTH PERIOD__~ p= _ , .

i H~~~~~~~~~~~i
0 |;01,2
C-)
l

CHART NO. 2-A- 135 -
CHINA
IRRIGATED AGRICULTURE INTENSEFICATIOIN PROJECT
Implementation Program - Anhul Province
ITEM C0 YEA 190 IO_ 199 3092 __ 1993 __ 1 4 _ 1006 1_006OUARTER 3 4)1 23 14 11 2 34 1 2 3 4 1 2 3 4 1 2 3 4 1 2
IRRIGATIONHuaihe Irrig. Area = _ ! _ I I _ _ __
Ylnghe Irrig. Area 111 1 - I I I I
Cihuaixinhe Irrig. Area
Qlanhe Irrig. AreaBeifohe Irrig. Ase_Tubowell Irrig. AreaRURAL ROADS
LAND IMPROVEMENT
Land LevelingDeep PlowingEquipmentSEED DEVELOPMENT
BuildingsEquipmentAGRO-TECH. EXTENSION
BuildingsEquipmentFARM MECHANIZATION
Service StationsAgri-mach/AccessoriesCROP PROTECTION
Pest Forecasting Stn.
Materials I _1
AFFORESTATION
NuseriesTree Planting
AGRO-ENVIRONMENT PROTN
BuildingsEquipmentINST. DEVELOP/SUPPORT
TrainingTechnical AssistanceResearch
KEY Desion ConstructioImpiemuntatlen

CHART NO. 2-8
- 136-
CHINA
IRRIGATED AGRICULTURE INTENSEFICATIOIN PROJECT
Implemon"tston Program - Jiangsu Provinco
ITEM C RSRMV 1990 loo Ie log9 1 1093 1 10e4 o195gs loseOVARER 3 314 111[21314 r26[11 1 213 14 1 1 2 3 4 1 l2 3 4l 1
GRAND CANAL I- I I I I l I I I II1TT1 Hoign P/t8Xtion I 5 I TlIrr
Llubaoiangn PJ5Xthn t I 1 _ l
Modiflttb ta Exbisng 8tucur ; C_ s__
Xuqixri Sub-S0tatio Uppvdno __ _____C **_ _- _ _
IRRIGATION AREAS __ _____Yunxi Inig Area ___ E ____
Vibeiffnan kdg. !Amlfe lt|-____ Honqz* g Amde-
Co"tl Rog4m - 9. Area ^|r1l _____
LAND lIMPROVEMIENT Tl lI III _ __ ___Land Ltng
SEED DEVELO7"MENT _ __
Sew Farm krnpowrnnnt T_ = _ __
' uildings | } t X | | W | | | W |l_ X
Eqipment -
AGRO-TECH. EXTENSION III IIIIITI n IFarm Improvement IIII!Sr=-c -- 4 7
3lldings _ _ __
I Equpment 1_ZZz
LFARM MiECHANIZATION __
Srv*tice Stations 711IIIITm --IActrl-mach/Accocssrlos IIII 1 2
A FFORESTATION m LLL III t
rTree Planting r IIzz
|AGRO-ENVIRONMWIEN'r PROTN||| | _ -
|Equipment i|||||_ __
|INST. DEVELOPISUPPORT {§|||j||||LIIIIIII_ H _|Training 12 1I *
ITechnical Assbtns ||m e __
KEY rO oelon br4| 111iddin _Conetructlon Ibzza Implementotion
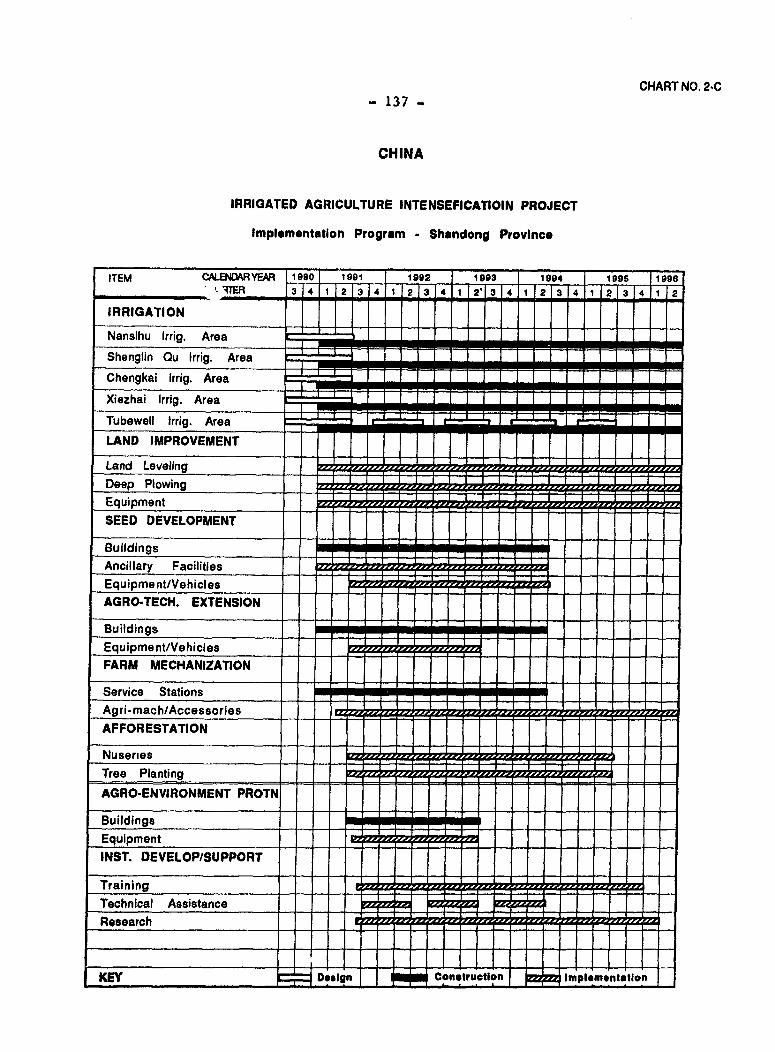
CHART NO. 2-C- 137 -
CHINA
IRRIGATED AGRICULTURE INTENSEFICATIOIN PROJECT
Implementation Program - Shandong Province
ITEM CALEND EAR E 9,1 1 9 a1 _ _ 1992 _ 1993 1994 1 996 1 96
'_ 3 _ _ 3 4 1 2 3 4 1 2 3 4 1 2- 3 4 1 2 3 4 1 2 3 41 1 2
IRRIGATION
Nansihu Irrig. Area _ _ _ El...... _ _ _
Shenglin Qu Irrig. Area I_
Chengkai Irrig. Area = _ _ _
Xiezhai Irrig. Area =_
Tubewell Irrig. Area _ __n _ _ _ _
LAND IMPROVEMENTl x f- T _ ~~~~~~~~~~~I f I I I I I -ILand LevelingDeep Plowing -- Z22
EquipmentSEED DEVELOPMENT
BuildingsAncillary Facilities
Equipme nt/Vehicles 2
AGRO-TECH. EXTENSION
BuildingsEquipment/VehiclesFARM MECHANIZATION
Service StationsAgri-mach/Accessories
AFFORESTATION
Nuseries
Tree Planting
AGRO-ENVIRONMENT PROTN
BuildingsEquipment 2 lINST. DEVELOP/SUPPORT
TrainingTechnical AssistanceResearch
KEY Design Consiructi n r mplementatlon

DI S*ab u r c o m a n t 8 e h d u I do
'31 .. 3CIO -Total LAIL.
Dl*bumt hadul By Eh 8omr ~ ~ ~ ~~~Sazacui1993 /
Diebusuemen Schedule _,y _a=h .eme.t.w
30
2~~~~~~~~~~~~~~~~~~~~~~~~
IBRDIIDA ~ 1994 Smaoa

! . ~~~~~~~~~~~~~~~~~~~~~~~~~~~~~~~~C H I N A
5' c ~~~~~~~~~~~~~~~~~IRRIGATED AGRICULTLJRELnsell Clearaqzl. '. . ~~~~~~~~~~~~~~~~INTENSIFICATION PROJFCT
I~ ~ \ tI\
' Houx > s r . <,<, ,. \v,, . . . :. . .> . . .,-, > ,15)T~~,
SI-q "o QTll o .- XSI
As.oh ,- X-h:-j\w:Lu°
Luoyo+y ^ C _ t t u ler& C . L p tinlyunyLubg ve o w R .c D.ve ooyeo a eD~~~~~~~~~~~(2* . E U~~~~~~~~~~~~~~~"
:o ! N _XChang Shogq uU y XzhoeSt,- - p t :HeRv, *.5nd6Uo;
PerLsdrr3shon t;.' \ -FtLqibeiJ L LD 2 > J { \ f T }? a;~~~~~~~~llo i5
i S. LUbb~~, , sR -q.,D.,
Noyogct ~s - S ~ _Iltentino BunJreZhomodt<r >> G ; c e L-JtW ,t Vs 2, t ,- :~~~6-9,h
5 . I < \ < 94 s ,, Huo o: . TL lallots~~~~~~~~~~~~~~~~~~~~~~~~S4,HA
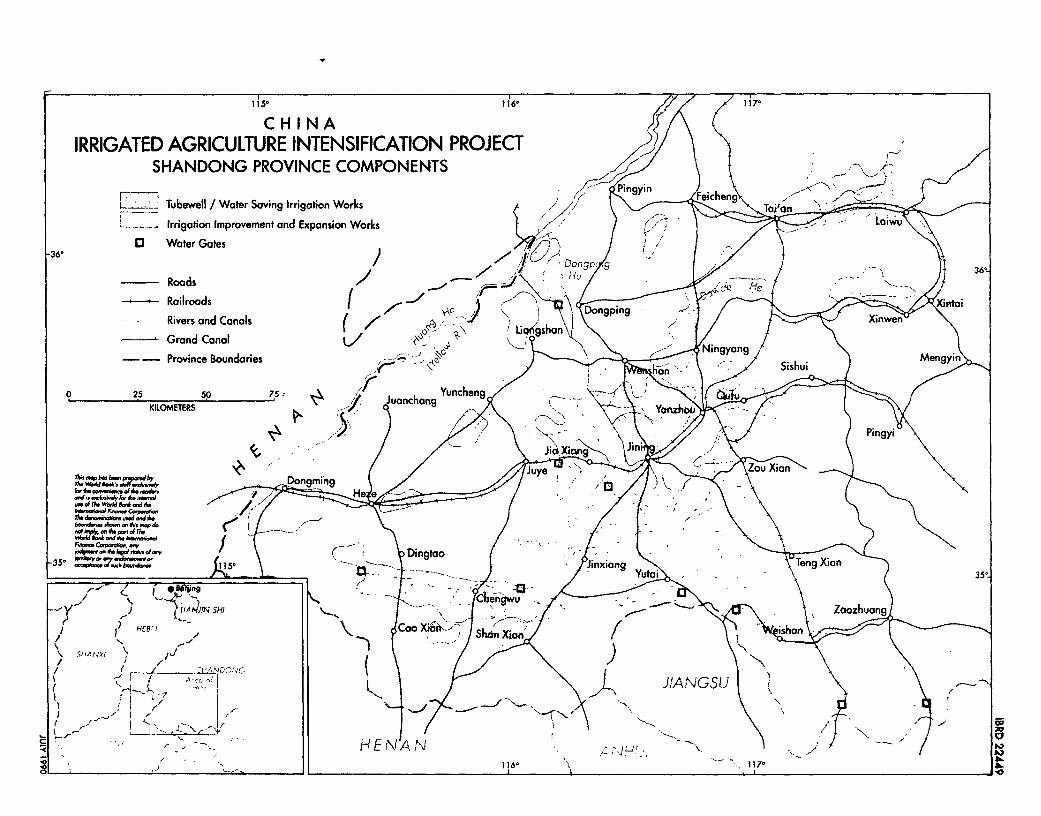
1 15 116' 1170
CHINAIRRIGATED AGRICULTURE INTENSIFICATION PROJECT
SHANDONG PROVINCE COMPONENTS <t
<~~~~~~~~~~~~~~~~~~~~~~~~~~i SAin) f Li .i] Tubewell / Water Saving Irrigation Works Pni Fe,c/e 9\ , __- Irrigation Improvement and Expansion Works
La iv;- 1 Water Gates
360 /
Roads/Railroads
Rivers and Canals 0 nGrand Canal L gn
- - Province Boundaries Mengy
,{_ \ 2t X, lh,an"-@ of 5csh~~~~~~~~Sisui
o 25 50 75z Y uncheng .; 0 ~~~~KILOMETERSJanon
ii > :) / , \ a 0 \ | / .9 / Pi~~~~~~~~~~~~~~~~~ngyi\
/~~~~~~~~y / i Xa>Jii /
7f. .6
|;zkd if.. WB -- A. He
~~~~ t . o- o T ./t^ X~~~. -- - , ,
0 o b Dingtao-35, _ LS -)ining Teg ain 5350 ~~~~~~~~~~~~~~~~~~~~~~~~~~~~~~~~~~~~ 115 ~ ~ ~ ~ ~ ~ ~ ~ ~ ~ ~ ~ ~ ~ ~ ~ ~ ~ ~ ~ ~ ~ ~ ~ ~ ~ 3~
t , t~~;f)''Pl rPJSH)<<. \, - Znozhuan
/ a' z_ <:D¢rG i \ / \ > '0 SflHAr
00Shn 4X!
/ ; ,) > .- 116° 1I7_
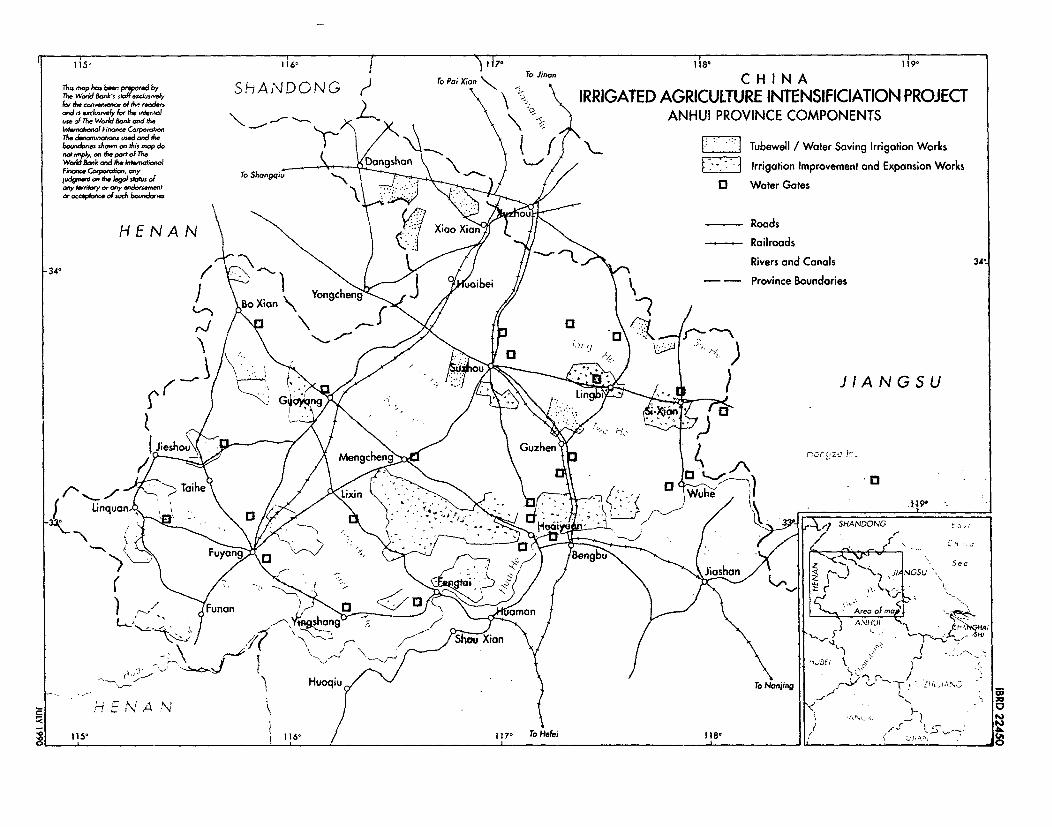
T phe by CL Toj na1 i1n8 CH I9Th mop ho bYnpapaW by To FtANDONG J ToPoi Xion C H I N A1w the w
L IRRIGATED AGRICULTURE INTENSIFICIATION PROJECT.n 7^v wold Smkmd th. ANHUI PROVINCE COMPONENTSkIn3inorne. Cowprhoo X.Th. 4so,,o~o.od ad dt.b55-oh. pad dof r. d /j j: Tubewell / Water Saving Irrigation WorksFnanc Co.poratciw hon \ S
Irrigation improvement and Expansion Worksrany roan.y a, a n ..... .:- y \ -)) t / .......... ............. 0 Water Gates
H E N A N \ \ .. \ 5 Xiao Roads
Railroads34\
Rivers and Canals 34tj / XXion \ 9 S J turi ei- - Province Boundaries
r 5 W ; $ } i ~~~~~JIANGSU
f Linquan~~~~~~~~~~~~~~~~~~~~~~~~~~~~~~~~~~~~i |Jieshou\ Me/ Gahen .
/)) 7.~on t 7\ 3eghl\t r ; 2
Linq n T j /
31,~~~~~~~~
. , N AN 0'
S 2 * R rsr.<.s h1 o_o 115° 1,1!6° /17 Tolei18 , 5_
0~~~~~~~~~~~~~~~~~~~~~~~~~~~~~~~~~~~~~~~~~~~~~~~~~~~~~~~~~~~~~~~~~~~~~~~~e
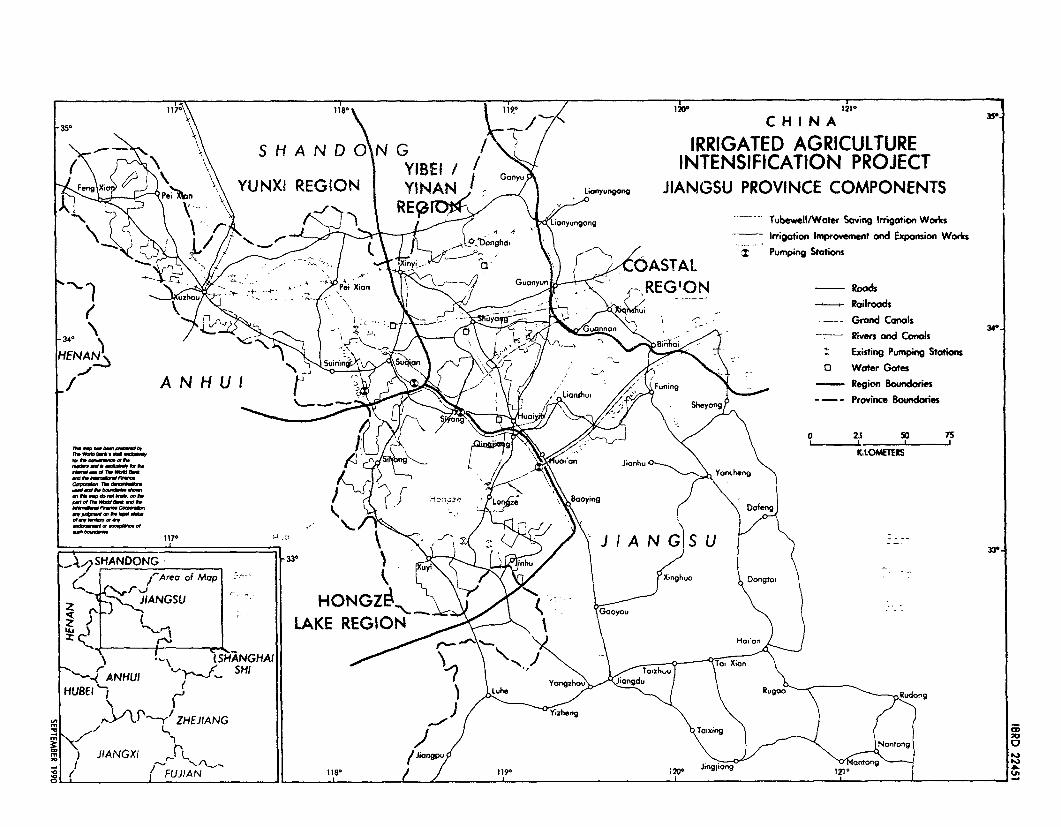
117°\ lie,\ 1 t21°
35° C HINA
S H A N D ON G /' IRRIGATED AGRICULTURE( ~~~~~~~~~~~~~~YIBEI// INTENSIFICATION PROJECTi<Feng Xio J)V\ePe A\ YUNX REGION YINAN I Lianyungang JIANGSU PROVINCE COMPONENTS
_anyungong Tubewell/Water Saving Irrigotion Wodrs
-:4go Irrigation mroemnent ond Expartsion WorkCs
/ ( I / ? Pumping Sta/ions
) ' " t _, -tPe Xo \<~ Ga~REGION RRocds-- _R.a- Railroads
u ~~~~~~~~~~~~Grand Canals 34.
34NA Bin-o.Rivers and CanalsH ENAN) =Existing Pumpin StotkOIs Sul~~~~~~~~~~~ 0 Water Gates
tS ~~~~~A N H U I unn - ,,,,,,,_,,,drieANHUI _ K V CtSI t j/ ,"ffituansti's Jinhu° anehBtgXs
n _ I ,grw 4 rI IF IKlOMETES
0" rftwa Yo -le Lo aoi9 \Dtng _ fr t k .Buoying
_ _ _ _ tl,117 ,\ 9 %(- / J I A N GS U 4,_iSHANDONG X,33° nangtoi
I-Areo of Mop ng uc gto,
2 tv )^>s_JIANGSU HONGZ6 g ft= 9X )-{ ) uj; LAKE REGION¢_. y ss i_ \ ~~~~~~~~~~~~~~~~~~~~~~~~~~~~~HaComLf-
N ! 9\ f- SHANGHAt a
HUBEI Rus X l Z RuHEJIdG
zo < P-t)ZHEJIANG Jg~Yzeg>X\
< \ ) y J bCixing 7 t NN~~~~~ ~ ~~~~~~~~~~~~~~~~~~~~~~~~~~~~~~~~~antong cw )JIANGX( brL I JianpXo2
8 ( 1} ~~~~FUJIAN 1 11,9° 120° IT.an 1


![W z z z z z z z z z z z z z z z z z z z z z z z z z z z z z z z z...#RT Z ] o [ v u W z z z z z z z z z z z z z W v [ ^ ] P v µ W z z z z z z z z z z z z z z z z z z z z z z z z z](https://static.fdocuments.in/doc/165x107/60949c1fa8e30d779b79b9c0/w-z-z-z-z-z-z-z-z-z-z-z-z-z-z-z-z-z-z-z-z-z-z-z-z-z-z-z-z-z-z-z-z-rt-z-o.jpg)