z$;> . : :.: : :. .., ., - US Department of Energy · Combustion Engineering (CE) has operated a...
63
. ., ,& : .z$;> q3zff- . : :.: : :. .., ., : :j.,, :, : : “’ .,. .: . . . . ..j.:.,:.:..,: ,: *; .jI ::,.,, :,:: : .:j:.: ,.. . :, ,..: ::. :: ::. .” : . . :.:... . . : :. :: ::.. .’ :, j;: :j ,:::: ,~ a.z.xm :,. .:. : ,. . . :: : :..: .I.. :..... .I: . : !. i
Transcript of z$;> . : :.: : :. .., ., - US Department of Energy · Combustion Engineering (CE) has operated a...

. ., ,&
: .z$;>
q3zff- . : :.: : :. .., ., : :j.,, :, : : “’ .,. .: . . . . ..j.:.,:.:..,: ,: *; .jI :: ,.,, :,:: : .:j:.: ,.. . :, ,. .: ::. :: ::. .” : . . :.:... . . : :. :: ::.. .’ :, j;: :j ,:::: ,~
a.z.xm :,. .:. : ,. . . :: : :..: .I.. :..... .I: . : !. i

The Oak Ridge In&tute for Science and Education (ORISE) was established by the U.S. Department of Energy to undertake national and international programs in science and engineering education, training and management systems, energy and environment systems, and medical sciences. ORISE and its programs are operated by Oak Ridge Associated Universities (ORAU) through a management and operating contract with the U.S. Department of Energy. Established in 1946, ORAU is a consortium of 82 colleges and universities.
NOTICES
The opinions expressed herein do not necessarily reflect the opinions of the sponsoring institutions of Oak Ridge Associated Universities.
This report was prepared as an account of work sponsored by the United States Government. Neither the United States Government nor the U.S. Department of Energy, nor any of their employees, makes any warranty, expressed or implied, or assumes any legal liability or responsibility for the accuracy, completeness, or usefulness of any information, apparatus, product, or process disclosed, or represents that its use would not infringe on privately owned rights. Reference herein to any specific commercial product, process, or service by trade name, mark, manufacturer, or otherwise, does not necessarily constitute or imply its endorsement or recommendation, or favor by the U.S. Government or any agency thereof. The views and opinions of authors expressed herein do not necessarily state or reflect those of the U.S. Government or any agency thereof.

-w
,..“*
--
c
ORISE 94/D-63
DESIGNATION SURVEY COMBUSTION ENGINEERING SITE
WINDSOR, CONNECTICUT
Prepared by
E. W. Abelquist and D. A. Gibson
Environmental Survey and Site Assessment Program Energy/Environment Systems Division
Oak Ridge Institute for Science and Education Oak Ridge, TN 37831-0117
Prepared for the
Office of Environmental Restoration U.S. Department of Energy
FINAL REPORT
APRIL 1994
This report is based on work performed under contract number DE-AC05760ROOO33 with the U.S. Department of Energy.
Combustim Enginacring - April 5.1994

-
DESIGNATION SURVEY COMBUSTION ENGINEERING SITE
WINDSOR, CONNECTICUT
Prepared by: E. W. Abelquist, Project &.ader Environmental Survey and Site Assessment Program
Reviewed by: Date: W. L. Beck, Acting Laboratory Manager Environmental Survey and Site Assessment Program
Reviewed by: Date: 4,)b/?y
Environmental Survey and Site Assessment Program
Reviewed by: A. T. Payne, Quality Assurance Officer
Date: j//7/ 7 y
Environmental Survey and Site Assessment Program
Reviewed by:
/hvironmental Survey ‘md Site Assessment Program
Combustion JZa@ec~ - April 5, 1994
_” _--- .._- -

,I”.*
d
*-_
.sm
ACKNOWLEDGEMENTS
The authors would like to acknowledge the significant members:
F’IELD STAFF
J. D. Berger A. L. Mashburn R. B. Slaten
contributions of the following staff
LABORATORY STAFF
R. D. Condra R. L. Epperson M. J. Laudernan S. T. Shipley
CLERICAL STAFF
T. T. Claiborne D. A. Cox R. D. Ellis K. E. Waters
ILLUSTRATORS
M. A. Henke T. D. Herrera
Combusth Emginceriq - April 5,1994
---__--_- . . ---
TABLE OF CONTENTS
1..
. .4. Combustim F!&aehq - April 5.1994 i
PAGE
List of Figures .............................................. .ii ...
List of Tables .............................................. 111
Abbreviations and Acronyms ..................................... iv
Introduction and Site History ...................................... 1
Site Description ............................................. .2
Project Organization and Responsibility ................................ 3
Objective ...............................................
Document Review ............................................ .3
Procedures ................................................. .
Findings and Results .......................................... .7
Comparison of Results with Guidelines . . .
Summary . . . . . . . . . . . . . . . . . . . . .
References . . . . . . . . , . . . . . . . . . . .
Appendices:
Appendix A: Major Instrumentation
Appendix B: Survey and Analytical Procedures
Appendix C: Summary of Department of Energy Residual Radioactive Material Guidelines
. 12
. 13
. 40
- --11 -.-. -----

LIST OF FIGURES
PAGE
.-
“-
_.
.“. .,
,.m
FIGURE 1: Location of the Combustion Engineering Site, Windsor, Connecticut . . . . . . . . . . . . . . . . . . . . . . . . . . . . , . . . . 14
FIGURE 2: Plot Plan of the Combustion Engineering Site, Windsor, Connecticut . . . . . . . . . . . . . . . . . . . . . . . . . . . . . . . . . 15
FIGURE 3: Building 3, Drains- Measurement and Sampling Locations . . . . . . . . . . 16
FIGURE 4: Building 3, High Bay, West Wall-Measurement and Sampling Locations . . . . . . . . . . . . . . . . . . . . . . . . . . . . . . . . . . 17
FIGURE 5: Building 3, East Wall-Measurement and Sampling Locations . . . . . . . . 18
FIGURE 6: Building 3, West Wall Above Crane Rail-Measurement and Sampling Locations . . . . . . . . . . . . . . . . . . . . . . . . . . . . . . . . . . 19
FIGURE 7: Building 3, North Wall-Measurement and Sampling Locations . . . . . . . 20
FIGURE 8: Building 5, Northeast Comer, Drains-Measurement and Sampling Locations . . . . . . . . . . . . . . . . . . . . . . . . . . . . . . . . . . 21
FIGURE 9: Building 6, Basement-Measurement and Sampling Locations . . . . . . . . 22
FIGURE 10: Waste Storage Pad Area- Measurement and Sampling Locations . . . . . . 23
FIGURE 11: Drum Burial Pit-Measurement and Sampling Locations . . . . . . . . . . . . 24
FIGURE 12: Grounds North of Building 3-Measurement and Sampling Locations . . . . . . . . . . . . . . . . . . . . . . . . . . . . . . . . . . 25
FIGURE 13: Septic Field-Measurement and Sampling Locations . . . . . . . . . . . . . . 26
FIGURE 14: Sewage Treatment Facility-Measurement and Sampling Locations . . . . . 27
FIGURE 15: Trash Piles on Site Brook Bank-Measurement and Sampling Locations . . . . . . . . . . . . . . . . . . . . . . . . . . . . . . . . . . 28
FIGURE 16: Sewer Line Manholes-Measurement and Sampling Locations . . . . . . . . 29
FIGURE 17: Site Brook-Measurement and Sampling Locations . . . . . . . . . . . . . . . 30
Ccmbustim Engiocc~ - April 5, 1994 ii
“_ .- . .._ ~-.-..~ . . _--... -- ._._ I-. _- -

LIST OF TABLES
PAGE
.-
. . a
TABLE 1: Summary of Surface Activity Measurements . . . . . . . . . . . . . . . . . . . 31
TABLE 2: Uranium Concentrations in Miscellaneous Samples . . . . . . . . . . . . . . . 32
TABLE 3: Uranium Concentrations in Soil . . . . . . . . . . . . . . . . . . . . . . . . . . . 33
TABLE 4: Uranium Concentrations in Sediment from Manhole Access Locations . . . . . . . . . . . . . . . . . . . . . . . . . . . . . . . . . . . . 36
TABLE 5: Uranium Concentrations in Sediment from Site Brook and Outfall to Small Pond . . . . . . . . . . . . . . . . . . . . . . . . . . . . . . . . . 37
TABLE 6: Isotopic Uranium Concentrations . . . . . . . . . . . . . . . . . . . . . . . . . . 38
Combustion Enginocriq - April 5,1994 . . . 111

ABBREVIATIONS AND ACRONYMS
I-
.-
AEC cm CE cm2 cpm DOE DOE-EM
DOE-OR0 dpml100 cm2 EML EPA ESSAP FSRD ft’ FUSRAP GM h HEU kg km m m2 MDA NaI NIST NRC ORAU ORISE ORNL pCi/g ZnS
Atomic Energy Commission ten timeter Combustion Engineering square centimeter counts per minute U.S. Department of Energy Office of Environmental Restoration and Waste Management
DOE Oak Ridge Operations disintegrations per minute/100 square centimeters Environmental Measurement Laboratory Environmental Protection Agency Environmental Survey and Site Assessment Program Former Sites Restoration Division square feet Formerly Utilized Sites Remedial Action Program Geiger-Mueller hour highly enriched uranium kilogram kilometer meter square meter minimum detectable activity sodium iodide National Institute of Standards and Technology Nuclear Regulatory Commission Oak Ridge Associated Universities Oak Ridge Institute for Science and Education Oak Ridge National Laboratory picocuries per gram zinc sulfide
.- Canbustica Eq+eeriag - April 5, 1994 iv
.m- _._.. --_ -

,-
-
DESIGNATION SURVEY COMBUSTION ENGINEERING SITE
WINDSOR, CONNECTICUT
INTRODUCTION AND SITE HISTORY
Combustion Engineering (CE) has operated a facility on the site near Windsor, Connecticut as
part of its efforts as a contractor for the Atomic Energy Commission (AEC), predecessor agency
of the Department of Energy (DOE), on nuclear reactor and fuel projects. Beginning in 1955
and continuing for over a decade, CE served as a direct contractor to the AEC and as a
subcontractor to other firms for a number of projects involving the use of highly enriched uranium (HEU) provided by the AEC. The uranium furnished for use at the CE facility varied
from approximately 5% to over 90% enrichment of U-235.’
Portions of the Windsor site, formerly utilized for AEC activities, includes Buildings 3, 5 and 6,
the related drainpipes and sewer lines, the waste storage pad area, the drum burial site, and the
site brook. Radiological surveys conducted in the early 1980’s, identified areas of thorium and
uranium (enrichments ranged from 1 to 80%) contamination in the bum and drum storage area
(referred to as the septic field in this report). This area was remediated by CE in 1986 and a
confirmatory survey conducted by Oak Ridge Associated Universities (ORAU) in 1989
concluded that the area was within Nuclear Regulatory Commission (NRC) guidelines for
thorium and uranium in soil.’ CE also currently operates a nuclear fuel manufacturing facility
licensed by the NRC, number SNM-1067, on the Windsor site.
The Department of Energy’s Office of Environmental Restoration and Waste Management (EM)
recommended that the current status of HEU (for purposes of this survey, defined to be uranium
enriched to not less than 20% in the isotope U-235) on the CE site be determined; the
Environmental Survey and Site Assessment Program (ESSAP) of the Oak Ridge Institute of Science and Education (ORISE) was requested to perform a survey of the site.
1 _. Combustion ~incerinp - April 5, 1994

SITE DESCRIPTION
The CE site, which consists of approximately 1100 acres, is located on Prospect Hill Road in
a mixed industrial and residential area, approximately 5 kilometers southwest of Bradley
International Airport (Figure 1). Interstate 91 runs to the east of the site and the site brook runs east to west on the north end of the site and joins the Farmington River northwest of the site.
The site is comprised of more than a dozen buildings with several smaller support facilities (Figure 2). The site is also characterized by various wooded areas and three ponds.
The waste storage pad area is an approximately 110 m x 220 m plot of land, lightly wooded with
a mildly sloping terrain, located at the interior of the site. The drum burial pit, approximately five times smaller in area than the waste storage pad area, is characterized by level terrain
situated between two steep embankments.
Uranium fuel fabrication was historically performed in Building 3, while Building 5 was similarly used for AEC contract work. Buildings 3 and 5 are currently used to support research
and development projects. Building 6 served as a waste dilution and pumping facility for the
liquid streams from Buildings 3 and 5. Two sewer lines discharged material from Building 6,
one to the sewage treatment facility and the other to the site brook.
The industrial and sanitary drain lines at the CE Site have undergone significant re-routing
throughout their history. The sanitary lines from Buildings 3 and 5 originally ran to the septic
field, later to the on-site sewage treatment facility, and currently to the municipal treatment
plant. Radioactive waste lines from Buildings 3 and 5 initially ran to Building 6 for
monitoring/treatment, and from Building 6 to the sewage treatment facility. Presently, there is no radioactive waste system in use; industrial lines run directly to the sewage treatment facility
and into the site brook without monitoring/treatment. Non-radioactive, clean industrial liquids drain to the sewage treatment plant, but receive no treatment or holdup unless a problem is
suspected. In summary, three separate drain lines (i.e., old sanitary, old industrial, and new industrial) run north from the Building 3, 5, and 6 complex to the sewage treatment facility and
Combustion Engineering - April 5, 195’4 2
. . j l .- - .--~~ . I______

site brook. Numerous other lines have been removed from service, but remain in their original
underground locations.
PROJECT ORGANIZATION AND RESPONSIBILITY
DOE Headquarters provides overview and coordination for all FUSRAP activities. The DOE Oak Ridge Operations (DOE-ORO) is responsible for implementation of FUSRAP and the
Former Sites Restoration Division (FSRD) of DOE-ORO, manages the daily activities.
Under the standard FUSRAP protocol, an initial investigation/survey of a potential site is
performed by ORISE or Oak Ridge National Laboratory (ORNL), under contract to DOE
Headquarters. If appropriate, DOE Headquarters designates the site into FUSRAP, based upon
the results provided by the initial investigation. The Combustion Engineering Site was selected
for such an initial investigation/survey.
OBJECTIVE
The objective of the survey was to provide sufficient information to determine the radiological
status (limited to uranium with an enrichment of not less than 20% in the U-235 isotope)’ of the
site, relative to the FUSRAP guidelines and DOE Order 5400.5, Chapter IV. The results will
be used by DOE/EM to determine whether further actions under FUSRAP will be taken.
DOCUMENT REVIEW
ESSAP reviewed the site background information provided by the DOE.’ Additionally,
information provided by CE during a preliminary site visit by ESSAP was reviewed and used
as a guide in the selection of measurement and sampling locations.
Combustion Enginehug - April 5, 1994 3

PROCEDURES
During the period from November 15 through 18, 1993, ESSAP performed a designation survey
of the Combustion Engineering Site. The survey was in accordance with a survey plan, dated
November 12, 1993, submitted to and approved by the DOE.3V4 This report summarizes the
procedures and results of the survey.
INTERIOR
ESSAP used the following procedures for the interior portions of the survey.
Reference Grid
The existing lo-foot (3.1 m) reference grid system established by CE on the walls in Building 3,
was used by ESSAP for survey reference. Additionally, measurements and samples from the
floors, drains, and equipment in Buildings 3, 5, and 6 were referenced to prominent building
features.
Surface Scans
Surface scans for alpha, beta and gamma activity were performed on floors, upper and lower
walls, drains, and equipment, using ZnS scintillation, GM, and NaI scintillation detectors
coupled to ratemeters or ratemeter-scalers with audible indicators. Locations of elevated direct
radiation, identified by surface scans, were marked for further investigation.
Surface Activity Measurements
Measurements to determine total alpha and beta surface activity levels were performed on
randomly selected surfaces within the suspect areas (i.e., locations previously surveyed by CE
and suspected of being contaminated with HEU). Twenty-five surface activity measurements
were performed on these indoor areas; including the drains, walls, and floors in Buildings 3, 5,
Combustion Enginccriug - April 5,lW 4

I.
and 6. Smear samples for determining removable activity were obtained from direc t
measurement locations where misce llaneous samples were not collec ted. Measurement and
sampling locations for total and removable activity are illus trated on F igures 3 through 9. F igures were not provided for two surface activity measurements located on the Building 3 south wall and Building 6 firs t floor.
Misce llaneous SamDling
Six teen residue, paint, fiberglas s and sediment samples were collec ted from floors , drains , and
walls in Buildings 3 and 6. No material was available to sample from suspect areas in Building 5. Misce llaneous sampling locations are shown in F igures 3 through 7 and 9.
EXTERIOR
ESSAP used the following procedures for outdoor portions of the survey.
Reference Gr id
The 30-foot (9.1 m) grid s y s tem, established by CE in the waste s torage pad area and drum
burial s ite, was used for referencing measurement and sampling locations. Ungridded areas
(e.g., s ite brook, septic field, sewage treatment fac ility , roof surfaces and vents, etc .) were
referenced to prominent s ite features or exis ting landmarks and recorded on appropriate
drawings .
Surface Scans
Surface scans of outdoor locations, inc luding the waste s torage pad area (twelve of the 30-foot
grid bloc k s were randomly selec ted for survey activities), drum burial s ite, s ite brook and banks, septic field, grounds north of Building 3 and sewage treatment fac ility , were conducted using
NaI s c intillation detec tors and ratemeters with audible indicators. Locations of elevated
radiation, suggesting the presence of surface or near surface contamination, were marked for
Combustion Engiaccimg - April 5, 1994 5
-. - ---

, -
I -
-
I . - .
-
, -
--
““I.
fu r the r invest igat ion. N u m e r o u s locat ions o f e leva te d rad ia tio n we re i den tifie d in m a n y o f these a reas , the re fo re , sur face scans we re te rm ina te d once a su fficient n u m b e r o f samp l ing locat ions
h a d b e e n se lec ted from each a rea .
S cans o f ex ter io r bu i ld ing sur faces (e .g ., r oo f sur faces a n d ven ts) a n d access locat ions (manho les ) to indus trial a n d sewer l ines we re conduc te d us ing N a I scint i l lat ion d e tec tors a n d Z n S
scint i l lat ion d e tec tors. Loca tions o f e leva te d rad ia tio n we re m a r k e d fo r fu r the r invest igat ion.
So i l S a m d i n g
B a c k g r o u n d soi l samp les we re col lected from five o ff-site locat ions wi th in 0 .5 to 1 0 k m o f th e
site, du r ing a p rev ious E S S A P survey a t th e C E site.’
S u r face a n d subsur face soi l samp les we re col lected from 1 2 locat ions o f e leva te d direct rad ia tio n
wi th in th e was te s to rage p a d a rea (F igure 10 ) a n d from 6 locat ions wi th in th e d r u m bur ia l pit
(F igure 11 ) . S o il samp les we re a lso col lected from th e g rounds no r th o f B u i ld ings 3 , sep tic fie ld , sewer t reatment facil i ty a n d site b rook banks . These soi l samp l ing locat ions a re s h o w n o n F igures 1 2 th r o u g h 1 5 .
M isce l laneous S a m d i n g
S e d i m e n t samp les we re col lected from 1 6 m a n h o l e access locat ions to sewer a n d indus trial d ra in
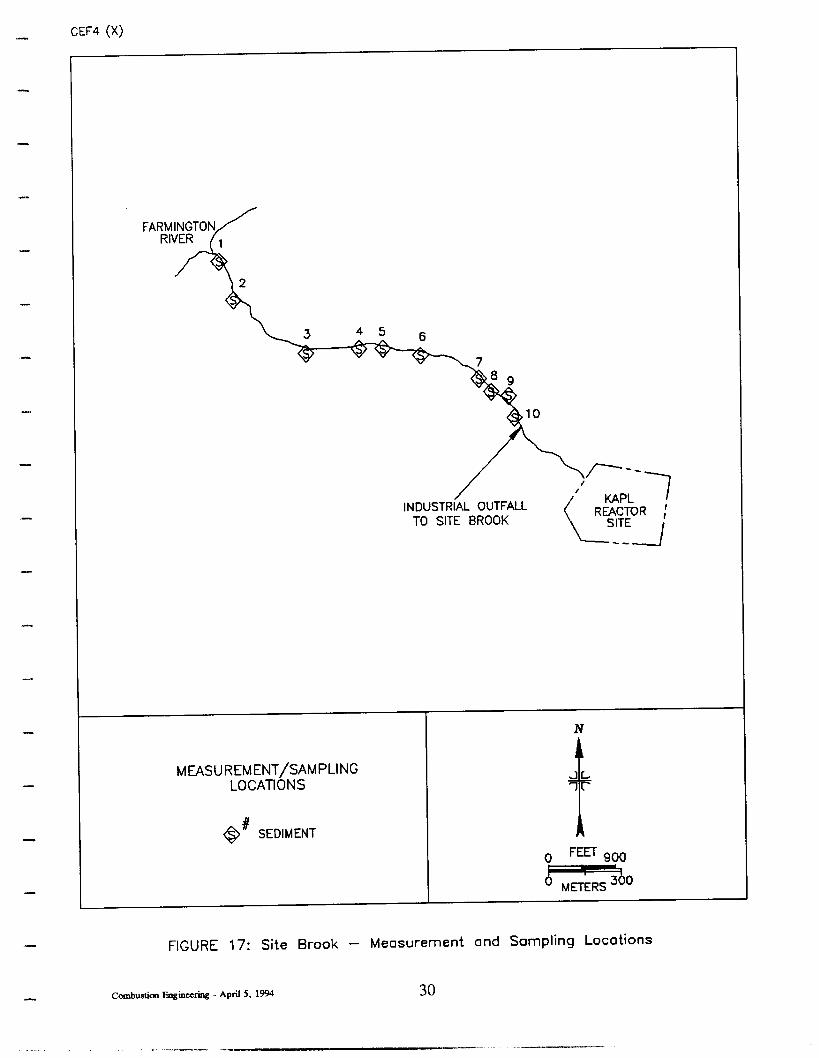
l ines (F igure 16 ) a n d a t 1 0 locat ions wi th in th e site b rook (F igure 17 ) . A s e d i m e n t samp le was
a lso col lected from th e site o u tfal l to th e S m a ll P o n d (F igure 12 ) .
T w o res idue samp les we re col lected from roo f ven ts a to p B u i ld ing 3 . A bu r ied p iece o f plastic,
i den tifie d by e leva te d direct rad ia tio n levels du r ing sur face scann ing , was col lected from th e
d r u m bur ia l pit (F igure 11 ) .
C o m b u s t i o n Eag imc r i q - Ap r i l 5, 1 9 9 4 6

saw.
.-
.-
.-
.-
,-
--
SAMPLE ANALYSIS AND DATA INTERPRETATION
Samples and survey data were returned to the ESSAP Oak Ridge laboratory for analyses and
interpretation. All 96 soil and miscellaneous samples were analyzed by gamma spectrometry;
26 of the samples were also analyzed by alpha spectrometry. Spectra were reviewed for U-235 and U-238, and any other identifiable photopeaks. Gamma spectrometry results were used to
provide only qualitative information on the percentage U-235 enrichment (e.g., comparison of
the U-235 enrichment in samples to the 20% U-235 enrichment action level), while actual U-235
enrichments were reported for samples analyzed by alpha spectrometry. The percentage of U- 235 enrichment was calculated by dividing the U-234, U-235, and U-238 activity concentrations by their respective specific activities, and determining the ratio of the U-235 isotopic weight to
the total uranium weight. Soil and miscellaneous sample results were reported in units of
picocuries per gram @Ci/g). Smears were analyzed for gross alpha and gross beta activity. Direct measurement data and smear data were converted to units of disintegrations per minute
per 100 cm’ (dpm/lOO cm’). Additional information concerning major instrumentation, sampling
equipment, and analytical procedures is provided in Appendices A and B.
FINDINGS AND RESULTS
INTERIOR
Surface Scans
Surface scans of Buildings 3, 5, and 6 identified elevated direct radiation at the following
locations: floor drains, I-beams and insulated piping within the Drop Tube Furnace Testing
area, and Vault Room walls within Building 3; and basement floor and miscellaneous equipment
within Building 6. Surface scans in Building 5 did not identify any areas of elevated direct
radiation. Additional surface activity measurements and sampling were performed at these
locations.
Canbustion l3qhccring - April $1994 7
-. --- .--.--

Surface Activity Levels
-
Results of total and removable activity are summarized in Table 1. The twenty-five surface
activity measurements on interior surfaces ranged from < 66 to 5,100 dpm/ 100 cm2 and < 1,300 to 23,000 dpm/lOO cm2 for alpha and beta, respectively (Figures 3 through 9). Removable activity ranged from < 12 to 17 dpm/lOO cm2 for alpha and was less than the minimum
detectable activity (MDA) of the procedure, which is < 16 dpm/lOO cm2 for beta.
Uranium Concentrations in Miscellaneous Samdes
Uranium concentrations in miscellaneous samples (i.e., residue, fiberglass insulation, paint, etc.)
collected from drams, sumps, walls and floors are presented in Tables 2 and 6. The U-235 activity in one fiberglass sample from the Building 3 walls was < 35 pCi (Table 2), with a corresponding U-235 enrichment less than 20 % . The U-235 concentration in one sample of pipe
insulation wrap was 97.8 pCi/g, with a corresponding U-235 enrichment of approximately 20%
(Table 2). Alpha spectrometry analysis, performed on 6 fiberglass samples from Building 3
walls, resulted in total uranium concentrations ranging from 1.60 to 601.33 pCi/g, and
corresponding U-235 enrichments ranging from 0.59% to 38% (Table 6).
The U-235 concentrations in three Building 3 drain residue samples were less than 1.3 pCi/g,
with corresponding U-235 enrichments less than 20% (Table 2). Alpha spectrometry analysis
of dram residue sample #l resulted in a total uranium concentration of 13,190 pCi/g and a
U-235 enrichment of 44% (Table 6).
Alpha spectrometry analysis on 2 paint samples from the Building 3 north wall resulted in total
uranium concentrations of 43.8 and 864 pCi/g, and corresponding U-235 enrichments of 46%
and 32%) respectively (Table 6).
The U-235 concentration in 2 floor and equipment residue samples in the basement of Building 6
were 228.7 and 385.5 pCi/g, with corresponding U-235 enrichments both less than 20% (Table
2).
Combustion F&&miq - April 5, 1994 8

-
Alpha spectrometry analysis of the sediment sample from the sump resulted in a total uranium
concentration of 13,850 pCi/g, with a U-235 enrichment of 13% (Table 6).
EXTERIOR
Surface Scans
Surface scans of outdoor locations, including the waste storage pad area, drum burial site, and
site brook and banks identified numerous areas of elevated direct radiation. In the waste storage pad area, 10 of the 12 randomly selected grid blocks exhibited elevated direct radiation.
Locations of elevated direct radiation in the drum burial pit were limited to the actual areas
within excavations (that exposed the buried drums) and near a tree in grid block E2 (Figure 11).
Locations of elevated direct radiation in the site brook were identified along the site brook bank (Figure 15) and from sample locations #5 to #!3 (Figure 17).
Surface scans of the grounds north of Building 3, septic field and sewage treatment plant were generally within the range of ambient background levels. Two locations on the grounds north of Building 3 exhibited direct radiation levels approximately three to six times ambient
background levels (sample locations #l and #3 in Figure 12).
Surface scans of the manhole access locations to sewer and industrial lines identified elevated
direct radiation in the following manholes: old and new industrial lines at manhole locations #6
and #7 on Figure 16, radiological line southeast of Building 6A (#12), industrial line exiting east
of Building 6 (#14), and industrial line northeast of Building 3 (#13).
Surface scans for alpha and beta activity on the roof surfaces and vents did not identify any areas
of elevated direct radiation.
,- Canbustion Enginec~ - April 5,1994 9

Uranium Concentrations in Soils
Radionuclide concentrations in background samples were < 0.2 pCi/g for U-235 and ranged
from < 0.7 to 1.8 pCi/g for U-238.2
Uranium concentrations in soil samples, collected both randomly and from locations of elevated
direct radiation, are summarized in Tables 3 and 6. The U-235 concentrations in the waste
storage pad area ranged from CO.1 to 2169 pCi/g (Table 3). Alpha spectrometry analysis, performed on 7 samples from the waste storage pad area, resulted in total uranium
concentrations ranging from 21.02 to 1,173 pCi/g, and corresponding U-235 enrichments
ranging from 23 % to 48 % (Table 6).
The U-235 concentrations in the drum burial pit ranged from < 0.1 to 620.1 pCi/g (Table 3).
Alpha spectrometry analysis, performed on 2 samples from the drum burial pit, resulted in total
uranium concentrations of 25.5 and 917 pCi/g, and corresponding U-235 enrichments of 33 %
and 58% (Table 6).
The U-235 concentrations in grounds north of Building 3 ranged from < 0.1 to 148.0 pCi/g
(Table 3). Alpha spectrometry analysis, performed on 2 samples from the grounds north of Building 3, resulted in total uranium concentrations of 39.1 and 768 pCi/g, and corresponding
U-235 enrichments of 3.7% and 36% (Table 6).
The U-235 concentrations on the site brook banks ranged from 12.1 to 77.2 pCi/g (Table 3).
Alpha spectrometry analysis of the sediment sample from the site brook bank resulted in a total
uranium concentration of 24,090 pCi/g and a U-235 enrichment of 17% (Table 6). Much of the
uranium contamination on the site brook bank appeared to be associated with partially buried
clam shells. Additional laboratory analysis was performed to evaluate the quantity of uranium
activity separately for both the clam shell fraction and the soil fraction. The quantity of U-235
in the soil component ranged from 63 % to 93 % , and from 7% to 37% in the clam shell
component.
combusticm Ea@eriq - April 5.1994 10
. --“~ . I

The U-235 concentrations in the septic field and sewage treatment facility grounds ranged from < 0.1 to 1.2 pCi/g, with corresponding U-235 enrichments less than 20% (Table 3). However,
total thorium activity from borehole samples in the septic field ranged from 7.7 to 32.6 pCi/g.
Uranium Concentrations in Miscellaneous Sam&es
s-
,-
Uranium concentrations in sediment samples collected from manhole access locations to sewer
and industrial lines are summarized in Tables 4 and 6. The U-235 concentrations in these
samples ranged from < 0.1 to 3868 pCi/g (Table 4). Alpha spectrometry analysis, performed
on 3 samples from the manhole access locations, resulted in total uranium concentrations ranging
from 334 to 4,900 pCi/g, and corresponding U-235 enrichments ranging from 13% to 55%
(Table 6).
Uranium concentrations in sediment samples collected from the site brook and outfall to the
Small Pond are summarized in Tables 5 and 6. The U-235 concentrations in these samples
ranged from C 0.1 to 16.7 pCi/g (Table 5). Alpha spectrometry analysis of sediment sample from the site brook at location #8 resulted in a total uranium concentration of 16,740 pCi/g and
a U-235 enrichment of 58% (Table 6).
The U-235 concentrations in residue samples collected from the Building 3 roof vents were
~2.3 pCi/g (Table 2), with corresponding U-235 enrichments less than 20%.
The U-235 activity on the buried piece of plastic near the drum burial pit was 307,400 pCi
(Table 2), with a corresponding U-235 enrichment greater than 20%.
Combustion Engineering - April 5, 1994 11
__- ._~ __... -. ._. -.- ---_

)-
-
*-
---
COMPARISON O F RESULTS W ITH GUIDELINES
The radioac tive contaminant of concern at the CE s ite is highly enriched uranium ( i.e., greater
than 20% enrichment in the U-235 isotope). The surface contamination guidelines for uranium
are presented in Appendix C, and are as follows :’
Total Activitv
5,000 Q ! (alpha) dpm/lO O cm’, averaged over 1 m2
15,000 c x dpm/lO O cm’, maximum in 100 cm2
Removable Activity
1,000 CY dpm/lO O cm2
The s ite-specific soil guideline for enriched uranium will be determined pursuant to DOE Order
5400.5 if portions of the CE s ite are designated into FUSRAP.6
Surface activity measurements for total and removable activity in areas surveyed in Building 3
were within the surface contamination guidelines . However, laboratory analy s is on the paint samples from the north wall of Building 3 indicates the presence of HEU in the paint. O ne
surface activity measurement on the basement floor of Building 6 exceeded the 15,000 dpm/lO O
cm2 c r iterion (Table 1).
Analyses of misce llaneous samples collec ted from interior areas identified the following locations
within Building 3 as contaminated with HEU: drain location #l (F igure 3), east wall locations
#l and #2 (F igure 5), pipe insulation wrap in the Drop Tube Furnace Testing area (F igure 6),
and the north wall and Vault Room wall (F igure 7). The sediment sample collec ted from the
Building 6 sump, while containing s ignificant quantities of uranium contamination, did not
exceed the 20% U-235 enrichment action level.
Analyses of soil and sediment samples collec ted from outdoor areas identified the following
locations as contaminated with HEU: waste s torage pad area (F igure lo), drum burial pit
Combustion Enginacring - April 5,1994 12
.--- ,II --. .____-.-

.-
,-
.-
(Figure 1 l), grounds north of Building 3 (Figure 12), site brook bank (Figure 15), sewer and
industrial lines at manhole access locations (Figure 16), and the site brook (Figure 17).
Designation survey activities did not identify HEU contamination at any location within Building
5, on the grounds of the septic field or sewage treatment facility, on any roof surfaces or vents, or the outfall to the Small Pond.
SUMMARY
At the request of the U.S. Department of Energy, the Oak Ridge Institute for Science and
Education’s Environmental Survey and Site Assessment Program conducted a designation survey at the Combustion Engineering Site in Windsor, Connecticut. The interior survey activities
consisted of surface scans for alpha, beta, and gamma activity on the floors, walls, drains and
equipment, measurements of total and removable activity, and miscellaneous sampling. The
exterior survey activities consisted of scans for gamma activity in the outdoor areas, and soil and
miscellaneous sampling.
The designation survey identified several interior and exterior locations as containing highly
enriched uranium (greater than 20% enrichment in the U-235 isotope). The interior areas
include drain location #l, east wall locations #l and #2, pipe insulation wrap in the Drop Tube
Furnace Testing area, and the north wall and Vault Room wall within Building 3. The exterior
areas include the waste storage pad area, drum burial pit, grounds north of Building 3, site
brook bank, sanitary sewer and industrial drain lines, and the site brook.
,“.v. Combustion Eagiaceiiq - April 5.1994 13
,_^-- _-_.

CEF7 (X)
_-
I BRADLEY AIRPORT
}-xm 03 *WINDSOR ~0cKs
NOT TO SCALE
FIGURE 1: Location of the Combustion Engineering Site - Windsor, Connecticut
Combustion Engineering - April 5.1994 14

CEF8 (X)
.-
-
_-
SEWAGE TREATMENT
N
\ ROADWAYS
0 # BUILDING NUMBER
WATER 0 0 0
METERS
FIGURE 2: Plot Plan of the Combustion Engineering Site - Windsor, Connecticut
Ccmbustim ISqhmiq - April 5,1994 15
.““, -- __ _~ ..~- .- .___-- *1” - --..-. __..--_

-
.“.
-
CEFl 1 (X)
r UJL-Z a BLDG. I-
3A L&-
i
1 :J- -1 --I .
3- 1
< l -b+1 2L &- -iI
J %5!- +
L -I l-
&
r I- 7
I BLDG. 3 L
I 1 -
MEASUREMENT/SAMPLING LOCATIONS
a SURFACE ACTIVITY
u# R RESIDUE
2 BREAK
FIGURE 3: Building 3, I hins - Measurement and Sampling Locations
Canbustim Eaginccring - April 5.1994 16

CEF15 (X)
MEASUREMENT/SAMPLING LOCATIONS
l SURFACE ACTMM
0 FIBERGLASS INSULATION ’ METERS1’5
FIGURE 4: Building 3, High Bay, West Wall - Measurement and Sampling Locations
Combustion Enginec* - April 5,1994 17
__x-__^ ---..I_. -..---- - ,-__ _

CEFIZ (X)
MEASUREMENT/SAMPLING LOCATIONS
l SURFACE ACTMN
o# FIBERGLASS INSULATION
2 BREAK 0 FEET 30
MET&S lb
FIGURE 5: Building 3, East Wall - Measurement and Sampling Locations
Combustion Enginecriag - April 5.1994 18
.-.-..-- ,* I __.. - --

CEF13 (X)
-
. I
-
-
,-
*-
BEHIND WALL DROP TUBE FURNACE TESTING
MEASUREMENT/SAMPLING LOCATIONS
l SURFACE ACTIVIM
V# FIBERGLASS INSULATION
o# R RESIDUE, PIPE INSULATION WRAP
@ON INSULATED PIPE *ON INSULATED PIPE
2 BREAK
FIGURE 6: Building 3, West Wall Above Crane Rail - Measurement and Sampling Locations
Combustion Eagind - April $1994 19
-- __.---.l- -.- _” -.^---_-

CEF14 (X)
CI P N M L K J H G F E D
00
01
02
MEASUREMENT/SAMPLING LOCATIONS
l SURFACE ACTIVITY
ON P PAINT
INSIDE DOOR, ON VAULT
ROOM WALL
FIGURE 7: Building 3, North Wall - Measurement and Sampling Locations
Canbustim Engineering - April 5.1994 20

*-
.u
CEFIO (X>
OFFICE
CONFERENCE ROOM
< MECHANICAL TESTING LAB
MEASUREMENT/SAMPLING LOCATIONS
DRAINS
l SURFACE ACTIVITY
JANITORS ROOM
Sl- UWLK
l 1 ROOM
l MENS ROOM ‘HOT- J
LOCKER ROOM
2 BREAK
N
t
44;
O& 0
METERS 3
FIGURE 8: Building 5, Northeast Corner Drains - Measurement and Sampling Locations
Combustion Engincchng - April 5, 1994 21

CEF9 (X)
SUMP SLUDGE STORAGE
PUMP STAND
SUMP
0
II!3 0
N
MEASUREMENT/SAMPLING LOCATIONS
l SURFACE ACTh’lM
0 SEDIMENT FEET 18
RESIDUE Om ’ METERS
0 El 0 El HOLD-UP
TANKS
FIGURE 9: Building 6, Basement - Measurement and Sampling Locations
Canbustion F.&wring - April 5, 19% 22
~. .- ..- ____- “‘ _-.. ._.- --..-

CEF2 (X)
-2-l o 1 2 3 4 5 6 7 8 9 ‘Cl . . ..__.._...............~....... 7 . . . . . . . ‘: x...
: : : j i : : : : i ....... . ...... 4 ....... i.. ..... i.. .... : i i
j........ j..
k.
j. ...... ..... i.. ..... v.. .. .i.. ..... : : : : : : ;
; : ....... . ...... . ....... i ....... . ....... . ......
MEASUREMENT/SAMPLING LOCATIONS
x SOIL
e FENCE
1
‘jo cl METERS
FIGURE 10: Waste Storage Pad Area - Measurement and Sampling Locations
Canbusticm Enginaring - April 5, 1994 23
-“-..-_ “_ __--.._- _ ----..

CEF3 (1)
.-
SJ MEASUREMENT/SAMPLING
LOCATIONS
0 TREE SUBSURFACE SOIL
m # SURFACE SOIL EXCAVATION
V MISCELIANEOUS 0 FEET do
0 MEI-ERS I5
FIGURE 11: Drum Burial Pit - Measurement and Sampling Locations
Combustion Eq$ec.~ - April 5.1994 24

CEFl (X)
1 2 3 4 5 6 7 8 9 10 . . . ..__.... - .,_.._..,......____.....~ ,,.,,.....'.............~........................~........................ ; . ..__._.........___.... i' . . . . . . . . . . . . . . . . . . . . . . :'.......... . . . . . . . . . . . . . j .,......"..............~........................~ ;G
_.,___.....,,____,...,~ .._................,.,.. e . . . . . . . . .._............~ . . . . . . . . . . . . . . . . . . . . . . . . i . . . . . . . . . . . . . . . . . . . . . . ..t ............... : ;F
i . . . . . . . ..___............ i . . . . . . . . . . . . . . . . .
..___.........__.: . . . . . .._................. . . . ..__._................ . . . . . . . . . . . . . . . . . . . . . . . . i A -
BUILDING 3
N
MEASUREMENT/SAMPLING LOCATIONS
w# SUBSURFACE SOIL e FENCE
n # SURFACE SOIL t
<k
0 SEDIMENT 0 FEEr 30
’ METERS lo
FIGURE 12: Grounds North of Building 3 - Measurement and Sampling Locations
Combustion Enginecriag - April 5, 1994 25

CEF6 (X)
BRUSH AND
TREES
MANHOLE
MONITOR WELL
BRUSH AND
TREES
MEASUREMENT/SAMPLING LOCATIONS
NOT TO SCALE
FIGURE 13: Septic Field - Measurement and Sampling Locations
Combustion Enginw* - April 5, 1994 26
----

I -
‘-
C E F S (X )
M
M E A S U R E M E N T /S A M P L ING L O C A T IO N S
t
4::
n # S U R F A C E S O IL
FIG U R E 14: S e w a g e Trea tment Facil i ty - Measu remen t a n d S a m p l i n g Locat ions
C o m b u s t i o n E a g i r m r i n g - Ap r i l 5, 1 9 9 4 2 7
_. -_ _ ._ .- . -__-- - -

CEF16 (X)
3ARREL ‘ARTIALLY
BURIED IN \ DIRT \ CONCREI-E RUBBLE
SIDE OF HILL 1, PATH ‘,
\, \ \
MEASUREMENT/SAMPLING LOCATIONS
n ” SURFACE SOIL
NOT TO SCALE
FIGURE 15: Trash Piles on Site Brook Bank - Measurement and Sampling Locations
Combustion Engincc~ - April 5, 1994 28

CEF8a (X)
GREAT
N
MEASUREMENT/SAMPLING LOCATIONS \
ROADWAYS JL
0 # BUILDING NUMBER
V# El t
r
s SEDIMENT WATER
*-
-
FIGURE 16: Sewer Line Manholes - Measurement and Sampling Locations
Combustion EnginceriDg - April $1994 29
__.._.. ~.--. -.---~ -.------ ___- ._- -
CEF4 (X)
MEASUREMENT/SAMPLING LOCATIONS
SEDIMENT
N
t
+Lr
0 FEEr 900
cz3O
FIGURE 17: Site Brook - Measurement and Sampling Locations
Combustion Engineering - April 5, 1994 30
--- .--____~

I i I 1 i 1 I I 1 I i I I ) I t 5 i
TABLE 1
wMMARY OF SURFACE ACTIVITY MEAS- COMBUSTION ENGINEERING SITE
WINDSOR, CONNECTICUT
Number of Range of Total Activity Range of Removable Activity
Location Figure # Individual (dpm/lOO cm? (dpm/lOO cm?
Measurements Alpha Beta Alpha I Beta
Building 3 Drains 3 5 N/A < 1,500-2,700 < 12 < 16 West Wall 4, 6 7 < 69-3,500 < 1,500 < 12 < 16 East Wall 5 3 <69 < 1,300 N/A N/A North Wall 7 2 120-3,200 3,300 N/A N/A
South Wall N/A 1 <69 < 1,300 N/A N/A Roof Vents N/A 5 c 66-910 < 1,500 < 12-21 < 16
Building 5 Drains I 8 3 N/A < 1,500 < 12 I < 16
Building 6 Basement 9 3 2,1OO-5,100 4,500-23,000 < 12 < 16 First Floor N/A 1 1,200 1,~ 17 < 16 Roof N/A 1 350 < 1,500 < 12 < 16 Vent N/A 1 <66 < 1,500 c 12 < 16

1
p s. i f Q 2: ?$
s
i I I 1 ii t 1 I i I f I i i i I I i
TABLE 2
URANIUM CONCENTRATIONS IN MISCELLANEOUS SAMPL= COMBUSTION ENGINEERING SITE
WINDSOR, CONNECTICUT
Location
Building 3 Drain K? Drain #3 Drain #4
Roof Vent, 3rd from N. End Roof Vent, 7th from N. End Drop Tube Furnace #l
w. Wall #3
Sample Figure Uranium Concentrations (pCi/g)a
Type # U-235 I U-238
Residue 3 < 1.3 14.9 &- 9.3 Residue 3 0.4 + 0.1 2.1 f 1.8 Residue 3 0.6 + 0.1 2.2 f 1.5
Residue N/A ~2.3 < 17 Residue N/A 0.8 + 0.3 5.0 f 3.7
Pipe 6 97.8 + 5.9 61 f 33 Insulation Fiberglass 6 <35b 780 f 490b
Building 6 Location #l Location #2
Drum Burial Pit
Adjacent to Surface Soil #2
Residue 9 385.5 + 6.5 1418 f 47 Residue 9 228.7 f 4.1 232 f 31
I Plastic I 11 I 307,400 i- 2,800b I < 19,000b
“Uncertainties represent the 95% confidence level, based on counting statistics only. bUnits of pCi/sample.

d OW
e ;a B
V
is E
2 4 im
OO
8 Z$u 8 z 8P g
$
t
is it! E 3
8
a
i .ti s f:- B 3 u” 5 .I f e
:: SF c
% 2
m-
‘r 6
03 [
Canbustim
Enginccriag - April
5, 19P4
= = P c \ d C -t 33 = I c C
1 U C i Q
F V z 8 =
=e F \
-- C u -t C 3 ;; v a 8 --I
= t . . . . T -I c, U
V E 2 =
-
C C
c : c c -I
0 f
- V d s =
1 \I u ol C -I C F V 2 3 =
3
= r C
r ’ v v C C
r C 4 0 d V w d 3

.I -I .- *- _- .-
1 b a i 3 eo b a 3 fz 2 E
a BL a c 3
Com
bustion Engineering - April 5, 1994
3 4 J ; L u . C c : 8
=
= T ;I 9 -4
rl 6 + ? r4
V ;i 3
P
F I i , . . m
. . : I .
i ;r
Z d c u v L ; i : C \ S 34
= t > C -I
r C : I, .
I - ; -I L r c r b v C =
= C f =
= lo . ;I r) . 4 E
v V 2
q 7 ,
7 5 $
7 :
E
: t I
.1
7 6 4 . E I = 10
. J E V
V 2 I i c
= * .
s E L u F C c
oc
I; . . . \ 1 . <
q r i 7 r; c m
- t . u ;

I
p
;
?’ k 2: IA 5 0
E
I I I I I 1 i I i i I 1 i I I I il 1
TABLE 3 (Continued)
URANIUM CONCENTRATIONS IN SOIL COMBUSTION ENGlNEERING SITE
WINDSOR, CONNECTICUT
Location
Site Brook Bankh
Location 1 3
Depth of Sample Uranium Concentrations (pCi/g)” km) U-235 I U-238
o-15 77.2 f 0.9 <5.6 o-15 12.1 + 0.3 1.2 * 1.7
“Uncertainties represent the 95% confidence level, based only on counting statistics. bRefer to Figure 10. “Refer to Figure 11. dRefer to Figure 12. ‘CE archived sample K212. fRefer to Figure 13. Total thorium (Th-228 + Th-232) from this borehole ranged from 7.7 to 32.6 pCi/g. sRefer to Figure 14. hRefer to Figure 15.

I-
.-
,-
TABLE 4
URANIUM CONCENTRATIONS IN SEDIMENT FROM MANHOLE ACCESS LOCATIONS
COMBUSTION ENGINEERING SITE W INDSOR, CONNECTICUT
Location
Manholesb
1
2 3
4
5
7 8
10 11
12
13
14
15
Uranium Concentrations (pCi/g)’
U-235 U-238
<0.2 2.4 f 1.6
< O .l 0.6 + 0.9
co.2 <2.3
1.0 f 0.1 2.1 + 1.1
< O .l 2.5 i- 1.3
565.5 &- 1.9 64.7 + 9.8
< O .l < 1.6
<0.2 1.3 + 1.1 10.2 + 0.5 ~3.6
349.9 +_ 4.1 1727 f 58
3868 + 39 <210
146.3 +_ 3.8 459 + 43
0.3 +_ 0.1 1.8 &- 0.9
“Uncertainties represent the 95% confidence level, based only on counting s tatis tic s . bRefer to F igure 16.
Combustion Engineerins - April 5, 1994
.._-.~
36

TABLE 5
URANIUM CONCENTRATIONS IN SEDIMENT FROM SITE BROOK AND OUTFALL TO SMALL POND
COMBUSTION ENGINEERING SITE WINDSOR, CONNECTICUT
Location
Site Brookb
1
2
3
4
5
6
7
Uranium Concentrations (pCi/g)’
U-235 U-238
co.1 < 1.0
CO.1 1.2 + 1.1
<O.l 1.3 + 0.8
0.1 f 0.1 0.5 + 0.7
10.9 + 0.6 11.3 & 4.8
1.5 * 0.1 3.4 &- 1.2
16.7 + 1.0 21 * 10
9 2.3 f 0.2 8.6 + 2.9
10 1.0 f 0.1 2.0 + 1.7
Outfall to Small Pond
Outfall <O.l < 1.0
“Uncertainties represent the 95% confidence level, based only on counting statistics. bRefer to Figure 17. ‘Refer to Figure 12.
Combustion Engineering - April $1994 37
_.__.. - -.-_- ---.

i
f f
i
1. 6 & ul s 0
iii
i i i I i I i i i i t i i i 1 t 1 i TABLE 6
ISOTOPIC URANIUM CONCENTRATIONS COMBUSTION ENGINEERING SITE
WINDSOR, CONNECTICUT
Location

i I i I 1 I f t i i i i I i i I I 1 I
TABLE 6 (Continued)
ISOTOPIC URANIUM CONCENTRATIONS COMBUSTION ENGINEERING SITE
WINDSOR, CONNECTICUT
Figure Uranium Concentrations (PCW)’ i,
96 U-235 Location # U-234 U-235 U-238 Total vb Enrichment g 2 Manhole #6, Old Industrial Line 16 4,680 + 170 185 & 38 36 +, 15 4,900 + 170 44 ” 5; P Manhole #9, Industrial 16 1,989 f 87 71 + 19 8.8 f 5.8 2,069 + 89 55
Manhole #16, Industrial 16 310 + 14 11.5 + 3.0 11.8 + 2.7 334 + 14 13 Site Brook #8 17 16,160 + 370 525 + 75 59 & 22 16,740 f 380 58
*Uncertainties represent the 95% confidence level, based only on counting statistics. bTotal uranium concentrations based on the sum of U-234, U-235 and U-238 concentrations.

REFERENCES
.w-
w-
--
“I
1. U.S. Department of Energy, memorandum from A. Williams to file, “Tentative Authority Determination-Combustion Engineering Site, Windsor, Connecticut,” June 22, 1993.
2. ORAU, “Follow-up Confirmatory Radiological Survey of the Drum Storage Area, Combustion Engineering Property, Windsor, Connecticut,” M. Landis, May 1989.
3. Oak Ridge Institute for Science and Education, “Designation Survey Plan for the Combustion Engineering Site, Windsor, Connecticut,” November 12, 1993.
4. U.S. Department of Energy, letter from A. Williams to E. Abelquist, November 15, 1993.
5. “Guidelines for Residual Radioactive Material at Formerly Utilized Sites Remedial Action Program and Remote Surplus Facilities Management Program Sites,” U.S. Department of Energy, Revision 2, March 1987.
6. DOE Order 5400.5, “Radiation Protection of the Public and the Environment,” Washington, D.C., February 8, 1990.
Combustion Eoginccriag - April 5.1994 40
- - - . . . I
___. - - . _ _

APPENDIX A
MAJOR INSTRUMENTATION
Cornbustim Emgiaeerins - April 5, 1994

APPENDIX A
MAJOR INSTRUMENTATION
-.
-
.-
-
The display of a specific product is not to be construed as an endorsement of the product or its manufacturer by the authors or their employer.
DIRECT RADIATION MEASUREMENT
Instruments
Eberline Pulse Ratemeter Model PRM-6 (Eberline, Santa Fe, NM)
Eberline “Rascal” Ratemeter-Scaler Model PRS-1 (Eberline, Santa Fe, NM)
Ludlum Ratemeter-Scaler Model 2221 (Ludlum Measurements, Inc. Sweetwater, TX)
Detectors
Eberline ZnS Scintillation Detector Model AC-3-7 Effective Area, 59 cm’ (Eberline, Santa Fe, NM)
Eberline GM Detector Model HP-260 Effective Area, 15.5 cm’ (Eberline, Santa Fe, NM)
Victoreen NaI Scintillation Detector Model 489-55 3.2 cm x 3.8 cm Crystal (Victoreen , Cleveland, OH)
Canbutioa Engineering - April 5,1994
- -~---_-----“-
A-l

*.a..
.L
I-
“-
LABORATORY ANALYTICAL INSTRUMENTATION
Alpha Spectrometry System Tennelec Electronics Model (Tennelec, Oak Ridge, TN) Used in conjunction with: Surface Barrier and Ion Implanted Detectors (Canberra, Meriden, CT and Tennelec, Oak Ridge, TN) and Multichannel Analyzer 3100 Vax Workstation (Canberra, Meriden, CT)
High Purity Extended Range Intrinsic Detectors Model No: ERVDS30-25 195 (Tennelec, Oak Ridge, TN) Used in conjunction with: Lead Shield Model G-l 1 (Nuclear Lead, Oak Ridge, TN) and Multichannel Analyzer 3100 Vax Workstation (Canberra, Meriden, CT)
High-Purity Germanium Detector Model GMX-23 195-S) 23 % Eff. (EG&G ORTEC, Oak Ridge, TN) Used in conjunction with: Lead Shield Model G-16 (Gamma Products, Palos Hills, IL) and Multichannel Analyzer 3100 Vax Workstation (Canberra, Meriden, CT)
Low Background Gas Proportional Counter Model LB-5 11 O-W (Oxford, Oak Ridge, TN)
Combustica l?&nce+ - April 5, E’% A-2
--- ____._ .-- .-__ _c._.~ ----- -

Canbwtim Emginccriag - April 5.1994
APPENDIX B
SURVEY AND ANALYTICAL PROCEDURES
_-_-.. -- - -.-..--- _----

-
APPENDIX B
SURVEY AND ANALYTICAL PROCEDURES
SURVEY PROCEDURES
Surface Scans
Surface scans were performed by passing the probes slowly over the surface; the distance
between the probe and the surface was maintained at a minimum-nominally about 1 cm.
Surfaces were scanned using small area (15.5 cm’ or 59 cm”) hand-held detectors. Identification
of elevated levels was based on increases in the audible signal from the recording and/or indicating instrument. Combinations of detectors and instruments used for the scans were:
Alpha - ZnS scintillation detector with ratemeter-scaler
Beta - GM detector with ratemeter-scaler
Gamma - NaI scintillation detector with ratemeter
Surface Activitv Measurements
Measurements for total alpha and total beta activity levels were performed using ZnS scintillation
and GM detectors, respectively, with ratemeter-scalers.
Count rates (cpm), which were integrated over 1 minute in a static position, were converted to
activity levels (dpm/lOO cm’) by dividing the net rate by the 47r efficiency and correcting for the
active area of the detector. The alpha activity background count rates for the ZnS scintillation
detectors averaged approximately 1 cpm for each detector. Alpha efficiency factors ranged from
0.18 to 0.19 for the ZnS scintillation detectors calibrated to Pu-239. The beta activity
background count rates for the GM detectors averaged approximately 53 cpm for each detector.
Combustion Enginechr@ - April 5.1994 B-l
.-
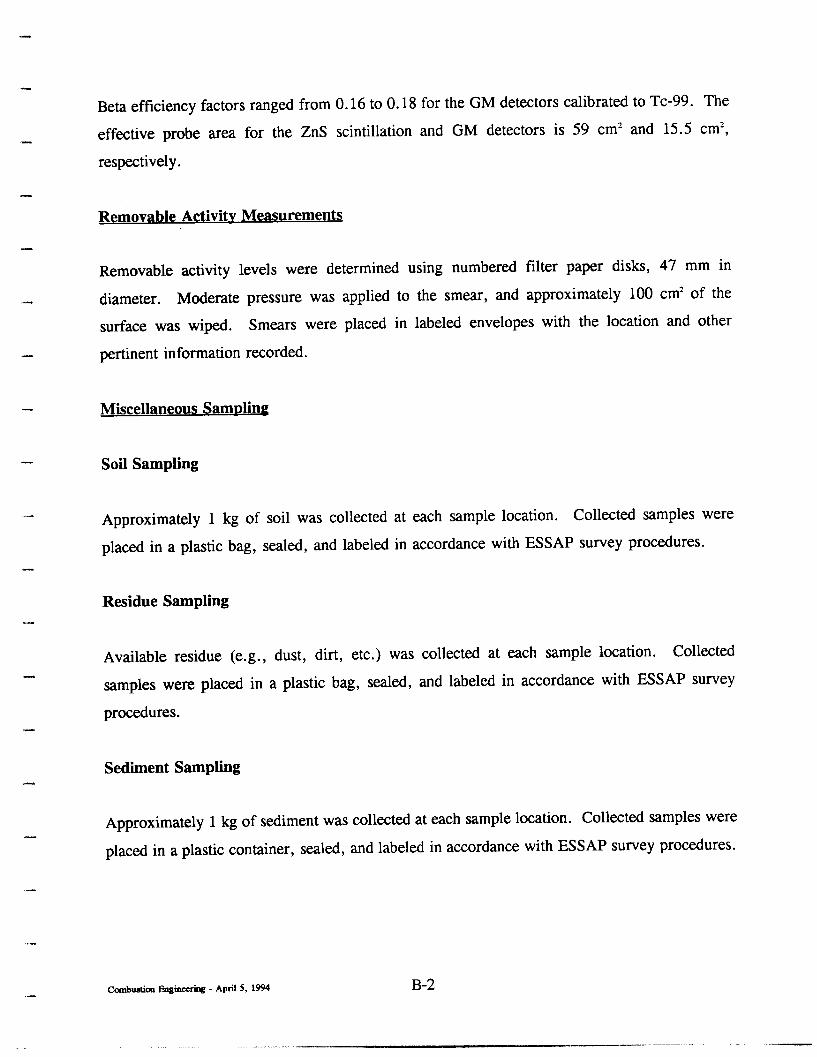
Beta efficiency factors ranged from 0.16 to 0.18 for the GM detectors calibrated to Tc-99. The
effective probe area for the ZnS scintillation and GM detectors is 59 cm2 and 15.5 cm’,
respectively.
Removable Activitv Measurements
Removable activity levels were determined using numbered filter paper disks, 47 mm in
diameter. Moderate pressure was applied to the smear, and approximately 100 cm’ of the
surface was wiped. Smears were placed in labeled envelopes with the location and other
pertinent information recorded.
Miscellaneous Samding
soil sampling
Approximately 1 kg of soil was collected at each sample location. Collected samples were
placed in a plastic bag, sealed, and labeled in accordance with ESSAP survey procedures.
Residue Sampling
Available residue (e. g . , dust, dirt, etc.) was collected at each sample location. Collected
samples were placed in a plastic bag, sealed, and labeled in accordance with ESSAP survey
procedures.
Sediment Sampling
/-
Approximately 1 kg of sediment was collected at each sample location. Collected samples were
placed in a plastic container, sealed, and labeled in accordance with ESSAP survey procedures.
Ccmbustion Engirrctriqg - April 5.1% B-2
-__--..--. - --

Paint Sampling
Paint samples were obtained by chipping the paint from 100 cm2 of surface area. The sample was then placed in a plastic specimen cup, sealed, and labeled in accordance with ESSAP survey
procedures.
ANALYTICAL PROCEDURES
Removable Activity
Smears were counted on a low background gas proportional system for gross alpha and gross beta activity.
Miscellaneous Samdes
Gamma Spectrometry
Samples of solid materials (soil, sludge, cake, debris, residues, and construction material) were dried, mixed, crushed, and/or homogenized as necessary, and a portion sealed in a 0.5-liter Marinelli beaker or other appropriate container. The quantity was chosen to reproduce a
calibrated counting geometry. Net material weights were determined and the samples counted
using intrinsic germanium detectors, coupled to a pulse height analyzer system. Background and
Compton stripping, peak search, peak identification, and concentration calculations were
performed using the computer capabilities inherent in the analyzer system. All photopeaks
associated with the radionuclides of concern were reviewed for consistency of activity. Energy peaks used for determining the activities of radionuclides of concern were:
U-235 0.143 MeV or 0.186 MeV
U-238 0.063 MeV or 0.093 MeV from Th-234*
*Secular equilibrium assumed. Spectra were also reviewed for other identifiable photopeaks.
Combustion Enginecriag - April 5, 1% B-3
- _I_- ~...... -.-I___ --- -._- -

Alpha Spectrometry
.-
“L
/-
.-
Solid, soil, sludge and miscellaneous samples (debris, residues, tile, etc.) were crushed,
homogenized and analyzed for isotopic uranium, plutonium, americium, etc. Samples were
dissolved by potassium fluoride and pyrosulfate fusion and the elements of interest were precipitated with barium sulfate. The barium sulfate precipitate was redissolved and the uranium was separated by liquid-liquid extraction and re-precipitated with a cerium fluoride carrier. The
precipitate was then counted using surface barrier and ion implanted detectors (ORTEC), alpha
spectrometers (Tennelec and Canberra), and a multichannel analyzer (Canberra).
UNCERTAINTIES AND DETECTION LIMITS
The uncertainties associated with the analytical data presented in the tables of this report
represent the 95 % confidence level for that data. These uncertainties were calculated based on
both the gross sample count levels and the associated background count levels. Additional
uncertainties, associated with sampling and measurement procedures, have not been propagated
into the data presented in this report.
Detection limits, referred to as minimum detectable activity (MDA), were based on 2.71 plus
4.66 times the standard deviation of the background count 2.71 + (4.66 @. When the
activity was determined to be less than the MDA of the measurement procedure, the result was
reported as less than MDA. Because of variations in background levels, measurement
efficiencies, the detection limits differ from sample to sample and instrument to instrument.
CALIBRATION AND QUALITY ASSURANCE
Calibration of all field and laboratory instrumentation was based on standards/sources, traceable
to NIST, when such standards/sources were available. In cases where they were not available,
standards of an industry recognized organization were used.
Combustion Enginccrimg - April 5, 1994 B-4
__-.. -..- -_____

Analytical and field survey activities were conducted in accordance with procedures from the
following documents of the Environmental Survey and Site Assessment Program:
a Survey Procedures Manual, Revision 7.1 (September 1993) 0 Laboratory Procedures Manual, Revision 8 (August 1993) a Quality Assurance Manual, Revision 6 (July 1993)
The procedures contained in these manuals were developed to meet the requirements of DOE
Order 5700.6C and ASME NQA-1 for Quality Assurance and contain measures to assess
processes during their performance.
Quality control procedures include:
0 Daily instrument background and check-source measurements to confirm that
equipment operation is within acceptable statistical fluctuations. 0 Participation in EPA and EML laboratory Quality Assurance Programs. l Training and certification of all individuals performing procedures. a Periodic internal and external audits.
Combustion Eaginctriag - April 5.1994 B-5
_.--~ ,. __--

-
APPENDIX C
SUMMARY OF DEPARTMENT OF ENERGY
RESIDUAL RADIOACTIVE MATERIAL GUIDELINES
Combustion Engineering - April 5.1994
.._ ~ I - _-_. --. .~ .- ---____

“W
APPENDIX C
SUMMARY O F DEPARTMENT O F ENERGY RESIDUAL RADIOACTIVE MATERIAL GUIDELINES’
BASIC DOSE LIMITS
The basic dose limit for the annual radiation dose (exc luding radon) received by an indiv idual member of the general public is 100 mrem/yr.’ In implementing this limit, DOE applies as low as reasonably achievable princ iples to set s ite-specific guidelines .
EXTERNAL GAMMA RADIATION
The average level of gamma radiation ins ide a building or habitable s tructure on a s ite that has no radiological restric tion on its use shall not exceed the background level by more than 20 pR/h and will comply with the basic dose limits when an appropriate-use scenario is considered.
SURFACE CONTAMINATION GUIDELINES
Radionuc lidesb
Allowable Total Residual Surface Contamination (dpm/lO O cm’)’
Averageced Maximumdv” Removabled*’
Transuranic s , Ra-226, Ra-228, Th-230 Th-228, Pa-23 1, AC-227, I-125, I-129
Th-Natural, Th-232, Sr-90, Ra-223, Ra-224, U-232, I-126, I-131, I-133
U-Natural, U-235, U-238, and assoc iated decay products
Beta-gamma emitters (radionuc lides with decay modes other than alpha emis s ion or spontaneous fis s ion) except Sr-90 and others noted above
100 300
Loo0 3,000
5,ooocY 15,oO O c Y
20
200
1 ,oooCY
5 ,O O O P-Y 15,O O op-y 1 ,ow+Y
Ccmbustion Engineering - April 5. 1994 C-l
-I_- . x 1. _-- - . - . - -

’ As used in this table, dpm (disintegrations per minute) means the rate of emission by radioactive material as determined by correcting the counts per minute measured by an appropriate detector for background, efficiency, and geometric factors associated with the instrumentation.
b Where surface contamination by both alpha- and beta-gamma-emitting radionuclides exists, the limits established for alpha- and beta-gamma-emitting radionuclides should apply independently.
’ Measurements of average contamination should not be averaged over an area of more than 1 mz. For objects of less surface area, the average should be derived for each such object.
d The average and maximum dose rates associated with surface contamination resulting from beta-gamma emitters should not exceed 0.2 mrad/h and 1.0 mrad/h, respectively, at a depth of 1 cm.
’ The maximum contamination level applies to an area of not more than 100 cm’.
’ The amount of removable radioactive material per 100 cm2 of surface area should be determined by wiping an area of that size with dry filter or soft absorbent paper, applying moderate pressure, and measuring the amount of radioactive material on the wipe with an appropriate instrument of known efficiency. When removable contamination on objects of surface area less than 100 cm2 is determined, the activity per unit area should be based on the actual area and the entire surface should be wiped. The numbers in this column are maximum amounts.
SOIL GUIDELINES
..-
Other Radionuclides Soil guidelines are calculated on a site-specific basis, using the DOE manual developed for this use.
’ These guidelines take into account ingrowth of radium-226 from thorium-230 or thorium-232 and radium-228 and assume secular equilibrium. If either Th-230 and Ra-226 or Th-232 and Ra-228 are both present, not in secular equilibrium, the guidelines apply to the higher concentration. If other mixtures of radionuclides occur, the concentrations of individual radionuclides shall be reduced so that (1) the dose for the mixtures will not exceed the basic dose limit, or (2) the sum of ratios of the soil concentration of each radionuclide to the allowable limit for that radionuclide will not exceed 1 (“unity”).
Radionuclides Soil Concentration (pCi/g) Above BackgroumPb”
Radium-226, Radium-228, Thorium-230, Thorium-232 5 pCi/g, averaged over the first 15 cm of soil below the
surface; 15 pCi/g, averaged over B-cm-thick layers of soil more than 15 cm below the surface.
_.- Combution Eqgiaccring - April 5,1994 c-2
..---_ - - _-- --

b These guidelines represent allowable residual concentrations above background averaged across any 15-cm-thick layer to any depth and over any contiguous 100 m2 surface area.
c If the average concentration in any surface or below-surface area, less than or equal to 25 m’, exceeds the authorized limit of guideline by a factor of (100/A)“, where A is the area or the elevated region in square meters, limits for “hot spots” shall also be applicable. Procedures for calculating these hot spot limits, which depend on the extent of the elevated local concentrations, are given in the DOE Manual for Implementing Residual Radioactive Materials Guidelines. 3 In addition, every reasonable effort shall be made to remove any source of radionuclide that exceeds 30 times the appropriate limit for soil, irrespective of the average concentration in the soil.
Ckmbustim Enginccriag - April 5, 1994 c-3
.-- -__-..-- --. --

REFERENCES
1. “Guidelines for Residual Radioactive Material at Formerly Utilized Sites Remedial Action Program and Remote Surplus Facilities Management Program Sites,” U.S. Department of Energy, Revision 2, March 1987.
2. “Radiation Protection of the Public and the Environment,” DOE Order 5400.5, U.S. Department of Energy, February 8, 1990.
3. Argonne National Laboratory “A Manual for Implementing Residual Radioactive Material Guidelines,” DOE/CH/8901, June 1989.
Combustim Engiwcring - April 5,1994 c-4