Z I C A - Amazon S3s3.amazonaws.com/zanran_storage/ Z I C A ZAMBIA INSTITUTE OF CHARTERED...
30
1 Z I C A ZAMBIA INSTITUTE OF CHARTERED ACCOUNTANTS CHARTERED ACCOUNTANTS EXAMINATIONS LICENTIATE LEVEL L6: CORPORATE FINANCIAL MANAGEMENT SERIES: DECEMBER 2011 TOTAL MARKS – 100 TIME ALLOWED: THREE (3) HOURS INSTRUCTIONS TO CANDIDATES 1. You have ten (10) minutes reading time. Use it to study the examination paper carefully so that you understand what to do in each question. You will be told when to start writing. 2. This paper is divided into TWO sections: Section A: Attempt BOTH questions in this section. Section B: Attempt THREE questions only in this section. 3. Enter your student number and your National Registration Card number on the front of the answer booklet. Your name must NOT appear anywhere on your answer booklet. 4. Do NOT write in pencil (except for graphs and diagrams). 5. The marks shown against the requirement(s) for each question should be taken as an indication of the expected length and depth of the answer. 6. All workings must be done in the answer booklet. 7. Present legible and tidy work. 8. Graph paper (if required) is provided at the end of the answer booklet. 9. Formulae, Present Value and Annuity tables are attached at the end of this question paper.
Transcript of Z I C A - Amazon S3s3.amazonaws.com/zanran_storage/ Z I C A ZAMBIA INSTITUTE OF CHARTERED...
1
Z I C A
ZAMBIA INSTITUTE OF CHARTERED ACCOUNTANTS
CHARTERED ACCOUNTANTS EXAMINATIONS
LICENTIATE LEVEL
L6: CORPORATE FINANCIAL MANAGEMENT
SERIES: DECEMBER 2011
TOTAL MARKS – 100 TIME ALLOWED: THREE (3) HOURS
INSTRUCTIONS TO CANDIDATES
1. You have ten (10) minutes reading time. Use it to study the examination paper carefully so that you understand what to do in each question. You will be told when to start writing.
2. This paper is divided into TWO sections:
Section A: Attempt BOTH questions in this section.
Section B: Attempt THREE questions only in this section.
3. Enter your student number and your National Registration Card number on the front of the answer booklet. Your name must NOT appear anywhere on your answer booklet.
4. Do NOT write in pencil (except for graphs and diagrams).
5. The marks shown against the requirement(s) for each question should be taken as an indication of the expected length and depth of the answer.
6. All workings must be done in the answer booklet.
7. Present legible and tidy work.
8. Graph paper (if required) is provided at the end of the answer booklet.
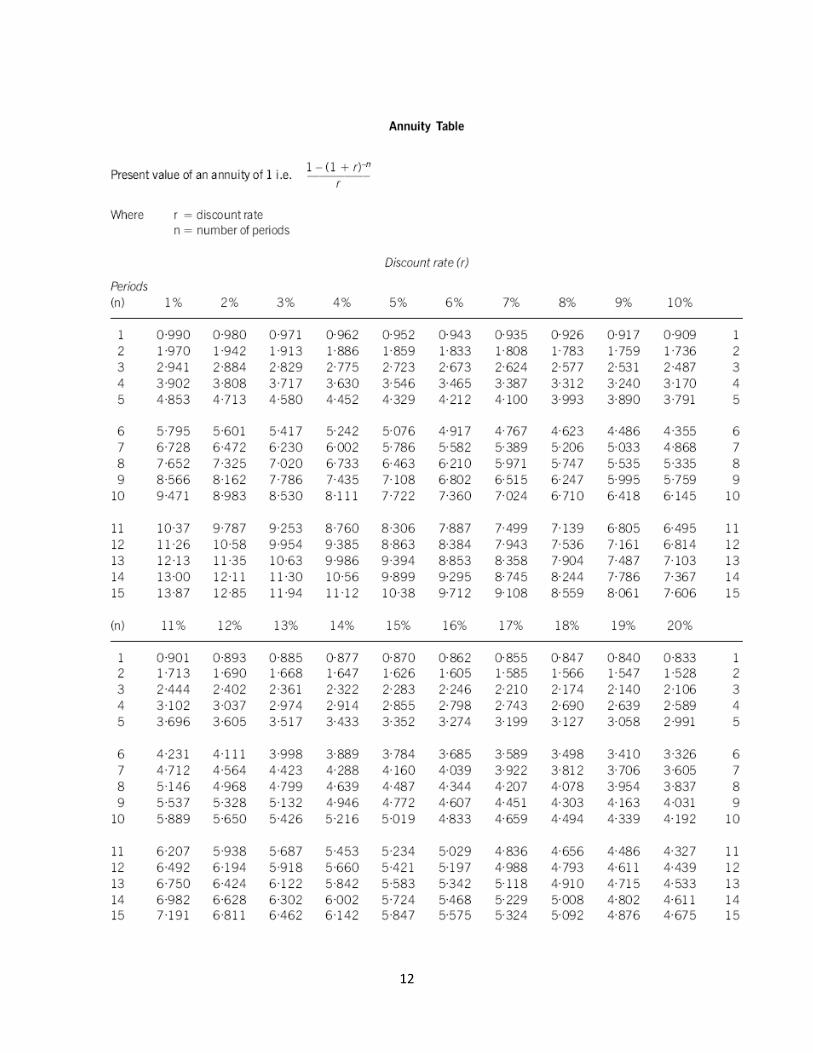
9. Formulae, Present Value and Annuity tables are attached at the end of this question
paper.
2
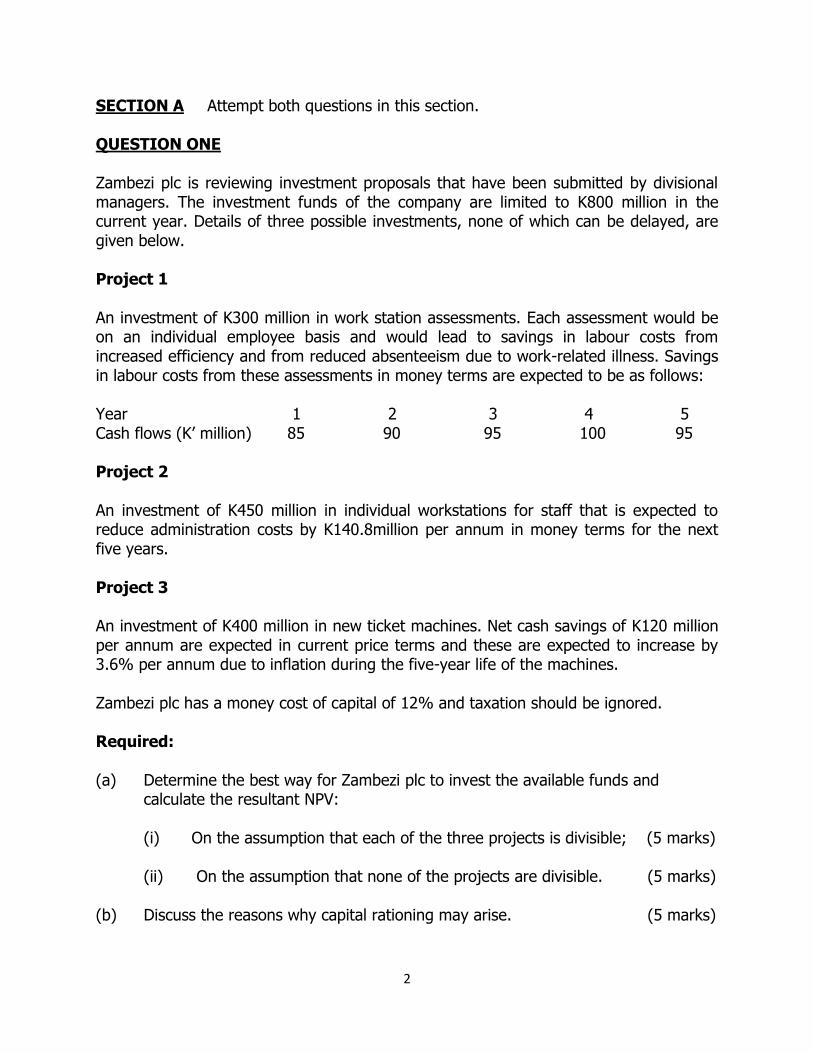
SECTION A Attempt both questions in this section. QUESTION ONE Zambezi plc is reviewing investment proposals that have been submitted by divisional managers. The investment funds of the company are limited to K800 million in the current year. Details of three possible investments, none of which can be delayed, are given below. Project 1 An investment of K300 million in work station assessments. Each assessment would be on an individual employee basis and would lead to savings in labour costs from increased efficiency and from reduced absenteeism due to work-related illness. Savings in labour costs from these assessments in money terms are expected to be as follows: Year 1 2 3 4 5 Cash flows (K’ million) 85 90 95 100 95 Project 2 An investment of K450 million in individual workstations for staff that is expected to reduce administration costs by K140.8million per annum in money terms for the next five years. Project 3 An investment of K400 million in new ticket machines. Net cash savings of K120 million per annum are expected in current price terms and these are expected to increase by 3.6% per annum due to inflation during the five-year life of the machines. Zambezi plc has a money cost of capital of 12% and taxation should be ignored. Required: (a) Determine the best way for Zambezi plc to invest the available funds and
calculate the resultant NPV:
(i) On the assumption that each of the three projects is divisible; (5 marks)
(ii) On the assumption that none of the projects are divisible. (5 marks)
(b) Discuss the reasons why capital rationing may arise. (5 marks)
3
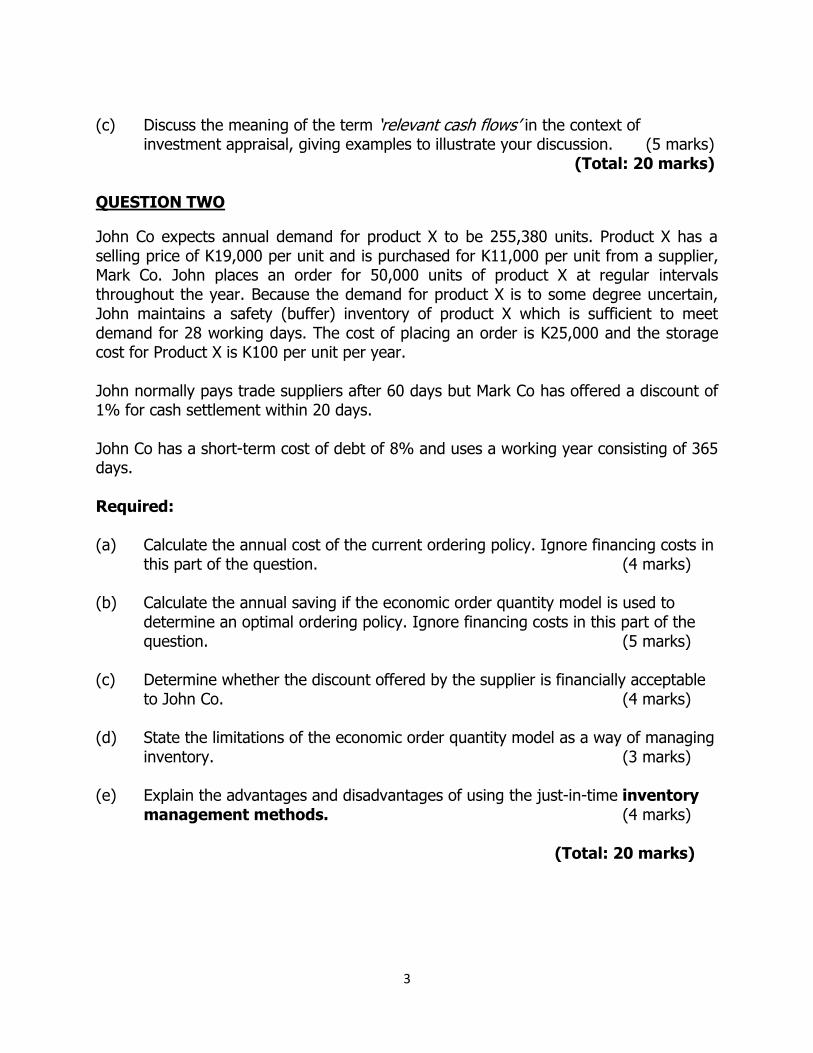
(c) Discuss the meaning of the term ‘relevant cash flows’ in the context of investment appraisal, giving examples to illustrate your discussion. (5 marks) (Total: 20 marks) QUESTION TWO
John Co expects annual demand for product X to be 255,380 units. Product X has a selling price of K19,000 per unit and is purchased for K11,000 per unit from a supplier, Mark Co. John places an order for 50,000 units of product X at regular intervals throughout the year. Because the demand for product X is to some degree uncertain, John maintains a safety (buffer) inventory of product X which is sufficient to meet demand for 28 working days. The cost of placing an order is K25,000 and the storage cost for Product X is K100 per unit per year. John normally pays trade suppliers after 60 days but Mark Co has offered a discount of 1% for cash settlement within 20 days. John Co has a short-term cost of debt of 8% and uses a working year consisting of 365 days. Required: (a) Calculate the annual cost of the current ordering policy. Ignore financing costs in this part of the question. (4 marks) (b) Calculate the annual saving if the economic order quantity model is used to
determine an optimal ordering policy. Ignore financing costs in this part of the question. (5 marks)
(c) Determine whether the discount offered by the supplier is financially acceptable to John Co. (4 marks) (d) State the limitations of the economic order quantity model as a way of managing inventory. (3 marks) (e) Explain the advantages and disadvantages of using the just-in-time inventory management methods. (4 marks)
(Total: 20 marks)

4
SECTION B Attempt any three questions in this section.
QUESTION THREE
Mwewa plc wishes to calculate its weighted average cost of capital and the following information relates to the company at the current time: Number of ordinary shares 20 million Book value of 7% convertible debt K290 million Book value of 8% bank loan K20 million Market price of ordinary shares K55.00 per share Market value of convertible debt K1, 071 per K1, 000 bond Equity beta of Mwewa plc 1.2 Risk-free rate of return 4.7% Equity risk premium 6.5% Rate of taxation 30% Mwewa plc expects share prices to rise in the future at an average rate of 6% per year. The convertible debt can be redeemed at par (K1, 000) in eight years’ time, or converted in six years’ time into 15 shares of Mwewa plc K1, 000 bond. Required: (a) Calculate the market value weighted average cost of capital of Mwewa plc. State clearly any assumptions that you make. (12 marks) (b) Discuss the circumstances under which the weighted average cost of capital can be used in investment appraisal. (4 marks) (c) Discuss whether the dividend growth model or the capital asset pricing model offers a better estimate of the cost of equity of a company. (4 marks)
(Total: 20 marks)
5
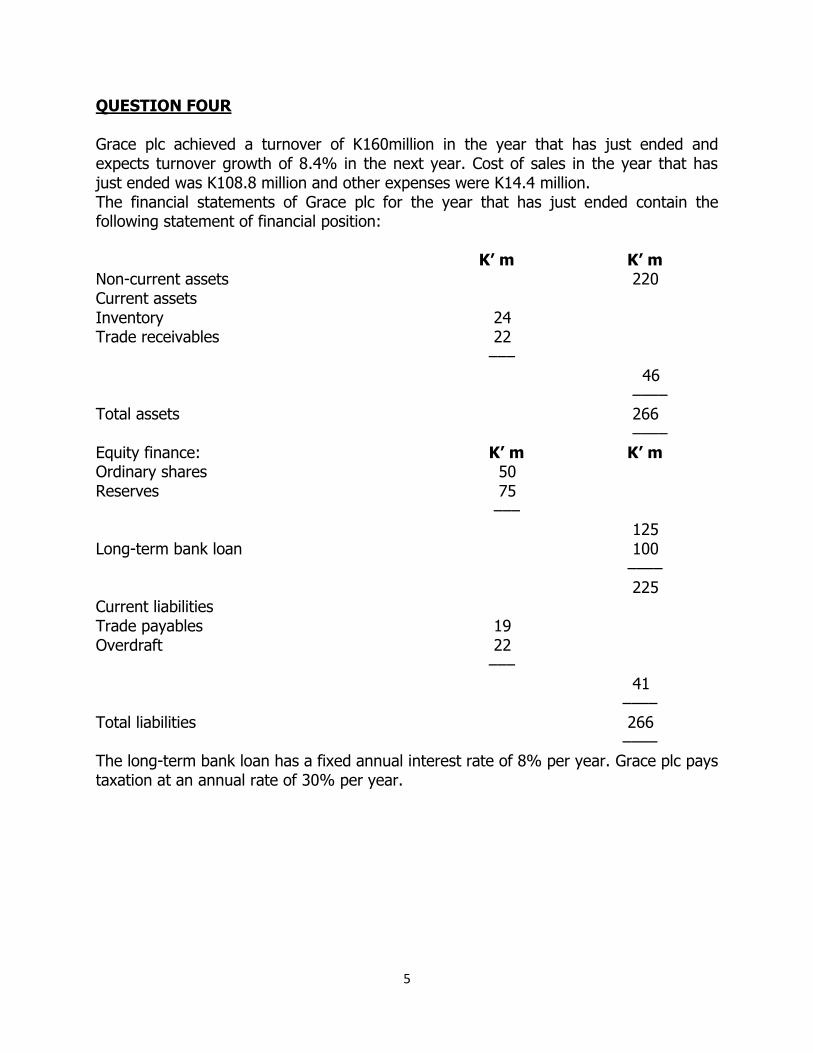
QUESTION FOUR Grace plc achieved a turnover of K160million in the year that has just ended and expects turnover growth of 8.4% in the next year. Cost of sales in the year that has just ended was K108.8 million and other expenses were K14.4 million. The financial statements of Grace plc for the year that has just ended contain the following statement of financial position:
K’ m K’ m Non-current assets 220 Current assets Inventory 24 Trade receivables 22
––– 46 ––––
Total assets 266 ––––
Equity finance: K’ m K’ m Ordinary shares 50 Reserves 75
––– 125
Long-term bank loan 100 –––– 225
Current liabilities Trade payables 19 Overdraft 22
––– 41
–––– Total liabilities 266
–––– The long-term bank loan has a fixed annual interest rate of 8% per year. Grace plc pays taxation at an annual rate of 30% per year.

6
The following accounting ratios have been forecast for the next year: Gross profit margin: 30% Operating profit margin: 20% Dividend payout ratio: 50% Inventory turnover period: 110 days Trade receivables period: 65 days Trade payables period: 75 days Overdraft interest in the next year is forecast to be K1,400, 000. No change is expected in the level of non-current assets and depreciation should be ignored. Required: (a) Discuss the role of financial intermediaries in providing short-term finance for use
by business organisations. (4 marks) (b) Prepare the following forecast financial statements for Grace plc using the
information provided:
(i) An Income Statement for the next year; and (5 marks) (ii) A Statement of Financial Position at the end of the next year. (5 marks)
(c) Analyse and discuss the forecast financial performance of Grace plc in terms of working capital management. (6 marks)
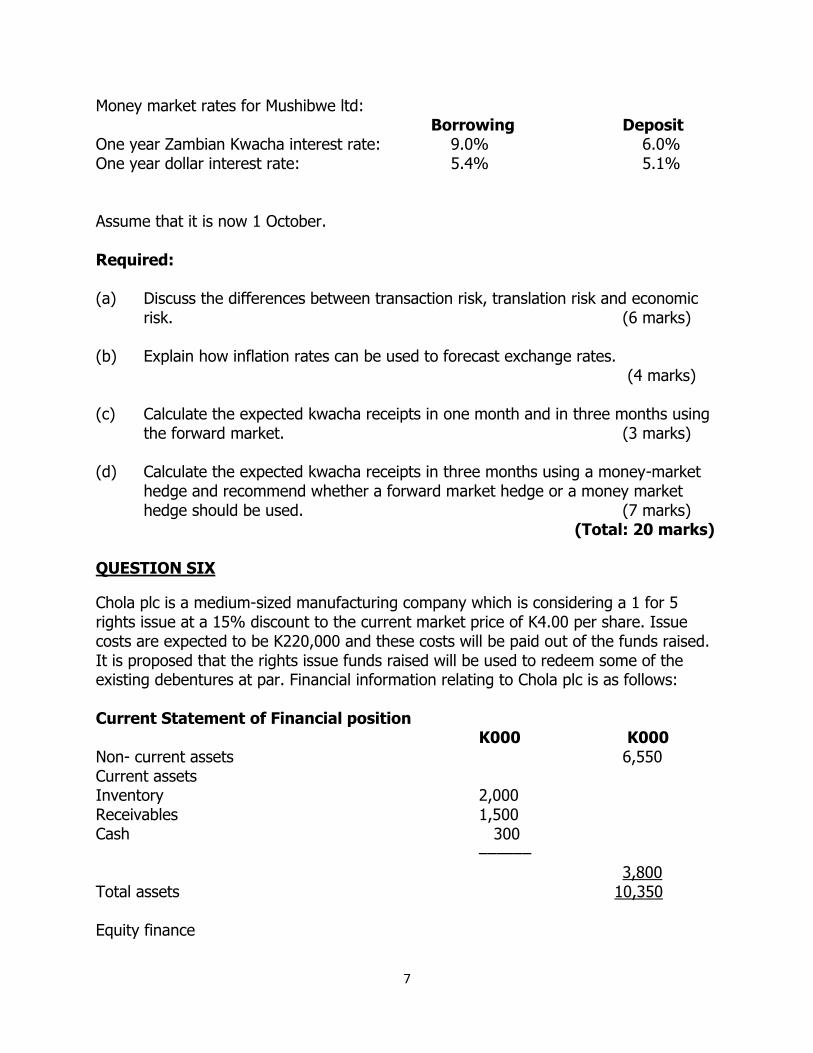
(Total: 20 marks) QUESTION FIVE Mushibwe ltd is a Zambian - based company which has the following expected transactions: One month: Expected receipt of $24,000 One month: Expected payment of $14,000 Three months: Expected receipts of $30,000 The finance manager has collected the following information: Spot rate (ZMK per $): 4,950 – 4,800 One month forward rate (ZMK per $): 4,870 – 4,785 Three months forward rate (ZMK per $): 4,775 – 4,734
7
Money market rates for Mushibwe ltd: Borrowing Deposit
One year Zambian Kwacha interest rate: 9.0% 6.0% One year dollar interest rate: 5.4% 5.1% Assume that it is now 1 October. Required: (a) Discuss the differences between transaction risk, translation risk and economic
risk. (6 marks) (b) Explain how inflation rates can be used to forecast exchange rates.
(4 marks) (c) Calculate the expected kwacha receipts in one month and in three months using
the forward market. (3 marks) (d) Calculate the expected kwacha receipts in three months using a money-market
hedge and recommend whether a forward market hedge or a money market hedge should be used. (7 marks)
(Total: 20 marks) QUESTION SIX
Chola plc is a medium-sized manufacturing company which is considering a 1 for 5 rights issue at a 15% discount to the current market price of K4.00 per share. Issue costs are expected to be K220,000 and these costs will be paid out of the funds raised. It is proposed that the rights issue funds raised will be used to redeem some of the existing debentures at par. Financial information relating to Chola plc is as follows: Current Statement of Financial position
K000 K000 Non- current assets 6,550 Current assets Inventory 2,000 Receivables 1,500 Cash 300
–––––– 3,800
Total assets 10,350 Equity finance
8
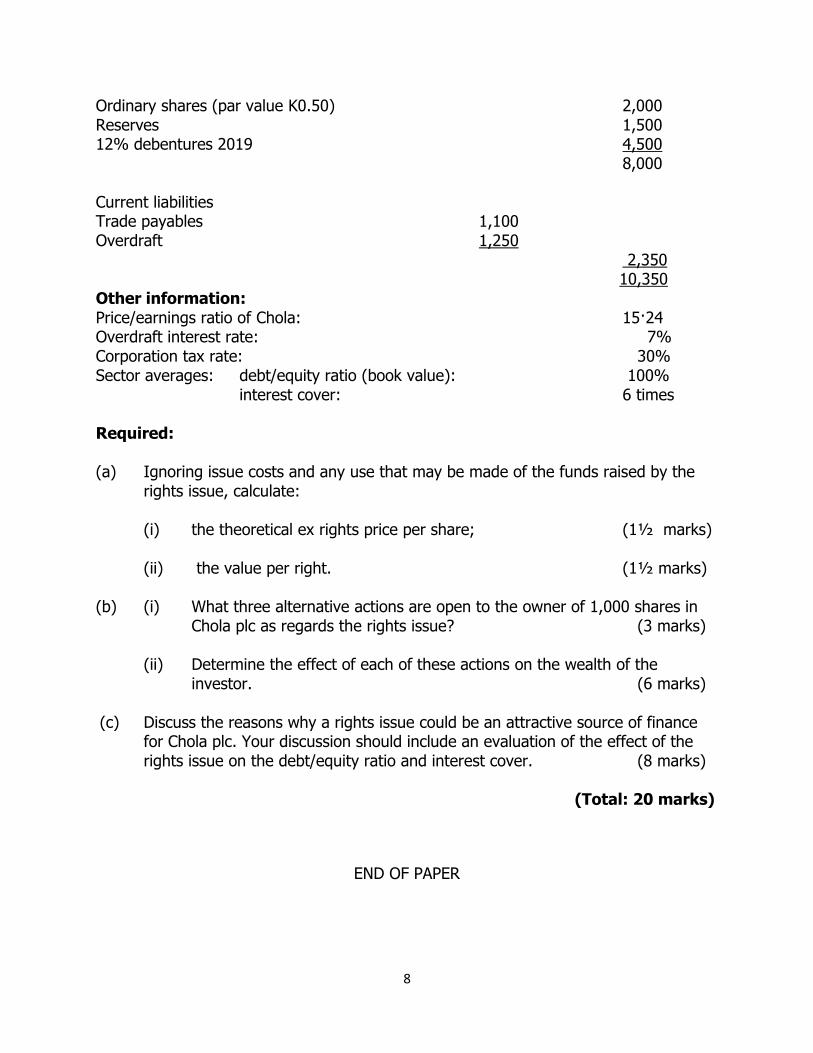
Ordinary shares (par value K0.50) 2,000 Reserves 1,500 12% debentures 2019 4,500 8,000 Current liabilities Trade payables 1,100 Overdraft 1,250
2,350 10,350 Other information: Price/earnings ratio of Chola: 15·24 Overdraft interest rate: 7% Corporation tax rate: 30% Sector averages: debt/equity ratio (book value): 100%
interest cover: 6 times Required: (a) Ignoring issue costs and any use that may be made of the funds raised by the rights issue, calculate:
(i) the theoretical ex rights price per share; (1½ marks) (ii) the value per right. (1½ marks)
(b) (i) What three alternative actions are open to the owner of 1,000 shares in
Chola plc as regards the rights issue? (3 marks) (ii) Determine the effect of each of these actions on the wealth of the investor. (6 marks)
(c) Discuss the reasons why a rights issue could be an attractive source of finance for Chola plc. Your discussion should include an evaluation of the effect of the rights issue on the debt/equity ratio and interest cover. (8 marks)
(Total: 20 marks)
END OF PAPER
9

10
11
12

13
L6: Corporate Financial Management
Suggested solutions

14
SOLUTION ONE
(a) (i) Analysis of projects assuming they are divisible. Project 1 PV at 12% Project 3 PV at 12% K’ m K, m K’ m K’ m
Initial investment (300.0) (300.0) (400.0) (400.0) Year 1 85.0 1 75.9 124.3 111.0 Year 2 1 90.0 1 71.7 128.8 102.7 Year 3 1 95.0 1 67.6 133.4 1 95.0 Year 4 100.0 1 63.6 138.2 1 87.9 Year 5 1 95.0 1 53.9 143.2 1 81.2
–––––––– –––––––– NPV 1 32.7 1 77.8
–––––––– –––––––– Profitability index (NPV/Initial cost) 32.7/300 = 0·11 77.8/400 = 0·19 Note: For project 3, the annual net cash savings of K120million is inflated by 3.6% pa starting in year 1. Project 2 NPV at 12% = (140.8 x 3·605) – 450 = K57.584 million Project 2 profitability index = 57.584/450 = 0·13 The optimum investment schedule involves investment in projects 3 and 2: Project Profitability Index Ranking Investment NPV (K’ m)
3 0·19 1 400 1 77.8 2 0·13 2 400 1 51.2*
–––– –––––––– 800 129 –––– ––––––––
*(57.584x 400/450)
(ii) If the projects are assumed to be indivisible, the total NPV of combinations of projects must be considered.
Projects Investment NPV (K’ m) 1+2 750m 1 90.3 (32.7 + 57.6) 1+3 700m 110.5 (32.7 + 77.8)
The optimum combination is now projects 1 and 3.
15
(b) The NPV decision rule, to accept all projects with a positive net present value, requires the existence of a perfect capital market where access to funds for capital investment is not restricted. In practice, companies are likely to find that funds available for capital investment are restricted or rationed.
Hard capital rationing is the term applied when the restrictions on raising funds are due to causes external to the company. For example, potential providers of debt finance may refuse to provide further funding because they regard a company as too risky. This may be in terms of financial risk, for example if the company’s gearing is too high or its interest cover is too low, or in terms of business risk if they see the company’s business prospects as poor or its operating cash flows as too variable. In practice, large established companies seeking long-term finance for capital investment are usually able to find it, but small and medium-sized enterprises will find raising such funds more difficult. Soft capital rationing refers to restrictions on the availability of funds that arise within a company and are imposed by managers. There are several reasons why managers might restrict available funds for capital investment. Managers may prefer slower organic growth to a sudden increase in size arising from accepting several large investment projects. This reason might apply in a family-owned business that wishes to avoid hiring new managers. Managers may wish to avoid raising further equity finance if this will dilute the control of existing shareholders. Managers may wish to avoid issuing new debt if their expectations of future economic conditions are such as to suggest that an increased commitment to fixed interest payments would be unwise. One of the main reasons suggested for soft capital rationing is that managers wish to create an internal market for investment funds. It is suggested that requiring investment projects to compete for funds means that weaker or marginal projects, with only a small chance of success, are avoided. This allows a company to focus on more robust investment projects where the chance of success is higher. This cause of soft capital rationing can be seen as a way of reducing the risk and uncertainty associated with investment projects, as it leads to accepting projects with greater margins of safety.
(c) When undertaking the appraisal of an investment project, it is essential that only
relevant cash flows are included in the analysis. If non-relevant cash flows are included, the result of the appraisal will be misleading and incorrect decisions will be made. A relevant cash flow is a differential (incremental) cash flow, one that changes as a direct result of an investment decision.
If current fixed production overheads are expected to increase, for example, the additional fixed production overheads are a relevant cost and should be included
16
in the investment appraisal. Existing fixed production overheads should not be included. A new cash flow arising as the result of an investment decision is a relevant cash flow. For example, the purchase of raw materials for a new production process and the net cash flows arising from the production process are both relevant cash flows. The incremental tax effects arising from an investment decision are also relevant cash flows, providing that a company is in a tax-paying position. Direct labour costs, for example, are an allowable deduction in calculating taxable profit and so give rise to tax benefits: tax liabilities arising on incremental taxable profits are also a relevant cash flow. One area where caution is required is interest payments on new debt used to finance an investment project. They are a differential cash flow and hence relevant, but the effect of the cost of the debt is incorporated into the discount rate used to determine the net present value. Interest payments should not therefore be included as a cash flow in an investment appraisal. Market research undertaken to determine whether a new product will sell is often undertaken prior to the investment decision on whether to proceed with production of the new product. This is an example of a sunk cost. These are costs already incurred as a result of past decisions, and so are not relevant cash flows.
SOLUTION TWO
(a) John co has a current order size of 50,000 units Average number of orders per year = demand/order size = 255,380/50,000 = 5·11 orders Annual ordering cost = 5·11 x K25,000 = K127,750 Buffer inventory held = 255,380 x 28/365 = 19,591 units Average inventory held = 19,591 + (50,000/2) = 44,591 units
Annual holding cost = 44,591 x K100 = K4,459,100
Annual cost of current ordering policy = 4,459,100 + 127,750 = K4,586,850
(b) We need to calculate the economic order quantity:
EOQ = √ (2 x 255,380 x 25,000)/100) = 11,300 units
Average number of orders per year = 255,380/11,300 = 22·6 orders

17
Annual ordering cost = 22·6 x K25,000 = K565,000
Average inventory held = 19,591 + (11,300/2) = 25,241 units Annual holding cost = 25,241 x K100 = K2,524,100
Annual cost of EOQ ordering policy = 2,524,100 + 565,000 = K3,089,100 Saving compared to current policy = 4,586,850 – 3,089,100 = K1,497,750
(c) Annual credit purchases = 255,380 x 11,000 = K2,809,180,000
Current payables = 2,809,180,000 x 60/365 = K461,783,014 Payables if discount is taken = 2,809,180,000 x 20/365 = K153,927,671 Reduction in payables = 461,783,014 – 153,927,671 = K307,855,343 Finance cost increase = 307,855,343 x 0·08 = K24,628,427
Discount gained = 2,809,180,000 x 0·01 = K28,091,800 Net benefit of taking discount = 28,091,800 – 24,628,427 = K3,463,373 The discount is financially acceptable.
An alternative approach is to calculate the annual percentage benefit of the discount. This can be done on a simple interest basis: (1/(100 – 1)) x (365/40) = 9·2%
Alternatively, the equivalent annual rate can be calculated: (100/(100 – 1))^365/40 – 1 = 9·6% Both methods indicate that the annual percentage benefit is greater than the current cost of short-term debt (8%) of John Co and hence can be recommended on financial grounds.
(d) The economic order quantity (EOQ) model is based on a cost function for holding inventory which has two terms: holding costs and ordering costs. With the EOQ, the total cost of having inventory is minimised when holding cost is equal to ordering cost. The EOQ model assumes certain knowledge of the variables on which it depends and for this reason is called a deterministic model. Demand for inventory, holding cost per unit per year and order cost are assumed to be certain and constant for the period under consideration. In practice, demand is likely to be variable or irregular and costs will not remain constant. The EOQ model also ignores the cost of running out of inventory (stock outs). This has caused some to suggest that the EOQ model has little to recommend it as a practical model for the management of inventory.
18
The model was developed on the basis of zero lead time and no buffer inventory, but these are not difficulties that prevent the practical application of the EOQ model. As our earlier analysis has shown, the EOQ model can be used in circumstances where buffer inventory exists and provided that lead time is known with certainty it can be ignored.
The EOQ model also serves a useful purpose in directing attention towards the costs that arise from holding inventory. If these costs can be reduced, working capital tied up in inventory can be reduced and overall profitability can be increased.
If uncertainty exists in terms of demand or lead time, a more complex inventory management model using probabilities (a stochastic model) such as the Miller-Orr model can be used. This model calculates control limits that give guidance as to when an order should be placed.
(e) Just-in-time (JIT) inventory management methods seek to eliminate any waste that arises in the manufacturing process as a result of using inventory. JIT purchasing methods apply the JIT principle to deliveries of material from suppliers. With JIT production methods, inventory levels of raw materials, work-in-progress and finished goods are reduced to a minimum or eliminated altogether by improved work-flow planning and closer relationships with suppliers. Advantages
JIT inventory management methods seek to eliminate waste at all stages of the manufacturing process by minimising or eliminating inventory, defects, breakdowns and production delays. This is achieved by improved workflow planning, an emphasis on quality control and firm contracts between buyer and supplier.
One advantage of JIT inventory management methods is a stronger relationship between buyer and supplier. This offers security to the supplier, who benefits from regular orders, continuing future business and more certain production planning. The buyer benefits from lower inventory holding costs, lower investment in inventory and work in progress, and the transfer of inventory management problems to the supplier. The buyer may also benefit from bulk purchase discounts or lower purchase costs.
The emphasis on quality control in the production process reduces scrap, reworking and set-up costs, while improved production design can reduce or even eliminate unnecessary material movements. The result is a smooth flow of material and work through the production system, with no queues or idle time.
19
Disadvantages
A JIT inventory management system may not run as smoothly in practice as theory may predict, since there may be little room for manoeuvre in the event of unforeseen delays. There is little room for error, for example, on delivery times.
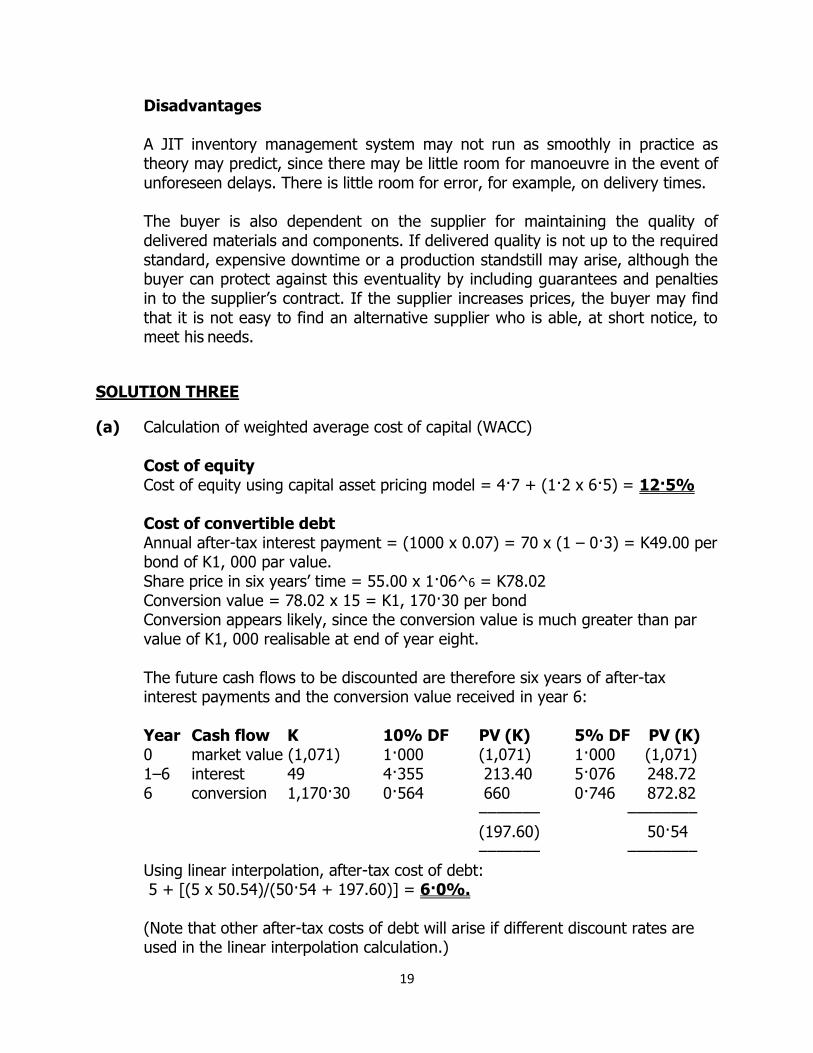
The buyer is also dependent on the supplier for maintaining the quality of delivered materials and components. If delivered quality is not up to the required standard, expensive downtime or a production standstill may arise, although the buyer can protect against this eventuality by including guarantees and penalties in to the supplier’s contract. If the supplier increases prices, the buyer may find that it is not easy to find an alternative supplier who is able, at short notice, to meet his needs.
SOLUTION THREE
(a) Calculation of weighted average cost of capital (WACC) Cost of equity Cost of equity using capital asset pricing model = 4·7 + (1·2 x 6·5) = 12·5% Cost of convertible debt Annual after-tax interest payment = (1000 x 0.07) = 70 x (1 – 0·3) = K49.00 per bond of K1, 000 par value. Share price in six years’ time = 55.00 x 1·06^6 = K78.02 Conversion value = 78.02 x 15 = K1, 170·30 per bond Conversion appears likely, since the conversion value is much greater than par value of K1, 000 realisable at end of year eight. The future cash flows to be discounted are therefore six years of after-tax interest payments and the conversion value received in year 6: Year Cash flow K 10% DF PV (K) 5% DF PV (K) 0 market value (1,071) 1·000 (1,071) 1·000 (1,071) 1–6 interest 49 4·355 213.40 5·076 248.72 6 conversion 1,170·30 0·564 660 0·746 872.82
––––––– –––––––– (197.60) 50·54 ––––––– ––––––––
Using linear interpolation, after-tax cost of debt: 5 + [(5 x 50.54)/(50·54 + 197.60)] = 6·0%. (Note that other after-tax costs of debt will arise if different discount rates are used in the linear interpolation calculation.)
20
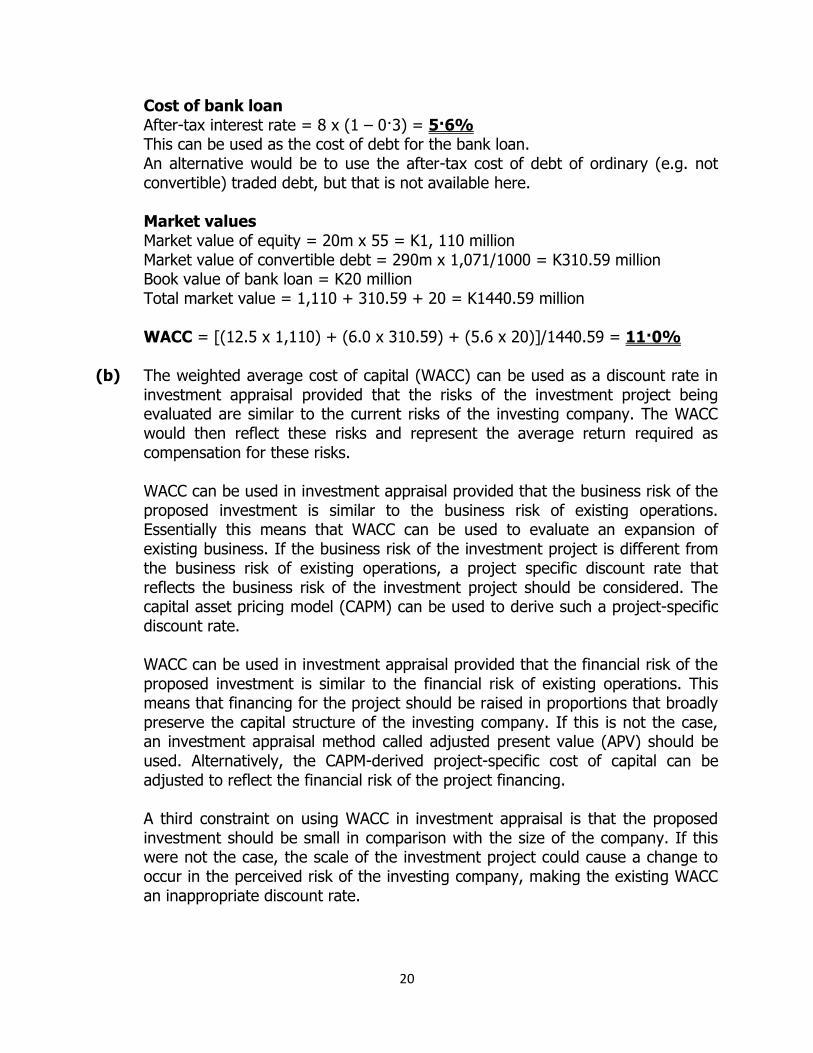
Cost of bank loan After-tax interest rate = 8 x (1 – 0·3) = 5·6% This can be used as the cost of debt for the bank loan. An alternative would be to use the after-tax cost of debt of ordinary (e.g. not convertible) traded debt, but that is not available here.
Market values Market value of equity = 20m x 55 = K1, 110 million Market value of convertible debt = 290m x 1,071/1000 = K310.59 million Book value of bank loan = K20 million Total market value = 1,110 + 310.59 + 20 = K1440.59 million WACC = [(12.5 x 1,110) + (6.0 x 310.59) + (5.6 x 20)]/1440.59 = 11·0%
(b) The weighted average cost of capital (WACC) can be used as a discount rate in
investment appraisal provided that the risks of the investment project being evaluated are similar to the current risks of the investing company. The WACC would then reflect these risks and represent the average return required as compensation for these risks.
WACC can be used in investment appraisal provided that the business risk of the proposed investment is similar to the business risk of existing operations. Essentially this means that WACC can be used to evaluate an expansion of existing business. If the business risk of the investment project is different from the business risk of existing operations, a project specific discount rate that reflects the business risk of the investment project should be considered. The capital asset pricing model (CAPM) can be used to derive such a project-specific discount rate.
WACC can be used in investment appraisal provided that the financial risk of the proposed investment is similar to the financial risk of existing operations. This means that financing for the project should be raised in proportions that broadly preserve the capital structure of the investing company. If this is not the case, an investment appraisal method called adjusted present value (APV) should be used. Alternatively, the CAPM-derived project-specific cost of capital can be adjusted to reflect the financial risk of the project financing.
A third constraint on using WACC in investment appraisal is that the proposed investment should be small in comparison with the size of the company. If this were not the case, the scale of the investment project could cause a change to occur in the perceived risk of the investing company, making the existing WACC an inappropriate discount rate.

21
(c) The dividend growth model has several difficulties attendant on its use as a way of estimating the cost of equity. For example, the model assumes that the future dividend growth rate is constant in perpetuity, an assumption that is not supported by the way that dividends change in practice. Each dividend paid by a company is the result of a dividend decision by managers, who will consider, but not be bound by, the dividends paid in previous periods. Estimating the future dividend growth rate is also very difficult. Historical dividend trends are usually analysed and on the somewhat risky assumption that the future will repeat the past, the historic dividend growth rate is used as a substitute for the future dividend growth rate. The model also assumes that business risk, and hence business operations and the cost of equity, are constant in future periods, but reality shows us that companies, their business operations and their economic environment are subject to constant change. Perhaps the one certain thing about the future is its uncertainty.
It is sometimes said that the dividend growth model does not consider risk, but risk is implicit in the share price used by the model to calculate the cost of equity. A moment’s thought will indicate that share prices fall as risk increases, indicating that increasing risk will lead to an increasing cost of equity. What is certainly true is that the dividend growth model does not consider risk explicitly in the same way as the capital asset pricing model (CAPM). Here, all investors are assumed to hold diversified portfolios and as a result only seek compensation (return) for the systematic risk of an investment. The CAPM represent the required rate of return (i.e. the cost of equity) as the sum of the risk-free rate of return and a risk premium reflecting the systematic risk of an individual company relative to the systematic risk of the stock market as a whole. This risk premium is the product of the company’s equity beta and the equity risk premium. The CAPM therefore tells us what the cost of equity should be, given an individual company’s level of systematic risk.
The individual components of the CAPM (the risk-free rate of return, the equity risk premium and the equity beta) are found by empirical research and so the CAPM gives rise to a much smaller degree of uncertainty than that attached to the future dividend growth rate in the dividend growth model. For this reason, it is usually suggested that the CAPM offers a better estimate of the cost of equity than the dividend growth model.
22
SOLUTION FOUR
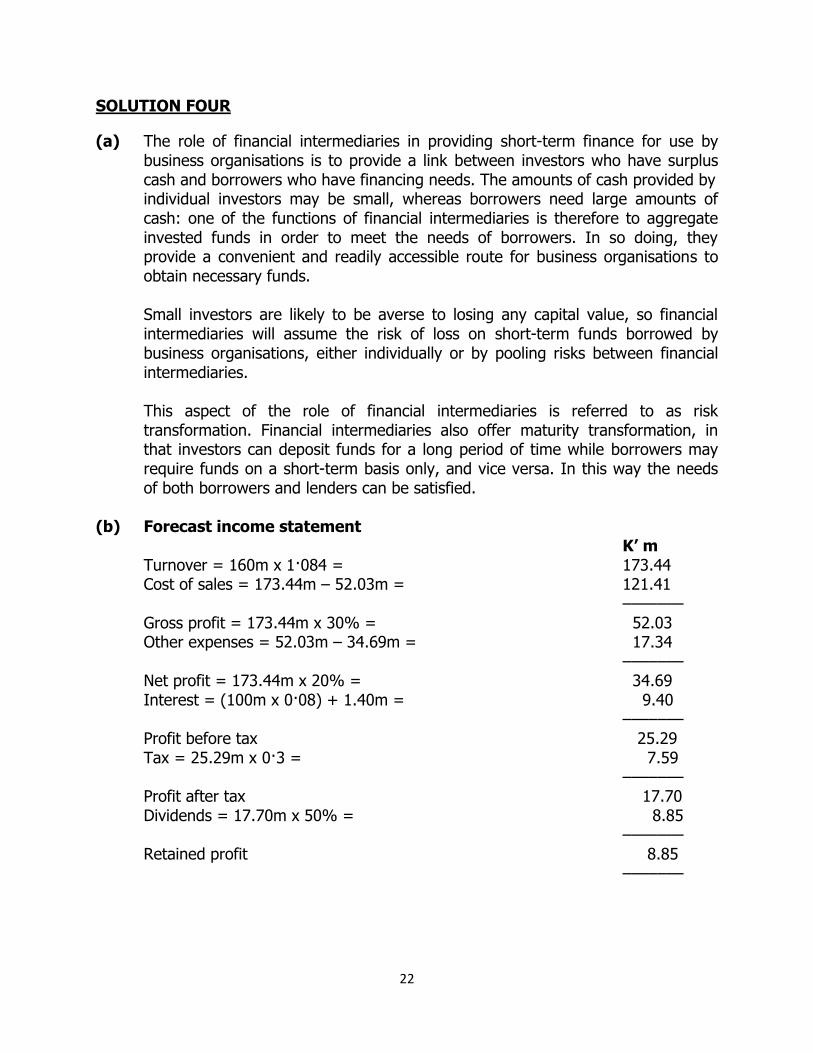
(a) The role of financial intermediaries in providing short-term finance for use by business organisations is to provide a link between investors who have surplus cash and borrowers who have financing needs. The amounts of cash provided by individual investors may be small, whereas borrowers need large amounts of cash: one of the functions of financial intermediaries is therefore to aggregate invested funds in order to meet the needs of borrowers. In so doing, they provide a convenient and readily accessible route for business organisations to obtain necessary funds. Small investors are likely to be averse to losing any capital value, so financial intermediaries will assume the risk of loss on short-term funds borrowed by business organisations, either individually or by pooling risks between financial intermediaries. This aspect of the role of financial intermediaries is referred to as risk transformation. Financial intermediaries also offer maturity transformation, in that investors can deposit funds for a long period of time while borrowers may require funds on a short-term basis only, and vice versa. In this way the needs of both borrowers and lenders can be satisfied.
(b) Forecast income statement K’ m
Turnover = 160m x 1·084 = 173.44 Cost of sales = 173.44m – 52.03m = 121.41
––––––– Gross profit = 173.44m x 30% = 52.03 Other expenses = 52.03m – 34.69m = 17.34
––––––– Net profit = 173.44m x 20% = 34.69 Interest = (100m x 0·08) + 1.40m = 9.40
––––––– Profit before tax 25.29 Tax = 25.29m x 0·3 = 7.59
––––––– Profit after tax 17.70 Dividends = 17.70m x 50% = 8.85
––––––– Retained profit 8.85
–––––––

23
Forecast statement of financial position K’ m K’ m
Non-current assets 220.00 Current assets Inventory (W1) 36.60 Trade receivables (W2) 30.90
––––– 67.50 ––––––
Total assets 287.50 ––––––
Equity finance: Ordinary shares 50.00 Reserves (W4) 83.90
––––– 133.90
Bank loan 100·00 –––––– 233.90
Current liabilities Trade payables (W3) 24.90 Overdraft (W5) 28.70
––––– 53.60 ––––––
Total liabilities 287.50 ––––––
Workings 1. Inventory = 121.41m x (110/365) = K36.6m 2. Trade receivables = 173.44m x (65/365) = K30.9m 3. Trade payables = 121.41m x (75/365) = K24.9m 4. Reserves = 75m + 8.85m = K83.9m 5. Overdraft = 287.5m – 233.9m – 24.9 = K28.7m (balancing figure)
(c) Working capital management Financial analysis shows deterioration in key working capital ratios. The inventory turnover period is expected to increase from 81 days to 110 days, the trade receivables period is expected to increase from 50 days to 65 days and the trade payables period is expected to increase from 64 days to 75 days. It is also a cause for concern here that the values of these working capital ratios for the next year are forecast, i.e. Grace plc appears to be anticipating a worsening in its working capital position.
24
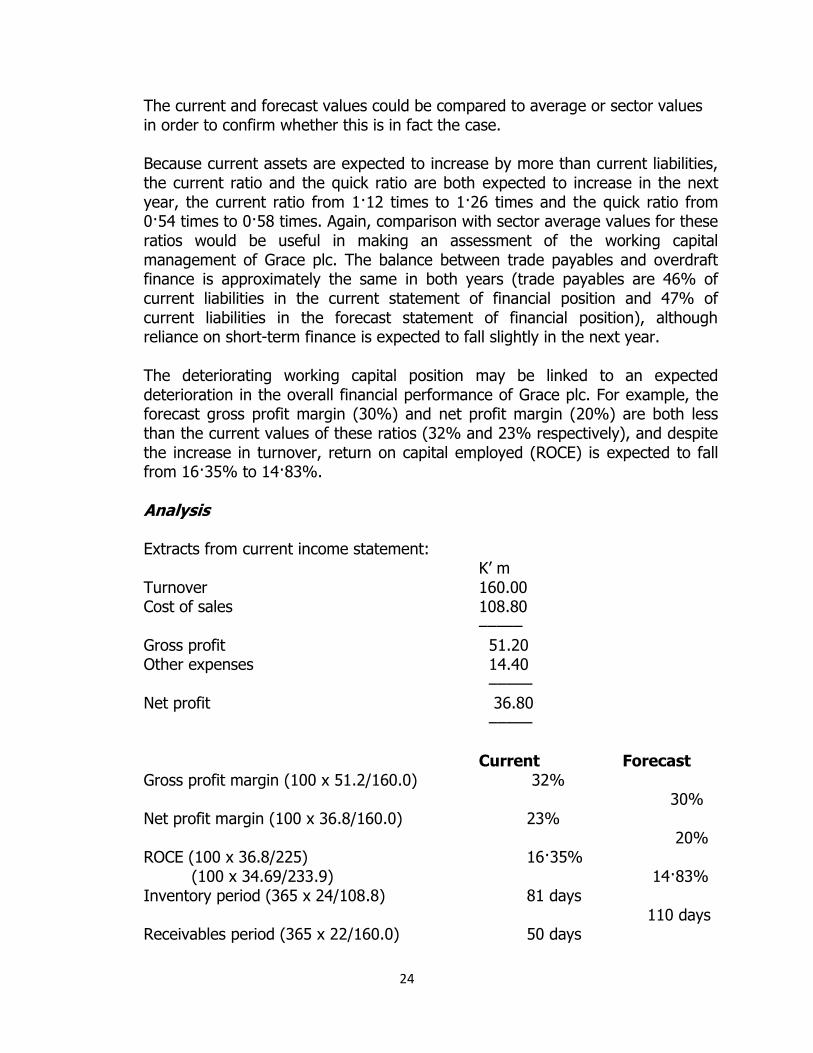
The current and forecast values could be compared to average or sector values in order to confirm whether this is in fact the case. Because current assets are expected to increase by more than current liabilities, the current ratio and the quick ratio are both expected to increase in the next year, the current ratio from 1·12 times to 1·26 times and the quick ratio from 0·54 times to 0·58 times. Again, comparison with sector average values for these ratios would be useful in making an assessment of the working capital management of Grace plc. The balance between trade payables and overdraft finance is approximately the same in both years (trade payables are 46% of current liabilities in the current statement of financial position and 47% of current liabilities in the forecast statement of financial position), although reliance on short-term finance is expected to fall slightly in the next year.
The deteriorating working capital position may be linked to an expected deterioration in the overall financial performance of Grace plc. For example, the forecast gross profit margin (30%) and net profit margin (20%) are both less than the current values of these ratios (32% and 23% respectively), and despite the increase in turnover, return on capital employed (ROCE) is expected to fall from 16·35% to 14·83%.
Analysis Extracts from current income statement:
K’ m Turnover 160.00 Cost of sales 108.80
––––– Gross profit 51.20 Other expenses 14.40
––––– Net profit 36.80
–––––
Current Forecast Gross profit margin (100 x 51.2/160.0) 32%
30% Net profit margin (100 x 36.8/160.0) 23%
20% ROCE (100 x 36.8/225) 16·35%
(100 x 34.69/233.9) 14·83% Inventory period (365 x 24/108.8) 81 days
110 days Receivables period (365 x 22/160.0) 50 days
25
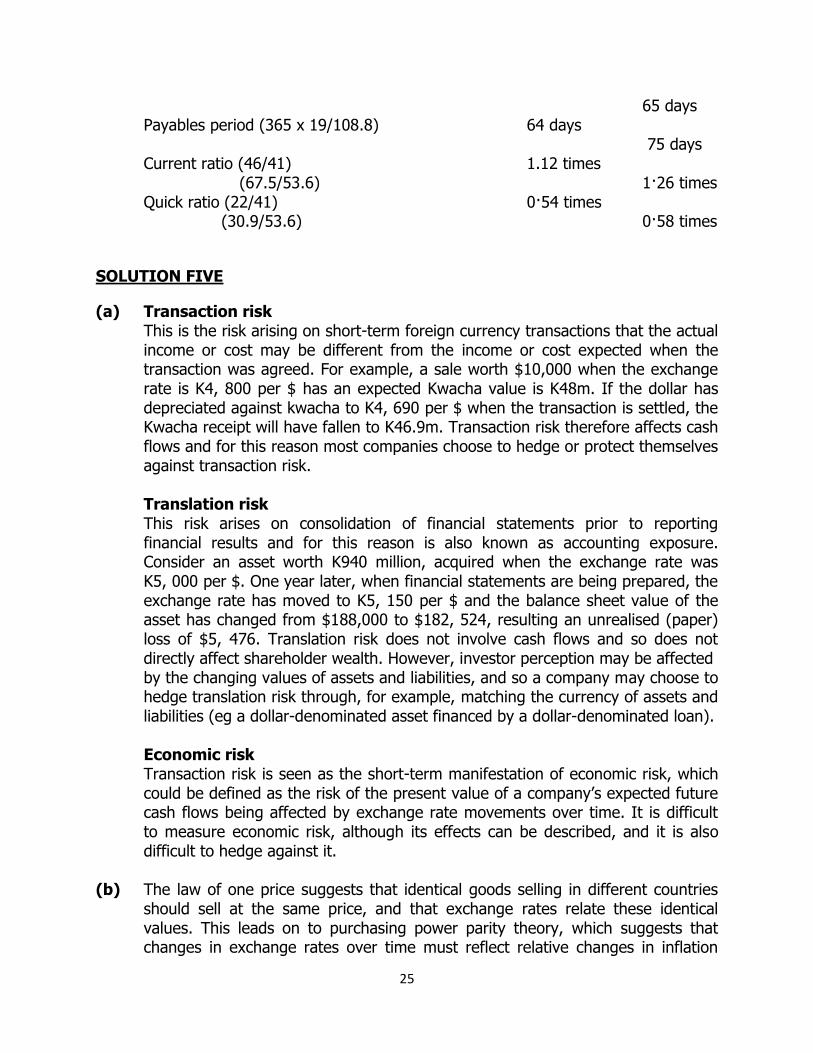
65 days Payables period (365 x 19/108.8) 64 days
75 days Current ratio (46/41) 1.12 times
(67.5/53.6) 1·26 times Quick ratio (22/41) 0·54 times
(30.9/53.6) 0·58 times
SOLUTION FIVE
(a) Transaction risk This is the risk arising on short-term foreign currency transactions that the actual income or cost may be different from the income or cost expected when the transaction was agreed. For example, a sale worth $10,000 when the exchange rate is K4, 800 per $ has an expected Kwacha value is K48m. If the dollar has depreciated against kwacha to K4, 690 per $ when the transaction is settled, the Kwacha receipt will have fallen to K46.9m. Transaction risk therefore affects cash flows and for this reason most companies choose to hedge or protect themselves against transaction risk.
Translation risk This risk arises on consolidation of financial statements prior to reporting financial results and for this reason is also known as accounting exposure. Consider an asset worth K940 million, acquired when the exchange rate was K5, 000 per $. One year later, when financial statements are being prepared, the exchange rate has moved to K5, 150 per $ and the balance sheet value of the asset has changed from $188,000 to $182, 524, resulting an unrealised (paper) loss of $5, 476. Translation risk does not involve cash flows and so does not directly affect shareholder wealth. However, investor perception may be affected by the changing values of assets and liabilities, and so a company may choose to hedge translation risk through, for example, matching the currency of assets and liabilities (eg a dollar-denominated asset financed by a dollar-denominated loan).
Economic risk Transaction risk is seen as the short-term manifestation of economic risk, which could be defined as the risk of the present value of a company’s expected future cash flows being affected by exchange rate movements over time. It is difficult to measure economic risk, although its effects can be described, and it is also difficult to hedge against it.
(b) The law of one price suggests that identical goods selling in different countries should sell at the same price, and that exchange rates relate these identical values. This leads on to purchasing power parity theory, which suggests that changes in exchange rates over time must reflect relative changes in inflation
26
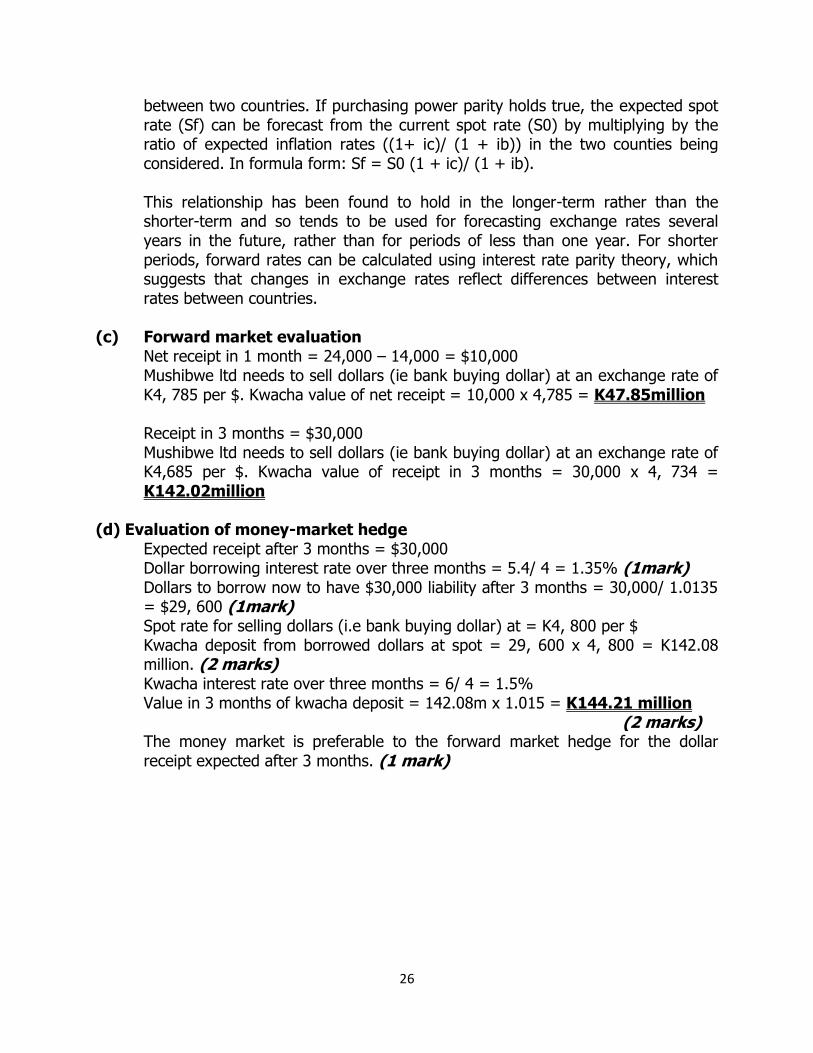
between two countries. If purchasing power parity holds true, the expected spot rate (Sf) can be forecast from the current spot rate (S0) by multiplying by the ratio of expected inflation rates ((1+ ic)/ (1 + ib)) in the two counties being considered. In formula form: Sf = S0 (1 + ic)/ (1 + ib).
This relationship has been found to hold in the longer-term rather than the shorter-term and so tends to be used for forecasting exchange rates several years in the future, rather than for periods of less than one year. For shorter periods, forward rates can be calculated using interest rate parity theory, which suggests that changes in exchange rates reflect differences between interest rates between countries.
(c) Forward market evaluation Net receipt in 1 month = 24,000 – 14,000 = $10,000
Mushibwe ltd needs to sell dollars (ie bank buying dollar) at an exchange rate of K4, 785 per $. Kwacha value of net receipt = 10,000 x 4,785 = K47.85million
Receipt in 3 months = $30,000 Mushibwe ltd needs to sell dollars (ie bank buying dollar) at an exchange rate of K4,685 per $. Kwacha value of receipt in 3 months = 30,000 x 4, 734 = K142.02million
(d) Evaluation of money-market hedge Expected receipt after 3 months = $30,000 Dollar borrowing interest rate over three months = 5.4/ 4 = 1.35% (1mark) Dollars to borrow now to have $30,000 liability after 3 months = 30,000/ 1.0135 = $29, 600 (1mark) Spot rate for selling dollars (i.e bank buying dollar) at = K4, 800 per $ Kwacha deposit from borrowed dollars at spot = 29, 600 x 4, 800 = K142.08 million. (2 marks) Kwacha interest rate over three months = 6/ 4 = 1.5% Value in 3 months of kwacha deposit = 142.08m x 1.015 = K144.21 million
(2 marks) The money market is preferable to the forward market hedge for the dollar receipt expected after 3 months. (1 mark)
27
SOLUTION SIX
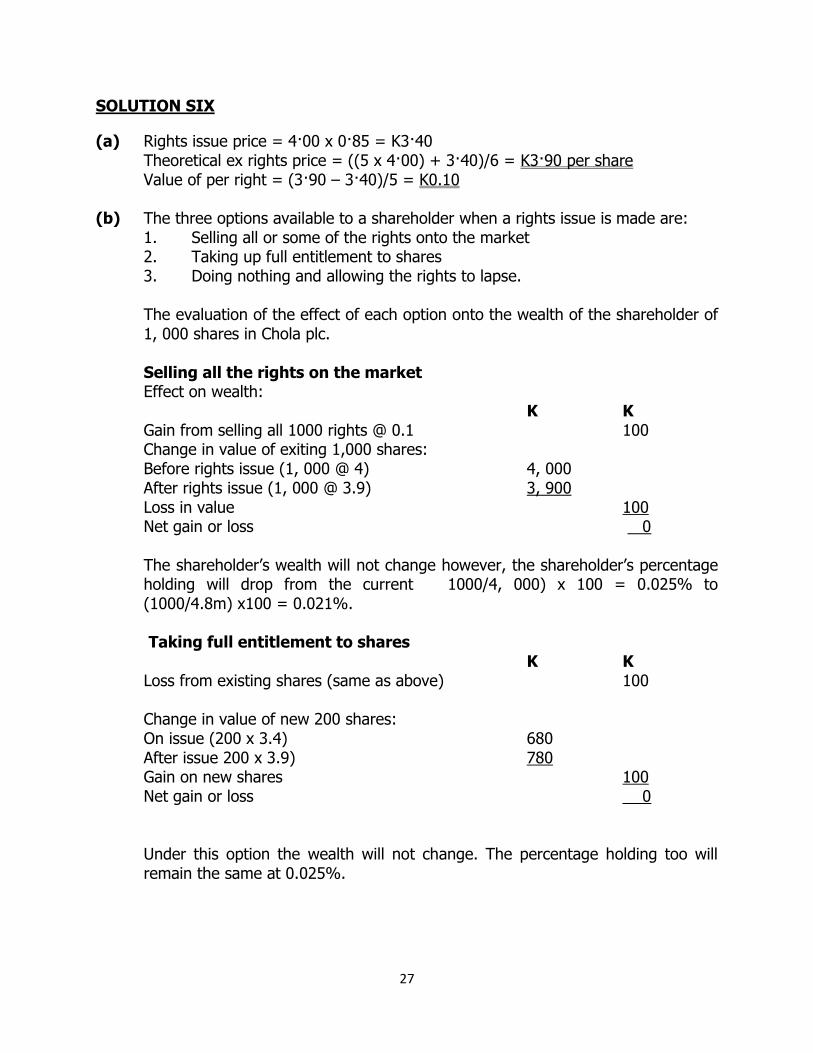
(a) Rights issue price = 4·00 x 0·85 = K3·40 Theoretical ex rights price = ((5 x 4·00) + 3·40)/6 = K3·90 per share Value of per right = (3·90 – 3·40)/5 = K0.10
(b) The three options available to a shareholder when a rights issue is made are: 1. Selling all or some of the rights onto the market 2. Taking up full entitlement to shares 3. Doing nothing and allowing the rights to lapse.
The evaluation of the effect of each option onto the wealth of the shareholder of 1, 000 shares in Chola plc. Selling all the rights on the market Effect on wealth: K K Gain from selling all 1000 rights @ 0.1 100 Change in value of exiting 1,000 shares: Before rights issue (1, 000 @ 4) 4, 000 After rights issue (1, 000 @ 3.9) 3, 900 Loss in value 100 Net gain or loss 0 The shareholder’s wealth will not change however, the shareholder’s percentage holding will drop from the current 1000/4, 000) x 100 = 0.025% to (1000/4.8m) x100 = 0.021%. Taking full entitlement to shares K K Loss from existing shares (same as above) 100
Change in value of new 200 shares: On issue (200 x 3.4) 680 After issue 200 x 3.9) 780 Gain on new shares 100 Net gain or loss 0
Under this option the wealth will not change. The percentage holding too will remain the same at 0.025%.
28
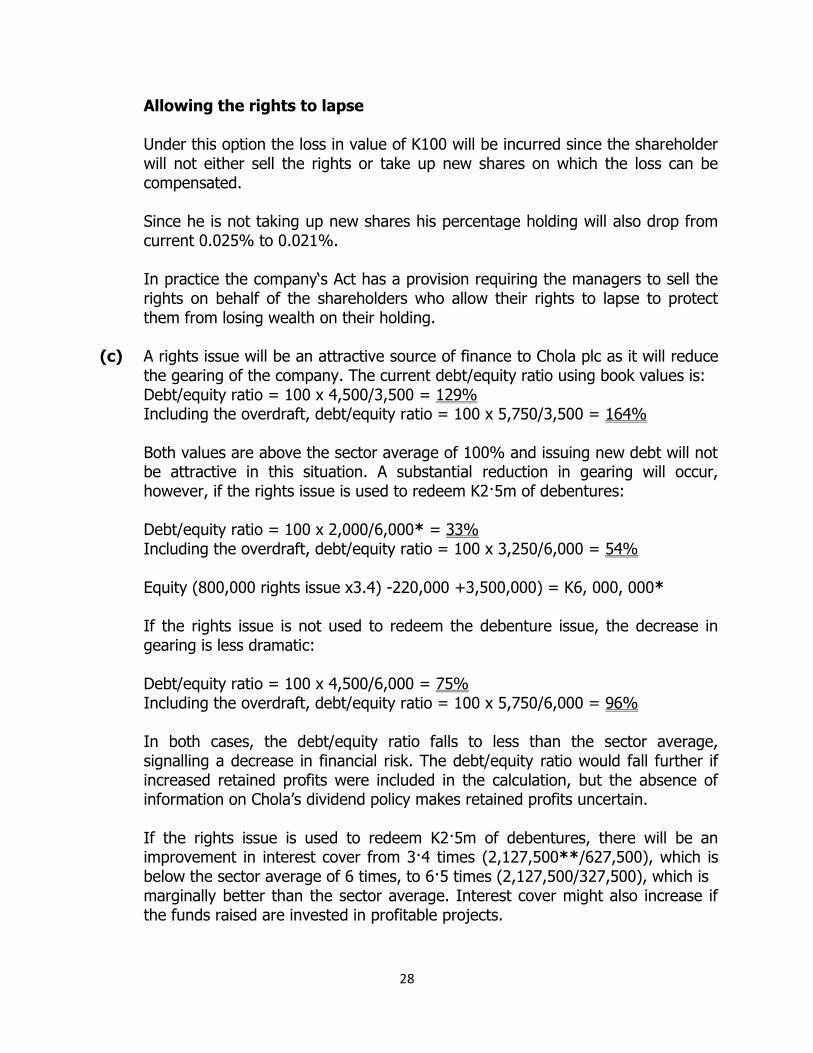
Allowing the rights to lapse Under this option the loss in value of K100 will be incurred since the shareholder will not either sell the rights or take up new shares on which the loss can be compensated. Since he is not taking up new shares his percentage holding will also drop from current 0.025% to 0.021%. In practice the company‘s Act has a provision requiring the managers to sell the rights on behalf of the shareholders who allow their rights to lapse to protect them from losing wealth on their holding.
(c) A rights issue will be an attractive source of finance to Chola plc as it will reduce the gearing of the company. The current debt/equity ratio using book values is: Debt/equity ratio = 100 x 4,500/3,500 = 129% Including the overdraft, debt/equity ratio = 100 x 5,750/3,500 = 164%
Both values are above the sector average of 100% and issuing new debt will not be attractive in this situation. A substantial reduction in gearing will occur, however, if the rights issue is used to redeem K2·5m of debentures:
Debt/equity ratio = 100 x 2,000/6,000* = 33% Including the overdraft, debt/equity ratio = 100 x 3,250/6,000 = 54% Equity (800,000 rights issue x3.4) -220,000 +3,500,000) = K6, 000, 000* If the rights issue is not used to redeem the debenture issue, the decrease in gearing is less dramatic:
Debt/equity ratio = 100 x 4,500/6,000 = 75% Including the overdraft, debt/equity ratio = 100 x 5,750/6,000 = 96%
In both cases, the debt/equity ratio falls to less than the sector average, signalling a decrease in financial risk. The debt/equity ratio would fall further if increased retained profits were included in the calculation, but the absence of information on Chola’s dividend policy makes retained profits uncertain.
If the rights issue is used to redeem K2·5m of debentures, there will be an improvement in interest cover from 3·4 times (2,127,500**/627,500), which is below the sector average of 6 times, to 6·5 times (2,127,500/327,500), which is marginally better than the sector average. Interest cover might also increase if the funds raised are invested in profitable projects.

29
A rights issue will also be attractive to Chola plc since it will make it more likely that the company can raise further debt finance in the future, possibly at a lower interest rate due to its lower financial risk. It should be noted that a decrease in gearing is likely to increase the average cost of the finance used by Chola plc, since a greater proportion of relatively more expensive equity finance will be used compared to relatively cheaper debt. This will increase the discount rate used by the company and decrease the net present value of any expected future cash flows. Workings Profit before interest and tax (PBIT) and interest charges: Current share price = K4·00 Earnings per share = 100 x (4·00/15·24) = K0.2625 Number of ordinary shares = 2m/0·5 = 4m shares Earnings of Chola = 4m x 0·2625 = K1·05m Funds raised from rights issue = 800,000 x K4·00 x 0·85 = K2, 720,000 Funds raised less issue costs = 2,720,000 – 220,000 = K2, 500,000 Debenture interest saved = 2,500,000 x 0·12 = K300, 000 Profit before tax of Chola = 1,050,000/(1 – 0·3) = £1,500,000 Current debenture interest paid = 4,500,000 x 0·12 = K540, 000 Current overdraft interest = 1,250,000 x 0·07 = K87, 500 Total interest = 540,000 + 87,500 = K627, 500 Current profit before interest and tax = 1,500,000 + 627,500 = K2, 127,500** Revised total interest = 627,500 – 300,000 = K327, 500

30