Yukon Tourism Indicators: Year-End Report 2013
9
Yukon Tourism Indicators Year-End Report 2013
description
Â
Transcript of Yukon Tourism Indicators: Year-End Report 2013
Yukon Tourism Indicators
Year-End Report 2013
Yukon Tourism Indicators Year-End Report 2013
Yukon Tourism Indicators
2
Year-End Report 2013
2013 Tourism Review 3 2013/14 Tourism Outlook 3 Border Crossing Statistics - Monthly 4 Border Crossing Statistics - 2012 versus 2013 4 Border Crossing Statistics - 10 Year Trend 5 Border Crossings by Port by Month 6 Same Day and One or more Nights Visitation 6 Border Crossing Statistics - Origin Markets 7 Erik Nielsen International Airport Passenger Traffic 7 Erik Nielsen International Airport International 8 Arrival Traffic Visitor Information Centre Statistics 9 Yukon Fuel Prices 9 U.S. Dollar Exchange Rates 9
Overview
For further information on the 2013 Yukon Visitor Statistics Year- End Report, contact: Department of Tourism and Culture Industry Services Unit Box 2703 Whitehorse, Yukon Y1A 2C6 Phone: (867) 667-8408 Fax: (867) 667-3546 Website: www.tc.gov.yk.ca
Contents
This document is intended to provide a snapshot of tourism indicators for Yukon for 2013 (January to December).
Yukon Tourism Indicators
3
Year-End Report 2013
2013 Tourism Indicators Review
Between January and December 2013, a record breaking 345,510 people crossed international borders into Yukon, according to the Canada Border Services Agency (CBSA). Compared to last year, 24,270 additional people crossed the border marking an increase of 8% over last year’s numbers. According to CBSA, the number of people crossing the border from the Unit-ed States (US) rose by 7% (up 14,617 people), Canadians from other jurisdic-tions rose by 17% (up 4,704 people) and visitors from other international destinations rose by 8% (up 2,716 people). Private vehicle and motorcoach traffic increased by 7% (up 13,476 people) and 8% (up 10,794 people), respectively. The Yukon’s seven Visitor Information Centres (VICs) reported a correspond-ing increase in visitation1. In 2013, 247,718 people were counted at seven VICs, a 2% increase over last year. Air traffic in and out of Yukon through the Erik Nielson Whitehorse Interna-tional Airport decreased in 2013. Airport figures reported a 1% decrease or 1,739 less people arriving and departing from Yukon. Total enplaning and deplaning passenger figures for 2013 was 292,598. Border crossing numbers to Yukon increased from all major regions. North American numbers increased by 7% (up 21,567 people), Europe by 3% (up 522 people), Asia/Pacific by 15% (up 2,081 people) and all others by 6% (up 100 people). Notable countries include China at 31% growth (up 437 peo-ple), Australia at 11% growth (up 690 people), Canada (excluding Yukon) at 17% growth (up 4,704 people) and US at 7% growth (up 14,617 people). [Please note that the Yukon Tourism Indicators comprise key statistics covering major aspects of the tourism industry in Yukon and relevant global trends. The aim is to provide the most recent and accurate information, but all data are subject to ongoing revisions from information suppli-ers.] Sources: Yukon Bureau of Statistics, 2013 International Monetary Fund, World Economic Outlook (October 2013) Yukon Economic Outlook http://economics.gov.yk.ca/ (September 2013) Bank of Canada. 2013. www.bankofcanada.ca/ 1 Note: This is the first year that the Airport VIC recorded visits to that Centre accounting for the
2% increase in overall VIC visits.
Tourism performance is affected by many factors including the global econo-my, socio-cultural issues and activities, and environmental issues. Below is a snapshot of issues impacting travel to Yukon in 2013 and 2014. The global economy is still recovering from the 2008 economic recession. The International Monetary Fund’s World Economic Outlook stated that global economic growth is projected to be 2.9% in 2013 and 3.6% in 2014. The ma-jority of that growth is projected to originate from emerging markets and de-veloping economies. The economies of Canada and the US are both projected to grow by 1.6% in 2013 and forecasts for 2014 suggest that increase will con-tinue. This growth in Canada’s GDP is relatively weak, indicative of high house-hold debt, which is curbing domestic consumption on discretionary purchases like travel. In 2014, the US is expected to gradually improve its economic status through increased private consumption regardless of spending restraints and cost cutting by the US Government. A similar prediction in Europe suggests that markets are stabilizing; however, reforms are still required to raise market competitiveness and to increase job creation in 2013. Notable in the interna-tional market is the slowdown of growth in China’s economy from 7.7% in 2012 to a projected 7.6% in 2013. The drop in the Canadian dollar may have contributed to the increase in visi-tors to Yukon in 2013. Americans visiting Yukon would have greater purchas-ing power thereby motivating cross border visits to Canada. Canadians may have been more inclined to vacation in their own country as opposed to vis-iting the United States where their purchasing power would be deflated. Several factors will continue to work in Yukon’s favour in 2014, including:
A lower Canadian dollar will make Yukon more affordable for US and overseas visitors;
Air North’s direct flights between Whitehorse, Yellowknife and Ottawa will improve access to the territory from eastern Canada;
The new Air North flights to Kelowna continue to have a positive impact on visitation from British Columbia; and
There is increasing demand for Aurora tourism experiences, particularly in the Japanese market.
2013/14 Tourism Outlook
Yukon Tourism Indicators
4
Year-End Report 2013
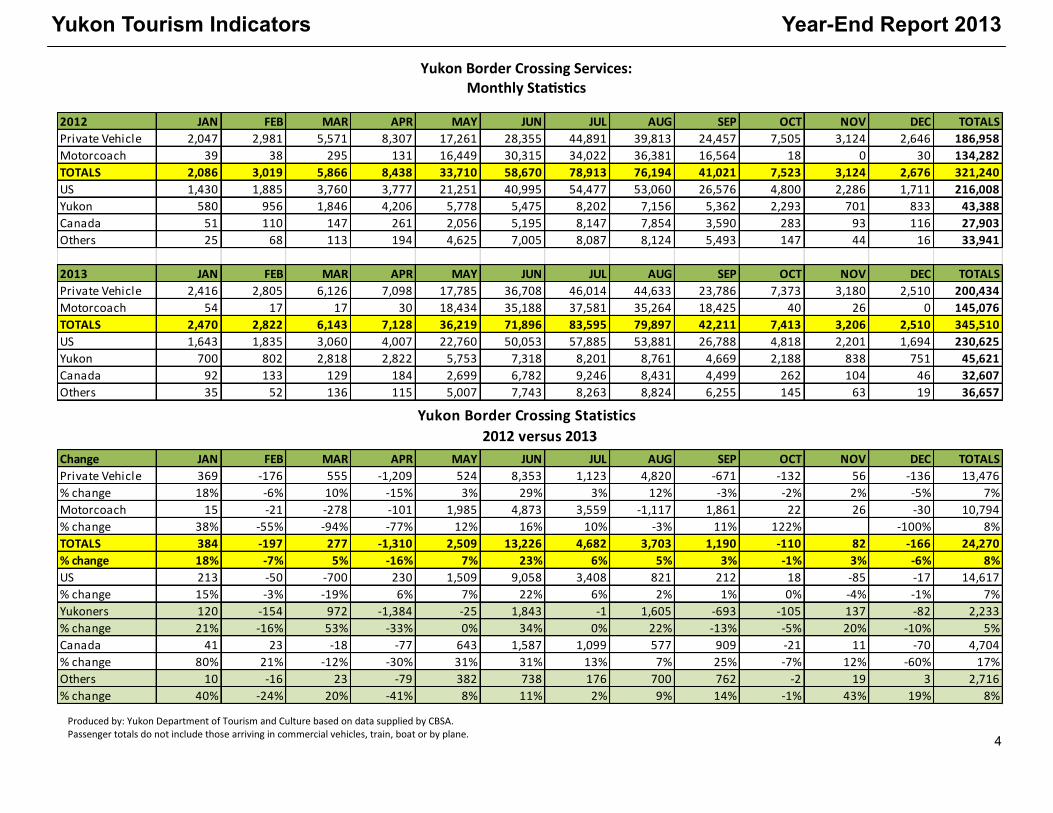
Yukon Border Crossing Services: Monthly Statistics
2012 JAN FEB MAR APR MAY JUN JUL AUG SEP OCT NOV DEC TOTALS
Private Vehicle 2,047 2,981 5,571 8,307 17,261 28,355 44,891 39,813 24,457 7,505 3,124 2,646 186,958
Motorcoach 39 38 295 131 16,449 30,315 34,022 36,381 16,564 18 0 30 134,282
TOTALS 2,086 3,019 5,866 8,438 33,710 58,670 78,913 76,194 41,021 7,523 3,124 2,676 321,240
US 1,430 1,885 3,760 3,777 21,251 40,995 54,477 53,060 26,576 4,800 2,286 1,711 216,008
Yukon 580 956 1,846 4,206 5,778 5,475 8,202 7,156 5,362 2,293 701 833 43,388
Canada 51 110 147 261 2,056 5,195 8,147 7,854 3,590 283 93 116 27,903
Others 25 68 113 194 4,625 7,005 8,087 8,124 5,493 147 44 16 33,941
2013 JAN FEB MAR APR MAY JUN JUL AUG SEP OCT NOV DEC TOTALS
Private Vehicle 2,416 2,805 6,126 7,098 17,785 36,708 46,014 44,633 23,786 7,373 3,180 2,510 200,434
Motorcoach 54 17 17 30 18,434 35,188 37,581 35,264 18,425 40 26 0 145,076
TOTALS 2,470 2,822 6,143 7,128 36,219 71,896 83,595 79,897 42,211 7,413 3,206 2,510 345,510
US 1,643 1,835 3,060 4,007 22,760 50,053 57,885 53,881 26,788 4,818 2,201 1,694 230,625
Yukon 700 802 2,818 2,822 5,753 7,318 8,201 8,761 4,669 2,188 838 751 45,621
Canada 92 133 129 184 2,699 6,782 9,246 8,431 4,499 262 104 46 32,607
Others 35 52 136 115 5,007 7,743 8,263 8,824 6,255 145 63 19 36,657
Yukon Border Crossing Statistics
2012 versus 2013
Change JAN FEB MAR APR MAY JUN JUL AUG SEP OCT NOV DEC TOTALS
Private Vehicle 369 -176 555 -1,209 524 8,353 1,123 4,820 -671 -132 56 -136 13,476
% change 18% -6% 10% -15% 3% 29% 3% 12% -3% -2% 2% -5% 7%
Motorcoach 15 -21 -278 -101 1,985 4,873 3,559 -1,117 1,861 22 26 -30 10,794
% change 38% -55% -94% -77% 12% 16% 10% -3% 11% 122% -100% 8%
TOTALS 384 -197 277 -1,310 2,509 13,226 4,682 3,703 1,190 -110 82 -166 24,270
% change 18% -7% 5% -16% 7% 23% 6% 5% 3% -1% 3% -6% 8%
US 213 -50 -700 230 1,509 9,058 3,408 821 212 18 -85 -17 14,617
% change 15% -3% -19% 6% 7% 22% 6% 2% 1% 0% -4% -1% 7%
Yukoners 120 -154 972 -1,384 -25 1,843 -1 1,605 -693 -105 137 -82 2,233
% change 21% -16% 53% -33% 0% 34% 0% 22% -13% -5% 20% -10% 5%
Canada 41 23 -18 -77 643 1,587 1,099 577 909 -21 11 -70 4,704
% change 80% 21% -12% -30% 31% 31% 13% 7% 25% -7% 12% -60% 17%
Others 10 -16 23 -79 382 738 176 700 762 -2 19 3 2,716
% change 40% -24% 20% -41% 8% 11% 2% 9% 14% -1% 43% 19% 8%
Produced by: Yukon Department of Tourism and Culture based on data supplied by CBSA. Passenger totals do not include those arriving in commercial vehicles, train, boat or by plane.
Yukon Tourism Indicators
5
Year-End Report 2013
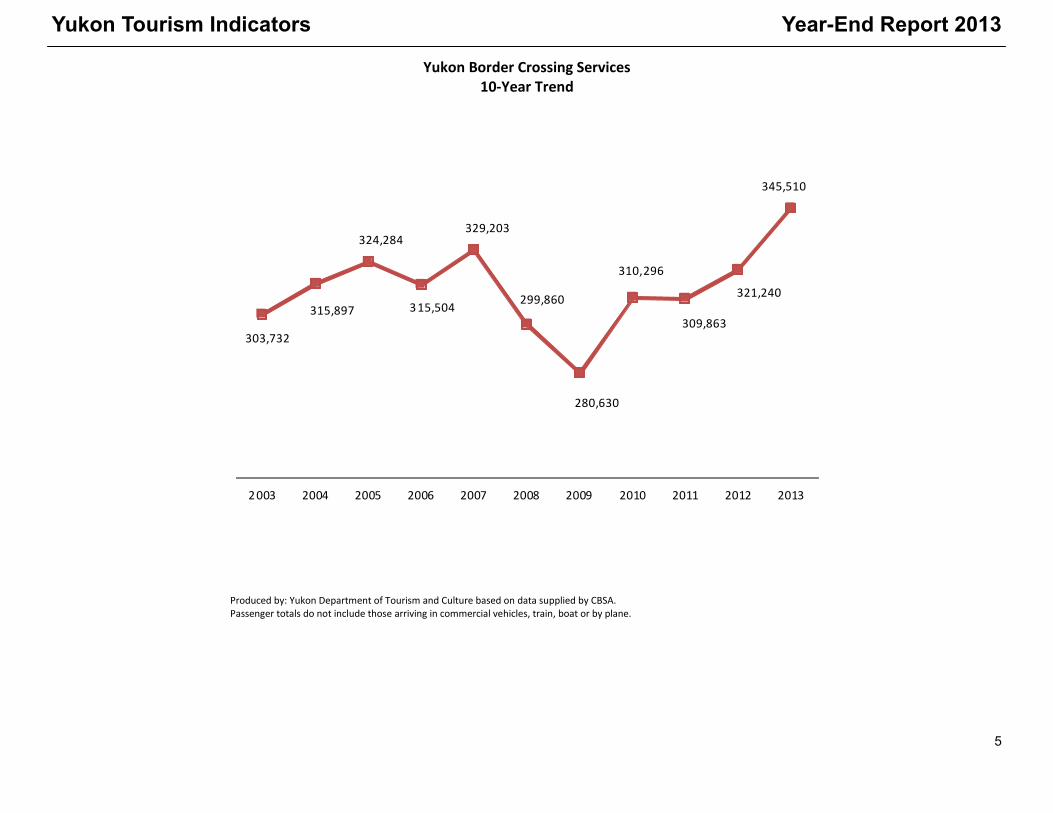
Yukon Border Crossing Services 10-Year Trend
Produced by: Yukon Department of Tourism and Culture based on data supplied by CBSA. Passenger totals do not include those arriving in commercial vehicles, train, boat or by plane.
303,732
315,897
324,284
315,504
329,203
299,860
280,630
310,296
309,863
321,240
345,510
2003 2004 2005 2006 2007 2008 2009 2010 2011 2012 2013

Yukon Tourism Indicators
6
Year-End Report 2013
Border Crossings by Port Same Day and One or more Nights Visitation
Produced by: Yukon Department of Tourism and Culture based on data supplied by CBSA. Passenger totals do not include those arriving in commercial vehicles, train, boat or by plane.
Same Day: Person came to Yukon, but did not stay overnight 1+ Nights: Person came to Yukon and stayed one or more nights Produced by: Yukon Department of Tourism and Culture based on data supplied by CBSA. Passenger totals do not include those arriving in commercial vehicles, train, boat or by plane.
Same Day 2012 2013 +/- change change %
Private Vehicle 76,685 82,843 6,158 8%
Motorcoach 118,066 128,302 10,236 9%
TOTALS 194,751 211,145 16,394 8%
US 135,716 146,232 10,516 8%
Yukon 22,123 22,719 596 3%
Canada 16,557 19,043 2,486 15%
Others 20,353 23,151 2,798 14%
Total 2012 2013 +/- change % change
Beaver Creek 67,922 66,969 -953 -1%
Fraser 209,478 234,815 25,337 12%
Little Gold 17,065 17,646 581 3%
Pleasant 26,559 25,901 -658 -2%
Dawson City 204 179 -25 -12%TOTAL 321,228 345,510 24,282 8%
1+ Nights 2012 2013 +/- change % change
Private Vehicle 107,627 115,081 7,454 7%
Motorcoach 16,186 16,774 588 4%
TOTALS 123,813 131,855 8,042 6%
US 78,581 82,699 4,118 5%
Yukon 20,432 22,151 1,719 8%
Canada 11,230 13,518 2,288 20%
Others 13,570 13,487 -83 -1%

Yukon Tourism Indicators
7
Year-End Report 2013
Yukon Border Crossing Services: Visitor Origin
Totals include all passengers arriving in and departing from Whitehorse on commercial flights (January to December, 2013).
Produced by: Yukon Department of Tourism and Culture based on data supplied by CBSA. Passenger totals do not include those arriving in commercial vehicles, train, boat or by plane. The North America category includes Yukon residents.
Erik Nielsen Whitehorse International Airport: Passenger Traffic
2012 2013 +/- change % change
Total North America 288,104 309,671 21,567 7%
Total Europe 17,348 17,870 522 3%
Total Asia / Pacific 14,095 16,176 2,081 15%
Total Other 1,693 1,793 100 6%
Grand Total 321,240 345,510 24,270 8%
Annual Yukon Border Crossing Statistics - Key Regions
2012 2013 +/- change % change
United States 216,008 230,625 14,617 7%
Canada 71,291 78,228 6,937 10%
Australia 6,306 6,996 690 11%
Germany 5,750 5,901 151 3%
United Kingdom 4,327 4,176 -151 -3%
Switzerland 2,412 2,303 -109 -5%
China 1,428 1,865 437 31%
India 1,454 1,320 -134 -9%
New Zealand 1,171 1,247 76 6%
France 938 1,068 130 14%
Annual Yukon Border Crossing Statistics - Top 10 Countries
2012 2013 +/- change % change
Enplaning 147,262 145,549 -1,713 -1%
Deplaning 147,075 147,049 -26 0%
TOTAL 294,337 292,598 -1,739 -1%
International and Domestic Passenger Traffic
Yukon Tourism Indicators
8
Year-End Report 2013
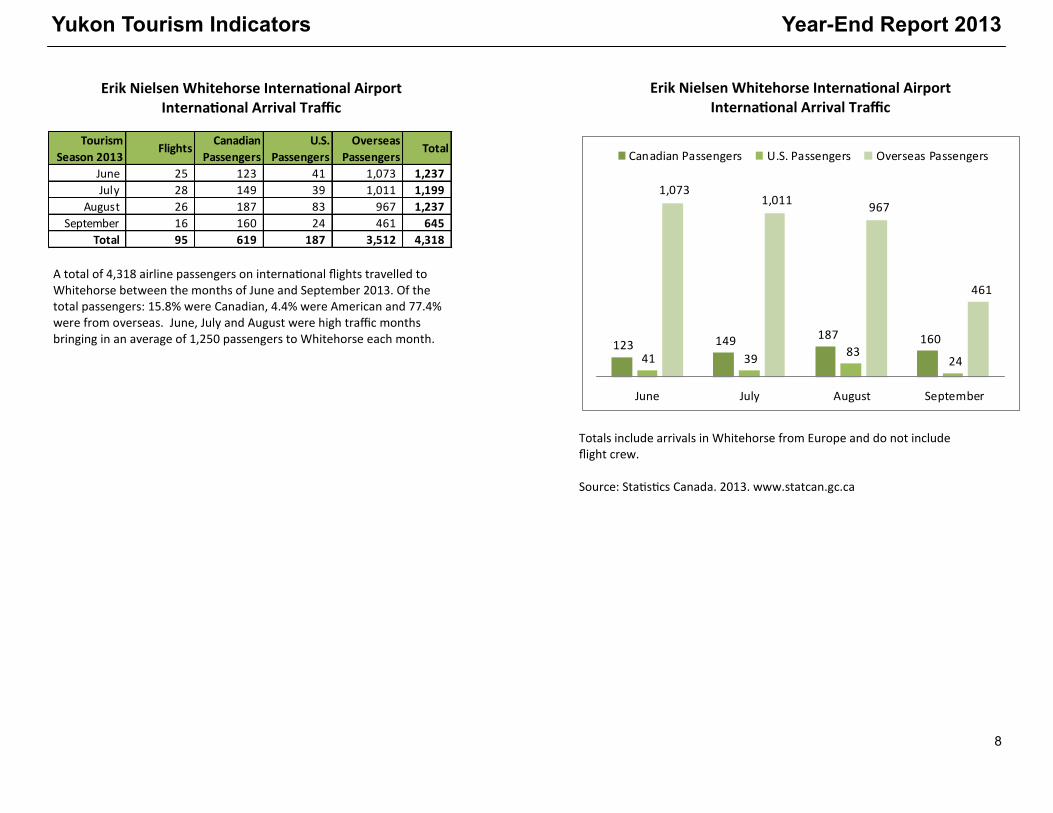
A total of 4,318 airline passengers on international flights travelled to Whitehorse between the months of June and September 2013. Of the total passengers: 15.8% were Canadian, 4.4% were American and 77.4% were from overseas. June, July and August were high traffic months bringing in an average of 1,250 passengers to Whitehorse each month.
Totals include arrivals in Whitehorse from Europe and do not include flight crew. Source: Statistics Canada. 2013. www.statcan.gc.ca
Erik Nielsen Whitehorse International Airport International Arrival Traffic
Erik Nielsen Whitehorse International Airport International Arrival Traffic
Tourism
Season 2013Flights
Canadian
Passengers
U.S.
Passengers
Overseas
PassengersTotal
June 25 123 41 1,073 1,237
July 28 149 39 1,011 1,199
August 26 187 83 967 1,237
September 16 160 24 461 645
Total 95 619 187 3,512 4,318
123 149 187 160
41 39 83
24
1,073 1,011
967
461
June July August September
Canadian Passengers U.S. Passengers Overseas Passengers
Yukon Tourism Indicators
9
Year-End Report 2013
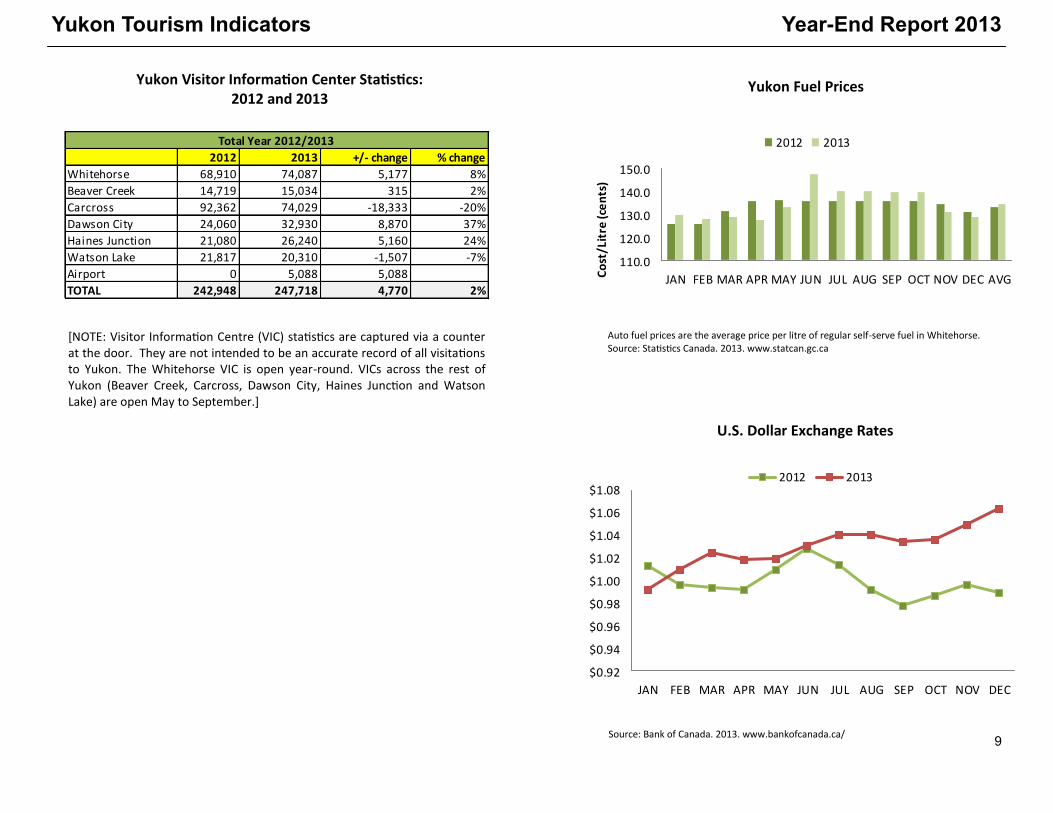
[NOTE: Visitor Information Centre (VIC) statistics are captured via a counter at the door. They are not intended to be an accurate record of all visitations to Yukon. The Whitehorse VIC is open year-round. VICs across the rest of Yukon (Beaver Creek, Carcross, Dawson City, Haines Junction and Watson Lake) are open May to September.]
Yukon Visitor Information Center Statistics: 2012 and 2013
2012 2013 +/- change % change
Whitehorse 68,910 74,087 5,177 8%
Beaver Creek 14,719 15,034 315 2%
Carcross 92,362 74,029 -18,333 -20%
Dawson City 24,060 32,930 8,870 37%
Haines Junction 21,080 26,240 5,160 24%
Watson Lake 21,817 20,310 -1,507 -7%
Airport 0 5,088 5,088
TOTAL 242,948 247,718 4,770 2%
Total Year 2012/2013
Auto fuel prices are the average price per litre of regular self-serve fuel in Whitehorse. Source: Statistics Canada. 2013. www.statcan.gc.ca
Yukon Fuel Prices
Source: Bank of Canada. 2013. www.bankofcanada.ca/
U.S. Dollar Exchange Rates
110.0
120.0
130.0
140.0
150.0
JAN FEB MAR APR MAY JUN JUL AUG SEP OCT NOV DEC AVGCo
st/L
itre
(ce
nts
)
2012 2013
$0.92
$0.94
$0.96
$0.98
$1.00
$1.02
$1.04
$1.06
$1.08
JAN FEB MAR APR MAY JUN JUL AUG SEP OCT NOV DEC
2012 2013