Yukon River Coho Salmon Genetics Report › ... › fish › Technical_Reports ›...
22
Yukon River Coho Salmon Genetics Alaska Fisheries Technical Report Number 93 Conservation Genetics Laboratory October 2006 U.S. Fish and Wildlife Service
Transcript of Yukon River Coho Salmon Genetics Report › ... › fish › Technical_Reports ›...
Yukon River Coho Salmon GeneticsAlaska Fisheries Technical Report Number 93
Conservation Genetics LaboratoryOctober 2006
U.S. Fish and Wildlife Service
The Alaska Region Fisheries Program of the U.S. Fish and Wildlife Service conducts fi sheries monitoring and population assessment studies throughout many areas of Alaska. Dedicated professional staff located in Anchorage, Juneau, Fairbanks, Kenai, and King Salmon Fish and Wildlife Offi ces and the Anchorage Conservation Genetics Laboratory serve as the core of the Program’s fi sheries management study efforts. Administrative and technical support is provided by staff in the Anchorage Regional Offi ce. Our program works closely with the Alaska Depart-ment of Fish and Game and other partners to conserve and restore Alaska’s fi sh populations and aquatic habitats. Additional information about the Fisheries Program and work conducted by our fi eld offi ces can be obtained at:
http://alaska.fws.gov/fi sheries/index.htm
The Alaska Region Fisheries Program reports its study fi ndings through two regional publication series. The Alaska Fisheries Data Series was established to provide timely dissemination of data to local managers and for inclusion in agency databases. The Alaska Fisheries Techni-cal Reports publishes scientifi c fi ndings from single and multi-year studies that have undergone more extensive peer review and statistical testing. Additionally, some study results are published in a variety of professional fi sheries journals.
Disclaimer: The use of trade names of commercial products in this report does not constitute endorsement or recommendation for use by the federal government.
1
Alaska Fisheries Technical Report Number 93. October 2006U.S. Fish and Wildlife Service
Yukon River Coho Salmon Genetics
Blair Flannery1, Lynsey Luiten1, and John Wenburg1
Abstract
Here we examine the extent and pattern of genetic diversity in Yukon River coho salmon by assaying eight microsatellite loci. Yukon River coho salmon are geographically structured (GST=0.103), with a strong genetic disjunction between lower and upper river populations. Upper river populations have much lower levels of genetic diversity in comparison to the lower river popu-lations and to other populations from around Alaska. This defi cit is likely the result of a founder or bottleneck effect. Mixed-stock analysis using microsat-ellite variation assayed here can accurately (95%–99%) and precisely (S.D. 1%–3%) allocate coho salmon in mixtures to regions providing data that can increase the knowledge base and ability to actively manage Yukon River coho salmon. Finer geographic scale management may be possible by increasing baseline sample sizes, improving baseline representation, and, if necessary, assaying additional diverse loci.
Introduction
Implicit in fi sheries management is a thorough knowledge of the biology of the species be-ing harvested. Most Pacifi c salmon (Oncorhynchus spp.) are harvested when populations are mixed together, which creates problems for fi sheries managers who attempt to achieve sustained yields by balancing harvest and escapement across populations. Knowledge of the population composition in many fi sheries is imprecise and not directly measured. If exploi-tation is signifi cant, then harvest without accounting for genetic consequences can change population parameters through differential harvest within and among populations and result in lost genetic diversity and decreased production (Allendorf et al. 1987). Long term sus-tained yield, ultimately the goal of fi shery management, can only be accomplished through conservation of genetic resources to maintain diversity and a population’s adaptive potential in the face of a fl uctuating environment (Altukhov and Salmenkova 1987; Nelson and Soule 1987). To bring about effective conservation, the population structure and productivity of the species must be known in order to regulate fi sheries to allow optimum escapement of each population. This is a diffi cult proposition, given the multi-population nature of the fi sheries, but one that is possible with genetic mixed-stock analysis (MSA; Pella and Milner 1987).
Coho salmon are distributed in North America from Monterey, California to Point Hope, Alaska and in Asia from North Korea to the Anadyr River in Russia (Sandercock 1991). Like all Pacifi c salmon, coho salmon are anadromous, philopatric, and spawn semelparously. Fry
Authors: 1 USFWS, Conservation Genetics Laboratory, 1011 E. Tudor Rd., Anchorage, Alaska 99503, U.S.A.
2
Alaska Fisheries Technical Report Number 93. October 2006U.S. Fish and Wildlife Service
emerge in the spring and spend one to two years in freshwater before migrating to saltwa-ter to mature, with the majority of coho salmon returning to spawn at age three. Most coho salmon spawn in coastal streams after short upstream migrations, but in large rivers they are known to migrate extensively, which has led to two migratory phenotypes, coastal and interior. The coastal type has a larger body and fi ns while the interior type has a fusiform shape that is more effi cient for long distance swimming. Although coho salmon do not have the broadest distribution, they exhibit a wide variety of life histories, which enables them to occupy the most variable spawning habitat of all salmon. Many small streams throughout the range support coho salmon. For example, within Southeast Alaska there are 5,000 known salmon streams, and coho salmon are in 4,000 of them, the most of all the salmon species, whereas Chinook salmon are in only 200 of the streams (Halupka et al. 2003). Colonizing marginal habitats can be risky and precludes many of the populations from attaining large census size, but the ability to adapt to and colonize new habitats, such as found in Glacier Bay, Alaska (Milner et al. 2000), and the shear number of streams that coho salmon occupy appears to be a strategy to offset risk.
Coho salmon spawn throughout the Yukon River drainage, with major known concentra-tions located in the Tanana River (McBride et al. 1983), but generally little is known about their distribution and abundance. Only the Delta Clearwater River, a tributary of the Tanana River, has an escapement goal, and limited monitoring is conducted on the East Fork of the Andreafsky River and at Pilot Station Sonar. Coho salmon begin entering the Yukon River in late July to early August and continue well into autumn, largely coinciding with fall chum salmon. The similar run timing of coho and fall chum salmon complicates their manage-ment. The run size and subsistence demand for fall chum salmon is greater than coho salmon. Consequently, management focus is placed on fall chum salmon, and coho salmon are largely unmanaged and mostly taken as bycatch (Bue 2004), potentially subjecting coho salmon to differential harvest rates. Furthermore, with the recent declines in chum and Chinook salmon resulting in fi shing closures and restrictions, demand for coho salmon is increasing (Geiger et al. 1995), and managers are attempting to target coho salmon through selective gear, location, and timing (Bue 2002). As subsistence users fail to meet their needs with chum and Chinook salmon, more and more individuals will take the opportunity to fi sh coho salmon. The current lack of escapement, run timing, and population structure data for coho salmon in the face of increased pressure is problematic.
Coho salmon exhibit little genetic diversity and population structure at many allozyme loci (Utter et al. 1980; Reisenbichler and Phelps 1987; Wehrhahn and Powell 1987; Bartley et al. 1992), but direct DNA surveys (e.g. microsatellites) reveal that coho salmon are quite diverse and divergent (Small et al. 1998; Beacham et al. 2001; Olsen et al. 2003, 2004). While our understanding of coho salmon genetics is growing, little is known specifi cally about the genetic structure of Yukon River coho salmon. Recent genetic studies (Gharrett et al. 2001; Smith et al. 2001; Olsen et al. 2003, 2004) have analyzed limited samples of Yukon River coho salmon. Most of these studies (Gharrett et al. 2001; Smith et al. 2001; and Olsen et al. 2003) were focused on large scale phylogeography and population structure for Alaskan and Pacifi c Northwest coho salmon and only included one or two populations from the Yukon River. The study by Olsen et al. (2004) focused on the impacts of potential habitat degrada-tion from a gold mine on coho salmon by analyzing samples from two tributaries within each
3
Alaska Fisheries Technical Report Number 93. October 2006U.S. Fish and Wildlife Service
of the Innoko (lower Yukon River) and Tanana Rivers (upper Yukon River). Their fi ndings in-dicate that coho salmon populations are highly divergent on a small geographic scale and that there is a spatial trend in the levels of genetic diversity, with greater intrapopulation genetic diversity within coho salmon from the Innoko River. Low levels of genetic diversity were also observed within coho salmon from the Tanana River as compared to coho salmon from outside the Yukon River (Gharrett et al. 2001; Olsen et al. 2003), a founder effect or bottle-neck in the middle Yukon River populations may be an explanation (Olsen et al. 2004). These results suggest that lower Yukon River coho salmon contain a large component of the overall genetic diversity, and that populations are generally small with little gene fl ow occurring among them (Olsen et al. 2004), which can exacerbate the harmful effects of an unmanaged harvest. Such a contrast in genetic diversity and apparent fi ne scale population structure em-phasizes the need for a more thorough investigation to better understand the genetic structure of Yukon River coho salmon.
In this study, we assay variation at eight microsatellite loci to: 1) evaluate patterns of genetic diversity within and among 11 putative coho salmon populations distributed throughout the Yukon River drainage; and 2) provide preliminary estimates of the power of genetic data for use in various mixed-stock analyses (MSA) of Yukon River coho salmon.
Methods
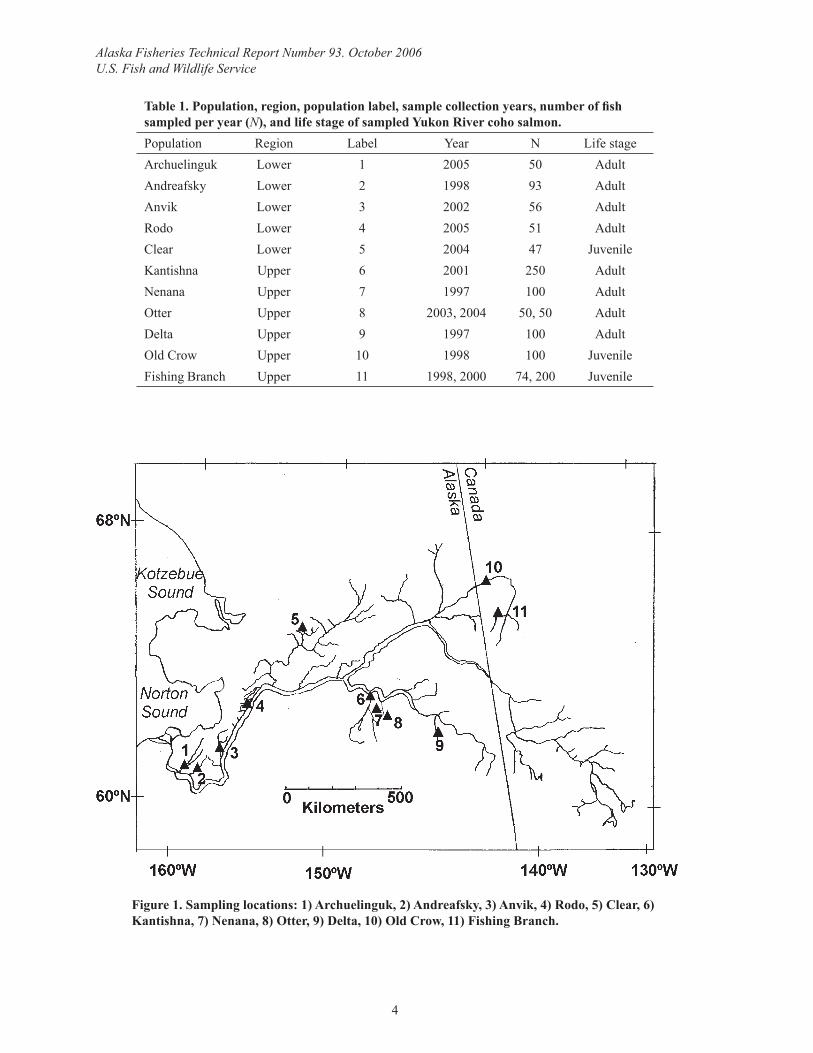
Sample collectionFin clips were collected from 11 putative coho salmon populations within the Yukon River (Table 1, Figure 1). The following collections were performed by seine netting adult coho salmon on their spawning grounds over a one to two week time period: Archuelinguk, Anvik, Rodo, Kantishna, Nenana, Otter, and Delta. The Andreafsky collection of adult coho salmon occurred at the weir located on the east fork over a two week period. Due to a lack of knowl-edge of spawning ground location or to inclement weather during spawning, juvenile coho salmon were collected at three locations (Clear, Old Crow, and Fishing Branch) by setting minnow traps over a large spatial area (>>100 meters) for a one to two month period as rec-ommended by Hansen et al. (1997).
Genetic analysisTotal genomic DNA was extracted from the tissue (~25mg) using proteinase K with the Dneasy™ DNA isolation kit (Qiagen Inc., Valencia, CA). Concentrations of DNA were quanti-fi ed by fl uorometry and diluted to 50 ng/μl. The following micosatellite loci were assayed for genetic variation: Oke-2, -3, -4 (Buchholz et al. 2001); Oki-1, -3, -11 (Smith et al. 1998); One-3 (Scribner et al. 1996); and Ots-105 (Nelson 1998). Polymerase Chain Reaction (PCR) DNA amplifi cation was done in 10 μl volumes; general conditions were: 2.5 mM MgCl2, 1X PCR buffer (20 mM Tris-HCL pH 8.0, 50 mM KCL), 250 μM for each dNTP, 0.03μM fl uores-cently labeled forward primer, 0.37 μM unlabeled forward primer, 0.40 μM unlabeled reverse primer, 0.008 units Taq polymerase, and 1 μl of DNA (50ng/μl). PCR was carried out in an MJResearch DNA Engine® thermal cycler. Standard thermal cycling conditions were: initial denaturation cycle of 92°C for 2 minutes, followed by 92°C for 15 seconds, 50–62°C for 15 seconds (range of locus-specifi c annealing temperatures), and 72°C for 30 seconds, with a fi -nal single cycle of 72°C for 10 minutes. The PCR product was mixed in equal parts with load-
4
Alaska Fisheries Technical Report Number 93. October 2006U.S. Fish and Wildlife Service
Table 1. Population, region, population label, sample collection years, number of fi sh sampled per year (N), and life stage of sampled Yukon River coho salmon.Population Region Label Year N Life stageArchuelinguk Lower 1 2005 50 AdultAndreafsky Lower 2 1998 93 AdultAnvik Lower 3 2002 56 AdultRodo Lower 4 2005 51 AdultClear Lower 5 2004 47 JuvenileKantishna Upper 6 2001 250 AdultNenana Upper 7 1997 100 AdultOtter Upper 8 2003, 2004 50, 50 AdultDelta Upper 9 1997 100 AdultOld Crow Upper 10 1998 100 JuvenileFishing Branch Upper 11 1998, 2000 74, 200 Juvenile
Figure 1. Sampling locations: 1) Archuelinguk, 2) Andreafsky, 3) Anvik, 4) Rodo, 5) Clear, 6) Kantishna, 7) Nenana, 8) Otter, 9) Delta, 10) Old Crow, 11) Fishing Branch.
5
Alaska Fisheries Technical Report Number 93. October 2006U.S. Fish and Wildlife Service
ing dye (98% formamide, 10mM EDTA, 2 mg/ml Orange G), placed on a 92°C heating block for two minutes, and then one μl of this mixture was electrophoresed and visualized on a denaturing 6% polyacrylamide gel (19:1 acrylamide:bisacrylamide) using a Li-Cor IR2® DNA scanner. The sizes of bands were estimated and scored by the computer program Saga GT ver 3.0 (Li-Cor, Lincoln, NE). Li-Cor size standards (50bp–350bp) and allele ladders were run every sixteen lanes to ensure consistency of allele scores. All scores were verifi ed by visual inspection. Alleles were scored by two independent researchers, with any discrepancies being resolved by re-running the samples in question and repeating the double scoring process until scores matched.
Data analysisIntrapopulation genetic diversity—Hardy-Weinberg and gametic phase equilibrium were analyzed for each population using the program BIOSYS-2 (Swofford and Selander 1981) and LINKDIS (Black and Krafsur 1985), respectively. Juvenile samples were analyzed for relatedness using the Queller and Goodnight (1989) method implemented in the program IDENTIX (Belkhir et al. 2002). These tests were done to determine if the samples repre-sent randomly mating, Mendelian populations. Signifi cant tests of disequilibrium (P<0.05) were compared to binomial expectations to determine if chance alone explained the results (Apostal et al. 1996). In addition, BIOSYS-2 calculated the percentage of polymorphic loci at the 95% criterion and expected and observed heterozygosity for the populations. The pro-gram FSTAT 2.9.3 (Goudet 1995) was used to calculate estimates of allelic richness for loci and populations and expected and observed heterozygosity for loci. The program POPGENE 1.32 (Yeh and Boyle 1997) was used to estimate the effective number of alleles. The diversity values for populations from the lower and upper regions of the Yukon River were tested for statistical differences by a one-tailed Mann-Whitney test.
Interpopulation genetic diversity—Using PHYLIP 3.57 (Felsenstein 1993), population pair-wise chord (CSE) distances (Cavalli-Sforza and Edwards 1967) were calculated from allele frequencies wherefrom a neighbor-joining (Saitou and Nei 1987) dendrogram was construct-ed by MEGA 2.1 (Kumar et al. 2001) to evaluate the spatial pattern of the genetic variation. To determine if the data conform to the isolation by distance model (IBD) (Wright 1943), population pairwise matrices of genetic distance (FST), estimated by the program GENEPOP 3.4 (Raymond and Rousset 1995), and geographical distance (river miles) were analyzed by standard linear regression and lowess smoothing. The Mantel test (Mantel 1967), performed in GENEPOP 3.4 with 10,000 randomizations, determined if the two matrices were signifi -cantly correlated.
The data were analyzed hierarchically, based on the population structure depicted in the neighbor-joining dendrogram and on geographic units currently used in fi sheries manage-ment, by means of log-likelihood ratio, gene diversity, and mixed-stock analyses.
Homogeneity among populations, among populations within regions, and between regions was examined by log-likelihood ratio tests of allelic frequencies (Sokal and Rohlf 1995). Pooling of neighboring alleles occurred when expected overall values were less than three (Sokal and Rohlf 1995). An approximate F-statistic was used to contrast heterogeneity in the hierarchy (Smouse and Ward 1978). In cases where the same hypothesis was tested multiple
6
Alaska Fisheries Technical Report Number 93. October 2006U.S. Fish and Wildlife Service
times, the alpha was corrected to maintain a type I error rate of 0.05 (Cooper 1968). Ad-ditional population pairwise tests of allelic frequency homogeneity were conducted using a Markov chain Monte carlo exact procedure in GENEPOP 3.4.
The relative magnitude of genetic variation resulting from population heterogeneity was assigned to the different hierarchical levels through GST-statistics (Chakraborty and Leimar 1987; Nei and Chesser 1983). The hierarchical log-likelihood ratio tests determined whether the GST-statistics were signifi cantly different from zero (Chakraborty and Leimar 1987). In terms of a hierarchical island model at equilibrium, GST-statistics were used to indirectly esti-mate gene fl ow (Nem) (Zhivotovsky et al. 1994).
Mixed-stock analysis simulations—The ability of the baseline to correctly apportion mix-tures was tested with the program SPAM 3.7 (Debevec et al. 2000), using a Bayesian method (Rananala and Mountain 1997) to estimate allele frequencies. Parametric bootstrap resam-pling was used to simulate 1000 artifi cial mixtures (N=400) for each population based on that population’s allele frequencies and assumptions of Hardy-Weinberg and gametic phase equi-librium. These 100% mixtures were subjected to conditional maximum likelihood MSA, with parametric bootstrapping of the baseline, to estimate mean allocation and precision. Regional 100% simulations were also performed with equal contribution from populations within the region. For perfect baseline performance, the mean contribution estimate for each population or region would approximate 100%; estimates of approximately 90% were considered robust for mixture analysis (Seeb and Crane 1999). Recently, Alaska members of the Joint Technical Committee, which advises the Yukon River Panel in implementing the Pacifi c Salmon Treaty, established lower Yukon River and Tanana River geographic management units. Thus, simu-lations were performed to refl ect the current management strategy, which required separating the upper region populations into Tanana and Porcupine River components.
Comparison with coho salmon from around Alaska—Data from the present study were com-bined with data collected at the same loci for coho salmon from around Alaska (Olsen et al. 2003). Using the previously mentioned programs, estimates of heterozygosity, percent poly-morphic loci, allelic richness, and effective number of alleles were calculated for the popula-tions and averaged for populations representing eight geographic regions. A neighbor-joining dendrogram was constructed from CSE distances.
Results
Intrapopulation genetic diversityHardy Weinburg and gametic phase disequilibrium (P<0.05) were observed in 4 of 88 and 18 of 308 tests, respectively. These numbers were consistent with a type I error rate of 5% and with binomial expectations. Therefore, the loci and populations were judged to be in equi-librium. The mean estimates of pairwise relatedness among juvenile samples from the Clear, Old Crow and Fishing Branch populations were -0.049, -0.003, and -0.020, respectively. These values were not signifi cant (P>0.05, 1000 permutations) and indicated that the samples were not related.
Allele numbers for the loci ranged from two to eight, whereas allelic richness and expected heterozygosity ranged from 1.4 to 5.1 and 0.023 to 0.678, respectively; only Oke4 was not

7
Alaska Fisheries Technical Report Number 93. October 2006U.S. Fish and Wildlife Service
Table 2. Across populations for each locus: number of alleles, allelic richness (AR), effective number of alleles (AE), expected heterozygosity (HE), observed heterozygosity (HO), and GST.
Locus Alleles AR AE HE HO GST
Oke2 3 1.9 1.2 0.120 0.137 0.151Oke3 8 4.4 2.1 0.476 0.459 0.066Oke4 2 1.4 1.0 0.023 0.024 0.021Oki1 8 5.1 3.2 0.678 0.674 0.082Oki3 3 2.1 1.6 0.356 0.306 0.269Oki11 3 2.0 1.2 0.169 0.149 0.048One3 6 4.1 2.6 0.600 0.607 0.036Ots105 2 1.9 1.2 0.117 0.121 0.098
Table 3. Across loci for each population: mean sample size (N), percentage polymor-phic loci at the 95% criterion (%P), allelic richness (AR), effective number of alleles (AE), expected heterozygosity (HE), and observed heterozygosity (HO).
Population N %P AR AE HE HO
Archuelinguk 42 87.5 3.1 2.0 0.402 0.396Andreafsky 90 87.5 3.0 2.1 0.411 0.407Anvik 53 87.5 3.1 2.0 0.427 0.407Rodo 50 87.5 3.1 2.0 0.398 0.387Clear 39 87.5 2.9 2.0 0.405 0.413Kantishna 243 50.0 2.3 1.5 0.245 0.237Nenana 85 62.5 2.6 1.7 0.282 0.258Otter 97 62.5 2.5 1.6 0.270 0.258Delta 95 62.5 2.3 1.5 0.243 0.245Old Crow 96 50.0 2.4 1.4 0.209 0.197Fishing Branch 254 50.0 2.2 1.4 0.201 0.199
polymorphic at the 95% criterion (Table 2). Diversity values varied among the populations (Table 3). Lower Yukon River populations had signifi cantly higher levels of diversity (U=30, P<0.01).
Interpopulation genetic diversityA major subdivision between lower and upper Yukon River coho salmon was revealed from neighbor-joining analysis (Figure 2). Mean CSE and FST distances within subdivisions were 0.02 and 0.03 whereas estimates between subdivisions were 0.08 and 0.16, respectively. Fur-ther structure within these major subdivisions was suggested by the branching of the Clear, Old Crow, and Fishing Branch populations from others in their respective groups. The ge-

8
Alaska Fisheries Technical Report Number 93. October 2006U.S. Fish and Wildlife Service
Fishing Branch 11 Old Crow 10
Kantishna 6 Delta 9
Nenana 7 Otter 8
Rodo 4 Archuelinguk 1
Clear 5 Andreafsky 2
Anvik 3
0.01
Figure 2. Neighbor-joining dendrogram of CSE distances among 11 Yukon River coho salmon populations.
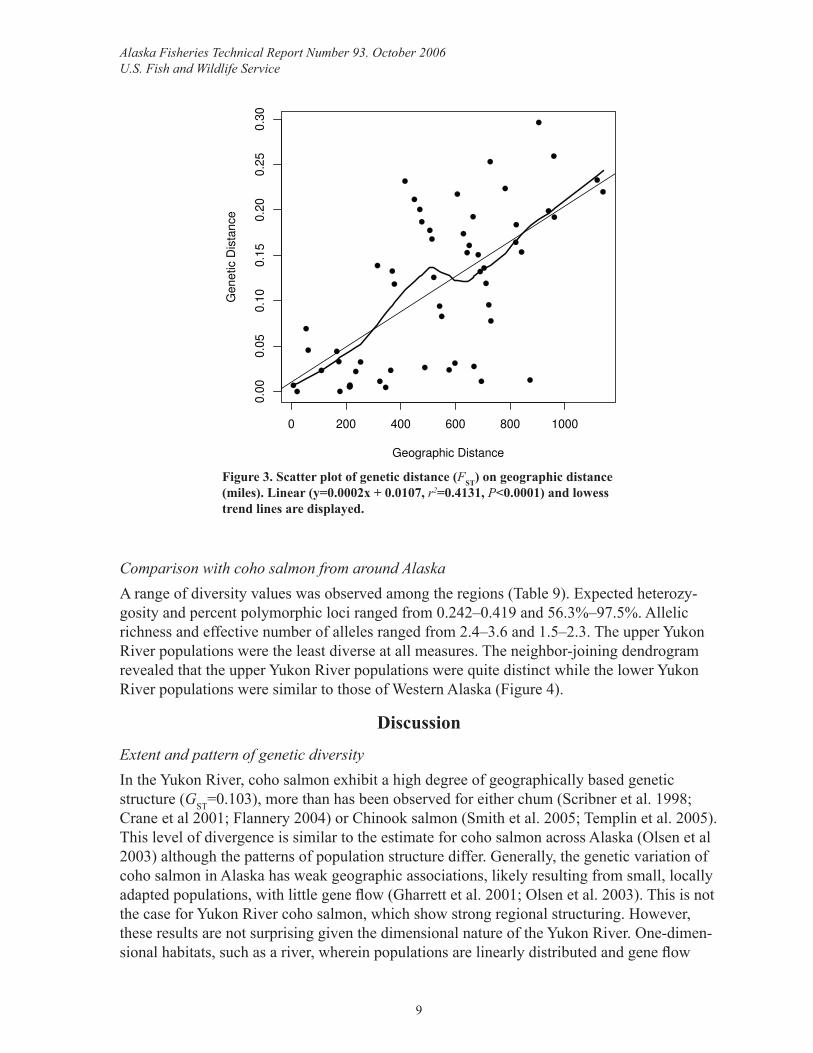
netic variation followed an IBD model (P<0.0001, Figure 3). Geographic distance explained 41.3% of the genetic variation among populations.
The populations exhibited genetic heterogeneity (P<0.00001) within and between regions as measured by differences in allelic frequencies (Table 4). Due to low cell counts, Oke4 was dropped from the analysis. The between regions component accounted for approximately 19 times more heterogeneity than within regions (F12,108=18.6, P<0.00001). The upper region exhibited approximately four times the heterogeneity (F60,48=3.9, P<0.00001) than the lower region. Populations within the lower and upper regions were heterogeneous at two and six individual loci, respectively. Of the 55 pairwise tests of allelic frequency homogeneity, 49 were signifi cant (Table 5).
Individuals varying within populations accounted for 89.7% of the gene diversity while vari-ation among populations accounted for 10.3% (Table 6). Most of the diversity among popula-tions resulted from regional divergence (8.1%), with the balance (2.2%) due to divergence within regions. Log-likelihood ratio analysis rejected the null hypothesis (P<0.00001) that these gene diversity estimates equaled zero. The effective number of migrants per generation (Nem) was 2.2 overall, 0.7 between regions, and 11.2 within regions.
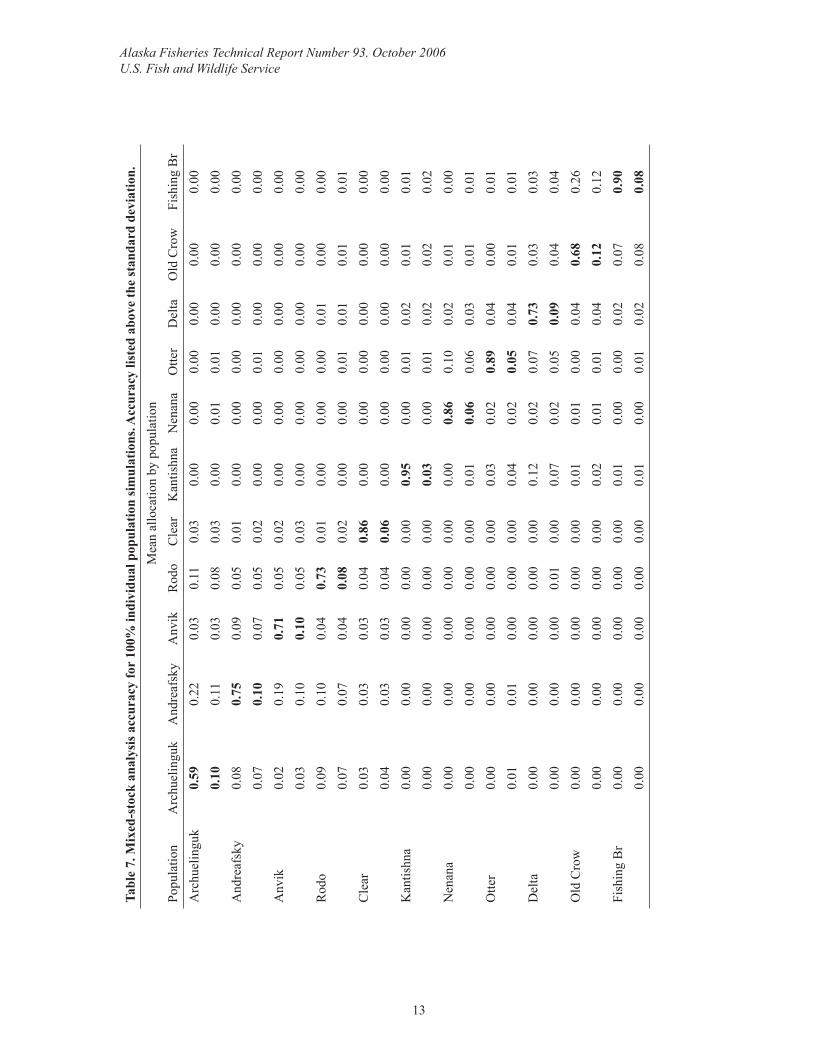
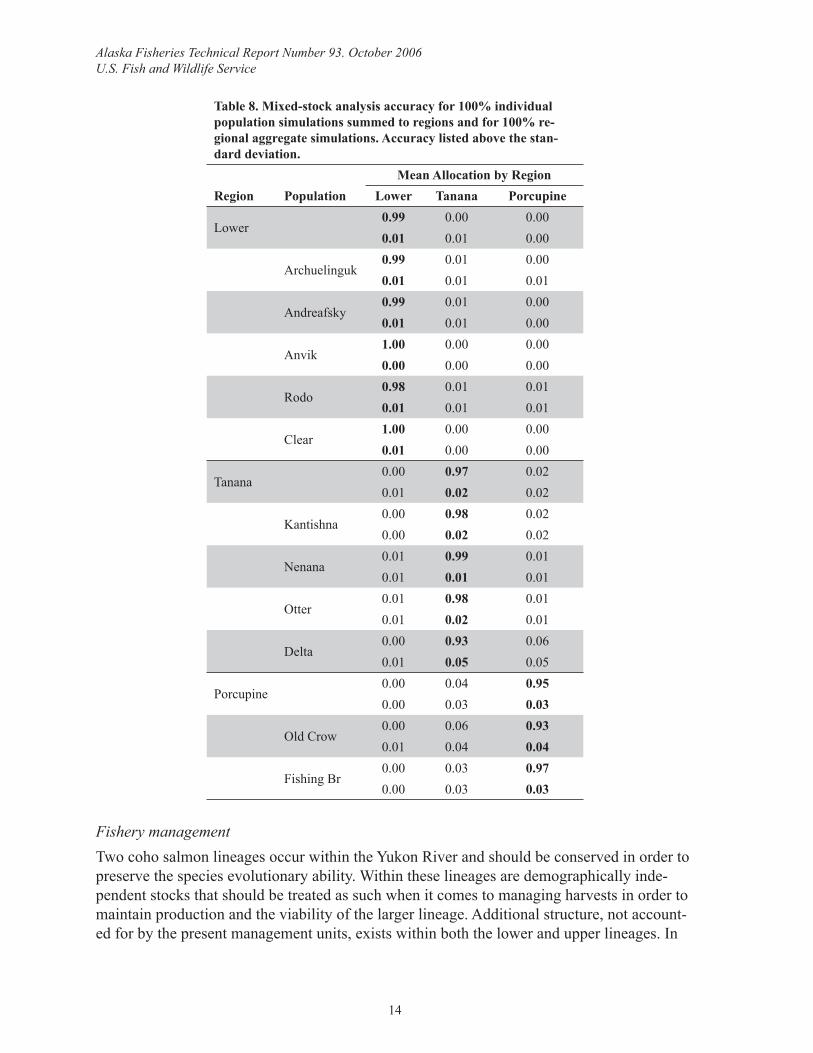
Mixed-stock analysis simulationsThe individual population MSA simulation accuracies ranged from 59%–95%, only alloca-tions to Kantishna, and Fishing Branch were ≥90% accurate although Clear, Nenana, and Ot-ter were close, ranging from 86%–89% (Table 7). Misallocation was generally to geographi-cally proximate populations. Improvement in MSA accuracy and precision occurred when estimates for individual populations were summed to region, and when simulations were performed on regional aggregates (Table 8).
9
Alaska Fisheries Technical Report Number 93. October 2006U.S. Fish and Wildlife Service
Figure 3. Scatter plot of genetic distance (FST) on geographic distance (miles). Linear (y=0.0002x + 0.0107, r2=0.4131, P<0.0001) and lowess trend lines are displayed.
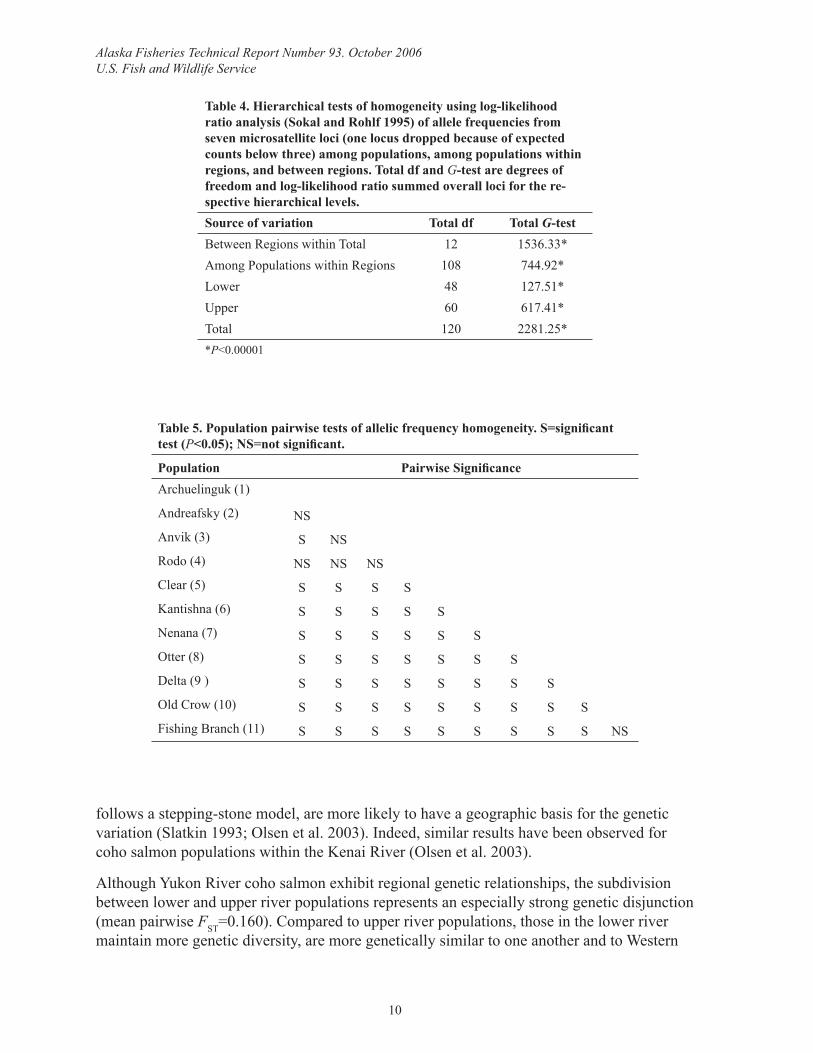
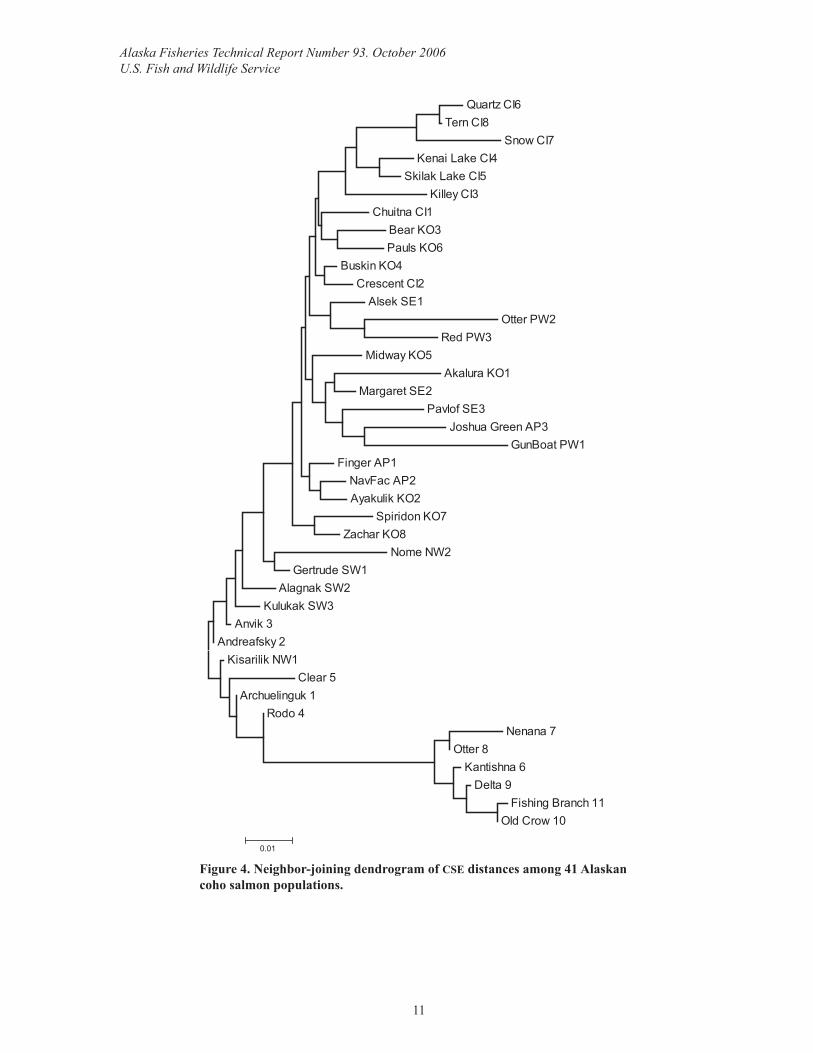
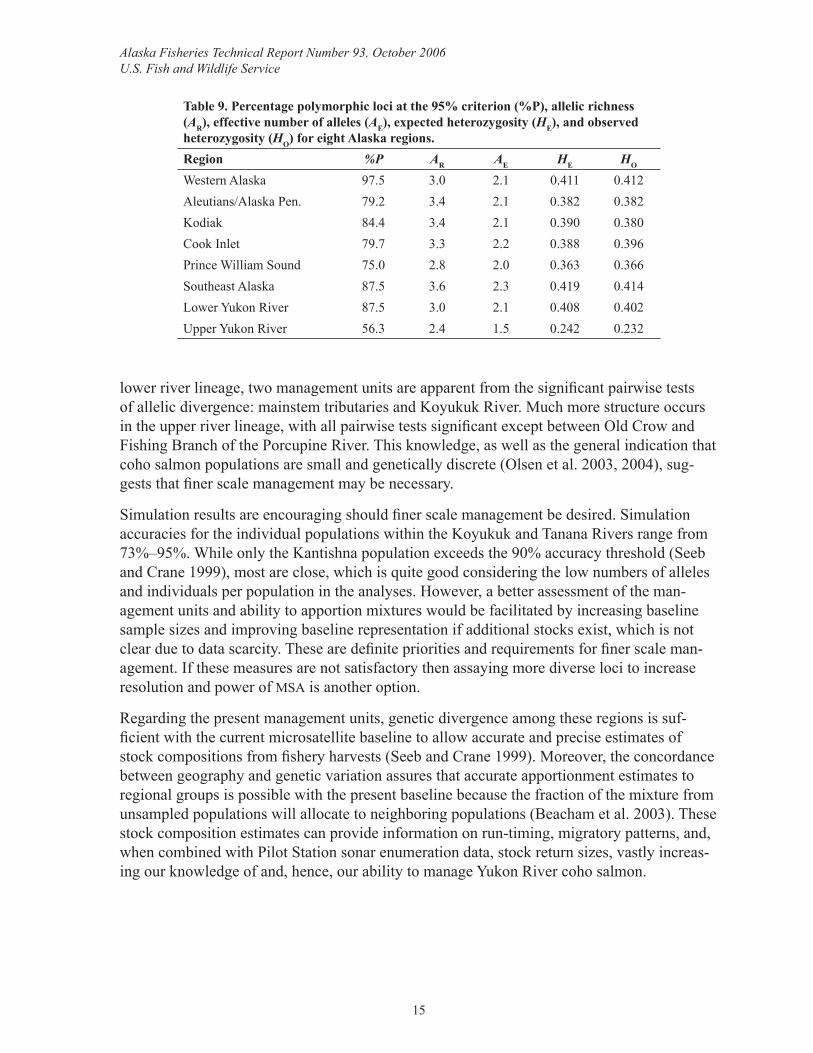
Comparison with coho salmon from around AlaskaA range of diversity values was observed among the regions (Table 9). Expected heterozy-gosity and percent polymorphic loci ranged from 0.242–0.419 and 56.3%–97.5%. Allelic richness and effective number of alleles ranged from 2.4–3.6 and 1.5–2.3. The upper Yukon River populations were the least diverse at all measures. The neighbor-joining dendrogram revealed that the upper Yukon River populations were quite distinct while the lower Yukon River populations were similar to those of Western Alaska (Figure 4).
Discussion
Extent and pattern of genetic diversityIn the Yukon River, coho salmon exhibit a high degree of geographically based genetic structure (GST=0.103), more than has been observed for either chum (Scribner et al. 1998; Crane et al 2001; Flannery 2004) or Chinook salmon (Smith et al. 2005; Templin et al. 2005). This level of divergence is similar to the estimate for coho salmon across Alaska (Olsen et al 2003) although the patterns of population structure differ. Generally, the genetic variation of coho salmon in Alaska has weak geographic associations, likely resulting from small, locally adapted populations, with little gene fl ow (Gharrett et al. 2001; Olsen et al. 2003). This is not the case for Yukon River coho salmon, which show strong regional structuring. However, these results are not surprising given the dimensional nature of the Yukon River. One-dimen-sional habitats, such as a river, wherein populations are linearly distributed and gene fl ow
●●●
● ●●●
●
●
●
●
●
●
●
●
●
●
●
●
●
●
●
●
●
●
●
●
●
●
●
●
●
●
●
●
●
●
●
●
●
●
●
●
●
●
●
●
●
●
●
●
●
●●
●
●
0 200 400 600 800 1000
0.00
0.05
0.10
0.15
0.20
0.25
0.30
Geographic Distance
Gen
etic
Dis
tanc
e
10
Alaska Fisheries Technical Report Number 93. October 2006U.S. Fish and Wildlife Service
Table 4. Hierarchical tests of homogeneity using log-likelihood ratio analysis (Sokal and Rohlf 1995) of allele frequencies from seven microsatellite loci (one locus dropped because of expected counts below three) among populations, among populations within regions, and between regions. Total df and G-test are degrees of freedom and log-likelihood ratio summed overall loci for the re-spective hierarchical levels.Source of variation Total df Total G-testBetween Regions within Total 12 1536.33*Among Populations within Regions 108 744.92*Lower 48 127.51*Upper 60 617.41*Total 120 2281.25**P<0.00001
Table 5. Population pairwise tests of allelic frequency homogeneity. S=signifi cant test (P<0.05); NS=not signifi cant.
Population Pairwise Signifi canceArchuelinguk (1)
Andreafsky (2) NSAnvik (3) S NSRodo (4) NS NS NSClear (5) S S S SKantishna (6) S S S S SNenana (7) S S S S S SOtter (8) S S S S S S SDelta (9 ) S S S S S S S SOld Crow (10) S S S S S S S S SFishing Branch (11) S S S S S S S S S NS
follows a stepping-stone model, are more likely to have a geographic basis for the genetic variation (Slatkin 1993; Olsen et al. 2003). Indeed, similar results have been observed for coho salmon populations within the Kenai River (Olsen et al. 2003).
Although Yukon River coho salmon exhibit regional genetic relationships, the subdivision between lower and upper river populations represents an especially strong genetic disjunction (mean pairwise FST=0.160). Compared to upper river populations, those in the lower river maintain more genetic diversity, are more genetically similar to one another and to Western
11
Alaska Fisheries Technical Report Number 93. October 2006U.S. Fish and Wildlife Service
Quartz CI6 Tern CI8
Snow CI7 Kenai Lake CI4
Skilak Lake CI5 Killey CI3
Chuitna CI1 Bear KO3 Pauls KO6
Buskin KO4 Crescent CI2
Alsek SE1 Otter PW2
Red PW3 Midway KO5
Akalura KO1 Margaret SE2
Pavlof SE3 Joshua Green AP3
GunBoat PW1 Finger AP1
NavFac AP2 Ayakulik KO2
Spiridon KO7 Zachar KO8
Nome NW2 Gertrude SW1
Alagnak SW2 Kulukak SW3
Anvik 3 Andreafsky 2
Kisarilik NW1 Clear 5
Archuelinguk 1 Rodo 4
Nenana 7 Otter 8
Kantishna 6 Delta 9
Fishing Branch 11 Old Crow 10
0.01
Figure 4. Neighbor-joining dendrogram of CSE distances among 41 Alaskan coho salmon populations.

12
Alaska Fisheries Technical Report Number 93. October 2006U.S. Fish and Wildlife Service
Table 6. Hierarchical gene diversity analysis of Yukon River coho salmon using eight microsatellite loci. HT is the total gene diversity; HS is the gene diversity within popu-lations; DSR is the gene diversity among populations within regions; DRT is the gene diversity among regions; HS/HT is the relative gene diversity due to variation within populations; GST is the relative gene diversity due to variation among populations; GRT is the relative gene diversity due to variation among regions; GSR is the relative gene diversity due to variation among populations within regions; Nem is the number of effective migrants per generation.
Source Gene diversity GST-statistics Nem
Average within populations HS=0.317 HS/HT=0.897Average among populations within regions DSR=0.008 GSR=0.022* 11.2Average between regions DRT=0.029 GRT=0.081* 0.7Total gene diversity HT=0.354 GST=0.103* 2.2*P<0.00001 inferred from hierarchical tests of homogeneity.
Alaskan populations, and have comparable levels of diversity to those from other Alaskan regions. While previous studies have observed limited genetic diversity for Yukon River coho salmon, the populations analyzed were limited to the upper river (Gharrett et al. 2001; Olsen et al. 2003), a region where populations likely represent a separate lineage exhibiting rela-tively low diversity within populations and high divergence among populations.
Similar fi ndings of genetic as well as morphometric (i.e. coastal vs. interior) disjunction and spatial differences in genetic divergence and diversity exist for Fraser River coho salmon (Taylor and McPhail 1985; Small et al. 1998; Beacham et al. 2001). Fraser River coho salm-on have been extensively sampled, and no hybrid zone has been found, with the point of dis-juncture at Hell’s Gate. This has led to the conclusion that based on the geologic record and similar disjunctions for sockeye and Chinook salmon that different colonizing sources and lo-cal adaptation, which prevents or severely limits gene fl ow between regions, are responsible for this divide (Small et al. 1998). Parallel conclusions are not yet possible for Yukon River coho salmon as further sampling in the middle section between the Rodo and Tanana Riv-ers is required to rule out a contact zone or identify a point of disjuncture. Until such work is completed, two possible colonization scenarios exist. The geologic record provides the pos-sibility of an alternative colonizing source as it has been postulated that the upper and middle Yukon River once drained to the south into the Gulf of Alaska before being rerouted by gla-cial damming (Lindsey and McPhail 1986). Also, differences exist between lower and upper Yukon River chum and Chinook salmon (Wilmot et al 1994; Templin et al. 2005), although not of the same magnitude as for coho salmon. Alternatively, recent divergence from a single colonizing source due to founding/bottleneck effects, which Olsen et al. (2004) suggest, may also be an explanation. Regardless, upper Yukon River coho salmon occupy habitat at the extremes of both geographic distribution and freshwater migratory distance and have a level of genetic distinction similar to upper Fraser River coho salmon, which Small et al. (1998) deem an evolutionary signifi cant unit.
13
Alaska Fisheries Technical Report Number 93. October 2006U.S. Fish and Wildlife Service
Tabl
e 7.
Mix
ed-s
tock
ana
lysi
s acc
urac
y fo
r 10
0% in
divi
dual
pop
ulat
ion
sim
ulat
ions
. Acc
urac
y lis
ted
abov
e th
e st
anda
rd d
evia
tion.
M
ean
allo
catio
n by
pop
ulat
ion
Popu
latio
nA
rchu
elin
guk
And
reaf
sky
Anv
ikR
odo
Cle
arK
antis
hna
Nen
ana
Otte
rD
elta
Old
Cro
wFi
shin
g B
rA
rchu
elin
guk
0.59
0.22
0.03
0.11
0.03
0.00
0.00
0.00
0.00
0.00
0.00
0.10
0.11
0.03
0.08
0.03
0.00
0.01
0.01
0.00
0.00
0.00
And
reaf
sky
0.08
0.75
0.09
0.05
0.01
0.00
0.00
0.00
0.00
0.00
0.00
0.07
0.10
0.07
0.05
0.02
0.00
0.00
0.01
0.00
0.00
0.00
Anv
ik0.
020.
190.
710.
050.
020.
000.
000.
000.
000.
000.
000.
030.
100.
100.
050.
030.
000.
000.
000.
000.
000.
00R
odo
0.09
0.10
0.04
0.73
0.01
0.00
0.00
0.00
0.01
0.00
0.00
0.07
0.07
0.04
0.08
0.02
0.00
0.00
0.01
0.01
0.01
0.01
Cle
ar0.
030.
030.
030.
040.
860.
000.
000.
000.
000.
000.
000.
040.
030.
030.
040.
060.
000.
000.
000.
000.
000.
00K
antis
hna
0.00
0.00
0.00
0.00
0.00
0.95
0.00
0.01
0.02
0.01
0.01
0.00
0.00
0.00
0.00
0.00
0.03
0.00
0.01
0.02
0.02
0.02
Nen
ana
0.00
0.00
0.00
0.00
0.00
0.00
0.86
0.10
0.02
0.01
0.00
0.00
0.00
0.00
0.00
0.00
0.01
0.06
0.06
0.03
0.01
0.01
Otte
r0.
000.
000.
000.
000.
000.
030.
020.
890.
040.
000.
010.
010.
010.
000.
000.
000.
040.
020.
050.
040.
010.
01D
elta
0.00
0.00
0.00
0.00
0.00
0.12
0.02
0.07
0.73
0.03
0.03
0.00
0.00
0.00
0.01
0.00
0.07
0.02
0.05
0.09
0.04
0.04
Old
Cro
w0.
000.
000.
000.
000.
000.
010.
010.
000.
040.
680.
260.
000.
000.
000.
000.
000.
020.
010.
010.
040.
120.
12Fi
shin
g B
r0.
000.
000.
000.
000.
000.
010.
000.
000.
020.
070.
90
0.00
0.00
0.00
0.00
0.00
0.01
0.00
0.01
0.02
0.08
0.08
14
Alaska Fisheries Technical Report Number 93. October 2006U.S. Fish and Wildlife Service
Table 8. Mixed-stock analysis accuracy for 100% individual population simulations summed to regions and for 100% re-gional aggregate simulations. Accuracy listed above the stan-dard deviation.
Mean Allocation by RegionRegion Population Lower Tanana Porcupine
Lower0.99 0.00 0.000.01 0.01 0.00
Archuelinguk0.99 0.01 0.000.01 0.01 0.01
Andreafsky0.99 0.01 0.000.01 0.01 0.00
Anvik1.00 0.00 0.000.00 0.00 0.00
Rodo0.98 0.01 0.010.01 0.01 0.01
Clear1.00 0.00 0.000.01 0.00 0.00
Tanana0.00 0.97 0.020.01 0.02 0.02
Kantishna0.00 0.98 0.020.00 0.02 0.02
Nenana0.01 0.99 0.010.01 0.01 0.01
Otter0.01 0.98 0.010.01 0.02 0.01
Delta0.00 0.93 0.060.01 0.05 0.05
Porcupine0.00 0.04 0.950.00 0.03 0.03
Old Crow0.00 0.06 0.930.01 0.04 0.04
Fishing Br0.00 0.03 0.970.00 0.03 0.03
Fishery managementTwo coho salmon lineages occur within the Yukon River and should be conserved in order to preserve the species evolutionary ability. Within these lineages are demographically inde-pendent stocks that should be treated as such when it comes to managing harvests in order to maintain production and the viability of the larger lineage. Additional structure, not account-ed for by the present management units, exists within both the lower and upper lineages. In
15
Alaska Fisheries Technical Report Number 93. October 2006U.S. Fish and Wildlife Service
lower river lineage, two management units are apparent from the signifi cant pairwise tests of allelic divergence: mainstem tributaries and Koyukuk River. Much more structure occurs in the upper river lineage, with all pairwise tests signifi cant except between Old Crow and Fishing Branch of the Porcupine River. This knowledge, as well as the general indication that coho salmon populations are small and genetically discrete (Olsen et al. 2003, 2004), sug-gests that fi ner scale management may be necessary.
Simulation results are encouraging should fi ner scale management be desired. Simulation accuracies for the individual populations within the Koyukuk and Tanana Rivers range from 73%–95%. While only the Kantishna population exceeds the 90% accuracy threshold (Seeb and Crane 1999), most are close, which is quite good considering the low numbers of alleles and individuals per population in the analyses. However, a better assessment of the man-agement units and ability to apportion mixtures would be facilitated by increasing baseline sample sizes and improving baseline representation if additional stocks exist, which is not clear due to data scarcity. These are defi nite priorities and requirements for fi ner scale man-agement. If these measures are not satisfactory then assaying more diverse loci to increase resolution and power of MSA is another option.
Regarding the present management units, genetic divergence among these regions is suf-fi cient with the current microsatellite baseline to allow accurate and precise estimates of stock compositions from fi shery harvests (Seeb and Crane 1999). Moreover, the concordance between geography and genetic variation assures that accurate apportionment estimates to regional groups is possible with the present baseline because the fraction of the mixture from unsampled populations will allocate to neighboring populations (Beacham et al. 2003). These stock composition estimates can provide information on run-timing, migratory patterns, and, when combined with Pilot Station sonar enumeration data, stock return sizes, vastly increas-ing our knowledge of and, hence, our ability to manage Yukon River coho salmon.
Table 9. Percentage polymorphic loci at the 95% criterion (%P), allelic richness (AR), effective number of alleles (AE), expected heterozygosity (HE), and observed heterozygosity (HO) for eight Alaska regions.Region %P AR AE HE HO
Western Alaska 97.5 3.0 2.1 0.411 0.412Aleutians/Alaska Pen. 79.2 3.4 2.1 0.382 0.382Kodiak 84.4 3.4 2.1 0.390 0.380Cook Inlet 79.7 3.3 2.2 0.388 0.396Prince William Sound 75.0 2.8 2.0 0.363 0.366Southeast Alaska 87.5 3.6 2.3 0.419 0.414Lower Yukon River 87.5 3.0 2.1 0.408 0.402Upper Yukon River 56.3 2.4 1.5 0.242 0.232
16
Alaska Fisheries Technical Report Number 93. October 2006U.S. Fish and Wildlife Service
Conclusions
Yukon River coho salmon exhibit a high degree of population structure.
Upper Yukon River coho salmon have lower levels of genetic diversity.
Accurate (>90%) apportionment to regions is possible with the current microsatellite baseline.
Recommendations
Increase sample sizes for those populations currently below 200 individuals.
Improve baseline representation if other stocks are identifi ed.
Assay additional microsatellite loci that have greater than 20 alleles, if necessary, after completing 1 and 2.
Acknowledgements
We thank Howard Beans and Richard Burnham for collecting samples from the Archuelinguk and Rodo Rivers, respectively. We thank Andrea Medeiros, Publication Specialist, of the Of-fi ce of Subsistence Mangement for editing and formatting this report. We thank the U.S. Fish and Wildlife Service, Offi ce of Subsistence Management for providing $49,920 in funding support for this project through the Fisheries Resource Monitoring Program, project number 05-203.
References
Allendorf, F. W., N. Ryman, and F. M. Utter. 1987. Genetics and fi shery management. Pages 1–19 in N. Ryman and F. Utter, editors. Population Genetics and Fishery Management. University of Washington Press, Seattle, Washington.
Altukhov, Y. P., and E. A. Salmenkova. 1987. Stock transfer relative to natural organization, management, and conservation of fi sh populations. Pages 333–343 in N. Ryman and F. Utter, editors. Population Genetics and Fishery Management. University of Washington Press, Seattle, Washington.
Apostal, B. L., W. C. Black IV, P. Reiter, and B. R. Miller. 1996. Population genetics with RAPD-PCR markers: the breeding structure of Aedes aegypti in Puerto Rico. Heredity 76:325–334.
Bartley, D. M., B. Bentley, P. G. Olin, and G. A. E. Gall. 1992. Population genetic structure of coho salmon (Oncorhynchus kisutch) in California. California Department of Fish and Game 78:88–104.
Beacham, T. D., J. R. Candy, K. J. Supernault, T. Ming, B. Deagle, A. Schulze, D. Tuck, K. H. Kaukinen, J. R. Irvine, K. M. Miller, and R. E. Withler. 2001. Evaluation and applica-tion of microsatellite and major histocompatibility complex variation for stock identifi ca-tion of coho salmon in British Columbia. Transactions of the American Fisheries Society 130:1116–1149.
1)
2)
3)
1)
2)
3)
17
Alaska Fisheries Technical Report Number 93. October 2006U.S. Fish and Wildlife Service
Beacham, T. D., J. R. Candy, K. J. Supernault, M. Wetklo, B. Deagle, K. Labaree, J. R. Ir-vine, K. M. Miller, R. J. Nelson, and R. E. Withler. 2003. Evaluation and application of microsatellites for population identifi cation of Fraser River chinook salmon (Oncorhyn-chus tshawytscha). Fishery Bulletin 101:243–259.
Belkhir, K., V. Castric, and F. Bonhomme. 2002. IDENTIX, a software to test for relatedness in a population using permutation methods. Molecular Ecology Notes 2:611–614.
Black, W. C. IV, and E. S. Krafsur. 1985. A FORTRAN program for the calculation and analysis of two-linkage disequilibrium coeffi cients. Theoretical and Applied Genetics 70:491–496.
Buchholz, W., S. J. Miller, and W. J. Spearman. 2001. Isolation and characterization of chum salmon microsatellite loci and use across species. Animal Genetics 32:162–165.
Bue, F. 2002. Yukon area, fall season fi shery summary, 2002. Alaska Department of Fish and Game, Fairbanks, Alaska.
Bue, F. 2004. Yukon area, fall season fi shery summary, 2004. Alaska Department of Fish and Game, Fairbanks, Alaska.
Cavalli-Sforza, L. L., and A. W. F. Edwards. 1967. Phylogenetic analysis: models and estima-tion procedures. American Journal of Human Genetics 19:233–257.
Chakraborty, R., and O. Leimar. 1987. Genetic variation within a subdivided stock. Pages 89–120 in N. Ryman and F. Utter, editors. Population Genetics and Fishery Manage-ment. University of Washington Press, Seattle, Washington.
Cooper, D. W. 1968. The signifi cance level in multiple tests made simultaneously. Heredity 23:614–617.
Crane, P. A., W. J. Spearman, and L. W. Seeb. 2001. Yukon River chum salmon: report for genetic stock identifi cation studies, 1992–1997. Alaska Department of Fish and Game, Regional Information Report 5J01-08, Anchorage, Alaska.
Debevec, E. M., R. B. Gates, M. Masuda, J. Pella, J. M. Reynolds, and L. W. Seeb. 2000. SPAM (Version 3.2): Statistics program for analyzing mixtures. Journal of Heredity 91:509–510.
Felsenstein, J. 1993. PHYLIP, version 3.57. Department of Genetics, University of Washing-ton, Seattle, Washington.
Flannery, B. G. 2004. Application of molecular markers to mixed-stock analysis of Yukon River fall chum salmon. Master’s thesis. University of Alaska Fairbanks.
Geiger, H. J. 1991. An investigation into the potential of scale pattern analysis for stock separation in the south peninsula coho salmon bycatch. Alaska Department of Fish and Game, Region Information Report 5J91-15, Juneau, Alaska.
Gharrett, A. J., A. K. Gray, and V. Brykov. 2001. Phylogeographic analysis of mitochondrial DNA variation in Alaskan coho salmon, Oncorhynchus kisutch. Fishery Bulletin 99:528–544.
Goudet, J. 1995. FSTAT A program for IBM PC compatibles to calculate Weir and Cocker-ham’s (1984) estimators of F-statistics (version 1.2). Journal of Heredity 86:485–486.

18
Alaska Fisheries Technical Report Number 93. October 2006U.S. Fish and Wildlife Service
Halupka, K. C., M. F. Willson, M. D. Bryant, F. H. Everest, and A. J. Gharrett. 2003. Con-servation of population diversity of Pacifi c salmon in Southeast Alaska. North American Journal of Fisheries Management 23:1057–1086.
Hansen, M. M., E. E. Nielsen, and K. L. D. Mensberg. 1997. The problem of sampling fami-lies rather than populations: relatedness among individuals in samples of juvenile brown trout Salmo trutta L. Molecular Ecology 6:469–474.
Kumar, S., K. Tamura, I. B. Jakobsen, and M. Nei. 2001. MEGA2: Molecular Evolutionary Genetics Analysis software. Bioinformatics 12:1244–1245.
Lindsey, C. C., and J. D. McPhail. 1986. Zoogeography of fi shes of the Yukon and Macken-zie basins. Pages 639–674 in C. H. Hocutt and E. O. Wiley, editors. The Zoogeography of North American Freshwater Fishes. John Wiley and Sons, New York.
Mantel, N. A. 1967. The detection of disease clustering and a generalized regression ap-proach. Cancer Research 27:209–220.
Milner, A. M, E. E. Knudsen, C. Soiseth, A. L. Robertson, D. Schell, I. T. Phillips, and K. Magnusson. 2000. Colonization and development of stream communities across a 200-year gradient in Glacier Bay National Park, Alaska, U.S.A. Canadian Journal of Fisher-ies and Aquatic Sciences 57:2319–2335.
McBride, D. N., H. H. Hamner, and L. S. Buklis. 1983. Age, sex and size of Yukon River salmon catch and escapement, 1982. Alaska Department of Fish and Game, Technical Data Report 90, Juneau, Alaska.
Nei, M., and R. K. Chesser. 1983. Estimation of fi xation indices and gene diversities. Annals of Human Genetics 47:253–259.
Nelson, K., and M. Soule. 1987. Genetical conservation of exploited fi shes. Pages 345–368 in Ryman, N. and F. Utter, editors. Population Genetics and Fishery Management. Uni-versity of Washington Press, Seattle, Washington.
Nelson, R. J. 1998. Final Report for contract 1448-70181-97-M-560. Report of SeaStar Bio-tech Inc. to U.S. Fish and Wildlife Service, Anchorage, Alaska.
Olsen, J. B., S. J. Miller, W. J. Spearman, and J. K. Wenburg. 2003. Patterns of intra- and inter-population genetic diversity in Alaskan coho salmon: implications for conservation. Conservation Genetics 4:557–569.
Olsen, J. B., W. J. Spearman, G. K. Sage, S. J. Miller, B. G. Flannery, and J. K. Wenburg. 2004. Variation in the population structure of Yukon River chum and coho salmon: evaluating the potential impact of localized habitat degradation. Transactions of the American Fisheries Society 133:476–483.
Pella, J. J., and G. B. Milner. 1987. Use of genetic marks in stock composition analysis. Pages 247–276 in N. Ryman and F. Utter, editors. Population Genetics and Fishery Man-agement. University of Washington Press, Seattle, Washington.
Queller, D. C., and K. F. Goodnight. 1989. Estimating relatedness using genetic markers. Evolution 43:258–275.
Rannala, B., and J. L. Mountain. 1997. Detecting immigration by using multilocus geno-types. Proceedings of the National Academy of Science USA 94: 9197-9201.
19
Alaska Fisheries Technical Report Number 93. October 2006U.S. Fish and Wildlife Service
Raymond, M., and F. Rousset. 1995. GENEPOP (version 1.2) population genetic software for exact tests and ecumenicism. Journal of Heredity 86: 248–249.
Reisenbichler, R. R., and S. R. Phelps. 1987. Genetic variation in chinook, Oncorhynchus tshawytcha, and coho, O. kisutch, salmon from the north coast of Washington. Fishery Bulletin 85:681–700.
Saitou, N., and M. Nei. 1987. The neighbor-joining method: a new method for reconstructing phylogenetic trees. Molecular Biology and Evolution 4:406–425.
Sandercock, F. K. 1991. Life history of coho salmon. Pages 396–445 in C. Groot and L. Mar-golis, editors. Pacifi c salmon life histories. UBC Press, Vancouver, B.C.
Scribner, K. T., J. R. Gust, and R. L. Fields. 1996. Isolation and characterization of novel salmon microsatellite loci: cross-species amplifi cation and population genetic applica-tions. Canadian Journal of Fisheries and Aquatic Sciences 53:833–841.
Scribner, K. T., P. A. Crane, W. J. Spearman, and L. W. Seeb. 1998. DNA and allozyme mark-ers provide concordant estimates of stock differentiation: analyses of U.S. and Canadian stocks of Yukon River fall-run chum salmon (Oncorhynchus keta). Canadian Journal of Fisheries and Aquatic Sciences 55:1748–1758.
Seeb, L. W., and P. A. Crane. 1999. Allozymes and mitochondrial DNA discriminate Asian and North American stocks of chum salmon in mixed-stock fi sheries along the south coast of the Alaska Peninsula. Transactions of the American Fisheries Society 128:88–103.
Slatkin, M. 1993. Isolation by distance in equilibrium and non-equilibrium stocks. Evolution 47:264–279.
Small, M. P., T. D. Beacham, R. E. Withler, and R. J. Nelson. 1998. Discriminating coho salmon (Oncorhynchus kisutch) populations within the Fraser River, British Columbia, using microsatellite DNA markers. Molecular Ecology 7:141–155.
Smith, C. T., B. F. Koop, and R. J. Nelson. 1998. Isolation and characterization of coho salmon (Oncorhynchus kisutch) microsatellites and their use in other salmonids. Molecu-lar Ecology 7:1614–1616.
Smith, C. T., R. J. Nelson, C. C. Wood, and B. F. Koop. 2001. Glacial biogeography of North American coho salmon (Oncorhynchus kisutch). Molecular Ecology 10:2775–2785.
Smith, C. T., W. D. Templin, J. E. Seeb, and L. W. Seeb. 2005. Single nucleotide polymor-phisms provide rapid and accurate estimates of the proportions of U.S. and Canadian chinook salmon caught in Yukon River fi sheries. North American Journal of Fisheries Management 25:944–953.
Smouse, P. E., and R. H. Ward. 1978. A comparison of the genetic infrastructure of the Ye’cuana and the Yanomama: a likelihood analysis of genotypic variation among stocks. Genetics 88:611–631.
Sokal, R. R., and F. J. Rohlf. 1995. Biometry. W.H. Freeman, New York.Swofford, D. L., and R. B. Selander. 1981. BIOSYS-1: a FORTRAN program for the com-
prehensive analysis of electrophoretic data in population genetics and systematics. Jour-nal of Heredity 72:281–283.

20
Alaska Fisheries Technical Report Number 93. October 2006U.S. Fish and Wildlife Service
Taylor, E. B., and J. D. McPhail. 1985. Variation in body morphology among British Colum-bia populations of coho salmon, Oncorhynchus kisutch. Canadian Journal of Fisheries and Aquatic Sciences 11:44–60.
Templin W. D., R. L. Wilmot, C. M. Guthrie III, and L. W. Seeb. 2005. United States and Canadian Chinook salmon stocks in the Yukon River can be segregated based on genetic characteristics. Alaska Fishery Research Bulletin 11:44–60.
Utter, F. M., D. Campton, S. Grant, G. Milner, J. Seeb, and L. Wishard. 1980. Population structure of indigenous salmonid species of the Pacifi c Northwest. Pages 285–304 in McNeil, W. and D. Himsworth, editors. Salmonid Ecosystems of the North Pacifi c. Uni-versity of Oregon Press, Corvallis, Oregon.
Wehrhahn, C. F., and R. Powell. 1987. Electrophoretic variation, regional differences, and gene fl ow in coho salmon (Oncorhynchus kisutch) of southern British Columbia. Cana-dian Journal of Fisheries and Aquatic Sciences 44:822–831.
Weitkamp, L. A., T. C. Wainwright, G. J. Bryant, G. B. Milner, D. J. Teel, R. G. Kope, and R. S. Waples. 1995. Status review of coho salmon from Washington, Oregon, and Califor-nia. U.S. Department of Commerce, National Oceanic and Atmospheric Administration, Technical Memorandum NMFS-NWFSC-24, Seattle, Washington.
Wilmot R. L., R. J. Everett, W. J. Spearman, R. Baccus, N. V. Varnavskaya, and S. V. Pu-tivkin. 1994. Genetic stock structure of western Alaska chum salmon and a compari-son with Russian far east stocks. Canadian Journal of Fisheries and Aquatic Sciences 51(Supplement 1):84-94.
Wright, S. 1943. Isolation by distance. Genetics 28:114–138.Wright, S. 1978. Evolution and the genetics of populations: Volume 4, variability within and
among natural populations. The University of Chicago Press, Chicago, Illinois.Yeh, F. C. and Boyle, T. J. B. 1997. Population genetic analysis of co-dominant and dominant
markers and quantitative traits. Belgian Journal of Botany 129:157.Zhivotovsky, L. A., A. J. Gharrett, A. J. McGregor, M. K. Glubokovsky, and M. W. Feldman.
1994. Gene differentiation in Pacifi c salmon (Oncorhynchus sp.): facts and models with reference to pink salmon (O. gorbuscha). Canadian Journal of Fisheries and Aquatic Sci-ences 51(Supplement 1):223–232.