
YRERFS GIS WORKFLOW AND MODELING PROCESS
23
US Army Corps of Engineers BUILDING STRONG ® YRERFS GIS WORKFLOW AND MODELING PROCESS Presenter Name Presenter Title SPK Sacramento 7/12/2017
Transcript of YRERFS GIS WORKFLOW AND MODELING PROCESS

US Army Corps of EngineersBUILDING STRONG®
YRERFS GIS WORKFLOW AND MODELING PROCESS
Presenter NamePresenter Title
SPK Sacramento
7/12/2017
BUILDING STRONG®
YRERFS Juvenile Steelhead Habitat Determination

BUILDING STRONG®
Original Data Sets
tree_object_classification (Riparian Scrub/ Riparian Forest) AllCobbles_5000 LYRriprapHBD LYRbedrock
Data provided by HDROriginally WSI Vegetation analysis, 2010

BUILDING STRONG®
WITHOUT PROJECT CONDITIONS (FWOP)Note: the following additional data layers were provided by the RMT for calculating WUA for these cover versions: LYR_Bedrock_boulder_cover.shp, LYR_riprap_HBD.shp, cobble_5k,lrgcobb_5k, Boulder_5000 and LYR5000_streamwood.shp. Method Process Output Cell Size Format Value
CREATE “AllCobbles_5000”—Combine “cobble_5k” and “lrgcobb_5k” rasters by doing an addition function. Each pixel contains a percentage of the pixel that contains cobble, so by adding the two cobble size classes together a total percentage of area within the pixel that’s cobble was calculated. MATH cobble_5k+lrgcobb_5k=AllCobbles_5000 AllCobbles_5000 3x3 Float32 %CobbleCREATE “LYRriprapHBD”—Converted the file “LYR_riprap_HBD.shp” containing polygons to a raster format with 3ft x 3ft pixels.
Feature to Raster LYR_riprap_HBD.shp to LYRriprapHBD LYRriprapHBD 3x3 Float32 1=RipRap
CREATE “LYRbedrock”—Converted the file “LYR_Bedrock_boulder_cover.shp” containing polygons to a raster format with 3ft x 3 ft pixels.
Feature to Raster
LYR_Bedrock_boulder_cover.shp to LYRbedrock LYRbedrock 3x3 Float32 1=Bedrock
CREATE “LYR_Boulder_presence”—For a given pixel within the raster “Boulder_5000” that was greater than 9 the output pixel would be 1; otherwise it was zero. Raster Reclass boulder_5k to LYR_Boulder_presence LYR_Boulder_presence 3x3 Float32 1=Boulder
Cover Version – Steelhead (O. mykiss) juvenile Note: The following additional data sources were used: “LYR_veg_only_dissolve”, “LYR5000_wettedarea_dissolved.shp”, “LYR_streamwood.shp”. Method Process Cell Size Format Value
CALCULATE SHSI—If AllCobbles_5000 is less than 30% of a given pixel then the SHSI is .3; otherwise it’s .5. Raster Calc AllCobbles_5000 <30=.3 and >30=.5 SHSI_AllCobbles_5000 3x3 Float32<30=.3>30=.5
CALCULATE LYR_hardcover_OMYjuv_HSI—For a given pixel if the sum of “LYRriprapHBD”, “LYRbedrock” and “LYR_Boulder_presence” is greater than zero then the output pixel value is .5; otherwise .3.
Mosaic/Raster Calc
LYRriprapHBD+LYRbedrock+LYR_Boulder_presence LYR_hardcover_OMYjuv_HSI 3x3 Float32 1=.5
CALCULATE LYR_veg_ OMYjuv_HSI—Polygons representing areas of vegetation taller than 2’ were buffered by 3 feet and assigned a value of 1. Areas within the 5000 cfs wetted area that were not within the 3 foot buffered vegetation polygons were assigned a value of .3. Raster Calc HeightClass=3ftBuffTree=1 and Shrub=.3 LYR_veg__OMYjuv_HSI 3x3 Float32
Tree=1Shrub=.3
CALCULATE LYR_SW_ OMYjuv_HSI—Polygons representing areas of streamwood were buffered by 6 feet and assigned a value of 1. Areas within the 5000 cfs wetted area that were not within the 3 foot buffered vegetation polygons were assigned a value of .3.
Feature to Raster 6ftBuffSW=1 LYR_SW__OMYjuv_HSI 3x3 Float32 SW=1
CALCULATE COMBINED HSI—Overlaying the SHSI, hardcover HSI, streamwood HSI and vegetation HSI rasters and looking at one pixel location at a time the output for that pixel location was whichever of the four inputs had the highest value. Mosaic
SHSI+ hardcover HIS+streamwood HIS+vegetation COMBINED_HSI 3x3 Float32 Heighest
Data provided by HDROriginally WSI Vegetation analysis, 2010
Create Cover Raster

BUILDING STRONG®
Create Cover Raster
tree_object_classificationAllCobbles_5000LYRriprapHBDLYRbedrock
LYR_SW__OMYjuv_HSILYR_veg__OMYjuv_HSILYR_hardcover_OMYjuv_HSISHSI_AllCobbles_5000
COMBINED_HSI

BUILDING STRONG®
Create Cover Raster
COMBINED_HSI
BUILDING STRONG®
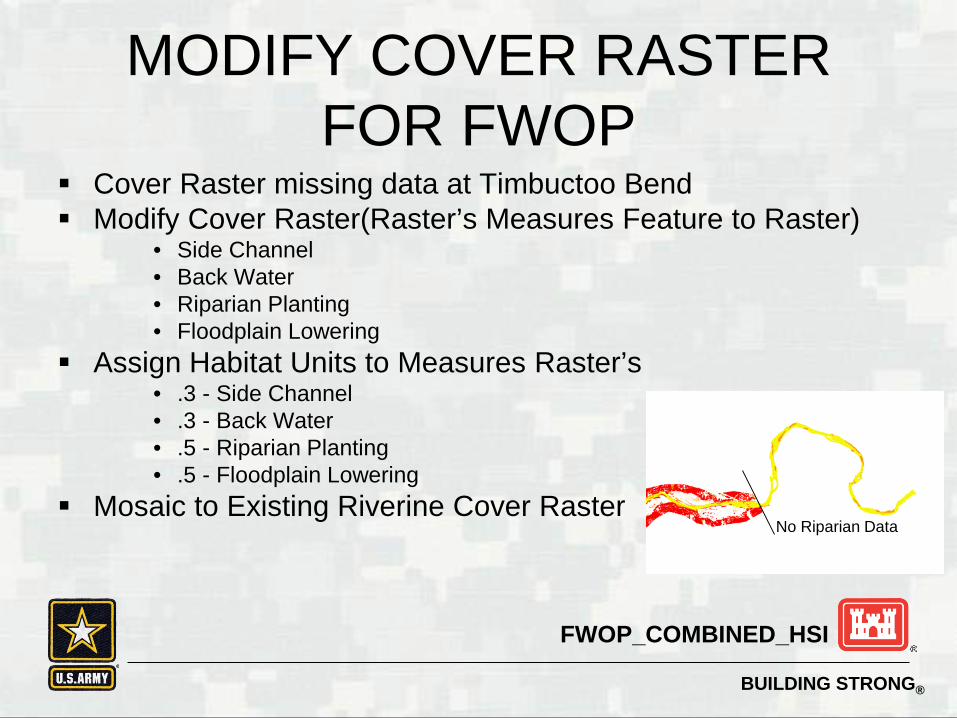
MODIFY COVER RASTER FOR FWOP
Cover Raster missing data at Timbuctoo Bend Modify Cover Raster(Raster’s Measures Feature to Raster)
• Side Channel• Back Water• Riparian Planting• Floodplain Lowering
Assign Habitat Units to Measures Raster’s• .3 - Side Channel• .3 - Back Water• .5 - Riparian Planting• .5 - Floodplain Lowering
Mosaic to Existing Riverine Cover Raster
FWOP_COMBINED_HSI
No Riparian Data
BUILDING STRONG®
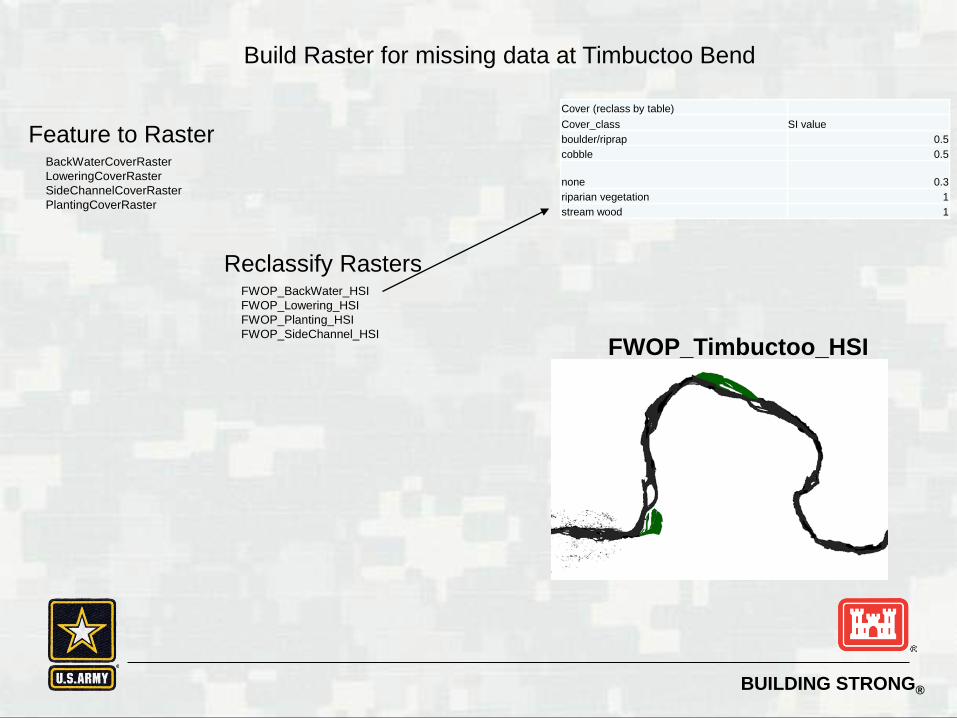
Feature to RasterBackWaterCoverRasterLoweringCoverRasterSideChannelCoverRasterPlantingCoverRaster
Reclassify RastersFWOP_BackWater_HSIFWOP_Lowering_HSIFWOP_Planting_HSIFWOP_SideChannel_HSI
Cover (reclass by table)Cover_class SI valueboulder/riprap 0.5cobble 0.5
none 0.3riparian vegetation 1stream wood 1
Build Raster for missing data at Timbuctoo Bend
FWOP_Timbuctoo_HSI

BUILDING STRONG®
COMBINED_HSI
FWOP_COMBINED_HSI
+ FWOP_Timbuctoo_HSI
=*Only areas within FWP footprint added to FWOP (existing) conditions
(Back Water and Side Channels in Missing Data Area at Timbuctoo Bend)
Cover (reclass by table)Cover_class SI valueboulder/riprap 0.5cobble 0.5
none 0.3riparian vegetation 1stream wood 1
FWOP SI COVER

BUILDING STRONG®
Create FWOP Cover Raster
FWOP_COMBINED_HSI

BUILDING STRONG®
MODIFY COVER RASTER FOR FWP
Create project condition (Raster’s Measures Feature to Raster)
• Side Channel• Back Water• Riparian Planting• Floodplain Lowering
Assign Habitat Units to Measures Raster’s• .5 - Side Channel• .5 - Back Water• 1 - Riparian Planting• 1 - Floodplain Lowering
Mosaic to Existing Riverine Cover Raster
FWP_COMBINED_HSI

BUILDING STRONG®
Feature to RasterBackWaterCoverRasterLoweringCoverRasterSideChannelCoverRasterPlantingCoverRaster
Reclassify RastersFWP_BackWater_HSIFWP_Lowering_HSIFWP_Planting_HSIFWP_SideChannel_HSI
Cover (reclass by table)Cover_class SI valueboulder/riprap 0.5cobble 0.5
none 0.3riparian vegetation 1stream wood 1
Build Raster for missing data at Timbuctoo Bend
FWOP_Timbuctoo_HSI

BUILDING STRONG®
COMBINED_HSI
FWP_COMBINED_HSI
+=
Habitat Values of .5 added to Back Water and Side Channel areas in order toRepresent Cobble Cover in FWP conditions.
(Back Water and Side Channels)
(Floodplain Lowering and Riparian Planting)
+
Habitat Values of 1 added to Floodplain Loweringand Riparian Planting areas in order toRepresent Cobble Cover in FWP conditions.
Cover (reclass by table)Cover_class SI valueboulder/riprap 0.5cobble 0.5
none 0.3riparian vegetation 1stream wood 1
FWP SI COVER

BUILDING STRONG®
Create FWP Cover Raster
FWP_COMBINED_HSI

BUILDING STRONG®
Raster Reclass Depth
=DepthWith750SI, DepthWithOut750SIDepthWith1850SI, DepthWithOut1850SI, DepthWith5000SI, DepthWithOut5000SI
Depth (feet) Suitability Index Value0.4 00.5 0.451.6 0.92 0.98
2.2 12.5 13 0.94
3.5 0.845.5 0.326.5 0.178 0.07
9.5 0.0410.5 0.0313.5 0.0315 0.04
15.1 0
1 - Table to Table in ArcGIS (Excel to ASCII Table) with Range whole number (*100)= (100 200 : 300 where fromVal toVal : HSC)
2 - Depth/Velocity*100 in Raster Calculator3 - Reclass by ASCII Table4 - Copy Raster To Float325 - DepthReclass/VelocityReclass/100 in Raster Calc
BUILDING STRONG®
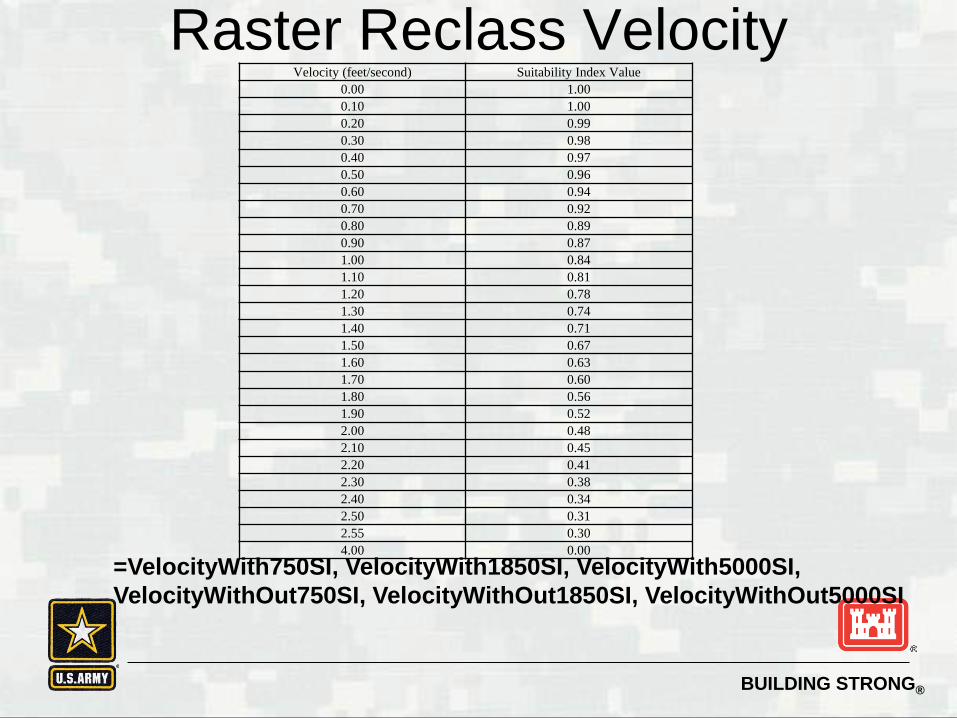
Raster Reclass VelocityVelocity (feet/second) Suitability Index Value
0.00 1.000.10 1.000.20 0.990.30 0.980.40 0.970.50 0.960.60 0.940.70 0.920.80 0.890.90 0.871.00 0.841.10 0.811.20 0.781.30 0.741.40 0.711.50 0.671.60 0.631.70 0.601.80 0.561.90 0.522.00 0.482.10 0.452.20 0.412.30 0.382.40 0.342.50 0.312.55 0.304.00 0.00
=VelocityWith750SI, VelocityWith1850SI, VelocityWith5000SI,VelocityWithOut750SI, VelocityWithOut1850SI, VelocityWithOut5000SI

BUILDING STRONG®
Juvenile Steelhead AKA Riverine FWOP HSI RASTER = (SIdepthFWOP x SIvelocityFWOP x SIcoverFWOP)1/3
8 CALCULATE CHSI— For each flow for a given pixel the output value for that pixel is the cubic root of the product of the VHSI, DHSI and Combined HSI at that location.
Juvenile Steelhead AKA Riverine FWP HSI RASTER = (SIdepthFWP x SIvelocityFWP x SIcoverFWP)1/3
Create Final Cover HSI Raster’s
=FWOP_Riverine750_HSI,FWOP_Riverine1850_HSI,FWOP_Riverine5000_HSI,
FWP_Riverine750_HSI,FWP_Riverine1850_HSI,FWP_Riverine5000_HSI
BUILDING STRONG®
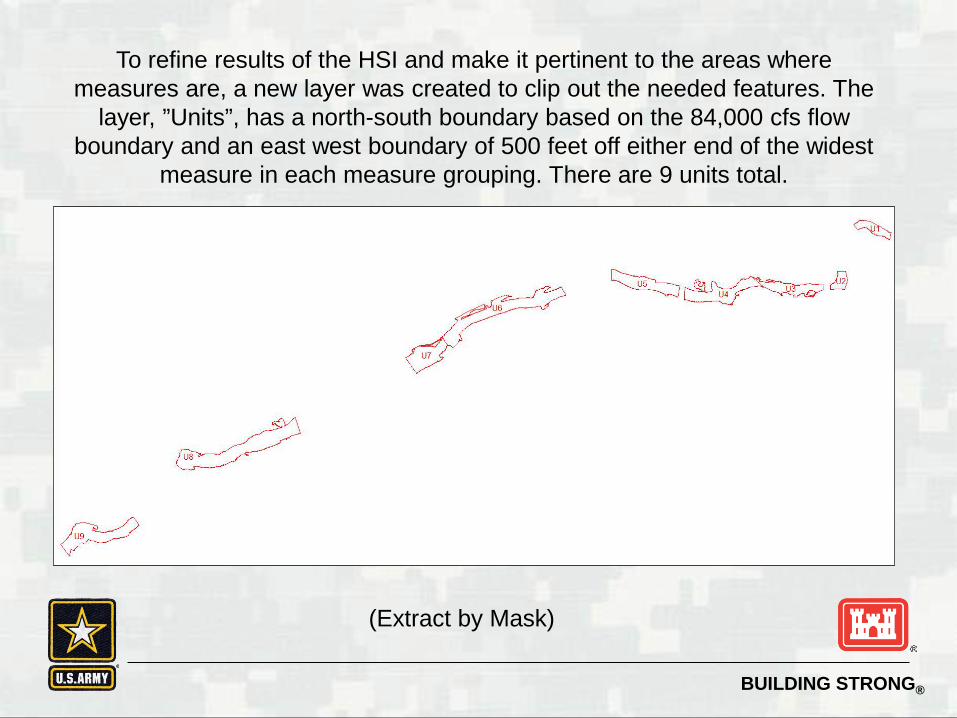
To refine results of the HSI and make it pertinent to the areas where measures are, a new layer was created to clip out the needed features. The
layer, ”Units”, has a north-south boundary based on the 84,000 cfs flow boundary and an east west boundary of 500 feet off either end of the widest
measure in each measure grouping. There are 9 units total.
(Extract by Mask)

BUILDING STRONG®
All 9 units were used to clip the FWP and FWOP HSI rasters.
Unit 1
Unit 1: 1850 cfs flow boundary clipped out
FWOP/FWP_HSI Raster’s
Units
=FWOP_Riverine750_HSI_U1 through U9,FWOP_Riverine1850_HSI_U1 through U9,FWOP_Riverine5000_HSI_U1 through U9,FWP_Riverine750_HSI_U1 through U9,FWP_Riverine1850_HSI_U1 through U9,FWP_Riverine5000_HSI_U1 through U9
X54 By-Units HIS Rasters

BUILDING STRONG®
To calculate actual Habitat Units (end product) need to create a table for each raster. To create a table use the Zonal Statistics tool and input
the rasters you want to create a table for.
8 Units Rasters to Table (Zonal Statistics)9 Add HSI Field
10 Sum from Zonal Statastics *911 Add Name Field
import arcpyfrom arcpy import envenv.workspace = r"D:\USACE Projects\YubaRiverEcosystemRestoration\GDB\Scratch.gdb" for table in arcpy.ListTables("*"): name = table.split(".")[0] arcpy.AddField_management(table, "Name", "TEXT") arcpy.CalculateField_management(table, "Name", '"' + name + '"', "PYTHON")
12 Merge Tables and export to Excel

BUILDING STRONG®
Once the table is created, create a new field in each raster and call it “Habitat Unit” then use the field calculator tool to
determine the total ft2 of for each raster.
Use the formula “Sum * 9” where nine is the dimensions of each individual raster cell (3X3) and Sum is the total number of cells.
9 CALCULATE WUA— The CHSI rasters for each flow were grouped by hydraulic zone and a sum total of the pixel values for each zone was calculated. The sum total was then multiplied by the surface area of a single pixel (3’ x 3’ = 9ft2) to get the WUA for each separate hydraulic zone and for each modeled flow.

BUILDING STRONG®
Final Product: after calculating all the habitat units, input values for each Evaluation unit based on flow
into the GIS Outputs Table of Values

BUILDING STRONG®