Youth Unemployment in South Africa - Princeton University
52
2015 Youth Unemployment in South Africa KHULUVHE KHAUKANANI ANDREW STATISTICS SOUTH AFRICA
Transcript of Youth Unemployment in South Africa - Princeton University

2015
Youth Unemployment in South Africa
KHULUVHE KHAUKANANI ANDREW
STATISTICS SOUTH AFRICA

1
Table of Contents
Contents
Chapter 1 ............................................................................................................................................................. 3
1.1 INTRODUCTION AND BACKGROUND ................................................................................................... 3
1.2 Statement of the problem ......................................................................................................................... 4
1.3 Research Questions ................................................................................................................................... 7
1.4 Research Objective .............................................................................................................................. 7
Chapter 2 ............................................................................................................................................................. 9
2 METHODOLOGY ........................................................................................................................................... 9
2.1 Study Design ........................................................................................................................................ 9
2.2 Variable Definitions ............................................................................................................................. 9
2.2.1 Dependent Variables ................................................................................................................... 9
2.2.2 Independent Variables .............................................................................................................. 12
2.3 Hypotheses ........................................................................................................................................ 13
CHAPTER 3 ......................................................................................................................................................... 14
3 RESULTS .......................................................................................................................................................... 14
3.1 INTRODUCTION ................................................................................................................................. 14
3.2 CHARACTERISTICS OF THE RESPONDENTS .............................................................................................. 14
3.2.1 Socio-demographic Characteristics of the Respondents ........................................................... 14
4.2.2 Labour Force Characteristics of the Respondents ..................................................................... 16
3.3 BIVARIATE ANALYSIS RESULTS ................................................................................................................. 24
Education Level and Unemployment of Youth .......................................................................................... 24
CHAPTER 4 ......................................................................................................................................................... 30
4 MULTIVARIATE ANALYSES .............................................................................................................................. 30
4.1 INTRODUCTION ....................................................................................................................................... 30
4.2 MULTIPLE LOGISTIC REGRESSION MODELLING RESULTS ........................................................................ 31
Level Of Education ..................................................................................................................................... 33
Gender ....................................................................................................................................................... 33
Age ............................................................................................................................................................. 33
Population Group ...................................................................................................................................... 34
Province ..................................................................................................................................................... 34
CHAPTER 5 ......................................................................................................................................................... 36

2
DISCUSSION ....................................................................................................................................................... 36
5.1 CHARACTERISTICS OF THE RESPONDENTS .............................................................................................. 36
Crosstabulation of Labour Force Participation and Education Level ........................................................ 38
5.2 BIVARIATE ANALYSIS................................................................................................................................ 38
5.3 MULTIVARIATE ANALYSIS ........................................................................................................................ 39
CHAPTER 6 ......................................................................................................................................................... 42
6 CONCLUSION AND RECOMMENDATIONS ...................................................................................................... 42
6.1 CONCLUSION ........................................................................................................................................... 42
6.2 RECOMMENDATIONS .............................................................................................................................. 43
Building Skills and Capabilities .................................................................................................................. 43
Promoting Public-Private Partnerships and making Curriculum more Relevant ...................................... 44
Offering a Second Chance So That No One Is Left Behind ........................................................................ 45
7 References ...................................................................................................................................................... 46
Appendix one ..................................................................................................................................................... 50

3
CHAPTER 1
1.1 INTRODUCTION AND BACKGROUND
The continuing debate on who is a ‘youth’ in Africa has not resolved the confusion surrounding the
concept. Not surprising, therefore, the concept of ‘youth’ has been understood and used differently
by different governments, NGOs and the public in general in many African countries and elsewhere
in the world (Mkandawire, 1996). In much of Africa, for instance, laws define ‘adulthood’ as
commencing from the age of 21, although in recent years there has been an attempt to lower this age
to 18 years (Curtain, 2000; Mkandawire, 1996). However, for most countries, 21 years still remains
the age at which many of the activities and responsibilities of ‘adulthood’ are assumed legally.
South Africa has an acute problem of youth unemployment that requires a multi-pronged strategy to
raise employment and support inclusion and social cohesion. High youth unemployment means
young people are not acquiring the skills or experience needed to drive the economy forward. This
inhibits the country’s economic development and imposes a larger burden on the state to provide
social assistance. Closely associated with skills development is the burning issue of unemployment.
South Africa’s rate of unemployment is high by world standards and is associated with a range of
social problems such as poverty, inequality and crime. The Quarterly Labour Force Survey for the
third quarter of 2010 published by Statistics South Africa summarised the following about youth
employment: About 42 per cent of young people under the age of 30 are unemployed compared with
less than 17 per cent of adults over 30. Secondly, the results shows Employment of 18 to 24 year
olds has fallen by more than 20 per cent (320 000) since December 2008. Lastly, Unemployed young
people tend to be less skilled and inexperienced – almost 86 per cent do not have formal further or
tertiary education, while two-thirds have never worked.
4
1.2 STATEMENT OF THE PROBLEM
Youth unemployment in South Africa has reached critical proportions: it was measured at 53.6% in
2013, and in 2014, youth comprised 41.8% of the total national unemployment rate of 25.4%.
Socioeconomic inequality and inadequate education are two factors that drive such high
unemployment rates; rates that disguise how the situation disproportionately affects black youths.(2)
Youth unemployment is a chronic problem too, which dates back two decades under democratic
government. Between 1995 and 1999, unemployment for high school graduates entering the job
market jumped by 10 percentage points, from 28% to 38.4%,(3) and the youth unemployment rate
was actually a shade higher in 2005 (48.4%) than it was amid the global financial crisis in 2009
(48.2%).
In South Africa, the educational system has become the primary means of preparing young people
for the future. But in its present form, the ‘school’ is another institution that is going through a crisis
in South Africa. A review of the education literature indicates that the last decade has witnessed a
disintegration in public schools in terms of quality, infrastructure and teacher and student morale in
most African countries.
South Africa has the third highest unemployment rate in the world for people between the ages of 15
to 24, according to the World Economic Forum (WEF) Global Risk 2014 report. The report
estimates that more than 50% of young South Africans between 15 and 24 are unemployed. Only
Greece and Spain have higher unemployment in this age range than SA, the report states. The other
two countries in the top 5 of most unemployed youth are Portugal and Italy. Both have youth
unemployment of more than 30%, but less than 40%. The report calls the more than 73 million
unemployed people between 15 and 24 in the world the "lost generation". "At the same time the
5
rising cost of higher education has left a generation with unpayable debt and little chance of finding a
job," states the report.
The fact that unemployment continued to rise at an alarming pace from 31% in 1995 to 42% in 2009
(by the broad definition) suggests that the transition from apartheid policies did not only fail to
curtail the long-term trend, but that unemployment may have even been exacerbated by policies that
were intended to subdue it (Burger, et al., 2013). Increasing opportunities and creating spaces for
youth economic participation is one of the biggest challenges facing South Africa (Kennedy, et al.,
2007). The National Planning Commission (NPC)’s diagnostic report (2011) lists the fact that very
few people are participating in the economy as one of the challenges facing the country, especially in
the labour market. A study by Fernandes-Alcantara (2012) indicated that labour market prospects in
the new South Africa should have improved: economic growth should supposedly have translated
into greater opportunity for the previously marginalised, who could capitalise on the improved levels
of education that younger generations had accumulated, in the context of new, anti-discriminatory
labour market legislation. In the absence of these anticipated benefits, many commentators started
referring to “jobless growth”, though a number of subsequent studies of labour market trends over
this period (Fernandes-Alcantara, (2012); Kennedy, et al., (2007)) have convincingly refuted this
supposition. The question then remains why progressively greater stocks of human capital did not
translate into lower unemployment rates in the post-apartheid period.
One challenge which is long-term perspective is that South Africa has a large young population
wherein other literatures (Fernandes-Alcantara, 2012 and Kennedy, et al., 2007) refers as the size of
the youth cohort which is seen as a major contributor to youth unemployment. Du Toit (2003)
indicated that more than 50 per cent of the world’s population is under the age of 25 – just over 3
billion individuals are youth and children. This offers what is known as a ‘demographic dividend’,

6
where a large proportion of the population in economically active, thereby reducing dependency
ratios and poverty rates, and promoting growth (Altman, 2007). However, this dividend can only be
earned if these young people are actually working. The larger the group of marginalised young
people who remained unemployment or under-employed, the larger the threat that dependency ratios
will rise as the demographic bulge passes.
In a context of declining growth and economic restructuring, the employment situation in Africa has
become critical and labour absorption problematic. In particular, the problem of what is generally
referred to as ‘youth unemployment’ has increasingly come to be recognised as one of the more
serious socio-economic problems currently confronting many developing countries, especially those
in Africa (Chigunta, 2002; ILO, 2013).
Nonetheless, existing estimates indicate that in Sub-Saharan Africa, urban unemployment affects
between 15 to 20 per cent of the work force (ILO, 2013). According to these estimates, young people
comprise 40 to 75 per cent of the total number of the unemployed (Chigunta, 2002). Compared with
an adult unemployment rate of 5.9 per cent in 2012, youth are twice as likely to be unemployed, with
an estimated youth unemployment rate of 11.8 per cent in 2012 (ILO, 2013). Youth unemployment
rates much higher than the regional average are found in South Africa, where over half of young
people in the labour force were unemployed in the first three quarters of 2012 (Rankin et al., 2013).
Thousands of young South Africans cannot find jobs; many more are in jobs which do not fulfil their
capabilities or ambitions. Even then, of the few youth that are able to find formal employment, the
majority are male (Lam, et al., 2007). The study by Chigunta (2002) indicated that urban
unemployment in Africa has affected youth from a broad spectrum of socioeconomic groups, both
the well-and-less well educated, although it has particularly stricken a substantial fraction of youth
from low-income backgrounds and limited education.
7
Furthermore, this study will look at the relationship between education and unemployment. The
education system generally fails to prepare young people with fundamental literacy, numeracy,
problem solving, and critical thinking skills, neither does it encourage acquisition of values such as a
work ethic and self-discipline that are required in the workplace (Altman, 2012). In addition,
unemployed young people are a highly diverse group with different levels of educational attainment
combined with the challenges posed by the diverse settings in which they were schooled and
currently live. This means that in the context of the current labour market, it is almost impossible for
employers to establish which new labour market entrants that have completed a certain level of
education are best equipped to enter the world of work (Altman, 2012). The study will examine the
association between education level and unemployment among youth in South Africa (2008 and
2014).
1.3 RESEARCH QUESTIONS
• Is sex of youth in South Africa associated with unemployment?
• Is province were youth in South Africa comes from associated with unemployment?
• Is population group of youth in South Africa associated with unemployment?
• Is education level of youth in South Africa associated with unemployment?
1.4 RESEARCH OBJECTIVE
1.4.1 General Objective
• To examine unemployment of youth in South Africa (2008 and 2014)
1.4.2 Specific Objective

8
• To examine the association between sex and unemployment among youth in South Africa.
• To determine the association between provinces and unemployment among youth in South
Africa.
• To examine the association between population groups and unemployment among youth in
South Africa.
• To determine the association between education level and unemployment among youth in
South Africa.

9
CHAPTER 2
2 METHODOLOGY
2.1 STUDY DESIGN
This is a cross sectional study involving analysis of secondary data from the 2008 and 2014
Quarterly Labour Force Survey (QLFS) conducted by Statistics South Africa.
2.2 VARIABLE DEFINITIONS
2.2.1 DEPENDENT VARIABLES
The dependent variable in this study is Youth Unemployment status. For the purposes of this study,
Unemployed youth are those (aged 15–35 years) who:
a) Were not employed in the reference week.
b) Actively looked for work or tried to start a business in the four weeks preceding the survey
interview. And
c) Would have been able to start work or would have started a business in the reference week.
Persons who stated that they had not looked for work in the reference period because they had
already arranged to take up a job or to start a business at some later date are not required to have
actively sought work in the reference period. They are included as unemployed if they would have
been available to start work/business in the previous week.
A useful dimension to the unemployment picture combines the reasons given by unemployed
persons for not working during the reference week with their circumstances prior to becoming
unemployed. In this regard, the QLFS includes five additional indicators that have been derived as
follows:
10
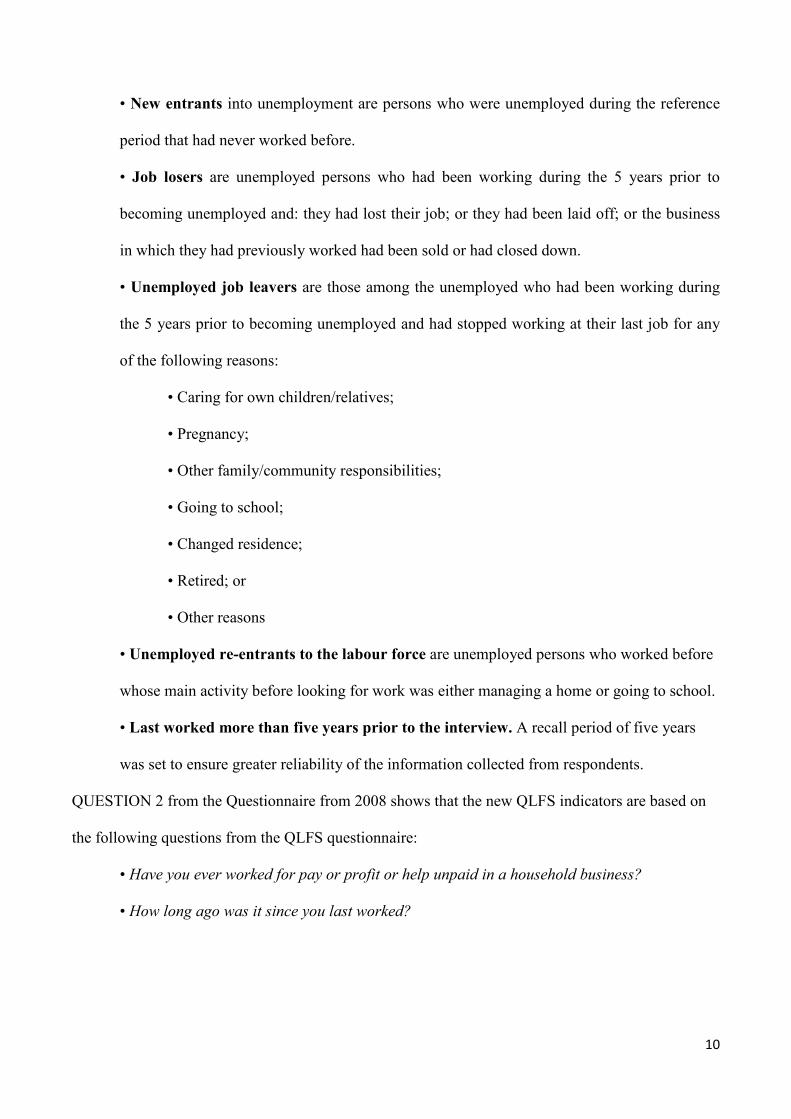
• New entrants into unemployment are persons who were unemployed during the reference
period that had never worked before.
• Job losers are unemployed persons who had been working during the 5 years prior to
becoming unemployed and: they had lost their job; or they had been laid off; or the business
in which they had previously worked had been sold or had closed down.
• Unemployed job leavers are those among the unemployed who had been working during
the 5 years prior to becoming unemployed and had stopped working at their last job for any
of the following reasons:
• Caring for own children/relatives;
• Pregnancy;
• Other family/community responsibilities;
• Going to school;
• Changed residence;
• Retired; or
• Other reasons
• Unemployed re-entrants to the labour force are unemployed persons who worked before
whose main activity before looking for work was either managing a home or going to school.
• Last worked more than five years prior to the interview. A recall period of five years
was set to ensure greater reliability of the information collected from respondents.
QUESTION 2 from the Questionnaire from 2008 shows that the new QLFS indicators are based on
the following questions from the QLFS questionnaire:
• Have you ever worked for pay or profit or help unpaid in a household business?
• How long ago was it since you last worked?

11
The variable was grouped into four categories in the QLFS 2008 as follows: (1) Employed, (2)
Unemployed, (3) Not economically active, and (4) discouraged job seekers. The variable
unemployment status was regrouped in STATA 12 with category 1 = 0 and categories 2= 1 and
recoded as Yes and No – i.e., unemployed and employed respectively.
For the distributions by demographic characteristics, the mean of each category within variables was
computed to obtain the mean as the annual rate. This study also compared 2008 and 2014 of the
Labour Force Survey to take into account differences in those years and their impact on
unemployment.
Table 1: Definition of dependent Variable
Definition of dependent variable
Variable Categories
Unemployment status
1. Yes (Unemployed)
0. No (Employed)
Major labour market categories
An unemployed person is defined under international guidelines as “a person within the economi-
cally active population who: did not work during the seven days prior to census night, and would
have liked to work, and was available to start work within a week before the interview and had taken
active steps to look for work or to start some form of business in the four weeks prior to the
interview” (Stats SA, 2001).
12
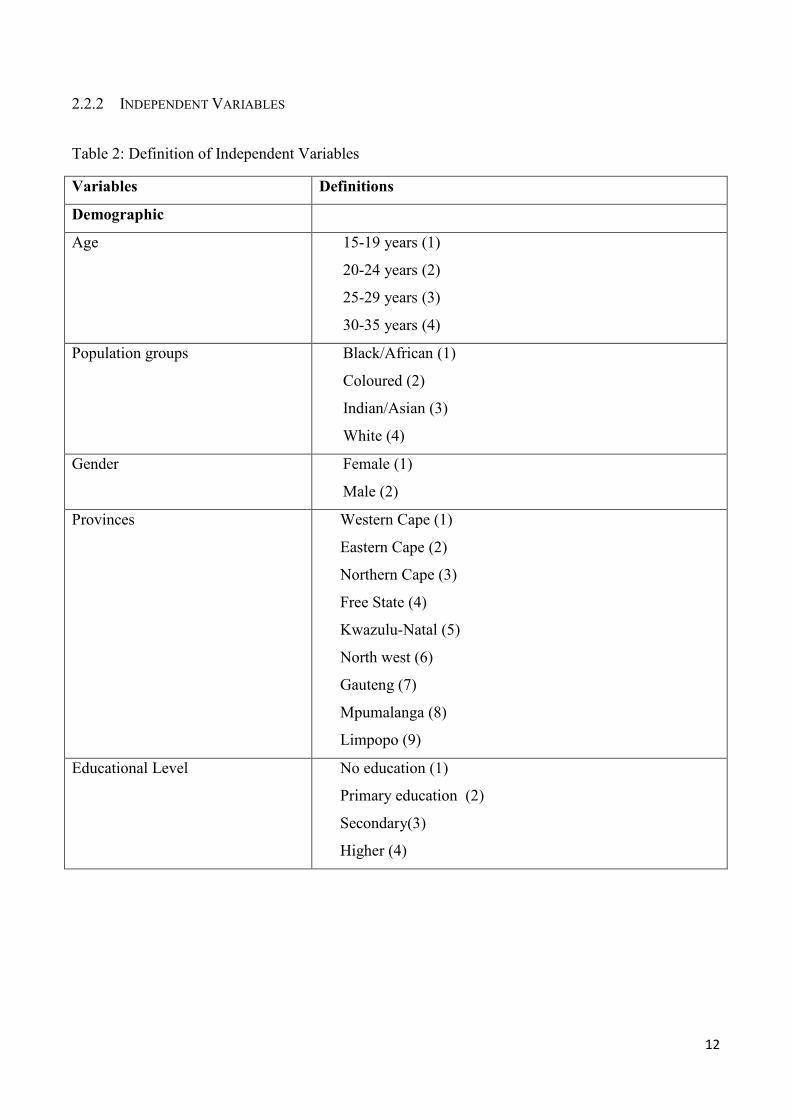
2.2.2 INDEPENDENT VARIABLES
Table 2: Definition of Independent Variables
Variables Definitions
Demographic
Age 15-19 years (1)
20-24 years (2)
25-29 years (3)
30-35 years (4)
Population groups Black/African (1)
Coloured (2)
Indian/Asian (3)
White (4)
Gender Female (1)
Male (2)
Provinces
Western Cape (1)
Eastern Cape (2)
Northern Cape (3)
Free State (4)
Kwazulu-Natal (5)
North west (6)
Gauteng (7)
Mpumalanga (8)
Limpopo (9)
Educational Level No education (1)
Primary education (2)
Secondary(3)
Higher (4)

13
2.3 HYPOTHESES
Ho: There is no association between education level and unemployment among youth in South
Africa.
H1: There is an association between education level and unemployment among youth in South
Africa.
Ho: There is no association between gender and unemployment among youth in South Africa.
H1: There is an association between gender and unemployment among youth in South Africa.
Ho: There is no association between population group and unemployment among youth in South
Africa.
H1: There is an association between population group and unemployment among youth in South
Africa.
Ho: There is no association between province and unemployment among youth in South Africa.
H1: There is an association between province and unemployment among youth in South Africa.

14
CHAPTER 3
3 RESULTS
3.1 INTRODUCTION
This chapter begins by presenting results of the characteristics of the survey respondents. This is
followed by a presentation of the results of the association between the dependent variable
unemployment and the independent variables including age, sex, population group, provinces and
educational level.
3.2 CHARACTERISTICS OF THE RESPONDENTS
3.2.1 SOCIO-DEMOGRAPHIC CHARACTERISTICS OF THE RESPONDENTS
This section of the study focused on the univariate analysis of the 2008 and 2014 QLFS data. The
analysis generated the following results shown in table 4.

15
Table 3: Weighted percentage distribution of South African youth, by selected social and
demographic characteristics, SAQLFS, 2008 and 2014
Characteristics 2008 2014
Frequency Per cent Frequency Per cent
Age
15 - 19
20 - 24
25 - 29
30 - 35
Total
4988542
47042601
4441025
4858775
18992602
26.3
24.7
23.4
25.6
100
5163576
5075231
4805702
5242423
20286931
25.5
25.0
23.7
25.8
100.0
Gender
Male
Female
Total
9467309
9525294
18992602
49.8
50.2
100
10232149
10054782
20286931
50.4
49.6
100.0
Population group
White
Coloured
Indian/Asian
African/Black
Total
1325458
463150
1648231
15555763
18992602
7.0
2.4
8.7
81.9
100
1245304
478204
1694707
16868715
20286931
6.1
2.4
8.4
83.1
100.0
Provinces
Limpopo
KwaZulu-Natal
Eastern Cape
North West
Free State
Northern Cape
Gauteng
Mpumalanga
Western Cape
Total
2031268
3795438
2381004
1260697
1053947
399664
4554980
1507180
2008424
18992607
10.7
20.0
12.5
6.64
5.5
2.1
24.0
7.9
7.94
100
2237548
4046650
2530948
1339964
1075241
425505
4821124
1651597
2158354
20286931
11.0
19.9
12.5
6.6
5.3
2.1
23.8
8.1
10.6
100.0
Educational Level
Primary & No Education
Secondary Education
Higher Education
Total
1652409
10436503
6903690
18992602
8.7
54.9
36.35
100.0
1960336
16227793
2058763
20246893
9.7
80.1
10.2
100.0
The weighted frequencies are approximately the same as the unweighted frequencies. The difference in the sum is
possibly due to rounding errors.

16
As shown in Table 4, the 15-19 years age group made up the largest group (26%) amongst the youth
who participated in the study in 2008. The lowest age group 25-29 have 23%, the other remaining
age groups have 25% in 2008 and 2014 respectively. There are more females (50.2%) than males
(49.8%) in 2008 and participation is opposite with more males than females in 2014.
Gauteng had the highest percentage of participants in the study making up 24% in 2008 and 23.8% in
2014 with Northern Cape having the least percentage of 2.1% in both years respectively. The other
provinces had relatively high percentages such as KwaZulu-Natal 20%, Eastern Cape 12.5%,
Limpopo 11% and Western Cape 10.7%.
From the study, it was noted that around 82% of the respondents were African or Black whilst the
other remaining percentage shared amongst coloured, Indian/Asian and White in 2008. The situation
slightly changes in 2014 with 83% of the respondents being African or Black. In terms of levels of
education of the youth participants, 80% had secondary education followed by 10% who had higher
education and 9% had had primary education in 2014. In 2008, 55% had secondary education
followed by 36% who had higher education and 9% had had primary education
4.2.2 LABOUR FORCE CHARACTERISTICS OF THE RESPONDENTS
From the table 4, a distinction was made to youth who participate in labour force and those who did
not participate in labour force. In 2008 those who were participating were 53.8% and decreased to
49.4% in 2014.

Table 4: Weighted percentage distribution of Youth, by selected Labour Force Characteristics, QLFS, 2008 and 2014
Characteristics Frequency Percent
Youth Labour
Force
Participation
Status Frequency Percent
Unemploy
ment Rate
Employment/
Population
Ratio
(absorption
rate)
Labour Force
Participation
Rate
2008
Employed 6955633 36.6
Yes (Participate) 10218335 53.8
31.9 36.6 53.8
Unemployed 3262702 17.2
Discouraged job seeker 840340 4.4 No (Not
Participate) 8774268 46.2 Other not economically active 7933928 41.8
Total 18992603 100.0 18992603 100
2014
Employed 6480519 31.9
Yes (Participate) 10012142 49.4
35.3 31.9 49.4
Unemployed 3531623 17.4
Discouraged job seeker 1595069 7.9 No (Not
Participate) 10274790 50.6 Other not economically active 8679721 42.8
Total 20286932 100.0 20286932 100.0

Reflecting to quarterly change in employment and unemployment, the unemployment rate increased
from 2008 to 2014 with rates from 31.9 to 35.3 respectively. The opposite results were visible with
absorption rate which decreased from 2008 to 2014. Absorption rate moved from 36.6 in 2008 to
31.9 in 2014.
Table 4.4: Unemployment and Education Level Crosstabulation
Total No/ Primary
education
Secondary
Education
Higher
Education
2008
Unemployed
Yes (Not
employed)
Count 257227 1643609 1361871 3262702
% within
Educational
Level 33.3
38.0% 26.6% 31.9%
Row % 7.9 50.4 41.74 100.0
No
(Employed)
Count 514194 2677805 3763633 6955632
% within
Educational
Level 66.7
62.0 73.4 68.0
Row % 7.4 38.5 54.1 100.0
Total Count 736272 7573630 1674450 9984352
% within
Educational
Level
100.00% 100.00% 100.00% 100.00%
2014
Unemployed
Yes (Not
employed)
Count 269319 2920375 333229 3522922
% within
Educational
Level 36.6
38.60% 19.90% 35.30%
Row % 7.6 82.9 9.5 100.0
No
(Employed)
Count 466953 4653254 1341222 6461429
% within
Educational
Level 63.4
61.40% 80.10% 64.70%
Row % 7.2 72.0 20.8 100.0
Total Count 736272 7573630 1674450 9984352
% within
Educational
Level
100.00% 100.00% 100.00% 100.00%

19
From table 4.4 and 4.5 2014, among youth who are unemployed only 7.6% (7.9%: 2008) were found
to be with no and primary schooling. A big change was observed from youth with secondary
education who made 82.9% (50.4%: 2008) of unemployed youth. The proportions of youth who are
unemployed dwindles 9.5% (41.7%: 2008) of youth with higher education.
There seems to be a difference in terms of employed and unemployed between youth with no
schooling, primary education, secondary and higher education. Nonetheless, it is noted that youth
with higher education are 18.7% (80.1-61.4%) more likely to be employed compared with youth
having secondary education. Compared with youth with primary education it is noted that youth with
secondary education are also 9.2% more likely to be unemployed compared with youth having
primary education?
There seem to be some little differences in unemployment especially among youth with no schooling
and with those youth with higher education.
Table 4.4.1 Chi Square Tests for association between selected variables and Unemployment
Value df Asymp.Sig. (2
Sided)
Education Level and Unemployment
2008
Pearson Chi-Square 163.3 2 .000
No. of valid Cases 16733
2014
Pearson Chi-Square 271.3 2 .000
No. of valid Cases 13913

20
Gender and Unemployment
2008
Pearson Chi-Square 154.7 1 .000
No. of valid Cases 16733
2014
Pearson Chi-Square 58.9 1 .000
No. of valid Cases 13913
Population group and Unemployment
2008
Pearson Chi-Square 510.8 3 .000
No. of valid Cases 16733
2014
Pearson Chi-Square 398.5 3 .000
No. of valid Cases 13913
Provinces and Unemployment
2008
Pearson Chi-Square 179.9 8 .000
No. of valid Cases 167333
2014
Pearson Chi-Square 221.3 8 .000
No. of valid Cases 13913
From table 4.4.1 above, the observed results in 2008 indicate that there is statistical significant
relationship between education level and unemployment (Chi-Square with two degrees of freedom =
163.3, p = 0.000). In 2014 (Chi-Square with two degrees of freedom = 271.3, p = 0.000).
21
• The observed results in 2008 indicate that there is statistical significant relationship between
gender and unemployment (Chi-Square with one degree of freedom = 154.7, p = 0.000). In
2014 (Chi-Square with one degree of freedom = 58.9, p = 0.000).
• The observed results in 2008 indicate that there is statistical significant relationship between
population group and unemployment (Chi-Square with three degrees of freedom = 501.8, p =
0.000). In 2014 (Chi-Square with three degrees of freedom = 398.5, p = 0.000).
• The observed results in 2008 indicate that there is statistical significant relationship between
province and unemployment (Chi-Square with eight degrees of freedom = 179.9, p = 0.000).
In 2014 (Chi-Square with eight degrees of freedom = 221.3, p = 0.000).
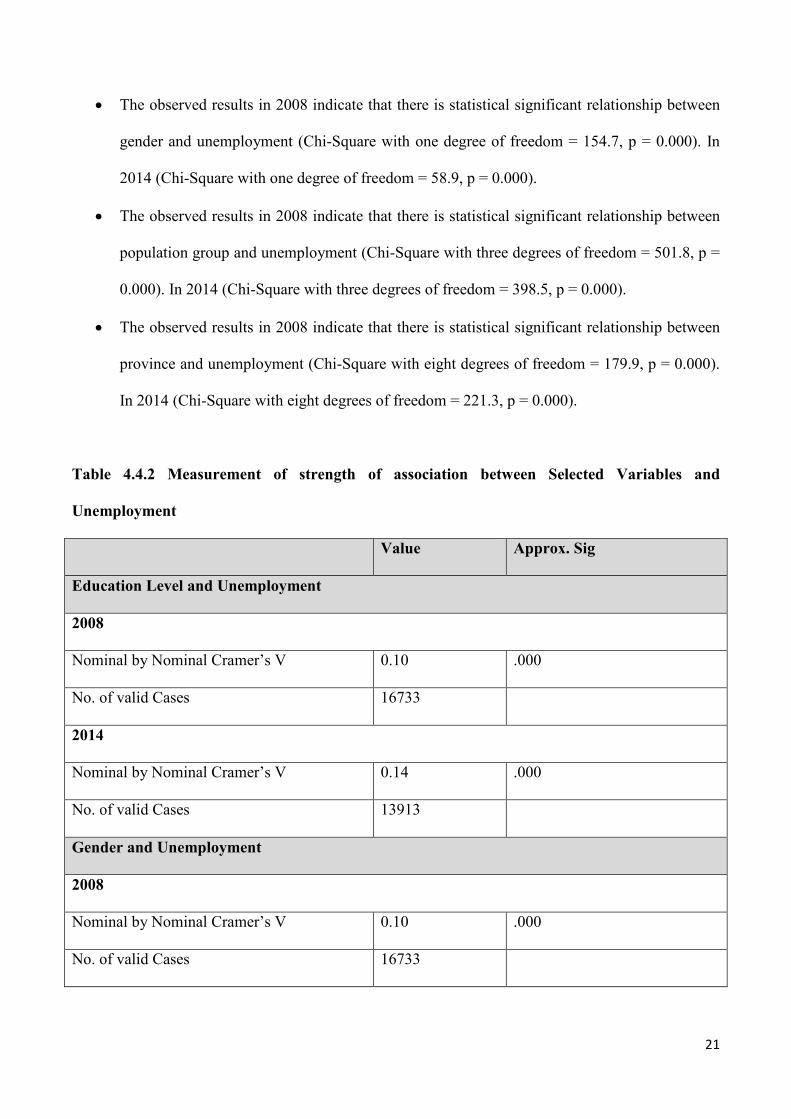
Table 4.4.2 Measurement of strength of association between Selected Variables and
Unemployment
Value Approx. Sig
Education Level and Unemployment
2008
Nominal by Nominal Cramer’s V 0.10 .000
No. of valid Cases 16733
2014
Nominal by Nominal Cramer’s V 0.14 .000
No. of valid Cases 13913
Gender and Unemployment
2008
Nominal by Nominal Cramer’s V 0.10 .000
No. of valid Cases 16733

22
2014
Nominal by Nominal Cramer’s V 0.07 .000
No. of valid Cases 13913
Population group and Unemployment
2008
Nominal by Nominal Cramer’s V 0.17 .000
No. of valid Cases 16733
2014
Nominal by Nominal Cramer’s V 0.17 .000
No. of valid Cases 13913
Provinces and Unemployment
2008
Nominal by Nominal Cramer’s V 0.10 .000
No. of valid Cases 16733
2014
Nominal by Nominal Cramer’s V 0.13 .000
No. of valid Cases 13913
• The Cramer’s V coefficient in table 4.4.2 which measures the strength of the association was
noted as 0.10 in 2008 (2014=0.14) and the result is statistically significant with a p-value
<0.05. There is a weak relationship between unemployment and education level.
• The second Cramer’s V coefficient in table 4.4.2 which measures the strength of the
association between unemployment and gender was noted as 0.10 in 2008 (2014=0.06) and
23
the result is statistically significant with a p-value <0.05. There is a weak and very weak
relationship between unemployment and gender.
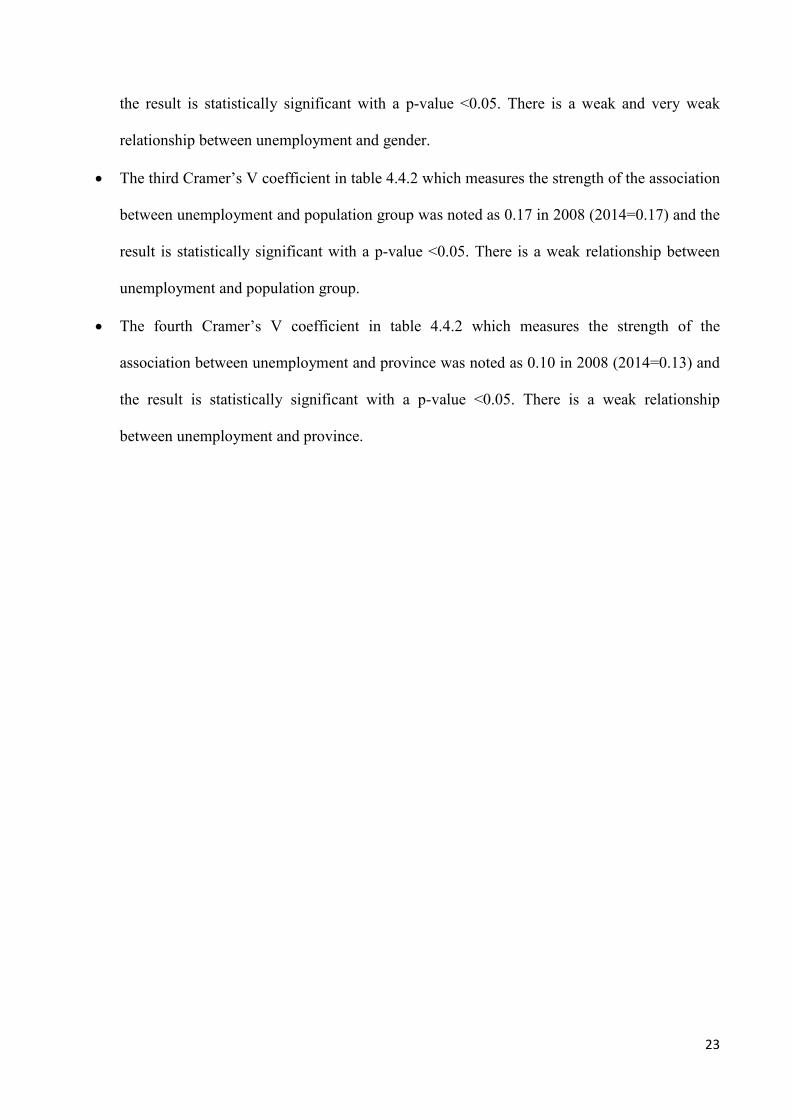
• The third Cramer’s V coefficient in table 4.4.2 which measures the strength of the association
between unemployment and population group was noted as 0.17 in 2008 (2014=0.17) and the
result is statistically significant with a p-value <0.05. There is a weak relationship between
unemployment and population group.
• The fourth Cramer’s V coefficient in table 4.4.2 which measures the strength of the
association between unemployment and province was noted as 0.10 in 2008 (2014=0.13) and
the result is statistically significant with a p-value <0.05. There is a weak relationship
between unemployment and province.
24
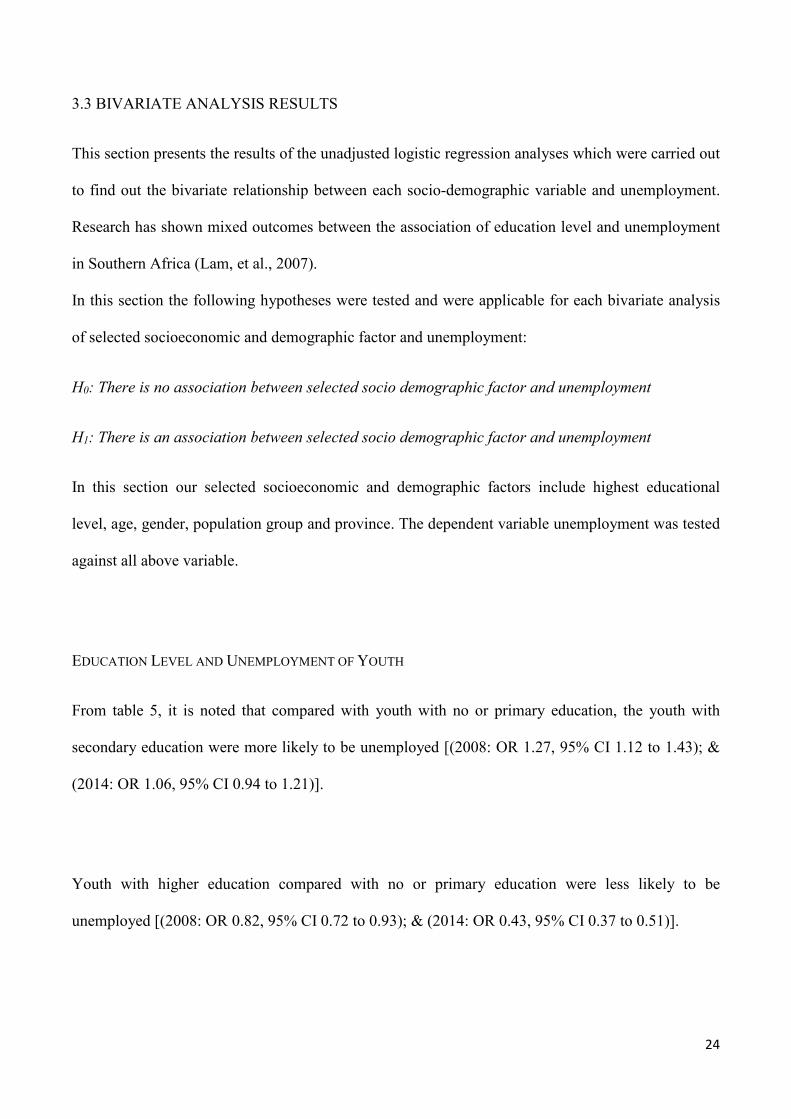
3.3 BIVARIATE ANALYSIS RESULTS
This section presents the results of the unadjusted logistic regression analyses which were carried out
to find out the bivariate relationship between each socio-demographic variable and unemployment.
Research has shown mixed outcomes between the association of education level and unemployment
in Southern Africa (Lam, et al., 2007).
In this section the following hypotheses were tested and were applicable for each bivariate analysis
of selected socioeconomic and demographic factor and unemployment:
H0: There is no association between selected socio demographic factor and unemployment
H1: There is an association between selected socio demographic factor and unemployment
In this section our selected socioeconomic and demographic factors include highest educational
level, age, gender, population group and province. The dependent variable unemployment was tested
against all above variable.
EDUCATION LEVEL AND UNEMPLOYMENT OF YOUTH
From table 5, it is noted that compared with youth with no or primary education, the youth with
secondary education were more likely to be unemployed [(2008: OR 1.27, 95% CI 1.12 to 1.43); &
(2014: OR 1.06, 95% CI 0.94 to 1.21)].
Youth with higher education compared with no or primary education were less likely to be
unemployed [(2008: OR 0.82, 95% CI 0.72 to 0.93); & (2014: OR 0.43, 95% CI 0.37 to 0.51)].

25
However in table 5, the observed Chi-Square Statistic had p-values <0.05 and so we reject the null
hypothesis. Thus we find support for the research hypothesis and can conclude that education level
was associated with unemployment.
AGE AND UNEMPLOYMENT OF YOUTH
Compared with youth of the age group 15-19 years youth aged 20-24 years were less likely to be
unemployed [(2008: OR 0.62, 95% CI 0.54 to 0.71); & (2014: OR 0.64, 95% CI 0.52 to 0.78)].
Youth aged 25-29 years, compared with the youth aged 15- 19 years were less likely to be
unemployed [(2008: OR 0.34, 95% CI 0.30 to 0.40); & (2014: OR 0.31, 95%CI 0.25 to 0.38)].
The youth aged 30-35 years, compared with the youth aged 15- 19 years were less likely to be
unemployed [(2008: OR 0.24, 95% CI 0.21 to 0.28); & (2014: OR 0.20, 95% CI 0.17 to 0.25)].
However in table 8, the observed Chi-Square Statistic had p-values <0.05 and so we reject the null
hypothesis. Thus, we find support for the research hypotheses and can conclude that age was
associated with unemployment.

26
Table 5: Unadjusted odd ratios of the associations between selected characteristics and
unemployment
Characteristics
Unemployment status
2008 2014
N 16733 N 13913
OR (95% CI) OR (95% CI)
Education Level
No & Primary Education
Secondary Education
Higher Education
Pearson Chi-Square p-value
1.00
1.27 (1.12-1.43)
0.82 (0.72-0.93)*
0.00*
1.00
1.06 (0.94-1.21)
0.43 (0.37-0.51)*
0.00*
Age
15-19
20-24
25-29
30-35
Pearson Chi-Square p-value
1.00
0.62 (0.54- 0.71)*
0.34 (0.30- 0.40)*
0.24 (0.21- 0.28)*
0.00*
1.00
0.64 (0.52- 0.78)*
0.31 (0.25- 0.38)*
0.20 (0.17- 0.25)*
0.00*
Gender
Male
Female
Pearson Chi-Square p-value
1.00
1.50 (1.41- 1.60)*
0.00*
1.00
1.31 (1.22- 1.40)*
0.00*
Population Group
White
Coloured
Indian/Asian
African/Black
Pearson Chi-Square p-value
1.00
2.37 (1.69- 3.34)*
4.80 (3.73- 6.17)*
7.42 (5.88- 9.36)*
0.00*
1.00
1.75 (1.19- 2.56)*
4.92 (3.79- 6.39)*
6.53 (5.14- 8.30)*
0.00*
Province
Limpopo
Kwazulu Natal
Eastern Cape
North West
Free State
Northern Cape
Gauteng
Mpumalanga
Western Cape
Pearson Chi-Square p-value
1.00
0.56 (0.49- 0.64)*
0.72 (0.62- 0.84)*
0.61 (0.51- 0.71)*
0.70 (0.60- 0.82)*
0.65 (0.55- 0.78)*
0.58 (0.51- 0.66)*
0.56 (0.48- 0.65)*
0.41 (0.35- 0.47)*
0.00*
1.00
1.05 (0.89- 1.23)*
1.72 (1.44- 2.05)*
1.50 (1.24- 1.82)*
2.16 (1.81- 2.58)*
1.81 (1.49- 2.21)*
1.51 (1.29- 1.77)*
1.89 (1.59- 2.25)*
1.06 (0.89- 1.25)*
0.00*
*p<0.05. Values are odds ratios (95% Confidence Interval). Missing cases were excluded from analysis

27
GENDER AND UNEMPLOYMENT OF YOUTH
Compared with male youth, female youth were more likely to be unemployed [(2008: OR 1.50, 95%
CI 1.41 to 1.60); & (2014: OR 1.31, 95% CI 1.22 to 1.40)].
However in table 5, the observed Chi-Square Statistic had p-values <0.05 and so we reject the null
hypothesis. Thus, we find support for the research hypotheses and can conclude that gender was
associated with unemployment.
POPULATION GROUP AND UNEMPLOYMENT OF YOUTH
From table 5, compared with youth who are White, coloured youth were more likely to be
unemployed [(2008: OR 2.37, 95% CI 1.69 to 3.34); & (2014: OR 1.75, 95% CI 1.19 to 2.56)].
Indian or Asian compared with youth who are White, were more likely to be unemployed [(2008:
OR 4.80, 95% CI 3.73 to 6.17); & (2014: OR 4.92, 95% CI 3.79 to 6.39)].
Lastly, African or black compared with youth who are White, were more likely to be unemployed
[(2008: OR 7.42, 95% CI 5.88 to 9.36); & (2014: OR 6.53, 95% CI 5.14 to 8.30)].
However in table 5, the observed Chi-Square Statistic had p-values <0.05 and so we reject the null
hypothesis. Thus, we find support for the research hypotheses and can conclude that population
group was associated with unemployment.
28
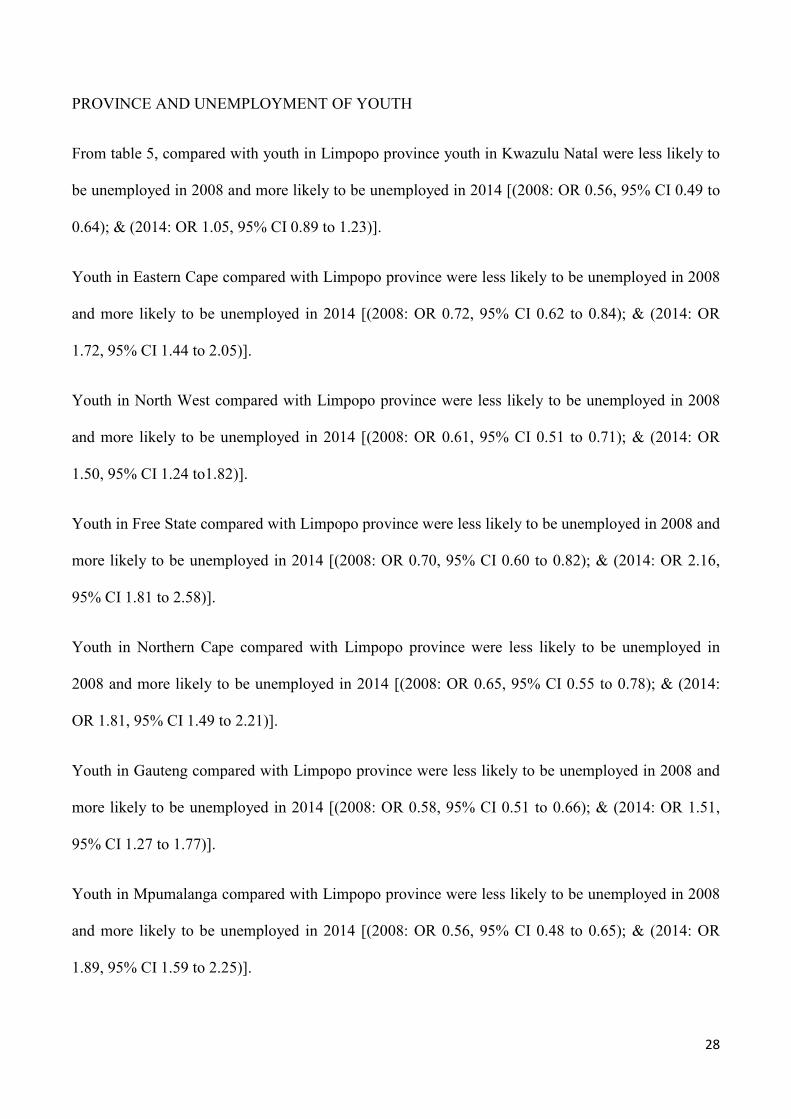
PROVINCE AND UNEMPLOYMENT OF YOUTH
From table 5, compared with youth in Limpopo province youth in Kwazulu Natal were less likely to
be unemployed in 2008 and more likely to be unemployed in 2014 [(2008: OR 0.56, 95% CI 0.49 to
0.64); & (2014: OR 1.05, 95% CI 0.89 to 1.23)].
Youth in Eastern Cape compared with Limpopo province were less likely to be unemployed in 2008
and more likely to be unemployed in 2014 [(2008: OR 0.72, 95% CI 0.62 to 0.84); & (2014: OR
1.72, 95% CI 1.44 to 2.05)].
Youth in North West compared with Limpopo province were less likely to be unemployed in 2008
and more likely to be unemployed in 2014 [(2008: OR 0.61, 95% CI 0.51 to 0.71); & (2014: OR
1.50, 95% CI 1.24 to1.82)].
Youth in Free State compared with Limpopo province were less likely to be unemployed in 2008 and
more likely to be unemployed in 2014 [(2008: OR 0.70, 95% CI 0.60 to 0.82); & (2014: OR 2.16,
95% CI 1.81 to 2.58)].
Youth in Northern Cape compared with Limpopo province were less likely to be unemployed in
2008 and more likely to be unemployed in 2014 [(2008: OR 0.65, 95% CI 0.55 to 0.78); & (2014:
OR 1.81, 95% CI 1.49 to 2.21)].
Youth in Gauteng compared with Limpopo province were less likely to be unemployed in 2008 and
more likely to be unemployed in 2014 [(2008: OR 0.58, 95% CI 0.51 to 0.66); & (2014: OR 1.51,
95% CI 1.27 to 1.77)].
Youth in Mpumalanga compared with Limpopo province were less likely to be unemployed in 2008
and more likely to be unemployed in 2014 [(2008: OR 0.56, 95% CI 0.48 to 0.65); & (2014: OR
1.89, 95% CI 1.59 to 2.25)].
29
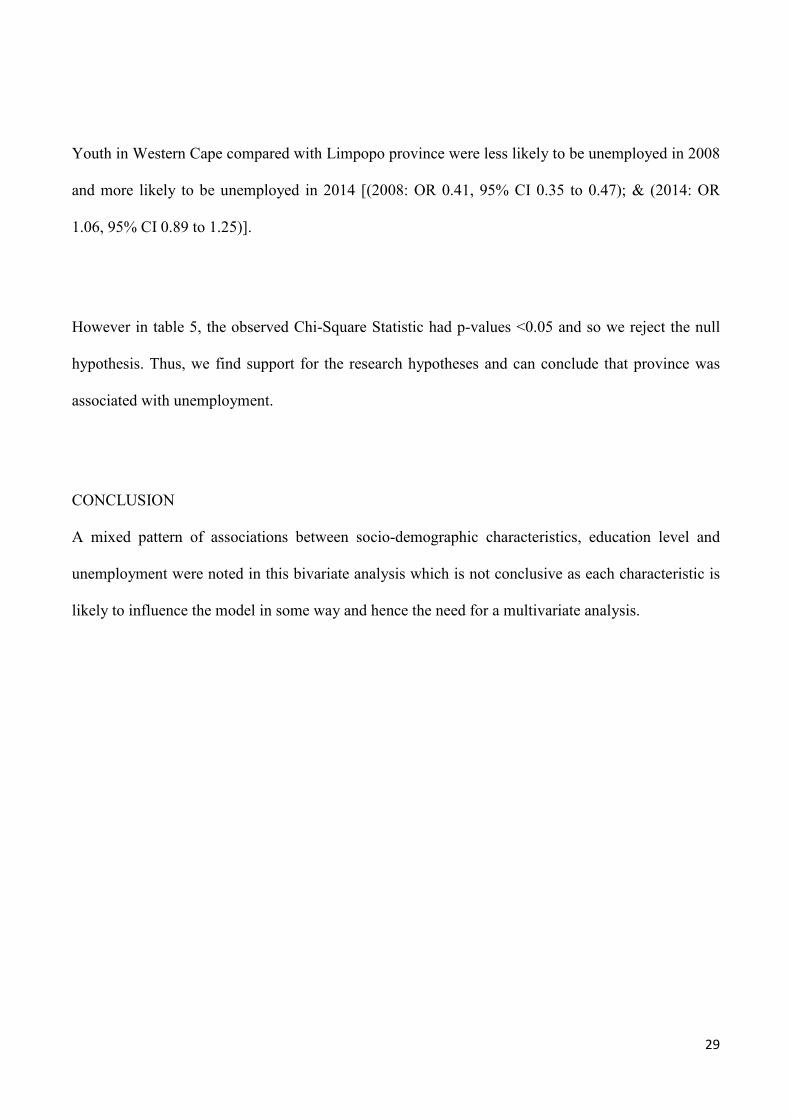
Youth in Western Cape compared with Limpopo province were less likely to be unemployed in 2008
and more likely to be unemployed in 2014 [(2008: OR 0.41, 95% CI 0.35 to 0.47); & (2014: OR
1.06, 95% CI 0.89 to 1.25)].
However in table 5, the observed Chi-Square Statistic had p-values <0.05 and so we reject the null
hypothesis. Thus, we find support for the research hypotheses and can conclude that province was
associated with unemployment.
CONCLUSION
A mixed pattern of associations between socio-demographic characteristics, education level and
unemployment were noted in this bivariate analysis which is not conclusive as each characteristic is
likely to influence the model in some way and hence the need for a multivariate analysis.
30
CHAPTER 4
4 MULTIVARIATE ANALYSES
4.1 INTRODUCTION
This chapter uses multivariate analysis to evaluate the effect of level of education and selected socio-
demographic variables (age, gender, population group, type of residence and province) on
unemployment. This method of analysis is more advanced than the bivariate analysis because it
simultaneously analyses the influence of several independent variables, on the dependent variable.
In this study the dependent variables included among others the following labour force status:
• Unemployment
The logit model was adopted to estimate odds ratios for youth aged 15 to 35 years old who had
reported that they are in labour force. The logit model was selected for use because of its strengths in
overcoming the inherent challenges associated with linear probability models as logit model provides
relative estimation based on probabilities (Garcio, et al., 2008). Two estimation models are presented
in this study. For the purposes of this study, Model 1 used estimates for education level, age and
gender as the independent variables. In model 2, population group, and province are added because
these characteristics are known to influence labour force status (Garcio, et al., 2008). The table
below include a summary of results of final model 1 and 2. Detailed results of the different models
are attached in the appendix.

31
4.2 MULTIPLE LOGISTIC REGRESSION MODELLING RESULTS
Table 6: Odds ratios of the associations between selected characteristics and unemployment based on
final models
Unemployment status (Yes/ No)
Characteristics
2008 2014
N 16733 N 13913
OR 95.0% C.I. P-value OR 95.0% C.I. P-value
Modelling 1: Full
Education Level
No & Primary Education (Ref)
Secondary Education
Higher Education
1.00
1.24 (1.09- 1.42) 0.001
0.91 (0.79- 1.04) 0.158
1.00
1.10 (0.96- 1.26) 0.177
0.56 (0.47- 0.67)* <0.001
Age
15-19 (Ref)
20-24
25-29
30-35
1.00
0.58 (0.50- 0.67)* <0.001
0.30 (0.26- 0.35)* <0.001
0.21 (0.19- 0.25)* <0.001
1.00
0.61 (0.50- 0.76)* <0.001
0.29 (0.24- 0.36)* <0.001
0.19 (0.16- 0.24)* <0.001
Gender
Male (Ref)
Female
1.00
1.61 (1.51- 1.72)* <0.001
1.00
1.44 (1.33- 1.55)* <0.001
Population Group
White (Ref)
Coloured
Indian/Asian
African/Black
1.00
2.25 (1.59- 3.21)* <0.001
4.04 (3.12- 5.25)* <0.001
6.39 (5.05- 8.09)* <0.001
1.00
2.08 (1.40- 3.10)* <0.001
3.99 (3.06- 5.22)* <0.001
5.96 (4.66- 7.63)* <0.001
Province
Limpopo (Ref)
Kwazulu Natal
Eastern Cape
North West
Free State
Northern Cape
Gauteng
Mpumalanga
Western Cape
1.00
0.60 (0.52- 0.70)* <0.001
0.77 (0.65- 0.91) <0.002
0.68 (0.57- 0.81)* <0.001
0.74 (0.62- 0.88)* <0.001
0.81 (0.66- 0.99) <0.038
0.71 (0.61- 0.82)* <0.001
0.55 (0.47- 0.65)* <0.001
0.53 (0.44- 0.63)* <0.001
1.00
1.10 (0.92- 1.31) 0.292
1.87 (1.54- 2.26)* <0.001
1.46 (1.19- 1.79)* <0.001
2.31 (1.90- 2.81)* <0.001
2.05 (1.64- 2.56)* <0.001
1.81 (1.51- 2.17)* <0.001
1.93 (1.61- 2.31)* <0.001
1.38 (1.13- 1.70) 0.002

32
Modelling 2: Reduced
Education Level
No & Primary Education (Ref)
Secondary Education
Higher Education
1.00
1.15 (1.01- 1.31) 0.035
0.73 (0.64- 0.83)* <0.001
1.00
1.02 (0.89- 1.17) 0.734
0.46 (0.39- 0.54)* <0.001
Age
15-19 (Ref)
20-24
25-29
30-35
1.00
0.65 (0.56- 0.74)* <0.001
0.35 (0.30- 0.40)* <0.001
0.25 (0.21- 0.28)* <0.001
1.00
0.68 (0.56- 0.84)* <0.001
0.34 (0.28- 0.41)* <0.001
0.22 (0.18- 0.27)* <0.001
Gender
Male (Ref)
Female
1.00
1.62 (1.51- 1.73)* <0.001
1.00
1.43 (1.33- 1.89)* <0.001
Ref = Reference category; * p<0.05; * p<0.001; Missing cases were not considered in the analyses.
33
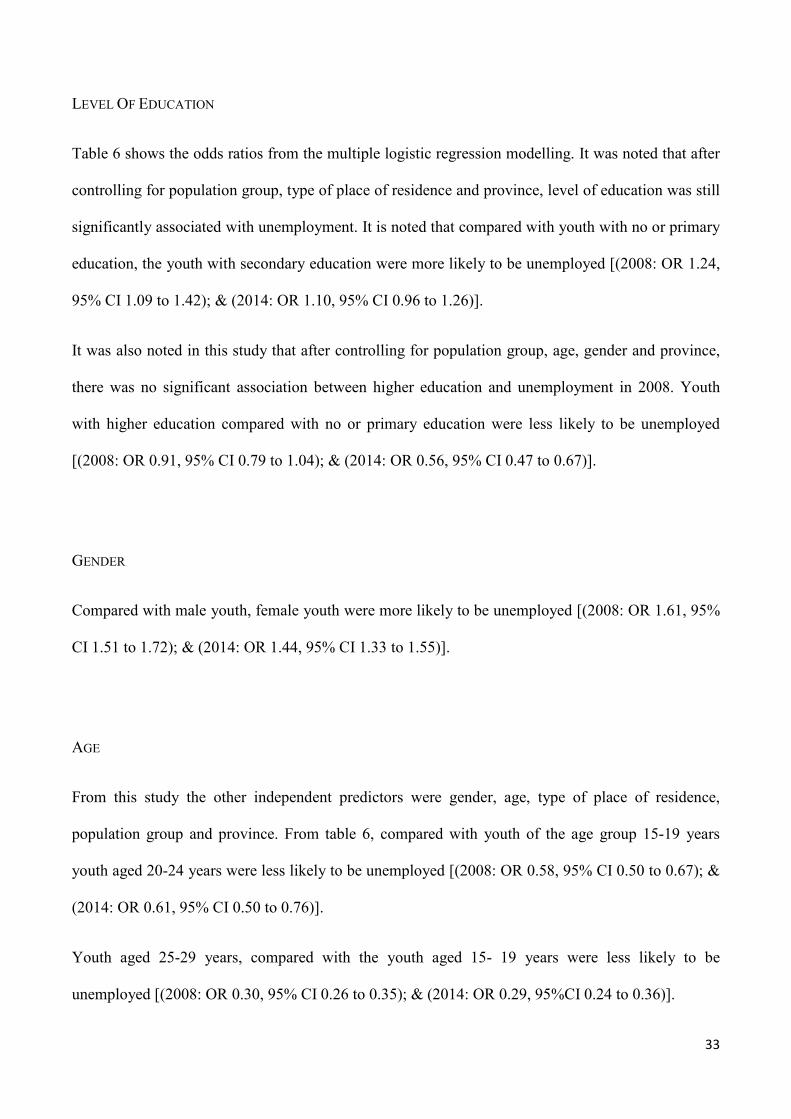
LEVEL OF EDUCATION
Table 6 shows the odds ratios from the multiple logistic regression modelling. It was noted that after
controlling for population group, type of place of residence and province, level of education was still
significantly associated with unemployment. It is noted that compared with youth with no or primary
education, the youth with secondary education were more likely to be unemployed [(2008: OR 1.24,
95% CI 1.09 to 1.42); & (2014: OR 1.10, 95% CI 0.96 to 1.26)].
It was also noted in this study that after controlling for population group, age, gender and province,
there was no significant association between higher education and unemployment in 2008. Youth
with higher education compared with no or primary education were less likely to be unemployed
[(2008: OR 0.91, 95% CI 0.79 to 1.04); & (2014: OR 0.56, 95% CI 0.47 to 0.67)].
GENDER
Compared with male youth, female youth were more likely to be unemployed [(2008: OR 1.61, 95%
CI 1.51 to 1.72); & (2014: OR 1.44, 95% CI 1.33 to 1.55)].
AGE
From this study the other independent predictors were gender, age, type of place of residence,
population group and province. From table 6, compared with youth of the age group 15-19 years
youth aged 20-24 years were less likely to be unemployed [(2008: OR 0.58, 95% CI 0.50 to 0.67); &
(2014: OR 0.61, 95% CI 0.50 to 0.76)].
Youth aged 25-29 years, compared with the youth aged 15- 19 years were less likely to be
unemployed [(2008: OR 0.30, 95% CI 0.26 to 0.35); & (2014: OR 0.29, 95%CI 0.24 to 0.36)].
34
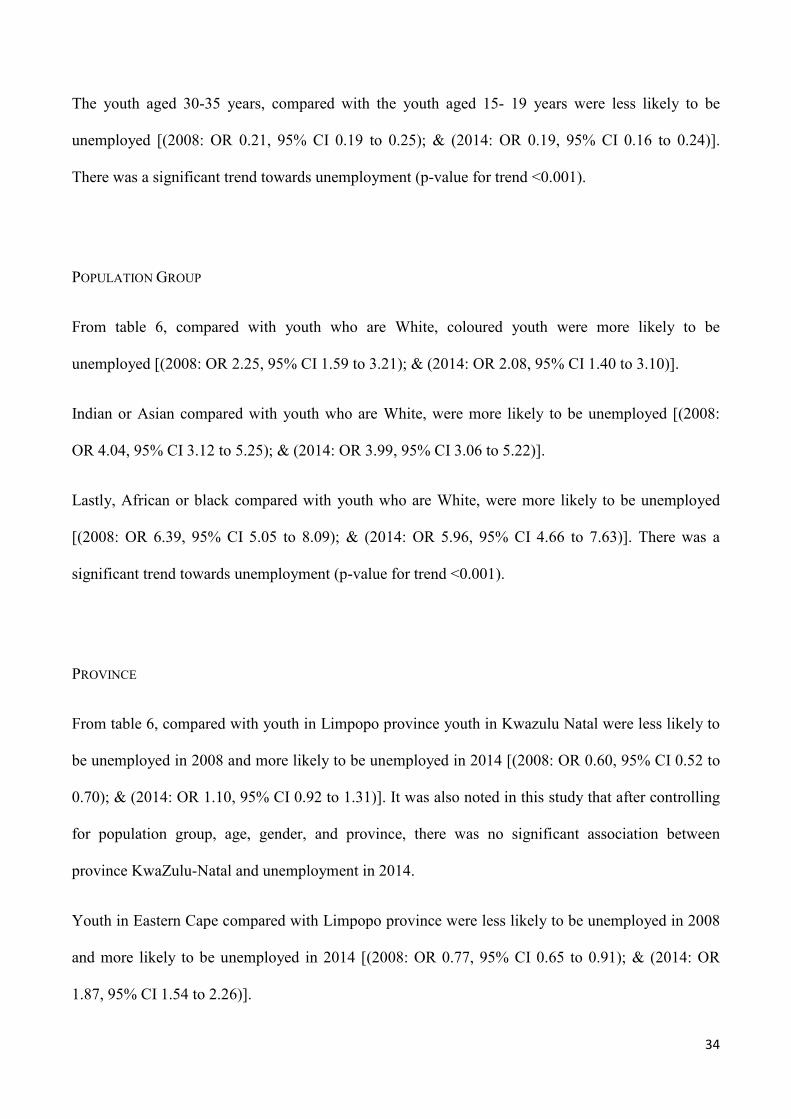
The youth aged 30-35 years, compared with the youth aged 15- 19 years were less likely to be
unemployed [(2008: OR 0.21, 95% CI 0.19 to 0.25); & (2014: OR 0.19, 95% CI 0.16 to 0.24)].
There was a significant trend towards unemployment (p-value for trend <0.001).
POPULATION GROUP
From table 6, compared with youth who are White, coloured youth were more likely to be
unemployed [(2008: OR 2.25, 95% CI 1.59 to 3.21); & (2014: OR 2.08, 95% CI 1.40 to 3.10)].
Indian or Asian compared with youth who are White, were more likely to be unemployed [(2008:
OR 4.04, 95% CI 3.12 to 5.25); & (2014: OR 3.99, 95% CI 3.06 to 5.22)].
Lastly, African or black compared with youth who are White, were more likely to be unemployed
[(2008: OR 6.39, 95% CI 5.05 to 8.09); & (2014: OR 5.96, 95% CI 4.66 to 7.63)]. There was a
significant trend towards unemployment (p-value for trend <0.001).
PROVINCE
From table 6, compared with youth in Limpopo province youth in Kwazulu Natal were less likely to
be unemployed in 2008 and more likely to be unemployed in 2014 [(2008: OR 0.60, 95% CI 0.52 to
0.70); & (2014: OR 1.10, 95% CI 0.92 to 1.31)]. It was also noted in this study that after controlling
for population group, age, gender, and province, there was no significant association between
province KwaZulu-Natal and unemployment in 2014.
Youth in Eastern Cape compared with Limpopo province were less likely to be unemployed in 2008
and more likely to be unemployed in 2014 [(2008: OR 0.77, 95% CI 0.65 to 0.91); & (2014: OR
1.87, 95% CI 1.54 to 2.26)].
35
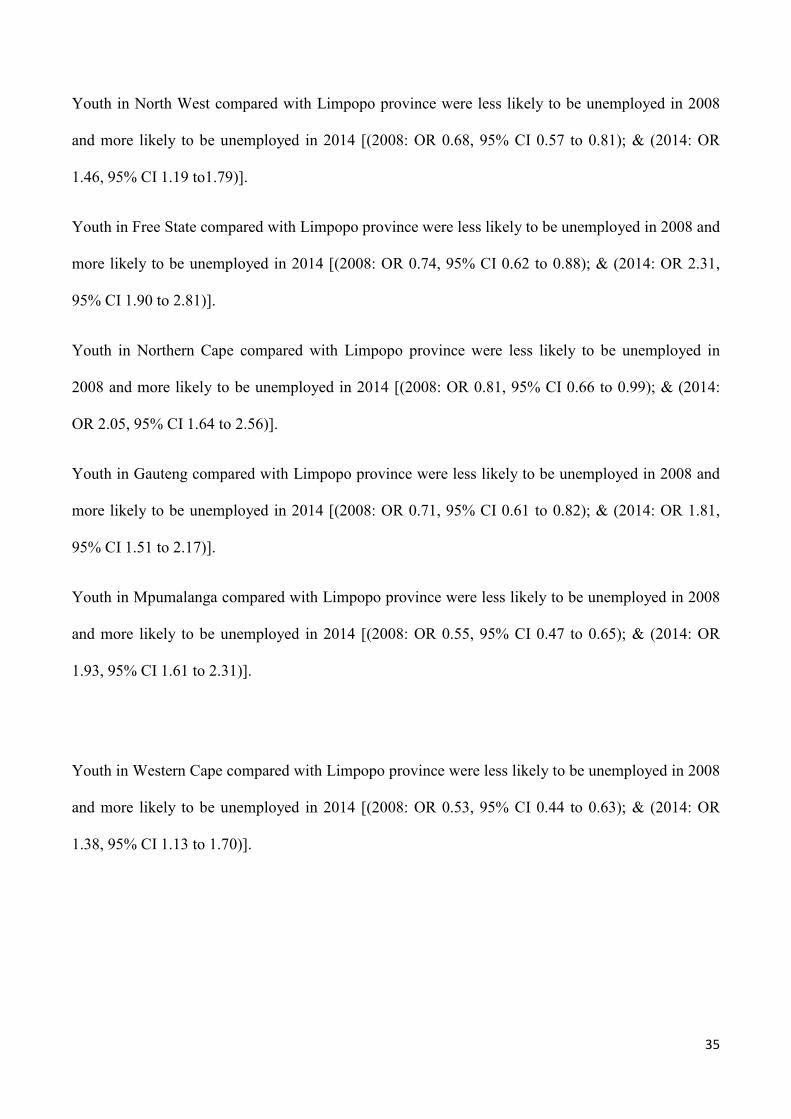
Youth in North West compared with Limpopo province were less likely to be unemployed in 2008
and more likely to be unemployed in 2014 [(2008: OR 0.68, 95% CI 0.57 to 0.81); & (2014: OR
1.46, 95% CI 1.19 to1.79)].
Youth in Free State compared with Limpopo province were less likely to be unemployed in 2008 and
more likely to be unemployed in 2014 [(2008: OR 0.74, 95% CI 0.62 to 0.88); & (2014: OR 2.31,
95% CI 1.90 to 2.81)].
Youth in Northern Cape compared with Limpopo province were less likely to be unemployed in
2008 and more likely to be unemployed in 2014 [(2008: OR 0.81, 95% CI 0.66 to 0.99); & (2014:
OR 2.05, 95% CI 1.64 to 2.56)].
Youth in Gauteng compared with Limpopo province were less likely to be unemployed in 2008 and
more likely to be unemployed in 2014 [(2008: OR 0.71, 95% CI 0.61 to 0.82); & (2014: OR 1.81,
95% CI 1.51 to 2.17)].
Youth in Mpumalanga compared with Limpopo province were less likely to be unemployed in 2008
and more likely to be unemployed in 2014 [(2008: OR 0.55, 95% CI 0.47 to 0.65); & (2014: OR
1.93, 95% CI 1.61 to 2.31)].
Youth in Western Cape compared with Limpopo province were less likely to be unemployed in 2008
and more likely to be unemployed in 2014 [(2008: OR 0.53, 95% CI 0.44 to 0.63); & (2014: OR
1.38, 95% CI 1.13 to 1.70)].

36
CHAPTER 5
DISCUSSION
5.1 CHARACTERISTICS OF THE RESPONDENTS
The main objective of this study was to examine the association between education level and
unemployment among youth in South Africa. A close look at the characteristics of the study
population revealed that minority of youth aged 15 to 19 are unemployed with 9% in 2008 (2014:
5%). Lam, et al., (2007) provided reason for non participation of 15-19 year-olds (many of whom
were found to be still be engaged in studies) for the period 1995 to 2005 are far below those of other
groups. Education also plays a role in whether youth seek and are able to find work. Youth may
decide not to pursue employment and to attend school instead; they may want to do both, but may
not have opportunities to work due to a lack of jobs. The rising rate of school enrollment has likely
influenced the downward trend in the E/P ratio for 15 to 19 year olds. Furthermore, it is also evident
from the study that unemployment is highest at the age group 20-24 and decreases with age from that
year: 15 to 19 years 8.5%; 20 to 24 years 35%; 25 to 29 years 30% and 30-35 years 27%.
This study has shown 48% of male youth were unemployed and with 52% of female youth are
unemployed. According to Lam, et al., (2007) in their study “Education and Youth Unemployment
in South Africa” unemployment differences by gender are also evident. Unemployed youth are fairly
evenly split by gender with only a slightly higher proportion of them being women. According to
Lam, et al., (2007) in 1995, 53% of unemployed youth 15-24 were women and this proportion has
remained fairly stable through to 2005 where 51% of unemployed were women. In keeping with the
above analysis, the unemployment patterns of youth 15-19 and 20-24 are treated separately. In
addition, the above study indicates that within-gender unemployment rates are higher among females

37
throughout the decade 1995 to 2005. It further indicates that unemployment rates increased up until
2002 and decreased thereafter (Lam, et al., 2007).
Clearly in the South African context, race is an important differentiating factor in labour market
behavior and outcomes. This study has also shown that African/ Black has the highest
unemployment of youth with 38.5% while the other population groups have lower proportions with
Coloured 15.2%, Indian/ Asian 34.2% and White 9.3%.. This results confirm what Lam, et al.,
(2007) found in their study that African youth 15-19 have the highest unemployment rates while
Coloured youth in this cohort have the lowest. High unemployment rates amongst this cohort are not
necessarily a bad sign as many of these youth are still at school. Conversely the relatively low
proportion of Coloured youth unemployed over the decade is cause for concern as this indicates early
exit from studies in an environment of mass unemployment. Among the older 20-24 cohort Africans
again display higher unemployment rates than the other population groups although their
unemployment rates together with those of Coloureds have generally decreased over the period. The
trend in White and Indian participation rates is less clear. It seems that unemployment rates initially
decreased for white youth in the 1990s and increased in the 2000s. Africans make up by far the
largest number of labour market participants. Given an increase of 16 percentage points in African
unemployment (looking at 1995 and 2005), it is clear that the increase in overall labour market
unemployment for this cohort over this decade has been driven by the African race group.
Unemployment rates of youth in 2008 were 31.9%, and increased in 2014 to 35.3% respectively.
Youth unemployment rates have generally been lower in the 2000s than in the 1990s. According to
the October Household Survey (OHS) data sets, in 1995 the participation rate of youth (using the
official South African definition of youth of 15 – 35 years old) was 42%, using the official, strict
38
definition of unemployment (requiring active job search). By 1999 this participation rate had
increased to 46%. In the 2000s youth participation rates were fairly stable at 52% in 2002 (using the
LFS data sets) and 50% in 2005. In terms of absolute numbers, slightly more non-participants and
less unemployed were captured in 2005 than in 2002. From 1995 to 1999, the increase in the youth
participation rate was mainly in the form of an increase in the numbers unemployed.
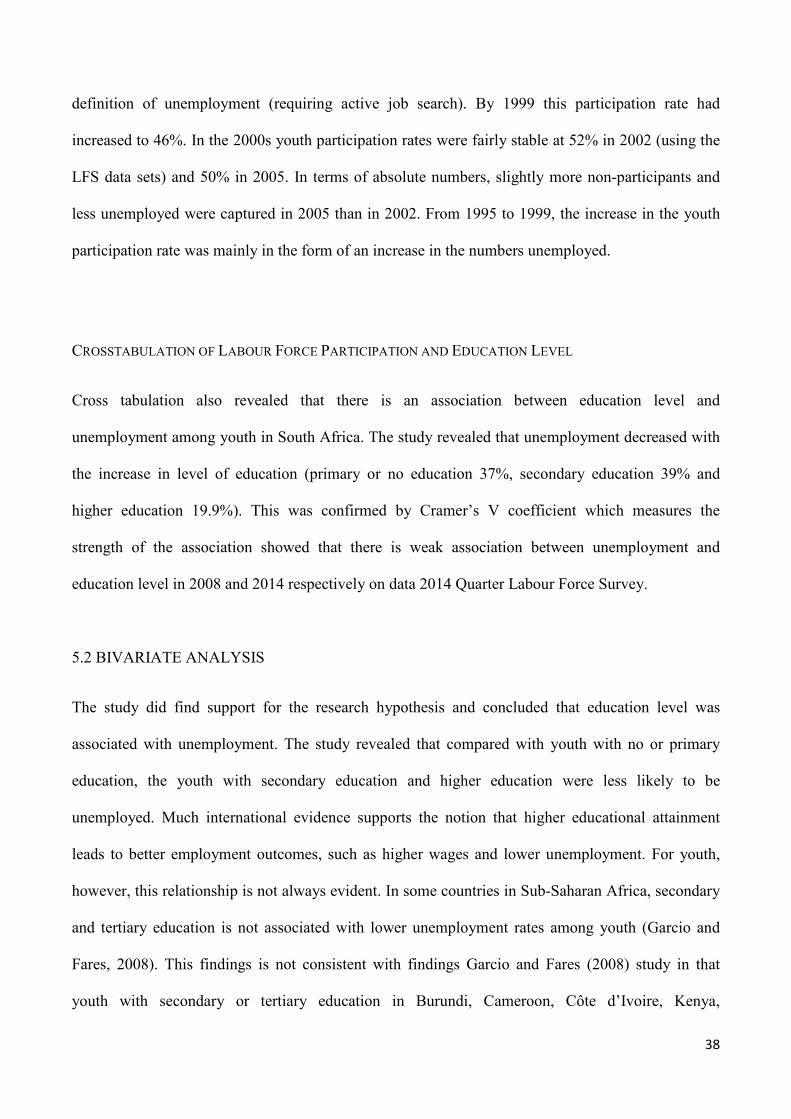
CROSSTABULATION OF LABOUR FORCE PARTICIPATION AND EDUCATION LEVEL
Cross tabulation also revealed that there is an association between education level and
unemployment among youth in South Africa. The study revealed that unemployment decreased with
the increase in level of education (primary or no education 37%, secondary education 39% and
higher education 19.9%). This was confirmed by Cramer’s V coefficient which measures the
strength of the association showed that there is weak association between unemployment and
education level in 2008 and 2014 respectively on data 2014 Quarter Labour Force Survey.
5.2 BIVARIATE ANALYSIS
The study did find support for the research hypothesis and concluded that education level was
associated with unemployment. The study revealed that compared with youth with no or primary
education, the youth with secondary education and higher education were less likely to be
unemployed. Much international evidence supports the notion that higher educational attainment
leads to better employment outcomes, such as higher wages and lower unemployment. For youth,
however, this relationship is not always evident. In some countries in Sub-Saharan Africa, secondary
and tertiary education is not associated with lower unemployment rates among youth (Garcio and
Fares, 2008). This findings is not consistent with findings Garcio and Fares (2008) study in that
youth with secondary or tertiary education in Burundi, Cameroon, Côte d’Ivoire, Kenya,
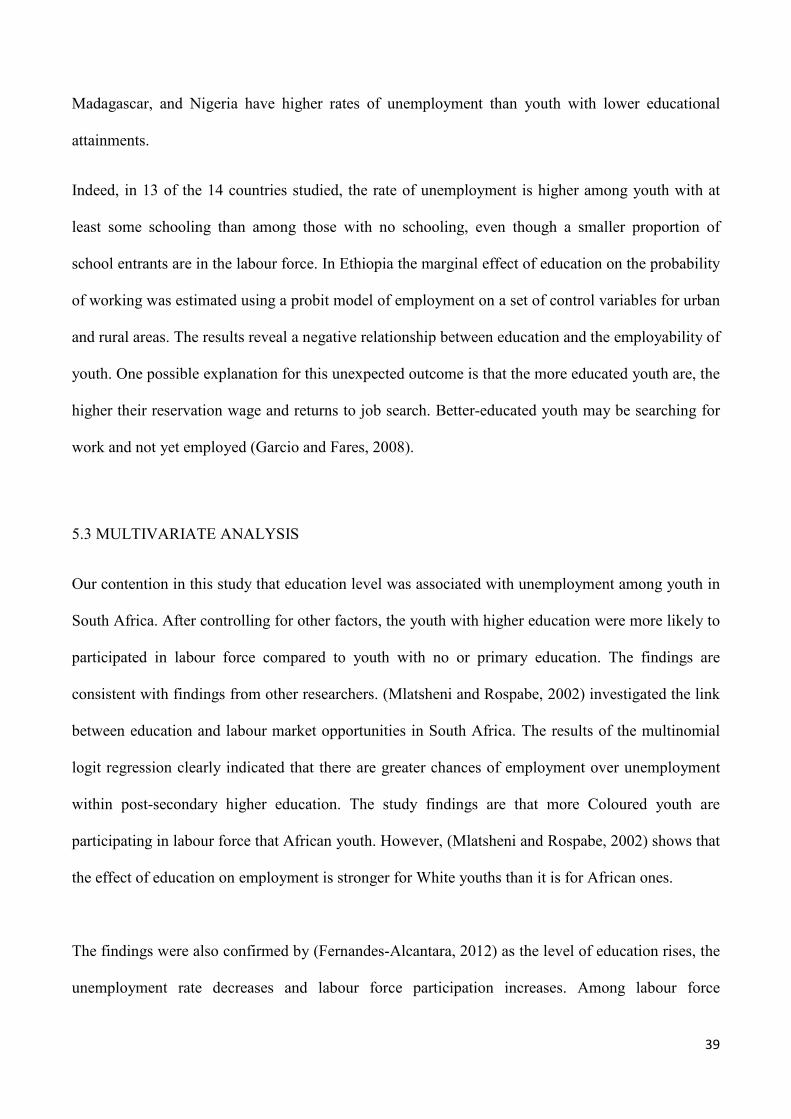
39
Madagascar, and Nigeria have higher rates of unemployment than youth with lower educational
attainments.
Indeed, in 13 of the 14 countries studied, the rate of unemployment is higher among youth with at
least some schooling than among those with no schooling, even though a smaller proportion of
school entrants are in the labour force. In Ethiopia the marginal effect of education on the probability
of working was estimated using a probit model of employment on a set of control variables for urban
and rural areas. The results reveal a negative relationship between education and the employability of
youth. One possible explanation for this unexpected outcome is that the more educated youth are, the
higher their reservation wage and returns to job search. Better-educated youth may be searching for
work and not yet employed (Garcio and Fares, 2008).
5.3 MULTIVARIATE ANALYSIS
Our contention in this study that education level was associated with unemployment among youth in
South Africa. After controlling for other factors, the youth with higher education were more likely to
participated in labour force compared to youth with no or primary education. The findings are
consistent with findings from other researchers. (Mlatsheni and Rospabe, 2002) investigated the link
between education and labour market opportunities in South Africa. The results of the multinomial
logit regression clearly indicated that there are greater chances of employment over unemployment
within post-secondary higher education. The study findings are that more Coloured youth are
participating in labour force that African youth. However, (Mlatsheni and Rospabe, 2002) shows that
the effect of education on employment is stronger for White youths than it is for African ones.
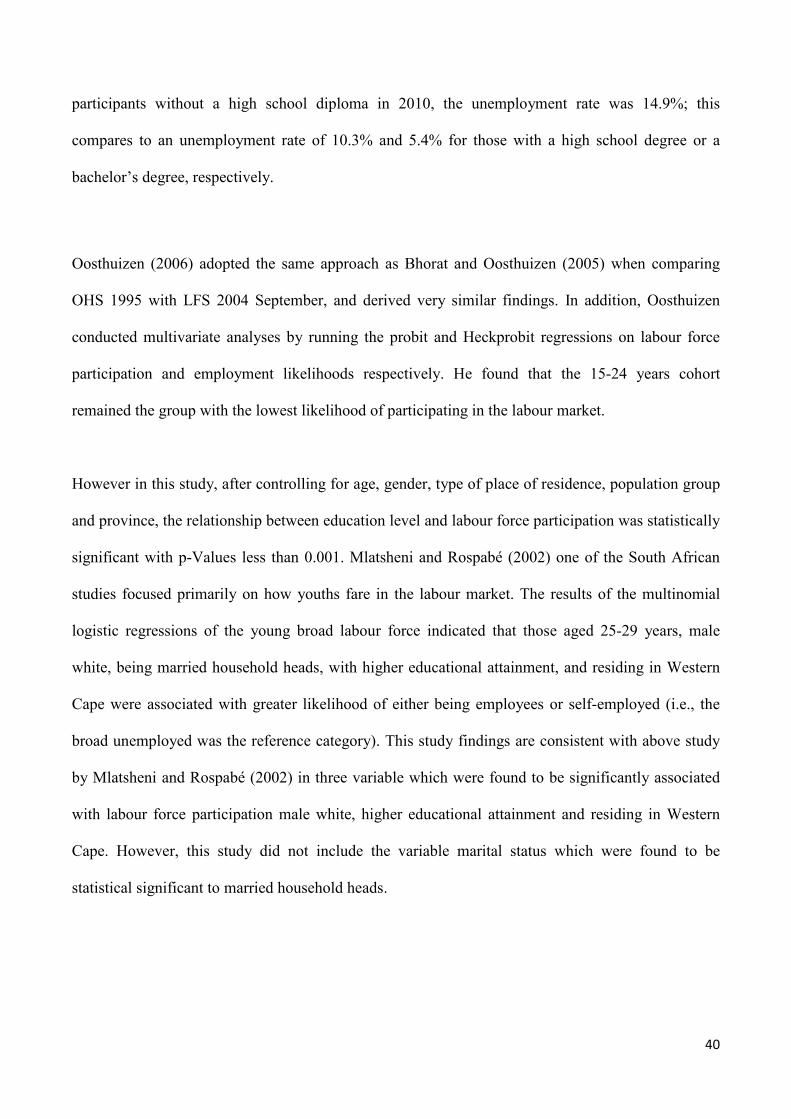
The findings were also confirmed by (Fernandes-Alcantara, 2012) as the level of education rises, the
unemployment rate decreases and labour force participation increases. Among labour force
40
participants without a high school diploma in 2010, the unemployment rate was 14.9%; this
compares to an unemployment rate of 10.3% and 5.4% for those with a high school degree or a
bachelor’s degree, respectively.
Oosthuizen (2006) adopted the same approach as Bhorat and Oosthuizen (2005) when comparing
OHS 1995 with LFS 2004 September, and derived very similar findings. In addition, Oosthuizen
conducted multivariate analyses by running the probit and Heckprobit regressions on labour force
participation and employment likelihoods respectively. He found that the 15-24 years cohort
remained the group with the lowest likelihood of participating in the labour market.
However in this study, after controlling for age, gender, type of place of residence, population group
and province, the relationship between education level and labour force participation was statistically
significant with p-Values less than 0.001. Mlatsheni and Rospabé (2002) one of the South African
studies focused primarily on how youths fare in the labour market. The results of the multinomial
logistic regressions of the young broad labour force indicated that those aged 25-29 years, male
white, being married household heads, with higher educational attainment, and residing in Western
Cape were associated with greater likelihood of either being employees or self-employed (i.e., the
broad unemployed was the reference category). This study findings are consistent with above study
by Mlatsheni and Rospabé (2002) in three variable which were found to be significantly associated
with labour force participation male white, higher educational attainment and residing in Western
Cape. However, this study did not include the variable marital status which were found to be
statistical significant to married household heads.

41
The study by Dias and Posel (2006) used the OHS 1995 and LFS 2003 September data to examine
the relationship between education and broad unemployment likelihood. The regression analysis on
the broad labour force indicated that the probability of unemployment decreased across the older age
cohorts, as compared with the reference category (16-20 years), and this happened in all four
population groups.
42
CHAPTER 6
6 CONCLUSION AND RECOMMENDATIONS
6.1 CONCLUSION
The main objective of this study was to examine the association between education level and
unemployment among youth in South Africa. Our contention or hypothesis in this study that
education level was associated with unemployment among youth in South Africa was confirmed in
all analyses conducted bivariate and multivariate. After controlling for other factors, the youth in
higher education were less likely to be unemployed as compared to youth who have no or primary
education.
There is widespread acknowledgement of the failings of South Africa’s education system.
Government, business, teachers and learners all recognise that skills development has been far from
optimal and is in need of serious attention. Recent economic growth in South Africa has also been
well below potential, and although the low rate of economic growth has many explanatory factors it
is difficult to avoid the conclusion that a lack of skills within the workforce is one of them.
The NDP describes the inadequacies of the country’s education system at length. It proposes a range
of improvements without which economic growth is unlikely to meet the rates required to facilitate
transformation in general, and, in particular, meaningful reductions in the unemployment rate and
meaningful advances in the skills profiles across all population groups. “Closer to 2030, South Africa
should be approaching ‘developed world’ status, with the quality of life greatly improved, with
skilled labour becoming the predominant feature of the labour force and with levels of inequality
greatly reduced” (NDP: 157).

43
6.2 RECOMMENDATIONS
Based from the main finding that the highly skilled youth were less likely to be unemployed as
compared to less skilled youth. Most of the recommendations focused on the issues around
development of skills in youth. This study strongly support the findings of the NDP that the
education system is not adequately serving skills development, and is in urgent need of reform.
Employment growth between 1994 and 2014 was completely inadequate to reduce unemployment,
further raising the level of urgency with which skills development should be treated
The transition to work is difficult for South African young people because of the large number of
young people entering the labour market, their lack of skills, unfavourable economic conditions in
most provinces of South Africa, market failures that adversely affect young people outcomes, and a
host of other factors. In South Africa, your life chances are overwhelmingly determined by race, by
birth, and by where you go to school. And we also need to address the structural constraints of a
large, poorly educated, mostly black population without the social capital to get workplace skills,
work experience, and job placement. Below follows some recommendations that comes from the
findings of this study:
BUILDING SKILLS AND CAPABILITIES
Despite the increase in educational attainment in most South Africa, young people continue to leave
school unprepared to integrate into the labour market. To reduce school dropout and early transition
to work, policies and programs should ease the income constraints poor families’ face. The biggest
problem in South Africa is high drop-out of young people in school – the majority don’t even finish

44
their secondary school, therefore there is a need to for policy and programs to increase school-
enrolment.
PROMOTING PUBLIC-PRIVATE PARTNERSHIPS AND MAKING CURRICULUM MORE RELEVANT
Public-private partnerships are needed to improve the quality of primary education and increase
access to lower-secondary education. Public policy could complement private initiatives by ensuring
quality standards and introducing financing mechanisms to support the poor.
For secondary and higher education, school curriculum need to be made more relevant to labour
market needs. Providing practical skills—by teaching subjects such as technology, economics, and
foreign languages—could better equip young people for the labour market; better integrating
vocational and general curriculum could facilitate young people insertion into the work force.
In addition to raising enrolment, South Africa need to improve the quality of their education systems
and the relevance of school curriculum by teaching students the practical thinking and behavioural
skills demanded by the labour market, using teaching methods that lead to high learning achievement
and blend academic and vocational curriculum (Garcio, et al., 2008). Building bridges between
school and work can facilitate the transition of young people from school to the workplace.
Young people need to be prepared to take advantage of potential opportunities or create opportunities
on their own through self-employment and entrepreneurial activities. Young entrepreneurs face
several constraints to creating a venture and making it grow. Some lack entrepreneurial skills, others
lack access to information and networks, almost all have difficulty accessing credit and face
investment climates that make it difficult to start and run a business. Improving the climate for doing
business would allow more young entrepreneurs to start their own enterprises.

45
OFFERING A SECOND CHANCE SO THAT NO ONE IS LEFT BEHIND
Poverty, adverse economic conditions, poor health, employment shocks, and inadequate schools
force many young people to leave school without acquiring the basic skills demanded in the
workplace. The aftermath of apartheid in South Africa, uproot many townships, halting early efforts
young people have made to find work and develop their livelihoods. The result is a huge stock of
unskilled young people who never went to school, are ill-prepared for the workplace, and are
vulnerable to shocks.
South Africa need to intensify the second-chance programs which the country is operating in
different forms. Back to school campaign targeting young people but attending classes part time in
the evenings. The direct reintegration of out-of-work young people into the work force. To limit—
and justify—the fiscal burden of second-chance initiatives, all programs must be well targeted,
designed to increase young people skills, and geared to the needs of the labour market.
For young people who are out of school, equivalence, literacy, and job training programs should be
designed to provide the skills needed for work (Garcio, et al., 2008).. Job training programs are more
likely to be successful if they are part of a package that includes basic education, employment
services, and social services. Public works programs provide good opportunities for young workers,
particularly rural residents and people with low skills, to acquire initial work experience. The young
people are hired only on a temporary basis, but the training and work experience helps them obtain
more permanent employment.
Public works projects also allow good targeting for other young people interventions (such as
training and placement services) that may increase the likelihood that young people find better
employment opportunities beyond the program.

46
7 REFERENCES
1. Altman, M, 2012. Challenges & opportunities in addressing youth unemployment
activating youth: What way forward? Human Sciences Research Council, Pretoria.
2. Altman, M, 2007. Youth labour market challenges in South Africa. Human Sciences
Research Council, Pretoria.
3. Ashenfelter, O, and Rouse, C, 1998. Income, schooling, and ability: Evidence from a new
sample of identical twins. Quarterly Journal of Economics, 113, 253–284.
4. Banerjee, A, Galiani, S, Levinsohn, J, McLaren, Z and Woolard, I, 2007. Why Has
Unemployment Risen in the New South Africa. National Bureau of Economic Research,
Working Paper Series: 13167 http://www.nber.org/papers/w13167
5. Becker, G, S, 1964. Human capital: a theoretical and empirical analysis. National Bureau
of Economic Research, New York.
6. Blumenfeld, J, 2011. Youth Unemployment in South Africa and the Wage Subsidy
‘Debate. London
7. Bhorat, H and Oosthuizen, M, 2005. The post-apartheid South African labour market.
DPRU Working Paper 05/93. Development Policy Research Unit, Cape Town.
8. Burger, R, Van der Berg, S and Von Fintel, D, 2013. The Unintended Consequences of
Education Policies on South African Participation and Unemployment.
Forschungsinstitut zur Zukunft der Arbeit Institute for the Study of Labour. IZA DP No. 7450
9. Burger, R and Woolard, I, 2005. The state of the labour market in South Africa after the
first decade of democracy. Journal of Vocational Education and Training 57(4), 453-475.
10. Chigunta, F, 2002. The Socio-Economic Situation of Youth in Africa: Problems,
Prospects and Options. The Socio-Economic Situation of Youth in Africa Draft July 12,

47
11. Dias, R and Posel, D, 2006. Unemployment, education and skills constraints in post-
apartheid South Africa. DPRU Working Paper 07/120. Development Policy Research Unit,
Cape Town.
12. Du Toit, R, 2003. Unemployed Youth in South Africa: The Distressed Generation, A
Paper presented at the Minnesota International Couseling Institute (MICI), 27 July – 01
August 2003.
13. Farber, Henry, S, 2003. NBER Working Paper 9707: Job Loss in the United States 1981
2001. National Bureau of Economic Research, Cambridge.
14. Fernandes-alcantara, L, Adrienne, 2012. Youth and the Labour Force: Background and
Trends. Congressional Research Service 7-5700, R42519. CRS Report for Congress,
prepared for Members and Committees of Congress
15. Fields, Gary, S, 2000. The Employment Problem in South Africa. Cornell University ILR
School. DigitalCommons@ILR Collection. Trade and Industry Monitor, 16(3-6).
16. Garcio, Marito, and Fares, Jean, 2008. Youth in Africa’s Labour Market. Direction in
Development (Human Development). The World Bank. Washington, D.C. Green Press
Initiative.
17. Harmon, C, and Walker, I, 1995. ‘Estimates of the economic return to schooling for the
United Kingdom’ American Economic Review, 85, pp 1278–1286.
18. Haldenwang, Bärbel, 1994. The demography of the youth of South Africa: Source:
Southern African Journal of Demography, Vol. 4, No. 1 (October 1994), pp. 58-82 Published
by: Population Association of Southern Africa Stable URL:
http://www.jstor.org/stable/20853214.
19. International Labour Organization, 2013. Global Employment Trends for Youth 2013: A
Generation at risk. International Labour Office. Geneva
48
20. Kennedy, Steven; Stoney, Nicholas and Vance, Leo, 2007. ‘Labour Force Participation
and the Influence of Educational Attainment, Economic Roundup, Spring 2008,
Department of the Treasury. Canberra.
21. Kleinbaum, David, G and Klein, Mitchel, 2010. Logistic Regression: Statistics for Biology
and Health: A Self-Learning Text, Third Edition. Springer New York Dordrecht Heidelberg
London.
22. Lam, David; Leibbrandt, Murray and Mlatsheni Cecil, 2007. Education and Youth
Unemployment in South Africa. International Policy Center. Gerald R. Ford School of
Public Policy, University of Michigan. IPC Working Paper Series Number 34.
23. Leighton, L and Mincer, J, 1982. Labour Turnover and Youth Unemployment, University
of Chicago Press, ISBN: 0-226-26161-1, URL: http://www.nber.org/books/free82-1
24. Makiwane, M and Kwizera, S, 2009. Youth and Well-Being: A South African Case Study,
Social Indicators Research, Vol. 91, No. 2 (Apr., 2009), pp. 223-242, Springer.
25. Mincer, J. 1974. Schooling, Experience and Earnings, NBER, New-York.
26. Mlatsheni, C & Rospabé, S, 2002. Why is youth unemployment so high and unequally
spread in South Africa? DPRU Working Paper 02/65. Development Policy Research Unit,
Cape Town.
27. Nam, S, 1991. “Determinants of Female Labour Force Participation: A Study of Seoul,
South Korea, 1970–1980.” Sociological Forum, Vol. 6, No. 4, pp. 641–59.
28. National Planning Commission, 2011. Diagnostic report, Pretoria: NPC.
29. National Youth Development Agency, 2010. Discussion Paper: Promoting Youth
Employment in South Africa. Office of the Chairperson. Midrand, South Africa.
30. National Youth Development Agency, 2010. The South African Youth Context: Our
Youth. Our Future. Office of the Chairperson. Midrand, South Africa.

49
31. Nattrass, N, 2003. Unemployment and Aids: The Social-Democratic Challenge for South
Africa, Centre for Social Science Research University of Cape Town, CSSR Working Paper
No. 43
32. Oosthuizen, M, 2006. The post-apartheid labour market: 1995-2004. DPRU Working
Paper
06/103. Development Policy Research Unit, Cape Town.
33. Pierce-Brown, R, 1998. “An Application of Human Capital Theory to Salary
Differentials in the Accounting Profession.” Women in Management Review, Vol.13, No.
5, pp. 192–200.
34. Rankin, N, Roberts, G and Schoer, V, 2013. The Challenges that Young South African’s
Face in Accessing Jobs: Could a Targeted Wage Subsidy Help? African Micro-Economic
Research Unit (AMERU). University of the Witwatersrand
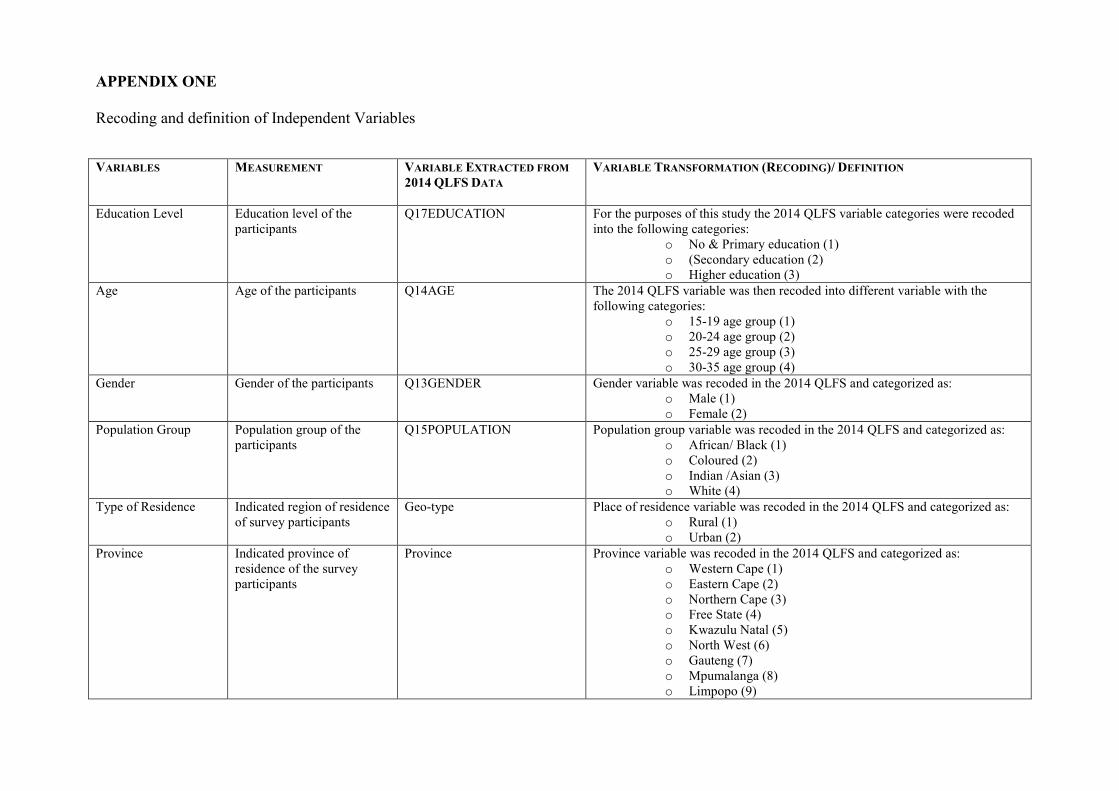
APPENDIX ONE
Recoding and definition of Independent Variables
VARIABLES MEASUREMENT VARIABLE EXTRACTED FROM
2014 QLFS DATA
VARIABLE TRANSFORMATION (RECODING)/ DEFINITION
Education Level
Education level of the
participants
Q17EDUCATION For the purposes of this study the 2014 QLFS variable categories were recoded
into the following categories:
o No & Primary education (1)
o (Secondary education (2)
o Higher education (3)
Age
Age of the participants Q14AGE The 2014 QLFS variable was then recoded into different variable with the
following categories:
o 15-19 age group (1)
o 20-24 age group (2)
o 25-29 age group (3)
o 30-35 age group (4)
Gender
Gender of the participants Q13GENDER Gender variable was recoded in the 2014 QLFS and categorized as:
o Male (1)
o Female (2)
Population Group
Population group of the
participants
Q15POPULATION Population group variable was recoded in the 2014 QLFS and categorized as:
o African/ Black (1)
o Coloured (2)
o Indian /Asian (3)
o White (4)
Type of Residence
Indicated region of residence
of survey participants
Geo-type Place of residence variable was recoded in the 2014 QLFS and categorized as:
o Rural (1)
o Urban (2)
Province
Indicated province of
residence of the survey
participants
Province Province variable was recoded in the 2014 QLFS and categorized as:
o Western Cape (1)
o Eastern Cape (2)
o Northern Cape (3)
o Free State (4)
o Kwazulu Natal (5)
o North West (6)
o Gauteng (7)
o Mpumalanga (8)
o Limpopo (9)