Wcp 2001 03 rpt responsesofmountaincariboutolinearfeaturesinawestcentralablandscape

You’re in good company You’re in good company You’re in good company
Results presentation for the year ended 29 February 2012

Results presentation 2012
Agenda
2
Highlights
Business model
Operational performance
Financial results
Board changes
Strategy and prospects

Highlights

Results presentation 2012
Highlights
11th successive year of record turnover and profits – coming off an increasingly high base 11– coming off an increasingly high base – coming off an increasingly high base
Milestone R2 billion revenue exceeded Milestone Milestone
Milestone R400 million operating profit exceeded - 15% growth on prior year Milestone 15% growth on prior yearMilestone
Operating margin maintained at record 19.1% - strong “claw back” in second half Operating margin maintained at record strong “claw back” in second halfOperating margin maintained at record strong “claw back” in second half
Net borrowing to equity improves to a 5 year low of 10% Net borrowing to equity improves to a 5 year low of Net borrowing to equity improves to a 5 year low of
Total dividends to shareholders 200 cents per share - an increase of 29% Total dividends to shareholders 200 cents per share - an increase of Total dividends to shareholders 200 cents per share - an increase of
Attained landmark share price of 5 000 cents Attained landmark share price of Attained landmark share price of
4

Results presentation 2012
Highlights
Awarded 10th position in Sunday Times Top 100 Companies Survey Awarded Companies Survey Awarded Companies Survey
Opened 146 new restaurants, surpassing goal of 2000
Opened 2000 Opened 2000
Successful integration of F2011 acquisitions Successful Successful
Traction gained in Africa: 21% growth in system-wide sales Traction gained in Africa: system-wide salesTraction gained in Africa: system-wide sales
Manufacturing and distribution capability continue to expand Manufacturing and distribution capability expandManufacturing and distribution capability expand
Clean sweep of all relevant Leisure Options consumer awards Clean sweep consumer awardsClean sweep consumer awards
5
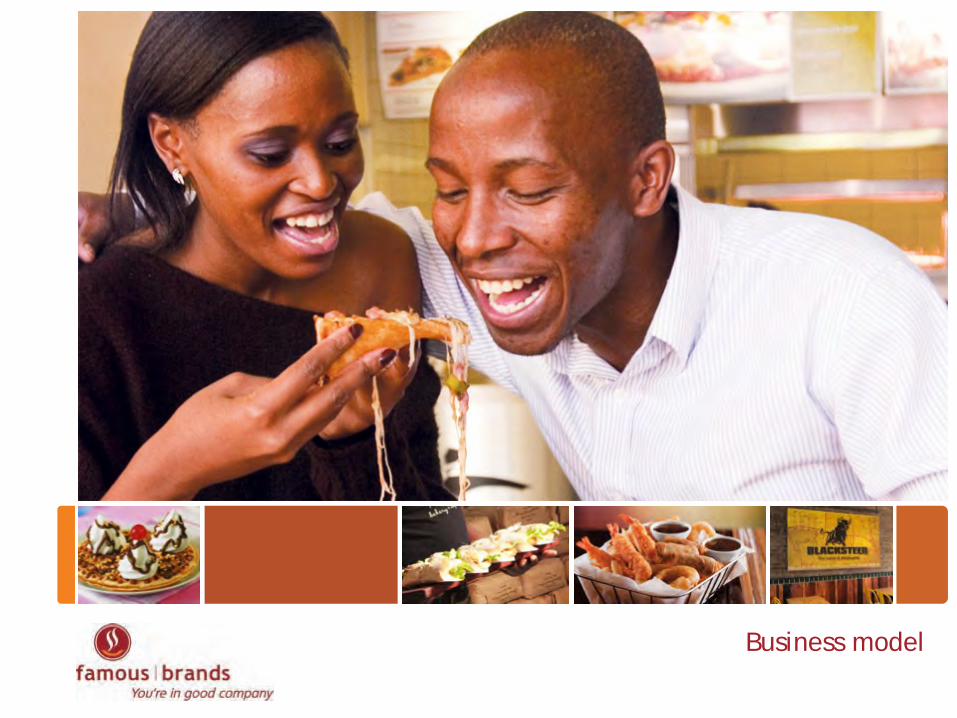
Business model

Results presentation 2012
Business model
7
Franchising Division
Franchising Division
Franchising Division
Franchising Division The MAD Lab
Food Services Division
New Business Division
Development Division
Procurement Division
Manufacturing Division
Logistics Division
Corporate
International Domestic (Mainstream
Brands)
Domestic (Developing
Brands)
Domestic (Theatre of
Foods)
Marketing, Artistry and
Design
Retail and
Wholesale
•!Wimpy UK •!Steers
•!Wimpy
•!Debonairs Pizza
•!FishAways
•!Mugg & Bean
•!KEG
•!Milky Lane
•!Giramundo
•!Brazilian Café
•!House of Coffees
•!McGinty’s
•!The Brewers Guild
•!O’Hagan’s
•!tashas
•!Vovo Telo
•!Juicy Lucy
•!Group marketing and social media
•!Group restaurant design
•!Group product development
•!Steers
•!Wimpy
•!Baltimore
•!TruFruit
•!Aqua Monte
•!Mugg & Bean
•!Site selection
•!Franchisee selection
•!Lease negotiation
•!Strategic alliance management
•!Drawings
•!Costing
•!Procurement
•!Project management
•!Supplier appointment and audits
•!Price negotiations
•!New business integration
•!Planning and forecasting
•!Sauces and spices
•!Meat and chicken products
•!Bakery
•!Ice-cream
•!Fruit juice
•!Mineral water
•!Telesales
•!Warehousing
•!Distribution
•!Human Resources
•!Finance
•!Information Technology
•!Legal

Operational performance

Results presentation
Franchising division
9

Results presentation 2012
System–wide sales growth
10
7,7%
21,0%
8,5%
0%
5%
10%
15%
20%
25%
Domestic Rest of Africa Total

Results presentation 2012
Like-on-Like sales growth
11
5,1%
7,0%
5,2%
0%
1%
2%
3%
4%
5%
6%
7%
8%
Domestic Rest of Africa Total

Results presentation 2012
New restaurants opened
19 21
48
12
17
2 1
5 6 9
1 1 2 2
0
10
20
30
40
50
60
12
Total 146

Results presentation 2012
Franchise network
521
121
533
371
123 128
81
24 14 48
4 19 4 12 2 9 8 8 13 0
100
200
300
400
500
600
13
Total 2 043

Results presentation 2012
Trading footprint
14
South Africa 1 767
Namibia 25 Botswana 26
Zambia 19
Nigeria 3
Ivory Coast 4
UK 121
Dubai 2
Sudan 5
Kenya 12
Malawi 4 Mozambique 3
Tanzania 3
Zimbabwe 11 Mauritius 27
Swaziland 8 Lesotho 3
South Africa 1 767 Rest of Africa 155 United Kingdom 121

Results presentation 2012
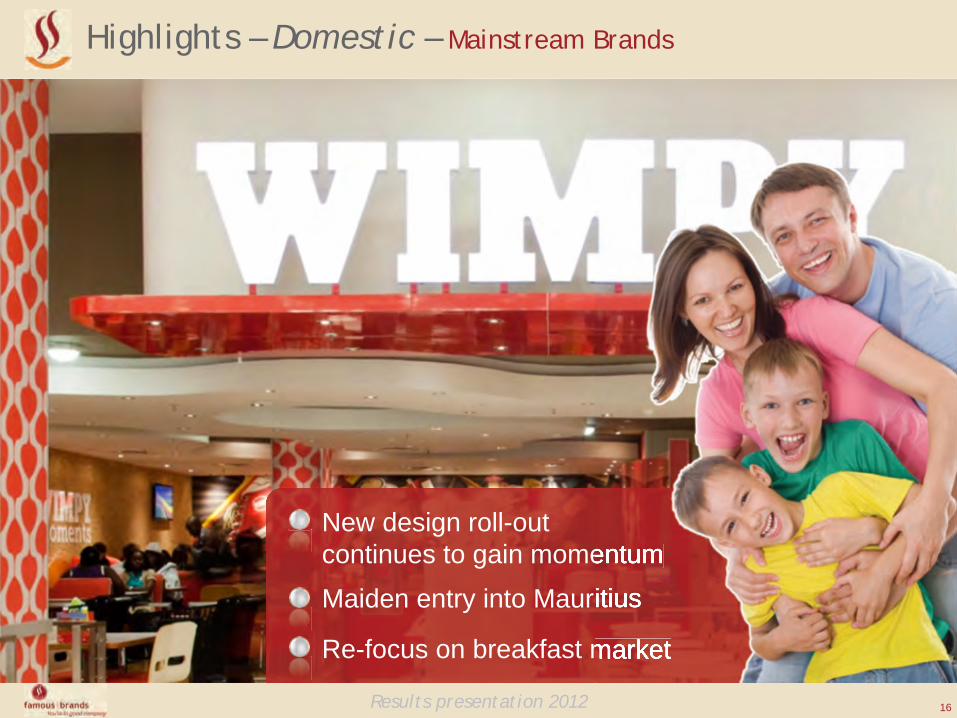
Highlights – Domestic – Mainstream Brands
15
Launched new Steers image and positioning - REAL BURGERS
Innovation around core products
Increased focus on chicken
Results presentation 2012
Highlights – Domestic – Mainstream Brands
16
New design roll-out continues to gain momentum
Maiden entry into Mauritius
Re-focus on breakfast market
continues to gain momentum
Maiden entry into Mauritius
Re-focus on breakfast market

Results presentation 2012
Remains at forefront of per capita consumption growth amongst Black consumers
Accountable for 40% of Group’s Africa turnover
First to market with technology, innovation, trading format and value for money
Highlights – Domestic – Mainstream Brands
17
Remains at forefront of per capita consumption
Accountable for 40% of Group’s Africa turnover

Results presentation 2012
“On the Move” model with Total continues to gain traction – ten new sites this year
Maiden entry into Zambia and Mauritius
“Metro” trading format launched in Newcastle
Highlights – Domestic – Mainstream Brands
18

Results presentation 2012
Competitive climate fuels growth in the category
Record 15% growth in system-wide sales
Highlights – Domestic – Mainstream Brands
19
Competitive climate fuels

Results presentation 2012
Highlights – Domestic – Mainstream Brands
20
Successfully integrated into franchising and supply chain structures
New corporate identity launched and roll-out commencing

Results presentation 2012
Highlights – Domestic – Mainstream Brands
21
Re-launch delayed due to Gauteng liquor license moratorium
“Rehabilitation” of existing network well under way

Results presentation 2012
Highlights – Domestic – Developing Brands
22
Customer acceptance continues to grow
2nd restaurant opened in Musina and push into mass market commencing
Slow start but gaining momentum – McGinty’s OR Tambo

Results presentation 2012
Highlights – Domestic – Theatre of Foods Brands
23
Phenomenal organic growth continues Flagship “le parc” format launched at Hyde Park to extraordinary acclaim Export of concept under consideration
Phenomenal organic growth continues Flagship “le parc” format launched at Hyde Park to extraordinary acclaim Export of concept under consideration

Results presentation 2012
Highlights – Domestic – Theatre of Foods Brands
24
First to market in pioneering artisan bakery category
Ready to expand to Western Cape and KwaZulu Natal

Results presentation 2012
Highlights – Domestic – Theatre of Foods Brands
25
Brand completely re-invented
Re-launch of high street offering imminent
Brand completely re-invented

Results presentation 2012
Food for thought
26
1.5 million breakfasts
3.4 million burgers 3.4 million3.4 million
4 million cups of coffee 4 million4 million
2 million ice cream cones 2 million2 million
1.8 million pizzas
Average monthly sales of key line items

Results presentation 2012
Highlights – United Kingdom
27 27
Severe economic conditions prevail - tough market to trade in
Nominal contributor to Group revenue (only 3.8%)
Right-sizing concluded, business is profitable, and no distraction to management
“The business isn’t shabby, it’s the UK that’s shabby” Keith McLachlan, Thebe Securities

Results presentation 2012 Results presentation
Manufacturing division
28

Results presentation 2012
Gross Revenue % Growth - Manufacturing
15,1%
7,7%
11,0%
15,4%
6,0%
-2,9%
27,3%
-5%
0%
5%
10%
15%
20%
25%
30%
Meat Plant Bakery Sauces & Spices
WCP Meat Plant
WCP Bakery Fruit Juice Ice-Cream
29
Growth 12.6%

Results presentation 2012
Highlights - Manufacturing
Contended with 30% average increase in beef price and 17% increase in paraffin price
Operating margin unchanged at 11.7%
Chicken fillet plant commissioned in November 2011
Successful take-on of Milky Lane soft serve volumes concluded in October
30
Contended with 30% average increase in beef price and 17% increase in in beef price and 17% increase in Contended with 30% average increase in beef price and 17% increase in
Operating margin unchanged at 11.7% Operating margin unchanged at 11.7%
Chicken fillet plant commissioned in November 2011 November 2011 Chicken fillet plant commissioned in November 2011
Successful take-on of Milky Lane soft serve volumes concluded in October serve volumes concluded in October Successful take-on of Milky Lane soft serve volumes concluded in October

Results presentation 2012 Results presentation
Logistics division
31

Results presentation 2012
Gross Revenue % Growth - Logistics
18,1% 17,4%
24,5%
8,0%
48,9%
0%
10%
20%
30%
40%
50%
60%
Midrand, Gauteng KwaZulu Natal Western Cape Eastern Cape Free State
32
Growth 20.1%

Results presentation 2012
Highlights - Logistics
Contended with 16% increase in diesel price
Operating margin improves to best ever at 3.5%
Take-on of all newly acquired brands concluded: 43% increase in line items ex-warehouse
Owner driver model continues to gain momentum: 49% and 41% of volume delivered from KZN and Western Cape respectively
New Nelspruit depot commissioned
33
Contended with 16% increase in diesel price price Contended with 16% increase in diesel price
Operating margin improves to best ever at 3.5% at 3.5% Operating margin improves to best ever at 3.5%
Take-on of all newly acquired brands concluded: 43% increase in line items concluded: 43% increase in line items Take-on of all newly acquired brands concluded: 43% increase in line items
Owner driver model continues to gain momentum: 49% and 41% of volume momentum: 49% and 41% of volume Owner driver model continues to gain momentum: 49% and 41% of volume
New Nelspruit depot commissioned New Nelspruit depot commissioned

Financial results

Results presentation 2012
Salient features
F 2012 % Change
Revenue (Rm) 2 156 15
Operating profit (Rm) 413 15
Cash generated by operations before changes in working capital (Rm) 452 15
Earnings per share (cents) 278 15
Headline earnings per share (cents) 278 15
Total dividends per share (cents) 200 29
Net debt/equity (%) 10 14 (py)
Dividend cover (times) 1.4 1.6 (py)
Return on equity (ROE) (%) 35 36 (py)
35

Results presentation 2012
Income statement
Rm F 2012 F 2011 %
Revenue 2 156 1 878 15
Cost of sales (1 233) (1 065)
Gross profit 923 813 14
Selling and administrative expenses (510) (455)
Operating profit 413 358 15
Net interest paid (11) (15)
Profit before tax 402 343 17
Taxation (134) (112)
Profit for the year 268 231 16
Adjustments (1) -
Headline earnings (Rm) 267 231 16
Headline earnings per share (cents) 278 242 15
Earnings per share (cents) 278 242 15
36
Results presentation 2012
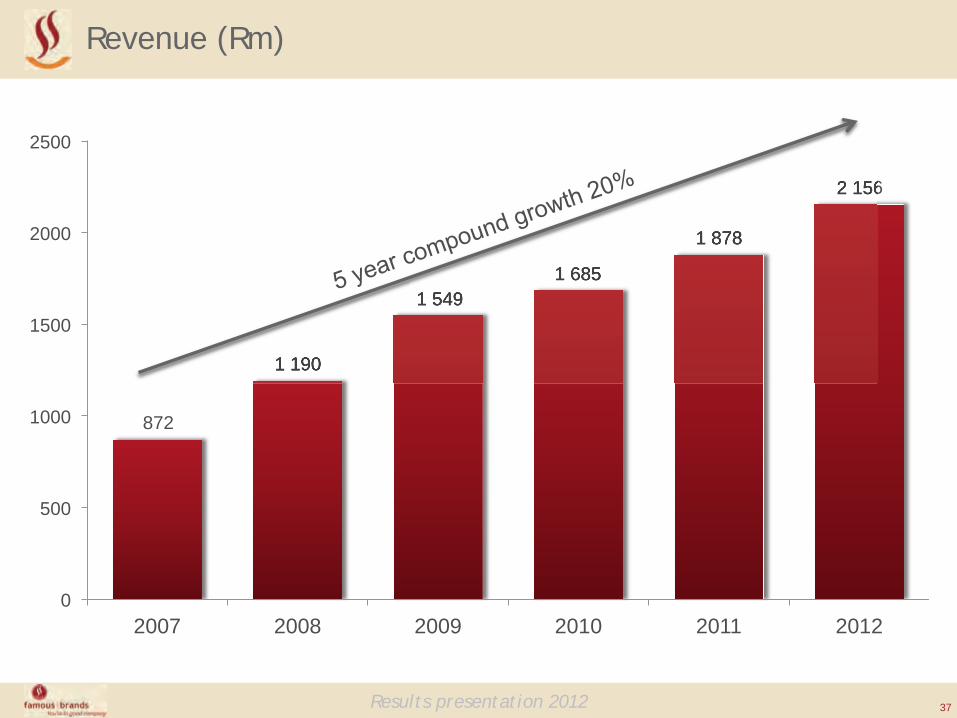
Revenue (Rm)
0
500
1000
1500
2000
2500
2007 2008 2009 2010 2011 2012
37
872
1 190
1 549 1 685
1 878
2 156
1 190
1 549 1 685
1 878
2 156

Results presentation 2012
Operating profit (Rm)
151 217
262 308
358 413
17,3%
18,3%
16,9%
18,3%
19,1%
19,1%
15,5%
16,0%
16,5%
17,0%
17,5%
18,0%
18,5%
19,0%
19,5%
0
50
100
150
200
250
300
350
400
450
2007 2008 2009 2010 2011 2012 Operating Profit Operating Margin
38
358 413 413
17,3% 17,3% 17,3% 17,3%
18,3% 18,3% 18,3%
16,9% 16,9%
18,3% 18,3% 18,3%
19,1%
19,1% 19,1%

Results presentation 2012
Statement of financial position (Rm)
F 2012 F 2011 Move
Assets
Property, plant and equipment 156 131 25
Intangible assets 695 660 35
Working capital 128 77 51
979 868 111
Funding Equity 840 709 131
Net borrowings 82 101 (19)
Deferred liabilities and current tax balances 57 58 (1)
979 868 111
39

Results presentation 2012
Cash flow (Rm)
86 41
0
50
100
150
200
250
300
350
400
450
500
Opening cash Closing cash
40
!"#$!%&$
399 Cash from operations
132 Tax
159 Dividends
84 Capex (net)
11 Interest
58 Funding (net)

Results presentation 2012
Segmental analysis
% of Total
F 2012 Rm
F 2011 Rm
Change %
Revenue Franchising – Local 20 440 386 14
Supply chain 76 1 614 1 383 17
United Kingdom 4 82 95 (13)
Corporate 20 14
100 2 156 1 878 15 Operating Profit Franchising – Local 64 265 235 13
Supply chain 34 141 116 21
United Kingdom 2 7 11 (30)
Corporate - - (4)
100 413 358 15
Operating Margin % % Franchising – Local 60.2 60.9 Supply chain 8.7 8.4 United Kingdom 9.2 11.3 Group 19.1 19.1
41

Board changes

Results presentation 2012
Stanley Aldridge Kevin Hedderwick Bheki Sibiya
Panagiotis Halamandaris Periklis Halamandaris
Theofanis Halamandaris John Lee Halamandres
Hymie Levin Christopher Boulle
Board changes
43

Strategy and prospects

Results presentation 2012
Strategy
Pursue acquisitive brand growth in new markets Pursue acquisitive brand growth in new markets Pursue acquisitive brand growth in new markets
Leverage our exclusive Netcare hospital service provider status Leverage our exclusive Netcare hospital service provider status Leverage our exclusive Netcare hospital service provider status
Build manufacturing capability, push for new business - existing plants and new opportunities Build manufacturing capability, push for new business - existing plants and new opportunities Build manufacturing capability, push for new business - existing plants and new opportunities
Expand logistics capability - capacity and owner driver Expand logistics capability - capacity and owner driver Expand logistics capability - capacity and owner driver
Build procurement capability and further develop “lowest cost producer” status Build procurement capability and further develop “lowest cost producer” status Build procurement capability and further develop “lowest cost producer” status
Open 250 new restaurants - 47 in rest of Africa Open 250 new restaurants - 47 in rest of Africa Open 250 new restaurants - 47 in rest of Africa
Embark on a major step change surrounding innovation - leverage our investment in “the Mad Lab” Embark on a major step change surrounding innovation - leverage our investment in “the Mad Lab” Embark on a major step change surrounding innovation - leverage our investment in “the Mad Lab” Improve and expand our retail and wholesale market presence Improve and expand our retail and wholesale market presence market presence
45

Results presentation 2012
Prospects
Consumer spending, especially middle income, expected to be muted Consumer spending, especially middle income, expected to be muted Consumer spending, especially middle income, expected to be muted
Competitive climate and category fragmentation will persist Competitive climate and category fragmentation will persist Competitive climate and category fragmentation will persist
Margins will continue to come under pressure, across the total business Margins will continue to come under pressure, across the total business Margins will continue to come under pressure, across the total business
Speed, convenience, innovation and value for money will remain key drivers Speed, convenience, innovation and value for money will remain key drivers Speed, convenience, innovation and value for money will remain key drivers
The Group will remain a sound business / investment proposition The Group will remain a sound business / investment proposition The Group will remain a sound business / investment proposition
46

Results presentation 2012
Questions
47

You’re in good company You’re in good company You’re in good company
Results presentation for the year ended 29 February 2012

Group information

Results presentation 2012
Strategic intent
Our business is focused on growth and development of
best-in-class franchised leisure brands supported by a business model which
maximises stakeholder value creation
50

Results presentation 2012
Famous Brands “Recipe”
Our primary orientation remains that of an integrated franchise system Our primary orientation remains that of an integrated franchise system Our primary orientation remains that of an integrated franchise system Building great and enduring brands will always be our obsession Building great and enduring brands will always be our obsession Building great and enduring brands will always be our obsession Our franchisees are our #1 customer and we must unshakeably offer them a business model that works Our franchisees are our #1 customer and we must unshakeably offer them a business model that works Our franchisees are our #1 customer and we must unshakeably offer them a business model that works We must be consumer driven – always affordable, available and accessible We must be consumer driven – always affordable, available and accessible We must be consumer driven – always affordable, available and accessible
Within our industry we will be the lowest cost producer Within our industry we will be the lowest cost producer Within our industry we will be the lowest cost producer
We will stay out of anything that is not leisure, food and beverage We will stay out of anything that is not leisure, food and beverage We will stay out of anything that is not leisure, food and beverage Remain a ‘family’ but never lose our high performance culture Remain a ‘family’ but never lose our high performance culture Remain a ‘family’ but never lose our high performance culture South Africa and rest of Africa are our #1 priority trading markets South Africa and rest of Africa are our #1 priority trading markets South Africa and rest of Africa are our #1 priority trading markets
51

Results presentation 2012
Business model
Franchising division
International - Houses the Group’s offshore intellectual property and brands This division is responsible for development of the existing Wimpy brand Domestic Mainstream Brands - Houses the Group’s brands that are of a mainstream nature, namely those brands which have broad consumer appeal and are wholly-owned trademarks. Whilst contained within a single business unit, the model of ‘brand stewardship’, or competition between brands is firmly entrenched through standalone strategic structures Domestic Developing Brands - Houses brands that are in a development phase, or are being restructured to compete tactically within clearly defined trade channels Theatre of Food Brands - Houses the Group’s niche brand trademarks which are held through joint venture partnerships in which the Group has a controlling interest
Franchising division Franchising division
52

Results presentation 2012
Business model
MAD Lab MAD is the acronym for Marketing . Artistry . Design. This newly created business unit has been established to bring about a significant step change in the Group’s marketing, new product development and restaurant design functions
MAD LabMAD Lab
Food Services Responsible for extending the Group’s trademarks into the FMCG retail and wholesale markets
Food Services Food Services
Procurement Custodian of the Group’s centralised procurement function. Accountable for procurement of all product, capital equipment, services and the like. Also serves as the Group’s sales forecasting and stock movement resource
Procurement Procurement
Development Provides a turnkey service to all of the Group’s brands and their respective franchise partners, offering a comprehensive range of services surrounding all new restaurant openings, revamps and relocations
Development Development
53

Results presentation 2012
Business model
New business Responsible for the centralised processing and approval of all new franchisee and landlord / developer enquiries. Accountable for all lease negotiations ensuring optimum rental agreements are negotiated on behalf of our franchise partners. Resourced also to manage the Group’s strategic alliance partners
New businessNew business
Manufacturing Represents a key part of the Group’s backward integration model, tasked with manufacturing a range of licensed products for use by the franchise network. Also accountable for quality assurance of all manufactured and outsourced products required by the various brands
Manufacturing Manufacturing
Logistics Represents the Group’s route-to-market, delivering to the franchise network a complete basket of products required for brand-specific menus
Logistics Logistics
Corporate Houses the Group’s ‘back of house’ functions which provide a service to the various operating business units
Corporate Corporate
54

Results presentation 2012
Current shareholding
Coronation Life Managers
Peter Halamandaris
Theofanis Halamandaris
Perikles Halamandaris
John Halamandres
Enderle SA (Pty) Ltd
Other
55
28.7%
11.7%
10.4% 8.2%
6.3%
5.0%
29.7%

Results presentation 2012
Operating profit – Local franchising
112 142
186 204
235 265
49,3%
54,8%
62,0% 62,5%
60,9% 60,2%
48%
50%
52%
54%
56%
58%
60%
62%
64%
0
50
100
150
200
250
300
2007 2008 2009 2010 2011 2012 Operating Profit Operating Margin
56
5 year compound growth 19% 62,0% 62,0%
62,5%
60,9% 60,2%
5 year compound growth 19%
5 year compound growth 19%
5 year compound growth 19%
Rm

Results presentation 2012
Operating profit – Supply chain
36
61 61
94 116
141
5,6%
8,1%
5,7%
7,8% 8,4%
8,7%
0%
1%
2%
3%
4%
5%
6%
7%
8%
9%
10%
0
20
40
60
80
100
120
140
160
2007 2008 2009 2010 2011 2012 Operating Profit Operating Margin
57
94 116
141
5,6% 5,6%
8,1%
5,7%
7,8% 8,4% 8,4%
8,7%
Rm

Results presentation 2012
Operating margin percentages – by division
49,3
54,8
62,0 62,5 60,9 60,2
17,3 18,3 16,9 18,3 19,1 19,1
10,9 9,6 10,1 11,3 9,2
5,6 8,1
5,7 7,8 8,4 8,7
0
10
20
30
40
50
60
70
2007 2008 2009 2010 2011 2012 Local Franchising Group United Kingdom Supply chain
58

Results presentation 2012
Operating margin percentages – Supply chain
9,5
7,3
9,7
11,7 11,7
2,1 2,4 3,0 3,0
3,5
0
2
4
6
8
10
12
14
2008 2009 2010 2011 2012 Manufacturing Logistics
59

Results presentation 2012
Ratios
42,0 45,2
37,4 38,2
42,5 44,5
36,1 38,0
33,4 36,1 35,7 34,5
2,4 2,5
2,2 2,1
2,2 2,3
2,4 2,2
2,1
1,8 1,6
1,4
1,0
1,5
2,0
2,5
3,0
3,5
4,0
0
5
10
15
20
25
30
35
40
45
50
2007 2008 2009 2010 2011 2012
Rona (%) ROE (%) Net Asset Turn (times) Dividend Cover (times)
60
% Times

Results presentation 2012
Ratios continued
3,5 4,3
5,2
6,2
7,4
8,7
7,0
30,3
45,8
27,5
14,3 9,7
0
5
10
15
20
25
30
35
40
45
50
0
1
2
3
4
5
6
7
8
9
10
2007 2008 2009 2010 2011 2012
Net asset value per share (R) (NAV) Debt/Equity (%)
61
NAV Debt/Equity %

Results presentation 2012
Consumer Recognition
62
BEST burger for the 16th consecutive year
BEST chips for the 14th consecutive year
BEST pizza for the 12th time
BEST coffee shop for the 12th consecutive year
BEST Breakfast
BEST New Restaurant
Source: Leisure Options

Results presentation 2012
Contact information
63
Kevin Hedderwick Chief Executive Officer +27 11 651 5812
Stan Aldridge Group Financial Director +27 11 651 5902
Del-Maree English Investor Communications +27 83 395 8608

You’re in good company You’re in good company You’re in good company
Results presentation for the year ended 29 February 2012