Your Monthly Neighborhood Market Report: May Edition
33
Stephany Oliveros Group
-
Upload
chi-properties -
Category
Documents
-
view
217 -
download
1
description
Here's your free digital monthly subscription of Chicago Neighborhood Market Report. Lots of exciting statistics. Hope you enjoy it! Call us anytime for questions 773-865-8575
Transcript of Your Monthly Neighborhood Market Report: May Edition

Stephany Oliveros Group

4-2014 4-2015 + / – 4-2014 4-2015 + / –
New Listings 20 23 + 15.0% 59 87 + 47.5%
Closed Sales 10 15 + 50.0% 26 47 + 80.8%
Median Sales Price* $357,500 $430,000 + 20.3% $266,000 $350,000 + 31.6%
Percent of Original List Price Received* 97.0% 95.5% - 1.6% 97.9% 93.8% - 4.1%
Market Time 72 105 + 44.4% 86 111 + 28.4%
Inventory of Homes for Sale 40 46 + 15.0% -- -- --
4-2014 4-2015 + / – 4-2014 4-2015 + / –
New Listings 22 41 + 86.4% 64 121 + 89.1%
Closed Sales 17 6 - 64.7% 40 42 + 5.0%
Median Sales Price* $150,000 $127,500 - 15.0% $126,750 $153,250 + 20.9%
Percent of Original List Price Received* 91.8% 88.1% - 4.1% 93.8% 89.7% - 4.3%
Market Time 93 109 + 17.7% 118 104 - 11.8%
Inventory of Homes for Sale 43 65 + 51.2% -- -- --* Does not account for sale concessions and/or down payment assistance. Note: Activity for one month can sometimes look extreme due to small sample size.
Local Market Update – April 2015
Albany Park+ 52.4% - 22.2% + 33.7%
Change inNew ListingsAll Properties
Change inClosed SalesAll Properties
Change in Inventory of Homes
All Properties
Detached Single-FamilyApril Year to Date
Attached Single-FamilyApril Year to Date
Change in Median Sales Price from Prior Year (6-Month Average)†
All All
Albany Park Albany Park
- 40%
- 30%
- 20%
- 10%
0%
+ 10%
+ 20%
+ 30%
+ 40%
+ 50%
+ 60%
+ 70%
1-2009 1-2010 1-2011 1-2012 1-2013 1-2014 1-2015
Detached Single-Familyb
a
- 80%
- 60%
- 40%
- 20%
0%
+ 20%
+ 40%
+ 60%
+ 80%
+ 100%
1-2009 1-2010 1-2011 1-2012 1-2013 1-2014 1-2015
Attached Single-Familyb
a
A Research Tool Provided by the Chicago Association of REALTORS®
† Each dot represents the change in median sales price from the prior year using a 6-month weighted average. This means that each of the 6 months usedin a dot are proportioned according to their share of sales during that period. | Current as of April 14, 2015. All data from Midwest Real Estate Data.

4-2014 4-2015 + / – 4-2014 4-2015 + / –
New Listings 78 70 - 10.3% 246 270 + 9.8%
Closed Sales 32 38 + 18.8% 115 146 + 27.0%
Median Sales Price* $104,250 $126,000 + 20.9% $118,000 $129,500 + 9.7%
Percent of Original List Price Received* 93.1% 93.9% + 0.8% 97.7% 94.2% - 3.6%
Market Time 67 108 + 61.7% 92 86 - 6.9%
Inventory of Homes for Sale 154 118 - 23.4% -- -- --
4-2014 4-2015 + / – 4-2014 4-2015 + / –
New Listings 2 0 - 100.0% 7 2 - 71.4%
Closed Sales 1 0 - 100.0% 6 0 - 100.0%
Median Sales Price* $30,000 $0 - 100.0% $28,250 $0 - 100.0%
Percent of Original List Price Received* 115.8% 0.0% - 100.0% 101.2% 0.0% - 100.0%
Market Time 18 0 - 100.0% 35 0 - 100.0%
Inventory of Homes for Sale 5 1 - 80.0% -- -- --* Does not account for sale concessions and/or down payment assistance. Note: Activity for one month can sometimes look extreme due to small sample size.
Local Market Update – April 2015
Ashburn- 12.5% + 15.2% - 25.2%
Change inNew ListingsAll Properties
Change inClosed SalesAll Properties
Change in Inventory of Homes
All Properties
Detached Single-FamilyApril Year to Date
Attached Single-FamilyApril Year to Date
Change in Median Sales Price from Prior Year (6-Month Average)†
All All
Ashburn Ashburn
- 40%
- 30%
- 20%
- 10%
0%
+ 10%
+ 20%
+ 30%
1-2009 1-2010 1-2011 1-2012 1-2013 1-2014 1-2015
Detached Single-Familyb
a
- 100%
- 50%
0%
+ 50%
+ 100%
+ 150%
+ 200%
+ 250%
+ 300%
1-2009 1-2010 1-2011 1-2012 1-2013 1-2014 1-2015
Attached Single-Familyb
a
A Research Tool Provided by the Chicago Association of REALTORS®
† Each dot represents the change in median sales price from the prior year using a 6-month weighted average. This means that each of the 6 months usedin a dot are proportioned according to their share of sales during that period. | Current as of April 14, 2015. All data from Midwest Real Estate Data.

4-2014 4-2015 + / – 4-2014 4-2015 + / –
New Listings 20 30 + 50.0% 55 81 + 47.3%
Closed Sales 11 9 - 18.2% 29 33 + 13.8%
Median Sales Price* $204,000 $429,000 + 110.3% $235,000 $430,000 + 83.0%
Percent of Original List Price Received* 95.6% 99.6% + 4.2% 99.3% 97.5% - 1.7%
Market Time 93 30 - 68.0% 55 58 + 6.5%
Inventory of Homes for Sale 32 33 + 3.1% -- -- --
4-2014 4-2015 + / – 4-2014 4-2015 + / –
New Listings 21 20 - 4.8% 97 77 - 20.6%
Closed Sales 13 17 + 30.8% 26 62 + 138.5%
Median Sales Price* $243,000 $280,000 + 15.2% $215,000 $315,950 + 47.0%
Percent of Original List Price Received* 96.1% 102.9% + 7.1% 94.3% 98.0% + 3.9%
Market Time 255 68 - 73.3% 186 75 - 59.5%
Inventory of Homes for Sale 38 32 - 15.8% -- -- --* Does not account for sale concessions and/or down payment assistance. Note: Activity for one month can sometimes look extreme due to small sample size.
Local Market Update – April 2015
Avondale+ 22.0% + 8.3% - 7.1%
Change inNew ListingsAll Properties
Change inClosed SalesAll Properties
Change in Inventory of Homes
All Properties
Detached Single-FamilyApril Year to Date
Attached Single-FamilyApril Year to Date
Change in Median Sales Price from Prior Year (6-Month Average)†
All All
Avondale Avondale
- 60%
- 40%
- 20%
0%
+ 20%
+ 40%
+ 60%
+ 80%
+ 100%
+ 120%
+ 140%
1-2009 1-2010 1-2011 1-2012 1-2013 1-2014 1-2015
Detached Single-Familyb
a
- 60%
- 40%
- 20%
0%
+ 20%
+ 40%
+ 60%
+ 80%
+ 100%
1-2009 1-2010 1-2011 1-2012 1-2013 1-2014 1-2015
Attached Single-Familyb
a
A Research Tool Provided by the Chicago Association of REALTORS®
† Each dot represents the change in median sales price from the prior year using a 6-month weighted average. This means that each of the 6 months usedin a dot are proportioned according to their share of sales during that period. | Current as of April 14, 2015. All data from Midwest Real Estate Data.
4-2014 4-2015 + / – 4-2014 4-2015 + / –
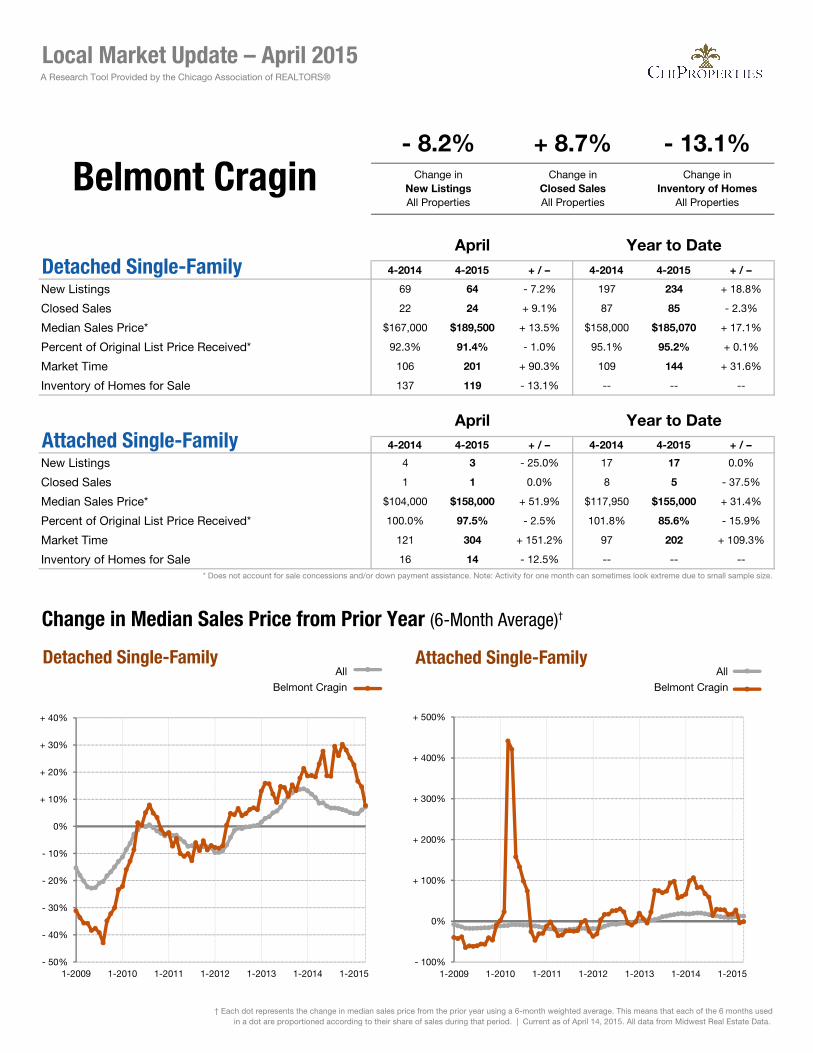
New Listings 69 64 - 7.2% 197 234 + 18.8%
Closed Sales 22 24 + 9.1% 87 85 - 2.3%
Median Sales Price* $167,000 $189,500 + 13.5% $158,000 $185,070 + 17.1%
Percent of Original List Price Received* 92.3% 91.4% - 1.0% 95.1% 95.2% + 0.1%
Market Time 106 201 + 90.3% 109 144 + 31.6%
Inventory of Homes for Sale 137 119 - 13.1% -- -- --
4-2014 4-2015 + / – 4-2014 4-2015 + / –
New Listings 4 3 - 25.0% 17 17 0.0%
Closed Sales 1 1 0.0% 8 5 - 37.5%
Median Sales Price* $104,000 $158,000 + 51.9% $117,950 $155,000 + 31.4%
Percent of Original List Price Received* 100.0% 97.5% - 2.5% 101.8% 85.6% - 15.9%
Market Time 121 304 + 151.2% 97 202 + 109.3%
Inventory of Homes for Sale 16 14 - 12.5% -- -- --* Does not account for sale concessions and/or down payment assistance. Note: Activity for one month can sometimes look extreme due to small sample size.
Local Market Update – April 2015
Belmont Cragin- 8.2% + 8.7% - 13.1%
Change inNew ListingsAll Properties
Change inClosed SalesAll Properties
Change in Inventory of Homes
All Properties
Detached Single-FamilyApril Year to Date
Attached Single-FamilyApril Year to Date
Change in Median Sales Price from Prior Year (6-Month Average)†
All All
Belmont Cragin Belmont Cragin
- 50%
- 40%
- 30%
- 20%
- 10%
0%
+ 10%
+ 20%
+ 30%
+ 40%
1-2009 1-2010 1-2011 1-2012 1-2013 1-2014 1-2015
Detached Single-Familyb
a
- 100%
0%
+ 100%
+ 200%
+ 300%
+ 400%
+ 500%
1-2009 1-2010 1-2011 1-2012 1-2013 1-2014 1-2015
Attached Single-Familyb
a
A Research Tool Provided by the Chicago Association of REALTORS®
† Each dot represents the change in median sales price from the prior year using a 6-month weighted average. This means that each of the 6 months usedin a dot are proportioned according to their share of sales during that period. | Current as of April 14, 2015. All data from Midwest Real Estate Data.

4-2014 4-2015 + / – 4-2014 4-2015 + / –
New Listings 28 50 + 78.6% 109 145 + 33.0%
Closed Sales 15 13 - 13.3% 50 42 - 16.0%
Median Sales Price* $253,000 $295,000 + 16.6% $267,500 $266,250 - 0.5%
Percent of Original List Price Received* 87.3% 100.5% + 15.1% 90.3% 96.0% + 6.3%
Market Time 125 90 - 28.1% 123 132 + 7.7%
Inventory of Homes for Sale 66 86 + 30.3% -- -- --
4-2014 4-2015 + / – 4-2014 4-2015 + / –
New Listings 3 1 - 66.7% 7 10 + 42.9%
Closed Sales 2 1 - 50.0% 5 4 - 20.0%
Median Sales Price* $38,050 $234,000 + 515.0% $25,000 $111,500 + 346.0%
Percent of Original List Price Received* 62.7% 94.0% + 50.0% 55.0% 104.1% + 89.1%
Market Time 204 235 + 15.2% 174 226 + 29.9%
Inventory of Homes for Sale 5 9 + 80.0% -- -- --* Does not account for sale concessions and/or down payment assistance. Note: Activity for one month can sometimes look extreme due to small sample size.
Local Market Update – April 2015
Beverly+ 64.5% - 17.6% + 33.8%
Change inNew ListingsAll Properties
Change inClosed SalesAll Properties
Change in Inventory of Homes
All Properties
Detached Single-FamilyApril Year to Date
Attached Single-FamilyApril Year to Date
Change in Median Sales Price from Prior Year (6-Month Average)†
All All
Beverly Beverly
- 30%
- 20%
- 10%
0%
+ 10%
+ 20%
+ 30%
+ 40%
+ 50%
+ 60%
+ 70%
1-2009 1-2010 1-2011 1-2012 1-2013 1-2014 1-2015
Detached Single-Familyb
a
- 100%
- 50%
0%
+ 50%
+ 100%
+ 150%
+ 200%
+ 250%
+ 300%
1-2009 1-2010 1-2011 1-2012 1-2013 1-2014 1-2015
Attached Single-Familyb
a
A Research Tool Provided by the Chicago Association of REALTORS®
† Each dot represents the change in median sales price from the prior year using a 6-month weighted average. This means that each of the 6 months usedin a dot are proportioned according to their share of sales during that period. | Current as of April 14, 2015. All data from Midwest Real Estate Data.

4-2014 4-2015 + / – 4-2014 4-2015 + / –
New Listings 20 17 - 15.0% 47 56 + 19.1%
Closed Sales 10 3 - 70.0% 28 18 - 35.7%
Median Sales Price* $409,566 $305,000 - 25.5% $329,500 $390,300 + 18.5%
Percent of Original List Price Received* 98.5% 92.0% - 6.6% 94.2% 94.6% + 0.4%
Market Time 92 132 + 43.2% 104 117 + 12.2%
Inventory of Homes for Sale 41 37 - 9.8% -- -- --
4-2014 4-2015 + / – 4-2014 4-2015 + / –
New Listings 9 7 - 22.2% 27 23 - 14.8%
Closed Sales 4 1 - 75.0% 9 10 + 11.1%
Median Sales Price* $175,000 $391,000 + 123.4% $175,000 $192,000 + 9.7%
Percent of Original List Price Received* 96.7% 98.0% + 1.4% 94.7% 93.9% - 0.8%
Market Time 78 102 + 31.6% 145 54 - 62.5%
Inventory of Homes for Sale 22 19 - 13.6% -- -- --* Does not account for sale concessions and/or down payment assistance. Note: Activity for one month can sometimes look extreme due to small sample size.
Local Market Update – April 2015
Bridgeport- 17.2% - 71.4% - 11.1%
Change inNew ListingsAll Properties
Change inClosed SalesAll Properties
Change in Inventory of Homes
All Properties
Detached Single-FamilyApril Year to Date
Attached Single-FamilyApril Year to Date
Change in Median Sales Price from Prior Year (6-Month Average)†
All All
Bridgeport Bridgeport
- 40%
- 30%
- 20%
- 10%
0%
+ 10%
+ 20%
+ 30%
+ 40%
+ 50%
+ 60%
1-2009 1-2010 1-2011 1-2012 1-2013 1-2014 1-2015
Detached Single-Familyb
a
- 40%
- 30%
- 20%
- 10%
0%
+ 10%
+ 20%
+ 30%
+ 40%
+ 50%
+ 60%
1-2009 1-2010 1-2011 1-2012 1-2013 1-2014 1-2015
Attached Single-Familyb
a
A Research Tool Provided by the Chicago Association of REALTORS®
† Each dot represents the change in median sales price from the prior year using a 6-month weighted average. This means that each of the 6 months usedin a dot are proportioned according to their share of sales during that period. | Current as of April 14, 2015. All data from Midwest Real Estate Data.
4-2014 4-2015 + / – 4-2014 4-2015 + / –
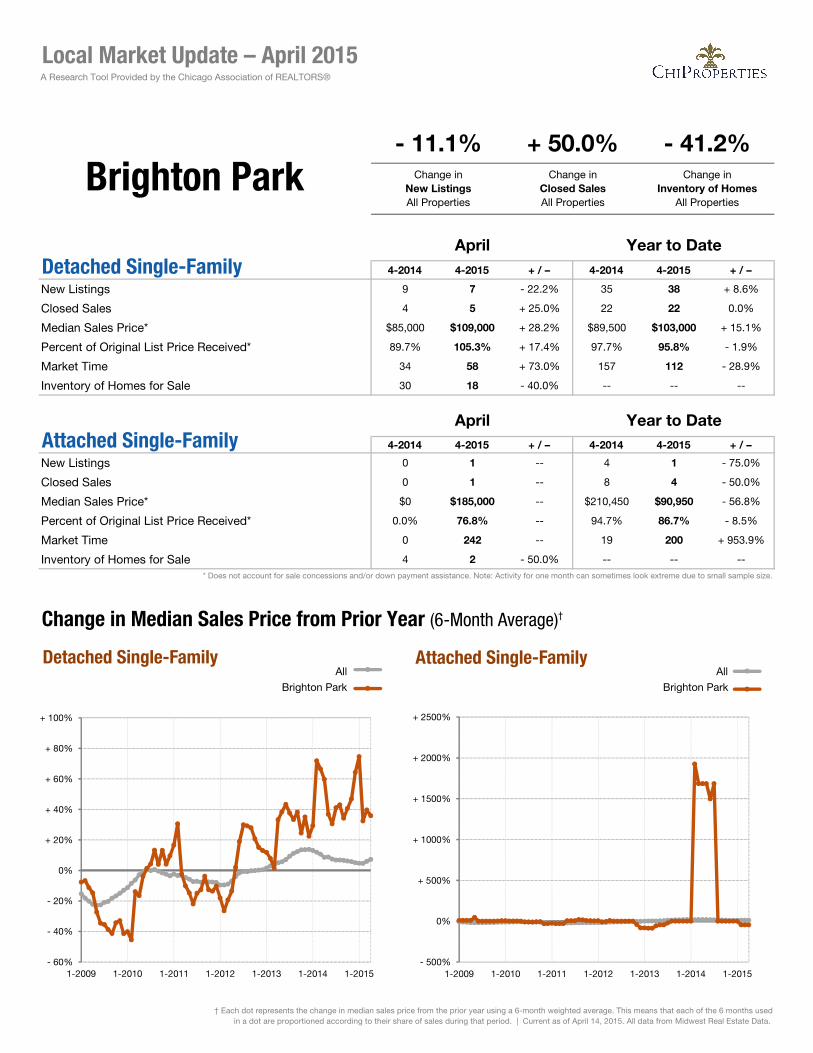
New Listings 9 7 - 22.2% 35 38 + 8.6%
Closed Sales 4 5 + 25.0% 22 22 0.0%
Median Sales Price* $85,000 $109,000 + 28.2% $89,500 $103,000 + 15.1%
Percent of Original List Price Received* 89.7% 105.3% + 17.4% 97.7% 95.8% - 1.9%
Market Time 34 58 + 73.0% 157 112 - 28.9%
Inventory of Homes for Sale 30 18 - 40.0% -- -- --
4-2014 4-2015 + / – 4-2014 4-2015 + / –
New Listings 0 1 -- 4 1 - 75.0%
Closed Sales 0 1 -- 8 4 - 50.0%
Median Sales Price* $0 $185,000 -- $210,450 $90,950 - 56.8%
Percent of Original List Price Received* 0.0% 76.8% -- 94.7% 86.7% - 8.5%
Market Time 0 242 -- 19 200 + 953.9%
Inventory of Homes for Sale 4 2 - 50.0% -- -- --* Does not account for sale concessions and/or down payment assistance. Note: Activity for one month can sometimes look extreme due to small sample size.
Local Market Update – April 2015
Brighton Park- 11.1% + 50.0% - 41.2%
Change inNew ListingsAll Properties
Change inClosed SalesAll Properties
Change in Inventory of Homes
All Properties
Detached Single-FamilyApril Year to Date
Attached Single-FamilyApril Year to Date
Change in Median Sales Price from Prior Year (6-Month Average)†
All All
Brighton Park Brighton Park
- 60%
- 40%
- 20%
0%
+ 20%
+ 40%
+ 60%
+ 80%
+ 100%
1-2009 1-2010 1-2011 1-2012 1-2013 1-2014 1-2015
Detached Single-Familyb
a
- 500%
0%
+ 500%
+ 1000%
+ 1500%
+ 2000%
+ 2500%
1-2009 1-2010 1-2011 1-2012 1-2013 1-2014 1-2015
Attached Single-Familyb
a
A Research Tool Provided by the Chicago Association of REALTORS®
† Each dot represents the change in median sales price from the prior year using a 6-month weighted average. This means that each of the 6 months usedin a dot are proportioned according to their share of sales during that period. | Current as of April 14, 2015. All data from Midwest Real Estate Data.

4-2014 4-2015 + / – 4-2014 4-2015 + / –
New Listings 72 86 + 19.4% 178 241 + 35.4%
Closed Sales 29 42 + 44.8% 94 114 + 21.3%
Median Sales Price* $210,000 $200,500 - 4.5% $206,000 $217,450 + 5.6%
Percent of Original List Price Received* 95.9% 91.0% - 5.1% 95.3% 92.4% - 3.0%
Market Time 56 114 + 103.4% 96 117 + 22.0%
Inventory of Homes for Sale 119 129 + 8.4% -- -- --
4-2014 4-2015 + / – 4-2014 4-2015 + / –
New Listings 15 16 + 6.7% 49 55 + 12.2%
Closed Sales 11 8 - 27.3% 34 26 - 23.5%
Median Sales Price* $119,950 $165,950 + 38.3% $132,500 $158,000 + 19.2%
Percent of Original List Price Received* 96.3% 94.4% - 2.0% 94.9% 98.5% + 3.8%
Market Time 60 18 - 70.8% 122 60 - 50.9%
Inventory of Homes for Sale 25 23 - 8.0% -- -- --* Does not account for sale concessions and/or down payment assistance. Note: Activity for one month can sometimes look extreme due to small sample size.
Local Market Update – April 2015
Dunning+ 17.2% + 25.0% + 5.6%
Change inNew ListingsAll Properties
Change inClosed SalesAll Properties
Change in Inventory of Homes
All Properties
Detached Single-FamilyApril Year to Date
Attached Single-FamilyApril Year to Date
Change in Median Sales Price from Prior Year (6-Month Average)†
All All
Dunning Dunning
- 30%
- 20%
- 10%
0%
+ 10%
+ 20%
+ 30%
1-2009 1-2010 1-2011 1-2012 1-2013 1-2014 1-2015
Detached Single-Familyb
a
- 50%
- 40%
- 30%
- 20%
- 10%
0%
+ 10%
+ 20%
+ 30%
+ 40%
+ 50%
1-2009 1-2010 1-2011 1-2012 1-2013 1-2014 1-2015
Attached Single-Familyb
a
A Research Tool Provided by the Chicago Association of REALTORS®
† Each dot represents the change in median sales price from the prior year using a 6-month weighted average. This means that each of the 6 months usedin a dot are proportioned according to their share of sales during that period. | Current as of April 14, 2015. All data from Midwest Real Estate Data.

4-2014 4-2015 + / – 4-2014 4-2015 + / –
New Listings 12 23 + 91.7% 41 56 + 36.6%
Closed Sales 6 9 + 50.0% 23 31 + 34.8%
Median Sales Price* $83,500 $95,000 + 13.8% $57,000 $63,000 + 10.5%
Percent of Original List Price Received* 96.5% 81.7% - 15.3% 85.0% 83.4% - 1.8%
Market Time 319 129 - 59.6% 188 121 - 35.7%
Inventory of Homes for Sale 49 47 - 4.1% -- -- --
4-2014 4-2015 + / – 4-2014 4-2015 + / –
New Listings 1 0 - 100.0% 1 3 + 200.0%
Closed Sales 0 1 -- 0 1 --
Median Sales Price* $0 $50,000 -- $0 $50,000 --
Percent of Original List Price Received* 0.0% 86.6% -- 0.0% 86.6% --
Market Time 0 81 -- 0 81 --
Inventory of Homes for Sale 1 1 0.0% -- -- --* Does not account for sale concessions and/or down payment assistance. Note: Activity for one month can sometimes look extreme due to small sample size.
Local Market Update – April 2015
East Side+ 76.9% + 66.7% - 4.0%
Change inNew ListingsAll Properties
Change inClosed SalesAll Properties
Change in Inventory of Homes
All Properties
Detached Single-FamilyApril Year to Date
Attached Single-FamilyApril Year to Date
Change in Median Sales Price from Prior Year (6-Month Average)†
All All
East Side East Side
- 60%
- 40%
- 20%
0%
+ 20%
+ 40%
+ 60%
1-2009 1-2010 1-2011 1-2012 1-2013 1-2014 1-2015
Detached Single-Familyb
a
- 30%
- 20%
- 10%
0%
+ 10%
+ 20%
+ 30%
+ 40%
+ 50%
1-2009 1-2010 1-2011 1-2012 1-2013 1-2014 1-2015
Attached Single-Familyb
a
A Research Tool Provided by the Chicago Association of REALTORS®
† Each dot represents the change in median sales price from the prior year using a 6-month weighted average. This means that each of the 6 months usedin a dot are proportioned according to their share of sales during that period. | Current as of April 14, 2015. All data from Midwest Real Estate Data.

4-2014 4-2015 + / – 4-2014 4-2015 + / –
New Listings 22 31 + 40.9% 59 69 + 16.9%
Closed Sales 8 8 0.0% 26 30 + 15.4%
Median Sales Price* $309,950 $381,250 + 23.0% $295,950 $327,000 + 10.5%
Percent of Original List Price Received* 95.4% 92.4% - 3.1% 98.1% 93.8% - 4.4%
Market Time 127 154 + 21.4% 149 110 - 26.2%
Inventory of Homes for Sale 26 30 + 15.4% -- -- --
4-2014 4-2015 + / – 4-2014 4-2015 + / –
New Listings 8 10 + 25.0% 22 34 + 54.5%
Closed Sales 4 2 - 50.0% 7 15 + 114.3%
Median Sales Price* $116,000 $96,200 - 17.1% $104,900 $105,000 + 0.1%
Percent of Original List Price Received* 90.7% 101.4% + 11.8% 93.2% 96.2% + 3.2%
Market Time 258 153 - 40.8% 155 91 - 40.9%
Inventory of Homes for Sale 14 16 + 14.3% -- -- --* Does not account for sale concessions and/or down payment assistance. Note: Activity for one month can sometimes look extreme due to small sample size.
Local Market Update – April 2015
Edison Park+ 36.7% - 16.7% + 15.0%
Change inNew ListingsAll Properties
Change inClosed SalesAll Properties
Change in Inventory of Homes
All Properties
Detached Single-FamilyApril Year to Date
Attached Single-FamilyApril Year to Date
Change in Median Sales Price from Prior Year (6-Month Average)†
All All
Edison Park Edison Park
- 30%
- 20%
- 10%
0%
+ 10%
+ 20%
+ 30%
+ 40%
+ 50%
1-2009 1-2010 1-2011 1-2012 1-2013 1-2014 1-2015
Detached Single-Familyb
a
- 50%
- 40%
- 30%
- 20%
- 10%
0%
+ 10%
+ 20%
+ 30%
+ 40%
+ 50%
1-2009 1-2010 1-2011 1-2012 1-2013 1-2014 1-2015
Attached Single-Familyb
a
A Research Tool Provided by the Chicago Association of REALTORS®
† Each dot represents the change in median sales price from the prior year using a 6-month weighted average. This means that each of the 6 months usedin a dot are proportioned according to their share of sales during that period. | Current as of April 14, 2015. All data from Midwest Real Estate Data.

4-2014 4-2015 + / – 4-2014 4-2015 + / –
New Listings 37 53 + 43.2% 125 152 + 21.6%
Closed Sales 24 21 - 12.5% 57 58 + 1.8%
Median Sales Price* $425,000 $478,375 + 12.6% $400,000 $430,000 + 7.5%
Percent of Original List Price Received* 96.0% 94.6% - 1.5% 94.6% 93.9% - 0.8%
Market Time 72 118 + 63.1% 110 120 + 9.6%
Inventory of Homes for Sale 64 86 + 34.4% -- -- --
4-2014 4-2015 + / – 4-2014 4-2015 + / –
New Listings 3 2 - 33.3% 10 11 + 10.0%
Closed Sales 0 3 -- 3 5 + 66.7%
Median Sales Price* $0 $195,000 -- $150,299 $179,000 + 19.1%
Percent of Original List Price Received* 0.0% 102.1% -- 91.9% 101.6% + 10.5%
Market Time 0 21 -- 55 21 - 62.8%
Inventory of Homes for Sale 10 4 - 60.0% -- -- --* Does not account for sale concessions and/or down payment assistance. Note: Activity for one month can sometimes look extreme due to small sample size.
Local Market Update – April 2015
Forest Glen+ 37.5% 0.0% + 21.6%
Change inNew ListingsAll Properties
Change inClosed SalesAll Properties
Change in Inventory of Homes
All Properties
Detached Single-FamilyApril Year to Date
Attached Single-FamilyApril Year to Date
Change in Median Sales Price from Prior Year (6-Month Average)†
All All
Forest Glen Forest Glen
- 25%
- 20%
- 15%
- 10%
- 5%
0%
+ 5%
+ 10%
+ 15%
+ 20%
+ 25%
1-2009 1-2010 1-2011 1-2012 1-2013 1-2014 1-2015
Detached Single-Familyb
a
- 40%
- 20%
0%
+ 20%
+ 40%
+ 60%
+ 80%
+ 100%
+ 120%
+ 140%
1-2009 1-2010 1-2011 1-2012 1-2013 1-2014 1-2015
Attached Single-Familyb
a
A Research Tool Provided by the Chicago Association of REALTORS®
† Each dot represents the change in median sales price from the prior year using a 6-month weighted average. This means that each of the 6 months usedin a dot are proportioned according to their share of sales during that period. | Current as of April 14, 2015. All data from Midwest Real Estate Data.

4-2014 4-2015 + / – 4-2014 4-2015 + / –
New Listings 3 1 - 66.7% 8 6 - 25.0%
Closed Sales 0 0 -- 4 4 0.0%
Median Sales Price* $0 $0 -- $56,500 $39,000 - 31.0%
Percent of Original List Price Received* 0.0% 0.0% -- 67.6% 87.1% + 28.8%
Market Time 0 0 -- 164 106 - 35.6%
Inventory of Homes for Sale 8 3 - 62.5% -- -- --
4-2014 4-2015 + / – 4-2014 4-2015 + / –
New Listings 1 0 - 100.0% 1 1 0.0%
Closed Sales 0 0 -- 0 1 --
Median Sales Price* $0 $0 -- $0 $14,003 --
Percent of Original List Price Received* 0.0% 0.0% -- 0.0% 103.7% --
Market Time 0 0 -- 0 7 --
Inventory of Homes for Sale 1 0 - 100.0% -- -- --* Does not account for sale concessions and/or down payment assistance. Note: Activity for one month can sometimes look extreme due to small sample size.
Local Market Update – April 2015
Fuller Park- 75.0% 0.0% - 66.7%
Change inNew ListingsAll Properties
Change inClosed SalesAll Properties
Change in Inventory of Homes
All Properties
Detached Single-FamilyApril Year to Date
Attached Single-FamilyApril Year to Date
Change in Median Sales Price from Prior Year (6-Month Average)†
All All
Fuller Park Fuller Park
- 200%
0%
+ 200%
+ 400%
+ 600%
+ 800%
+ 1000%
1-2009 1-2010 1-2011 1-2012 1-2013 1-2014 1-2015
Detached Single-Familyb
a
- 25%
- 20%
- 15%
- 10%
- 5%
0%
+ 5%
+ 10%
+ 15%
+ 20%
+ 25%
1-2009 1-2010 1-2011 1-2012 1-2013 1-2014 1-2015
Attached Single-Familyb
a
A Research Tool Provided by the Chicago Association of REALTORS®
† Each dot represents the change in median sales price from the prior year using a 6-month weighted average. This means that each of the 6 months usedin a dot are proportioned according to their share of sales during that period. | Current as of April 14, 2015. All data from Midwest Real Estate Data.

4-2014 4-2015 + / – 4-2014 4-2015 + / –
New Listings 24 21 - 12.5% 82 73 - 11.0%
Closed Sales 14 12 - 14.3% 40 46 + 15.0%
Median Sales Price* $87,250 $117,000 + 34.1% $77,100 $99,000 + 28.4%
Percent of Original List Price Received* 98.8% 99.9% + 1.0% 99.9% 94.7% - 5.2%
Market Time 43 88 + 103.2% 45 98 + 116.9%
Inventory of Homes for Sale 51 42 - 17.6% -- -- --
4-2014 4-2015 + / – 4-2014 4-2015 + / –
New Listings 0 0 -- 3 0 - 100.0%
Closed Sales 0 0 -- 1 2 + 100.0%
Median Sales Price* $0 $0 -- $36,000 $30,825 - 14.4%
Percent of Original List Price Received* 0.0% 0.0% -- 90.0% 61.7% - 31.5%
Market Time 0 0 -- 862 109 - 87.4%
Inventory of Homes for Sale 2 1 - 50.0% -- -- --* Does not account for sale concessions and/or down payment assistance. Note: Activity for one month can sometimes look extreme due to small sample size.
Local Market Update – April 2015
Gage Park- 12.5% - 14.3% - 18.9%
Change inNew ListingsAll Properties
Change inClosed SalesAll Properties
Change in Inventory of Homes
All Properties
Detached Single-FamilyApril Year to Date
Attached Single-FamilyApril Year to Date
Change in Median Sales Price from Prior Year (6-Month Average)†
All All
Gage Park Gage Park
- 80%
- 60%
- 40%
- 20%
0%
+ 20%
+ 40%
+ 60%
+ 80%
1-2009 1-2010 1-2011 1-2012 1-2013 1-2014 1-2015
Detached Single-Familyb
a
- 25%
- 20%
- 15%
- 10%
- 5%
0%
+ 5%
+ 10%
+ 15%
+ 20%
+ 25%
1-2009 1-2010 1-2011 1-2012 1-2013 1-2014 1-2015
Attached Single-Familyb
a
A Research Tool Provided by the Chicago Association of REALTORS®
† Each dot represents the change in median sales price from the prior year using a 6-month weighted average. This means that each of the 6 months usedin a dot are proportioned according to their share of sales during that period. | Current as of April 14, 2015. All data from Midwest Real Estate Data.

4-2014 4-2015 + / – 4-2014 4-2015 + / –
New Listings 61 88 + 44.3% 169 225 + 33.1%
Closed Sales 28 26 - 7.1% 88 98 + 11.4%
Median Sales Price* $156,050 $180,750 + 15.8% $164,000 $185,000 + 12.8%
Percent of Original List Price Received* 95.0% 90.6% - 4.5% 92.7% 92.9% + 0.3%
Market Time 100 99 - 1.0% 124 99 - 19.9%
Inventory of Homes for Sale 101 131 + 29.7% -- -- --
4-2014 4-2015 + / – 4-2014 4-2015 + / –
New Listings 2 2 0.0% 4 5 + 25.0%
Closed Sales 3 2 - 33.3% 6 5 - 16.7%
Median Sales Price* $40,000 $61,250 + 53.1% $83,500 $53,000 - 36.5%
Percent of Original List Price Received* 69.1% 83.6% + 20.9% 81.2% 83.1% + 2.4%
Market Time 122 157 + 27.9% 162 337 + 107.7%
Inventory of Homes for Sale 5 2 - 60.0% -- -- --* Does not account for sale concessions and/or down payment assistance. Note: Activity for one month can sometimes look extreme due to small sample size.
Local Market Update – April 2015
Garfield Ridge+ 42.9% - 9.7% + 25.5%
Change inNew ListingsAll Properties
Change inClosed SalesAll Properties
Change in Inventory of Homes
All Properties
Detached Single-FamilyApril Year to Date
Attached Single-FamilyApril Year to Date
Change in Median Sales Price from Prior Year (6-Month Average)†
All All
Garfield Ridge Garfield Ridge
- 30%
- 25%
- 20%
- 15%
- 10%
- 5%
0%
+ 5%
+ 10%
+ 15%
+ 20%
+ 25%
1-2009 1-2010 1-2011 1-2012 1-2013 1-2014 1-2015
Detached Single-Familyb
a
- 60%
- 40%
- 20%
0%
+ 20%
+ 40%
+ 60%
+ 80%
+ 100%
+ 120%
1-2009 1-2010 1-2011 1-2012 1-2013 1-2014 1-2015
Attached Single-Familyb
a
A Research Tool Provided by the Chicago Association of REALTORS®
† Each dot represents the change in median sales price from the prior year using a 6-month weighted average. This means that each of the 6 months usedin a dot are proportioned according to their share of sales during that period. | Current as of April 14, 2015. All data from Midwest Real Estate Data.

4-2014 4-2015 + / – 4-2014 4-2015 + / –
New Listings 10 14 + 40.0% 38 45 + 18.4%
Closed Sales 11 7 - 36.4% 24 25 + 4.2%
Median Sales Price* $96,000 $258,000 + 168.8% $130,500 $180,000 + 37.9%
Percent of Original List Price Received* 93.0% 98.5% + 5.9% 96.7% 95.5% - 1.2%
Market Time 195 45 - 76.8% 139 72 - 48.3%
Inventory of Homes for Sale 26 23 - 11.5% -- -- --
4-2014 4-2015 + / – 4-2014 4-2015 + / –
New Listings 5 2 - 60.0% 15 7 - 53.3%
Closed Sales 2 4 + 100.0% 5 4 - 20.0%
Median Sales Price* $49,000 $62,500 + 27.6% $64,900 $62,500 - 3.7%
Percent of Original List Price Received* 98.3% 114.3% + 16.3% 98.7% 114.3% + 15.9%
Market Time 40 23 - 42.4% 49 23 - 53.4%
Inventory of Homes for Sale 7 6 - 14.3% -- -- --* Does not account for sale concessions and/or down payment assistance. Note: Activity for one month can sometimes look extreme due to small sample size.
Local Market Update – April 2015
Hermosa+ 6.7% - 15.4% - 12.1%
Change inNew ListingsAll Properties
Change inClosed SalesAll Properties
Change in Inventory of Homes
All Properties
Detached Single-FamilyApril Year to Date
Attached Single-FamilyApril Year to Date
Change in Median Sales Price from Prior Year (6-Month Average)†
All All
Hermosa Hermosa
- 60%
- 40%
- 20%
0%
+ 20%
+ 40%
+ 60%
+ 80%
1-2009 1-2010 1-2011 1-2012 1-2013 1-2014 1-2015
Detached Single-Familyb
a
- 100%
- 50%
0%
+ 50%
+ 100%
+ 150%
+ 200%
+ 250%
1-2009 1-2010 1-2011 1-2012 1-2013 1-2014 1-2015
Attached Single-Familyb
a
A Research Tool Provided by the Chicago Association of REALTORS®
† Each dot represents the change in median sales price from the prior year using a 6-month weighted average. This means that each of the 6 months usedin a dot are proportioned according to their share of sales during that period. | Current as of April 14, 2015. All data from Midwest Real Estate Data.

4-2014 4-2015 + / – 4-2014 4-2015 + / –
New Listings 41 57 + 39.0% 122 173 + 41.8%
Closed Sales 14 21 + 50.0% 63 66 + 4.8%
Median Sales Price* $440,000 $387,000 - 12.0% $352,450 $383,751 + 8.9%
Percent of Original List Price Received* 100.2% 95.0% - 5.2% 96.9% 94.7% - 2.2%
Market Time 145 94 - 34.9% 113 91 - 19.8%
Inventory of Homes for Sale 70 72 + 2.9% -- -- --
4-2014 4-2015 + / – 4-2014 4-2015 + / –
New Listings 33 44 + 33.3% 101 148 + 46.5%
Closed Sales 14 19 + 35.7% 47 61 + 29.8%
Median Sales Price* $140,550 $210,000 + 49.4% $103,900 $165,200 + 59.0%
Percent of Original List Price Received* 90.0% 94.7% + 5.2% 95.8% 93.0% - 2.9%
Market Time 115 76 - 34.4% 113 81 - 28.3%
Inventory of Homes for Sale 78 85 + 9.0% -- -- --* Does not account for sale concessions and/or down payment assistance. Note: Activity for one month can sometimes look extreme due to small sample size.
Local Market Update – April 2015
Irving Park+ 36.5% + 42.9% + 6.1%
Change inNew ListingsAll Properties
Change inClosed SalesAll Properties
Change in Inventory of Homes
All Properties
Detached Single-FamilyApril Year to Date
Attached Single-FamilyApril Year to Date
Change in Median Sales Price from Prior Year (6-Month Average)†
All All
Irving Park Irving Park
- 40%
- 30%
- 20%
- 10%
0%
+ 10%
+ 20%
+ 30%
+ 40%
+ 50%
1-2009 1-2010 1-2011 1-2012 1-2013 1-2014 1-2015
Detached Single-Familyb
a
- 40%
- 30%
- 20%
- 10%
0%
+ 10%
+ 20%
+ 30%
+ 40%
+ 50%
+ 60%
1-2009 1-2010 1-2011 1-2012 1-2013 1-2014 1-2015
Attached Single-Familyb
a
A Research Tool Provided by the Chicago Association of REALTORS®
† Each dot represents the change in median sales price from the prior year using a 6-month weighted average. This means that each of the 6 months usedin a dot are proportioned according to their share of sales during that period. | Current as of April 14, 2015. All data from Midwest Real Estate Data.

4-2014 4-2015 + / – 4-2014 4-2015 + / –
New Listings 41 48 + 17.1% 106 141 + 33.0%
Closed Sales 24 16 - 33.3% 61 59 - 3.3%
Median Sales Price* $255,500 $306,250 + 19.9% $235,000 $285,000 + 21.3%
Percent of Original List Price Received* 95.6% 96.8% + 1.2% 97.1% 93.0% - 4.2%
Market Time 121 112 - 7.7% 80 111 + 39.8%
Inventory of Homes for Sale 48 59 + 22.9% -- -- --
4-2014 4-2015 + / – 4-2014 4-2015 + / –
New Listings 9 15 + 66.7% 22 43 + 95.5%
Closed Sales 3 8 + 166.7% 16 19 + 18.8%
Median Sales Price* $165,000 $138,900 - 15.8% $99,000 $135,000 + 36.4%
Percent of Original List Price Received* 91.7% 96.6% + 5.3% 94.7% 90.2% - 4.7%
Market Time 151 23 - 84.6% 101 55 - 45.6%
Inventory of Homes for Sale 16 15 - 6.3% -- -- --* Does not account for sale concessions and/or down payment assistance. Note: Activity for one month can sometimes look extreme due to small sample size.
Local Market Update – April 2015
Jefferson Park+ 26.0% - 11.1% + 15.6%
Change inNew ListingsAll Properties
Change inClosed SalesAll Properties
Change in Inventory of Homes
All Properties
Detached Single-FamilyApril Year to Date
Attached Single-FamilyApril Year to Date
Change in Median Sales Price from Prior Year (6-Month Average)†
All All
Jefferson Park Jefferson Park
- 30%
- 20%
- 10%
0%
+ 10%
+ 20%
+ 30%
1-2009 1-2010 1-2011 1-2012 1-2013 1-2014 1-2015
Detached Single-Familyb
a
- 40%
- 20%
0%
+ 20%
+ 40%
+ 60%
+ 80%
1-2009 1-2010 1-2011 1-2012 1-2013 1-2014 1-2015
Attached Single-Familyb
a
A Research Tool Provided by the Chicago Association of REALTORS®
† Each dot represents the change in median sales price from the prior year using a 6-month weighted average. This means that each of the 6 months usedin a dot are proportioned according to their share of sales during that period. | Current as of April 14, 2015. All data from Midwest Real Estate Data.

4-2014 4-2015 + / – 4-2014 4-2015 + / –
New Listings 4 5 + 25.0% 17 24 + 41.2%
Closed Sales 0 0 -- 4 6 + 50.0%
Median Sales Price* $0 $0 -- $184,450 $420,550 + 128.0%
Percent of Original List Price Received* 0.0% 0.0% -- 98.2% 88.6% - 9.8%
Market Time 0 0 -- 91 112 + 22.2%
Inventory of Homes for Sale 22 26 + 18.2% -- -- --
4-2014 4-2015 + / – 4-2014 4-2015 + / –
New Listings 29 33 + 13.8% 86 103 + 19.8%
Closed Sales 11 11 0.0% 37 40 + 8.1%
Median Sales Price* $130,000 $95,000 - 26.9% $135,000 $131,000 - 3.0%
Percent of Original List Price Received* 97.8% 90.6% - 7.3% 89.5% 85.1% - 4.9%
Market Time 123 237 + 92.7% 129 140 + 8.7%
Inventory of Homes for Sale 94 96 + 2.1% -- -- --* Does not account for sale concessions and/or down payment assistance. Note: Activity for one month can sometimes look extreme due to small sample size.
Local Market Update – April 2015
Kenwood+ 15.2% 0.0% + 5.2%
Change inNew ListingsAll Properties
Change inClosed SalesAll Properties
Change in Inventory of Homes
All Properties
Detached Single-FamilyApril Year to Date
Attached Single-FamilyApril Year to Date
Change in Median Sales Price from Prior Year (6-Month Average)†
All All
Kenwood Kenwood
- 100%
- 50%
0%
+ 50%
+ 100%
+ 150%
+ 200%
+ 250%
1-2009 1-2010 1-2011 1-2012 1-2013 1-2014 1-2015
Detached Single-Familyb
a
- 60%
- 40%
- 20%
0%
+ 20%
+ 40%
+ 60%
+ 80%
+ 100%
1-2009 1-2010 1-2011 1-2012 1-2013 1-2014 1-2015
Attached Single-Familyb
a
A Research Tool Provided by the Chicago Association of REALTORS®
† Each dot represents the change in median sales price from the prior year using a 6-month weighted average. This means that each of the 6 months usedin a dot are proportioned according to their share of sales during that period. | Current as of April 14, 2015. All data from Midwest Real Estate Data.

4-2014 4-2015 + / – 4-2014 4-2015 + / –
New Listings 33 34 + 3.0% 105 127 + 21.0%
Closed Sales 16 17 + 6.3% 38 46 + 21.1%
Median Sales Price* $1,436,790 $1,540,000 + 7.2% $1,266,750 $1,475,000 + 16.4%
Percent of Original List Price Received* 96.0% 94.8% - 1.2% 94.7% 94.3% - 0.4%
Market Time 104 166 + 59.8% 96 178 + 85.2%
Inventory of Homes for Sale 54 57 + 5.6% -- -- --
4-2014 4-2015 + / – 4-2014 4-2015 + / –
New Listings 398 390 - 2.0% 1,212 1,350 + 11.4%
Closed Sales 163 217 + 33.1% 460 543 + 18.0%
Median Sales Price* $387,000 $365,000 - 5.7% $362,000 $342,500 - 5.4%
Percent of Original List Price Received* 95.9% 97.1% + 1.2% 95.7% 95.9% + 0.2%
Market Time 81 94 + 15.9% 85 98 + 15.8%
Inventory of Homes for Sale 577 554 - 4.0% -- -- --* Does not account for sale concessions and/or down payment assistance. Note: Activity for one month can sometimes look extreme due to small sample size.
Local Market Update – April 2015
Lake View- 1.6% + 30.7% - 3.2%
Change inNew ListingsAll Properties
Change inClosed SalesAll Properties
Change in Inventory of Homes
All Properties
Detached Single-FamilyApril Year to Date
Attached Single-FamilyApril Year to Date
Change in Median Sales Price from Prior Year (6-Month Average)†
All All
Lake View Lake View
- 50%
- 40%
- 30%
- 20%
- 10%
0%
+ 10%
+ 20%
+ 30%
+ 40%
1-2009 1-2010 1-2011 1-2012 1-2013 1-2014 1-2015
Detached Single-Familyb
a
- 25%
- 20%
- 15%
- 10%
- 5%
0%
+ 5%
+ 10%
+ 15%
+ 20%
+ 25%
1-2009 1-2010 1-2011 1-2012 1-2013 1-2014 1-2015
Attached Single-Familyb
a
A Research Tool Provided by the Chicago Association of REALTORS®
† Each dot represents the change in median sales price from the prior year using a 6-month weighted average. This means that each of the 6 months usedin a dot are proportioned according to their share of sales during that period. | Current as of April 14, 2015. All data from Midwest Real Estate Data.

4-2014 4-2015 + / – 4-2014 4-2015 + / –
New Listings 49 62 + 26.5% 155 190 + 22.6%
Closed Sales 7 16 + 128.6% 42 50 + 19.0%
Median Sales Price* $1,700,000 $1,450,000 - 14.7% $1,580,000 $1,725,000 + 9.2%
Percent of Original List Price Received* 96.7% 93.7% - 3.1% 93.6% 94.4% + 0.8%
Market Time 43 118 + 173.2% 115 117 + 1.3%
Inventory of Homes for Sale 101 113 + 11.9% -- -- --
4-2014 4-2015 + / – 4-2014 4-2015 + / –
New Listings 251 257 + 2.4% 788 832 + 5.6%
Closed Sales 114 124 + 8.8% 309 347 + 12.3%
Median Sales Price* $444,250 $460,000 + 3.5% $451,000 $450,000 - 0.2%
Percent of Original List Price Received* 97.3% 97.3% + 0.0% 96.5% 96.1% - 0.4%
Market Time 69 69 - 0.1% 70 87 + 23.0%
Inventory of Homes for Sale 316 322 + 1.9% -- -- --* Does not account for sale concessions and/or down payment assistance. Note: Activity for one month can sometimes look extreme due to small sample size.
Local Market Update – April 2015
Lincoln Park+ 6.3% + 15.7% + 4.3%
Change inNew ListingsAll Properties
Change inClosed SalesAll Properties
Change in Inventory of Homes
All Properties
Detached Single-FamilyApril Year to Date
Attached Single-FamilyApril Year to Date
Change in Median Sales Price from Prior Year (6-Month Average)†
All All
Lincoln Park Lincoln Park
- 30%
- 20%
- 10%
0%
+ 10%
+ 20%
+ 30%
+ 40%
1-2009 1-2010 1-2011 1-2012 1-2013 1-2014 1-2015
Detached Single-Familyb
a
- 25%
- 20%
- 15%
- 10%
- 5%
0%
+ 5%
+ 10%
+ 15%
+ 20%
+ 25%
1-2009 1-2010 1-2011 1-2012 1-2013 1-2014 1-2015
Attached Single-Familyb
a
A Research Tool Provided by the Chicago Association of REALTORS®
† Each dot represents the change in median sales price from the prior year using a 6-month weighted average. This means that each of the 6 months usedin a dot are proportioned according to their share of sales during that period. | Current as of April 14, 2015. All data from Midwest Real Estate Data.

4-2014 4-2015 + / – 4-2014 4-2015 + / –
New Listings 21 25 + 19.0% 56 94 + 67.9%
Closed Sales 10 11 + 10.0% 25 35 + 40.0%
Median Sales Price* $707,000 $647,000 - 8.5% $685,000 $715,000 + 4.4%
Percent of Original List Price Received* 95.5% 99.3% + 4.0% 96.0% 97.4% + 1.4%
Market Time 48 66 + 38.7% 90 83 - 7.5%
Inventory of Homes for Sale 28 37 + 32.1% -- -- --
4-2014 4-2015 + / – 4-2014 4-2015 + / –
New Listings 77 63 - 18.2% 234 216 - 7.7%
Closed Sales 23 41 + 78.3% 61 95 + 55.7%
Median Sales Price* $267,500 $292,250 + 9.3% $225,000 $290,000 + 28.9%
Percent of Original List Price Received* 96.7% 94.8% - 2.0% 94.6% 93.7% - 1.0%
Market Time 55 51 - 7.9% 75 84 + 12.7%
Inventory of Homes for Sale 119 103 - 13.4% -- -- --* Does not account for sale concessions and/or down payment assistance. Note: Activity for one month can sometimes look extreme due to small sample size.
Local Market Update – April 2015
Lincoln Square- 10.2% + 57.6% - 4.8%
Change inNew ListingsAll Properties
Change inClosed SalesAll Properties
Change in Inventory of Homes
All Properties
Detached Single-FamilyApril Year to Date
Attached Single-FamilyApril Year to Date
Change in Median Sales Price from Prior Year (6-Month Average)†
All All
Lincoln Square Lincoln Square
- 30%
- 20%
- 10%
0%
+ 10%
+ 20%
+ 30%
+ 40%
+ 50%
+ 60%
1-2009 1-2010 1-2011 1-2012 1-2013 1-2014 1-2015
Detached Single-Familyb
a
- 60%
- 40%
- 20%
0%
+ 20%
+ 40%
+ 60%
+ 80%
+ 100%
+ 120%
1-2009 1-2010 1-2011 1-2012 1-2013 1-2014 1-2015
Attached Single-Familyb
a
A Research Tool Provided by the Chicago Association of REALTORS®
† Each dot represents the change in median sales price from the prior year using a 6-month weighted average. This means that each of the 6 months usedin a dot are proportioned according to their share of sales during that period. | Current as of April 14, 2015. All data from Midwest Real Estate Data.

4-2014 4-2015 + / – 4-2014 4-2015 + / –
New Listings 48 52 + 8.3% 133 178 + 33.8%
Closed Sales 21 32 + 52.4% 54 69 + 27.8%
Median Sales Price* $450,000 $748,000 + 66.2% $500,300 $665,500 + 33.0%
Percent of Original List Price Received* 98.3% 98.8% + 0.5% 95.3% 97.4% + 2.2%
Market Time 43 63 + 48.3% 71 68 - 3.7%
Inventory of Homes for Sale 53 55 + 3.8% -- -- --
4-2014 4-2015 + / – 4-2014 4-2015 + / –
New Listings 107 111 + 3.7% 339 331 - 2.4%
Closed Sales 52 50 - 3.8% 122 165 + 35.2%
Median Sales Price* $310,000 $335,950 + 8.4% $310,000 $336,900 + 8.7%
Percent of Original List Price Received* 96.5% 96.8% + 0.3% 97.6% 96.4% - 1.2%
Market Time 94 54 - 42.1% 87 78 - 9.8%
Inventory of Homes for Sale 138 97 - 29.7% -- -- --* Does not account for sale concessions and/or down payment assistance. Note: Activity for one month can sometimes look extreme due to small sample size.
Local Market Update – April 2015
Logan Square+ 5.2% + 12.3% - 20.4%
Change inNew ListingsAll Properties
Change inClosed SalesAll Properties
Change in Inventory of Homes
All Properties
Detached Single-FamilyApril Year to Date
Attached Single-FamilyApril Year to Date
Change in Median Sales Price from Prior Year (6-Month Average)†
All All
Logan Square Logan Square
- 60%
- 40%
- 20%
0%
+ 20%
+ 40%
+ 60%
+ 80%
1-2009 1-2010 1-2011 1-2012 1-2013 1-2014 1-2015
Detached Single-Familyb
a
- 30%
- 20%
- 10%
0%
+ 10%
+ 20%
+ 30%
+ 40%
1-2009 1-2010 1-2011 1-2012 1-2013 1-2014 1-2015
Attached Single-Familyb
a
A Research Tool Provided by the Chicago Association of REALTORS®
† Each dot represents the change in median sales price from the prior year using a 6-month weighted average. This means that each of the 6 months usedin a dot are proportioned according to their share of sales during that period. | Current as of April 14, 2015. All data from Midwest Real Estate Data.

4-2014 4-2015 + / – 4-2014 4-2015 + / –
New Listings 5 11 + 120.0% 15 23 + 53.3%
Closed Sales 1 2 + 100.0% 9 13 + 44.4%
Median Sales Price* $75,000 $156,000 + 108.0% $118,000 $135,000 + 14.4%
Percent of Original List Price Received* 68.8% 100.1% + 45.5% 90.6% 92.6% + 2.3%
Market Time 130 154 + 18.5% 175 136 - 22.2%
Inventory of Homes for Sale 16 17 + 6.3% -- -- --
4-2014 4-2015 + / – 4-2014 4-2015 + / –
New Listings 1 2 + 100.0% 6 8 + 33.3%
Closed Sales 2 1 - 50.0% 6 3 - 50.0%
Median Sales Price* $311,500 $200,888 - 35.5% $199,000 $200,888 + 0.9%
Percent of Original List Price Received* 89.5% 118.2% + 32.0% 96.8% 103.8% + 7.2%
Market Time 99 21 - 78.7% 66 23 - 64.5%
Inventory of Homes for Sale 2 3 + 50.0% -- -- --* Does not account for sale concessions and/or down payment assistance. Note: Activity for one month can sometimes look extreme due to small sample size.
Local Market Update – April 2015
McKinley Park+ 116.7% 0.0% + 11.1%
Change inNew ListingsAll Properties
Change inClosed SalesAll Properties
Change in Inventory of Homes
All Properties
Detached Single-FamilyApril Year to Date
Attached Single-FamilyApril Year to Date
Change in Median Sales Price from Prior Year (6-Month Average)†
All All
McKinley Park McKinley Park
- 60%
- 40%
- 20%
0%
+ 20%
+ 40%
+ 60%
+ 80%
+ 100%
+ 120%
+ 140%
+ 160%
1-2009 1-2010 1-2011 1-2012 1-2013 1-2014 1-2015
Detached Single-Familyb
a
- 60%
- 40%
- 20%
0%
+ 20%
+ 40%
+ 60%
+ 80%
+ 100%
+ 120%
+ 140%
1-2009 1-2010 1-2011 1-2012 1-2013 1-2014 1-2015
Attached Single-Familyb
a
A Research Tool Provided by the Chicago Association of REALTORS®
† Each dot represents the change in median sales price from the prior year using a 6-month weighted average. This means that each of the 6 months usedin a dot are proportioned according to their share of sales during that period. | Current as of April 14, 2015. All data from Midwest Real Estate Data.

4-2014 4-2015 + / – 4-2014 4-2015 + / –
New Listings 13 26 + 100.0% 43 60 + 39.5%
Closed Sales 5 8 + 60.0% 29 28 - 3.4%
Median Sales Price* $219,000 $152,750 - 30.3% $175,500 $183,745 + 4.7%
Percent of Original List Price Received* 100.4% 92.0% - 8.4% 95.4% 91.7% - 3.9%
Market Time 135 123 - 8.7% 123 99 - 20.0%
Inventory of Homes for Sale 29 37 + 27.6% -- -- --
4-2014 4-2015 + / – 4-2014 4-2015 + / –
New Listings 3 5 + 66.7% 9 13 + 44.4%
Closed Sales 0 0 -- 2 3 + 50.0%
Median Sales Price* $0 $0 -- $119,238 $161,000 + 35.0%
Percent of Original List Price Received* 0.0% 0.0% -- 87.8% 90.7% + 3.4%
Market Time 0 0 -- 59 82 + 39.6%
Inventory of Homes for Sale 7 11 + 57.1% -- -- --* Does not account for sale concessions and/or down payment assistance. Note: Activity for one month can sometimes look extreme due to small sample size.
Local Market Update – April 2015
Montclare+ 93.8% + 60.0% + 33.3%
Change inNew ListingsAll Properties
Change inClosed SalesAll Properties
Change in Inventory of Homes
All Properties
Detached Single-FamilyApril Year to Date
Attached Single-FamilyApril Year to Date
Change in Median Sales Price from Prior Year (6-Month Average)†
All All
Montclare Montclare
- 40%
- 30%
- 20%
- 10%
0%
+ 10%
+ 20%
+ 30%
+ 40%
1-2009 1-2010 1-2011 1-2012 1-2013 1-2014 1-2015
Detached Single-Familyb
a
- 80%
- 60%
- 40%
- 20%
0%
+ 20%
+ 40%
+ 60%
+ 80%
+ 100%
+ 120%
1-2009 1-2010 1-2011 1-2012 1-2013 1-2014 1-2015
Attached Single-Familyb
a
A Research Tool Provided by the Chicago Association of REALTORS®
† Each dot represents the change in median sales price from the prior year using a 6-month weighted average. This means that each of the 6 months usedin a dot are proportioned according to their share of sales during that period. | Current as of April 14, 2015. All data from Midwest Real Estate Data.

4-2014 4-2015 + / – 4-2014 4-2015 + / –
New Listings 29 26 - 10.3% 83 85 + 2.4%
Closed Sales 13 11 - 15.4% 45 49 + 8.9%
Median Sales Price* $202,000 $200,000 - 1.0% $175,600 $165,000 - 6.0%
Percent of Original List Price Received* 93.7% 94.8% + 1.2% 94.2% 92.6% - 1.8%
Market Time 106 94 - 11.4% 85 102 + 19.9%
Inventory of Homes for Sale 57 48 - 15.8% -- -- --
4-2014 4-2015 + / – 4-2014 4-2015 + / –
New Listings 2 0 - 100.0% 8 6 - 25.0%
Closed Sales 1 1 0.0% 2 6 + 200.0%
Median Sales Price* $90,000 $92,000 + 2.2% $72,500 $83,000 + 14.5%
Percent of Original List Price Received* 94.7% 80.0% - 15.6% 80.1% 88.4% + 10.4%
Market Time 12 105 + 775.0% 139 79 - 43.0%
Inventory of Homes for Sale 8 4 - 50.0% -- -- --* Does not account for sale concessions and/or down payment assistance. Note: Activity for one month can sometimes look extreme due to small sample size.
Local Market Update – April 2015
Mount Greenwood- 16.1% - 14.3% - 20.0%
Change inNew ListingsAll Properties
Change inClosed SalesAll Properties
Change in Inventory of Homes
All Properties
Detached Single-FamilyApril Year to Date
Attached Single-FamilyApril Year to Date
Change in Median Sales Price from Prior Year (6-Month Average)†
All All
Mount Greenwood Mount Greenwood
- 30%
- 20%
- 10%
0%
+ 10%
+ 20%
+ 30%
+ 40%
1-2009 1-2010 1-2011 1-2012 1-2013 1-2014 1-2015
Detached Single-Familyb
a
- 60%
- 40%
- 20%
0%
+ 20%
+ 40%
+ 60%
1-2009 1-2010 1-2011 1-2012 1-2013 1-2014 1-2015
Attached Single-Familyb
a
A Research Tool Provided by the Chicago Association of REALTORS®
† Each dot represents the change in median sales price from the prior year using a 6-month weighted average. This means that each of the 6 months usedin a dot are proportioned according to their share of sales during that period. | Current as of April 14, 2015. All data from Midwest Real Estate Data.

4-2014 4-2015 + / – 4-2014 4-2015 + / –
New Listings 71 76 + 7.0% 193 243 + 25.9%
Closed Sales 29 34 + 17.2% 84 98 + 16.7%
Median Sales Price* $290,000 $331,700 + 14.4% $285,375 $296,000 + 3.7%
Percent of Original List Price Received* 99.8% 95.9% - 3.9% 96.0% 94.2% - 1.9%
Market Time 70 103 + 47.4% 116 101 - 12.5%
Inventory of Homes for Sale 97 119 + 22.7% -- -- --
4-2014 4-2015 + / – 4-2014 4-2015 + / –
New Listings 10 15 + 50.0% 41 47 + 14.6%
Closed Sales 10 7 - 30.0% 28 24 - 14.3%
Median Sales Price* $89,200 $110,000 + 23.3% $101,500 $110,000 + 8.4%
Percent of Original List Price Received* 92.6% 97.2% + 5.0% 95.9% 101.0% + 5.3%
Market Time 52 35 - 31.7% 80 64 - 20.4%
Inventory of Homes for Sale 20 23 + 15.0% -- -- --* Does not account for sale concessions and/or down payment assistance. Note: Activity for one month can sometimes look extreme due to small sample size.
Local Market Update – April 2015
Norwood Park+ 12.3% + 5.1% + 21.4%
Change inNew ListingsAll Properties
Change inClosed SalesAll Properties
Change in Inventory of Homes
All Properties
Detached Single-FamilyApril Year to Date
Attached Single-FamilyApril Year to Date
Change in Median Sales Price from Prior Year (6-Month Average)†
All All
Norwood Park Norwood Park
- 30%
- 20%
- 10%
0%
+ 10%
+ 20%
+ 30%
+ 40%
1-2009 1-2010 1-2011 1-2012 1-2013 1-2014 1-2015
Detached Single-Familyb
a
- 50%
- 40%
- 30%
- 20%
- 10%
0%
+ 10%
+ 20%
+ 30%
+ 40%
+ 50%
+ 60%
1-2009 1-2010 1-2011 1-2012 1-2013 1-2014 1-2015
Attached Single-Familyb
a
A Research Tool Provided by the Chicago Association of REALTORS®
† Each dot represents the change in median sales price from the prior year using a 6-month weighted average. This means that each of the 6 months usedin a dot are proportioned according to their share of sales during that period. | Current as of April 14, 2015. All data from Midwest Real Estate Data.

4-2014 4-2015 + / – 4-2014 4-2015 + / –
New Listings 71 68 - 4.2% 176 238 + 35.2%
Closed Sales 24 28 + 16.7% 94 108 + 14.9%
Median Sales Price* $250,500 $222,500 - 11.2% $241,000 $252,750 + 4.9%
Percent of Original List Price Received* 94.6% 93.5% - 1.1% 94.7% 93.1% - 1.7%
Market Time 86 100 + 15.5% 87 103 + 18.3%
Inventory of Homes for Sale 111 111 0.0% -- -- --
4-2014 4-2015 + / – 4-2014 4-2015 + / –
New Listings 16 12 - 25.0% 61 51 - 16.4%
Closed Sales 11 4 - 63.6% 37 7 - 81.1%
Median Sales Price* $90,000 $106,500 + 18.3% $86,000 $129,000 + 50.0%
Percent of Original List Price Received* 99.9% 86.6% - 13.2% 96.6% 91.3% - 5.5%
Market Time 84 80 - 4.9% 169 64 - 62.5%
Inventory of Homes for Sale 31 25 - 19.4% -- -- --* Does not account for sale concessions and/or down payment assistance. Note: Activity for one month can sometimes look extreme due to small sample size.
Local Market Update – April 2015
Portage Park- 8.0% - 8.6% - 4.2%
Change inNew ListingsAll Properties
Change inClosed SalesAll Properties
Change in Inventory of Homes
All Properties
Detached Single-FamilyApril Year to Date
Attached Single-FamilyApril Year to Date
Change in Median Sales Price from Prior Year (6-Month Average)†
All All
Portage Park Portage Park
- 30%
- 20%
- 10%
0%
+ 10%
+ 20%
+ 30%
1-2009 1-2010 1-2011 1-2012 1-2013 1-2014 1-2015
Detached Single-Familyb
a
- 80%
- 60%
- 40%
- 20%
0%
+ 20%
+ 40%
+ 60%
+ 80%
+ 100%
+ 120%
1-2009 1-2010 1-2011 1-2012 1-2013 1-2014 1-2015
Attached Single-Familyb
a
A Research Tool Provided by the Chicago Association of REALTORS®
† Each dot represents the change in median sales price from the prior year using a 6-month weighted average. This means that each of the 6 months usedin a dot are proportioned according to their share of sales during that period. | Current as of April 14, 2015. All data from Midwest Real Estate Data.

4-2014 4-2015 + / – 4-2014 4-2015 + / –
New Listings 4 7 + 75.0% 18 19 + 5.6%
Closed Sales 2 4 + 100.0% 10 15 + 50.0%
Median Sales Price* $30,000 $113,250 + 277.5% $41,460 $45,000 + 8.5%
Percent of Original List Price Received* 88.5% 86.6% - 2.2% 86.7% 85.1% - 1.9%
Market Time 90 56 - 38.0% 91 65 - 28.4%
Inventory of Homes for Sale 22 19 - 13.6% -- -- --
4-2014 4-2015 + / – 4-2014 4-2015 + / –
New Listings 3 4 + 33.3% 12 9 - 25.0%
Closed Sales 3 2 - 33.3% 12 5 - 58.3%
Median Sales Price* $12,500 $22,750 + 82.0% $29,250 $25,000 - 14.5%
Percent of Original List Price Received* 68.9% 63.9% - 7.3% 75.5% 69.0% - 8.6%
Market Time 114 123 + 7.1% 80 469 + 488.8%
Inventory of Homes for Sale 10 8 - 20.0% -- -- --* Does not account for sale concessions and/or down payment assistance. Note: Activity for one month can sometimes look extreme due to small sample size.
Local Market Update – April 2015
Pullman+ 57.1% + 20.0% - 15.6%
Change inNew ListingsAll Properties
Change inClosed SalesAll Properties
Change in Inventory of Homes
All Properties
Detached Single-FamilyApril Year to Date
Attached Single-FamilyApril Year to Date
Change in Median Sales Price from Prior Year (6-Month Average)†
All All
Pullman Pullman
- 60%
- 40%
- 20%
0%
+ 20%
+ 40%
+ 60%
+ 80%
+ 100%
+ 120%
1-2009 1-2010 1-2011 1-2012 1-2013 1-2014 1-2015
Detached Single-Familyb
a
- 150%
- 100%
- 50%
0%
+ 50%
+ 100%
+ 150%
+ 200%
+ 250%
+ 300%
+ 350%
1-2009 1-2010 1-2011 1-2012 1-2013 1-2014 1-2015
Attached Single-Familyb
a
A Research Tool Provided by the Chicago Association of REALTORS®
† Each dot represents the change in median sales price from the prior year using a 6-month weighted average. This means that each of the 6 months usedin a dot are proportioned according to their share of sales during that period. | Current as of April 14, 2015. All data from Midwest Real Estate Data.

4-2014 4-2015 + / – 4-2014 4-2015 + / –
New Listings 7 9 + 28.6% 22 24 + 9.1%
Closed Sales 3 4 + 33.3% 14 9 - 35.7%
Median Sales Price* $475,000 $492,500 + 3.7% $386,500 $445,000 + 15.1%
Percent of Original List Price Received* 97.8% 102.4% + 4.7% 90.0% 94.4% + 4.9%
Market Time 30 42 + 40.0% 80 85 + 6.2%
Inventory of Homes for Sale 11 15 + 36.4% -- -- --
4-2014 4-2015 + / – 4-2014 4-2015 + / –
New Listings 65 81 + 24.6% 236 268 + 13.6%
Closed Sales 45 31 - 31.1% 140 102 - 27.1%
Median Sales Price* $144,900 $118,000 - 18.6% $97,543 $119,325 + 22.3%
Percent of Original List Price Received* 98.6% 93.3% - 5.4% 96.1% 92.8% - 3.5%
Market Time 76 127 + 66.6% 94 119 + 27.1%
Inventory of Homes for Sale 153 160 + 4.6% -- -- --* Does not account for sale concessions and/or down payment assistance. Note: Activity for one month can sometimes look extreme due to small sample size.
Local Market Update – April 2015
Rogers Park+ 25.0% - 27.1% + 6.7%
Change inNew ListingsAll Properties
Change inClosed SalesAll Properties
Change in Inventory of Homes
All Properties
Detached Single-FamilyApril Year to Date
Attached Single-FamilyApril Year to Date
Change in Median Sales Price from Prior Year (6-Month Average)†
All All
Rogers Park Rogers Park
- 60%
- 40%
- 20%
0%
+ 20%
+ 40%
+ 60%
+ 80%
+ 100%
+ 120%
+ 140%
1-2009 1-2010 1-2011 1-2012 1-2013 1-2014 1-2015
Detached Single-Familyb
a
- 80%
- 60%
- 40%
- 20%
0%
+ 20%
+ 40%
+ 60%
+ 80%
1-2009 1-2010 1-2011 1-2012 1-2013 1-2014 1-2015
Attached Single-Familyb
a
A Research Tool Provided by the Chicago Association of REALTORS®
† Each dot represents the change in median sales price from the prior year using a 6-month weighted average. This means that each of the 6 months usedin a dot are proportioned according to their share of sales during that period. | Current as of April 14, 2015. All data from Midwest Real Estate Data.

4-2014 4-2015 + / – 4-2014 4-2015 + / –
New Listings 11 8 - 27.3% 31 29 - 6.5%
Closed Sales 1 3 + 200.0% 8 8 0.0%
Median Sales Price* $315,000 $709,000 + 125.1% $577,500 $810,750 + 40.4%
Percent of Original List Price Received* 105.4% 94.0% - 10.7% 97.9% 89.6% - 8.5%
Market Time 10 77 + 670.0% 149 155 + 3.9%
Inventory of Homes for Sale 15 13 - 13.3% -- -- --
4-2014 4-2015 + / – 4-2014 4-2015 + / –
New Listings 168 160 - 4.8% 549 548 - 0.2%
Closed Sales 68 78 + 14.7% 200 225 + 12.5%
Median Sales Price* $254,000 $241,000 - 5.1% $240,500 $240,000 - 0.2%
Percent of Original List Price Received* 96.8% 94.5% - 2.4% 95.5% 93.4% - 2.2%
Market Time 74 87 + 17.6% 99 111 + 12.2%
Inventory of Homes for Sale 314 291 - 7.3% -- -- --* Does not account for sale concessions and/or down payment assistance. Note: Activity for one month can sometimes look extreme due to small sample size.
Local Market Update – April 2015
Uptown- 6.1% + 17.4% - 7.6%
Change inNew ListingsAll Properties
Change inClosed SalesAll Properties
Change in Inventory of Homes
All Properties
Detached Single-FamilyApril Year to Date
Attached Single-FamilyApril Year to Date
Change in Median Sales Price from Prior Year (6-Month Average)†
All All
Uptown Uptown
- 60%
- 40%
- 20%
0%
+ 20%
+ 40%
+ 60%
+ 80%
+ 100%
1-2009 1-2010 1-2011 1-2012 1-2013 1-2014 1-2015
Detached Single-Familyb
a
- 50%
- 40%
- 30%
- 20%
- 10%
0%
+ 10%
+ 20%
+ 30%
+ 40%
1-2009 1-2010 1-2011 1-2012 1-2013 1-2014 1-2015
Attached Single-Familyb
a
A Research Tool Provided by the Chicago Association of REALTORS®
† Each dot represents the change in median sales price from the prior year using a 6-month weighted average. This means that each of the 6 months usedin a dot are proportioned according to their share of sales during that period. | Current as of April 14, 2015. All data from Midwest Real Estate Data.

4-2014 4-2015 + / – 4-2014 4-2015 + / –
New Listings 31 31 0.0% 73 83 + 13.7%
Closed Sales 10 6 - 40.0% 38 35 - 7.9%
Median Sales Price* $314,500 $263,250 - 16.3% $328,750 $300,000 - 8.7%
Percent of Original List Price Received* 91.9% 105.6% + 15.0% 91.4% 96.2% + 5.2%
Market Time 129 66 - 49.2% 132 84 - 36.6%
Inventory of Homes for Sale 56 48 - 14.3% -- -- --
4-2014 4-2015 + / – 4-2014 4-2015 + / –
New Listings 57 54 - 5.3% 191 232 + 21.5%
Closed Sales 35 34 - 2.9% 144 109 - 24.3%
Median Sales Price* $85,000 $95,000 + 11.8% $84,550 $96,000 + 13.5%
Percent of Original List Price Received* 95.5% 90.9% - 4.8% 94.0% 93.0% - 1.1%
Market Time 168 65 - 61.2% 115 82 - 28.7%
Inventory of Homes for Sale 127 133 + 4.7% -- -- --* Does not account for sale concessions and/or down payment assistance. Note: Activity for one month can sometimes look extreme due to small sample size.
Local Market Update – April 2015
West Ridge- 3.4% - 11.1% - 1.1%
Change inNew ListingsAll Properties
Change inClosed SalesAll Properties
Change in Inventory of Homes
All Properties
Detached Single-FamilyApril Year to Date
Attached Single-FamilyApril Year to Date
Change in Median Sales Price from Prior Year (6-Month Average)†
All All
West Ridge West Ridge
- 30%
- 25%
- 20%
- 15%
- 10%
- 5%
0%
+ 5%
+ 10%
+ 15%
+ 20%
+ 25%
1-2009 1-2010 1-2011 1-2012 1-2013 1-2014 1-2015
Detached Single-Familyb
a
- 50%
- 40%
- 30%
- 20%
- 10%
0%
+ 10%
+ 20%
+ 30%
+ 40%
+ 50%
1-2009 1-2010 1-2011 1-2012 1-2013 1-2014 1-2015
Attached Single-Familyb
a
A Research Tool Provided by the Chicago Association of REALTORS®
† Each dot represents the change in median sales price from the prior year using a 6-month weighted average. This means that each of the 6 months usedin a dot are proportioned according to their share of sales during that period. | Current as of April 14, 2015. All data from Midwest Real Estate Data.

4-2014 4-2015 + / – 4-2014 4-2015 + / –
New Listings 52 62 + 19.2% 126 155 + 23.0%
Closed Sales 16 18 + 12.5% 46 54 + 17.4%
Median Sales Price* $739,500 $654,950 - 11.4% $782,500 $770,000 - 1.6%
Percent of Original List Price Received* 98.6% 96.2% - 2.4% 96.3% 94.5% - 1.8%
Market Time 140 72 - 48.2% 108 91 - 15.6%
Inventory of Homes for Sale 57 65 + 14.0% -- -- --
4-2014 4-2015 + / – 4-2014 4-2015 + / –
New Listings 249 261 + 4.8% 826 869 + 5.2%
Closed Sales 135 159 + 17.8% 338 412 + 21.9%
Median Sales Price* $370,000 $410,000 + 10.8% $365,000 $400,000 + 9.6%
Percent of Original List Price Received* 97.8% 97.9% + 0.1% 96.9% 96.8% - 0.1%
Market Time 50 69 + 37.3% 65 80 + 23.7%
Inventory of Homes for Sale 334 260 - 22.2% -- -- --* Does not account for sale concessions and/or down payment assistance. Note: Activity for one month can sometimes look extreme due to small sample size.
Local Market Update – April 2015
West Town+ 7.3% + 17.2% - 16.9%
Change inNew ListingsAll Properties
Change inClosed SalesAll Properties
Change in Inventory of Homes
All Properties
Detached Single-FamilyApril Year to Date
Attached Single-FamilyApril Year to Date
Change in Median Sales Price from Prior Year (6-Month Average)†
All All
West Town West Town
- 30%
- 20%
- 10%
0%
+ 10%
+ 20%
+ 30%
+ 40%
1-2009 1-2010 1-2011 1-2012 1-2013 1-2014 1-2015
Detached Single-Familyb
a
- 25%
- 20%
- 15%
- 10%
- 5%
0%
+ 5%
+ 10%
+ 15%
+ 20%
+ 25%
1-2009 1-2010 1-2011 1-2012 1-2013 1-2014 1-2015
Attached Single-Familyb
a
A Research Tool Provided by the Chicago Association of REALTORS®
† Each dot represents the change in median sales price from the prior year using a 6-month weighted average. This means that each of the 6 months usedin a dot are proportioned according to their share of sales during that period. | Current as of April 14, 2015. All data from Midwest Real Estate Data.