Your Global Investment Authority - Infinite Financial · 2019. 4. 20. · both unexpected setbacks...
15
perspective PUTTING MARKETS IN Your Global Investment Authority 4Q.2013
Transcript of Your Global Investment Authority - Infinite Financial · 2019. 4. 20. · both unexpected setbacks...

pers
pect
ive
PU
TT
ING
MA
RK
ET
S I
N
Your Global Investment Authority
4Q.2013

01
PIMCO’s economic forums help provide a framework for how we position our clients’ portfolios. Our annual Secular Forum looks over a three-to-five-year horizon. Three times a year we also hold Cyclical Forums to test and refine our macroeconomic thinking against current facts on the ground, reconciling likely events in the next six to 12 months with our longer-term forecast.
These cyclical “check-ins” are key to our process, as seen below. If our secular outlook tells us which direction the freeway is headed, then our cyclical outlook reads more immediate conditions so we know which lane to drive in, how fast to go and what the drivers around us are doing.
PIMCO’s Cyclical Forums: Reading the road
Portfolio Managers
Develop and implement strategies, combining top-down and bottom-up analysis to actively manage portfolios
TOP DOWN
BOTTOM UP
Investment Committee
Distills insights from across PIMCO into specific investment themes
Forums
Long-term secular inputs and analysis to set guardrails, and short-term cyclical inputs to help set near-term strategy
PortfoliosManaged
within mandated parameters and consistent with the firm’s views
Our process
Putt
ing
Mar
kets
in P
ersp
ectiv
e |
4Q
.201
3
Inve
stm
ent
pro
cess

Putt
ing
Mar
kets
in P
ersp
ectiv
e |
4Q
.201
3
Tab
le o
f co
nte
nts
02
Introduction Cyclical insights ........................................................................ 03
Economy Global ..................................................................................... 04 U.S. ......................................................................................... 05 European ................................................................................. 06 Emerging markets .................................................................... 07
Financial markets Equities.................................................................................... 08 Mortgages .............................................................................. 09 Credit ..................................................................................... 10 Municipals ...............................................................................11
Conclusion Outlook summary .....................................................................12 A word about risk .....................................................................13

Putt
ing
Mar
kets
in P
ersp
ectiv
e |
4Q
.201
3
Intr
od
uct
ion
03
While it is often true that slow and steady win the race, there are times when a strong boost is needed just to stay on course. Such appears to be the case with the global economy, which, despite the best efforts of central banks, has been unable to achieve the “escape velocity” needed to secure a path to sustained growth.
This is not to say that no improvements have been made. Indeed, PIMCO’s outlook for the year ahead is cautiously optimistic. The world’s economic giants are all expected to expand, including Europe and China, which had been contracting. However, persistent headwinds make it difficult to predict when or how the necessary handoff to self-sustaining growth will be realized. Hanging in the balance is the outlook for corporate profits, job creation and global economic well-being. The complex interplay of forces means investors must be alert to both unexpected setbacks and opportunities. Nimble, on-the-ground intelligence is essential.
Putting Markets in Perspective is designed to provide some direction. It presents, in a concise format, PIMCO’s latest thinking on key themes fresh from our Cyclical Forums, practical applications for investors and specific solutions to consider.
For more detailed information on our cyclical outlook, as well as additional Putting Markets in Perspective resources, visit global.pimco.com/puttingmarketsinperspective.
“ PIMCO’s outlook for the year ahead is cautiously optimistic, but investors must be alert to both unexpected setbacks and opportunities.”
– Saumil Parikh Managing Director Cyclical Forum Leader
-2
0
2
4
6
8
10%
Chan
ge in
real
GDP
Emerging economiesDeveloped economies
World ChinaU.K. Japan Brazil/Russia/India/Mexico
U.S. Eurozone
Four quarters ending Q2 2013
PIMCO forecast for four quarters ending Q3 2014
Consensus forecast
Putt
ing
Mar
kets
in P
ersp
ectiv
e |
4Q
.201
3
Eco
nom
y: G
lob
al
04
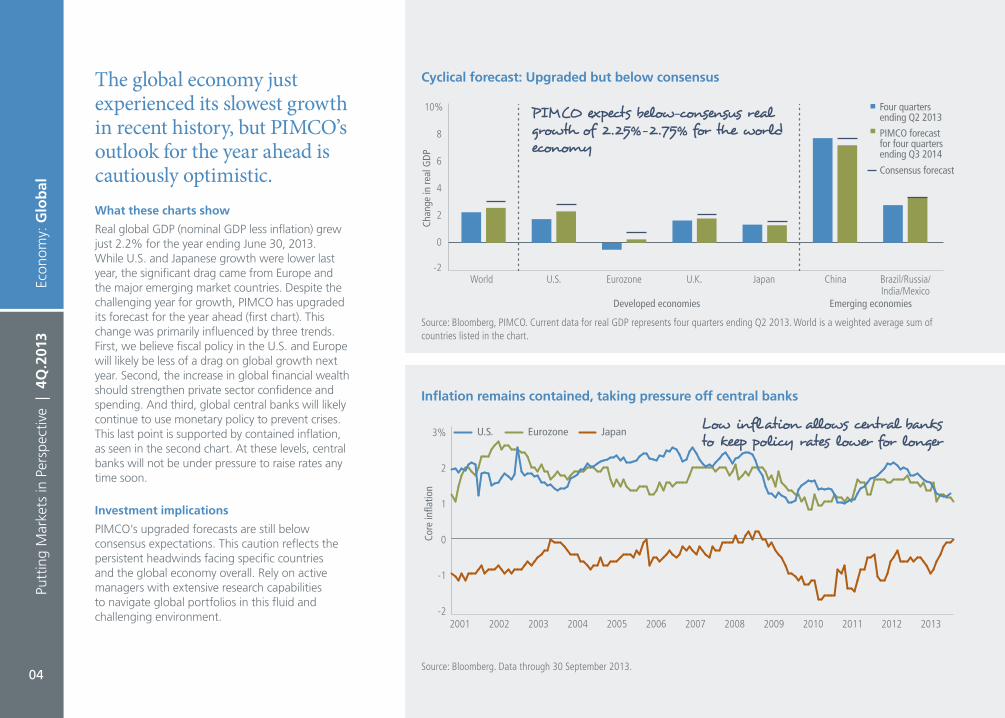
The global economy just experienced its slowest growth in recent history, but PIMCO’s outlook for the year ahead is cautiously optimistic.What these charts show
Real global GDP (nominal GDP less inflation) grew just 2.2% for the year ending June 30, 2013. While U.S. and Japanese growth were lower last year, the significant drag came from Europe and the major emerging market countries. Despite the challenging year for growth, PIMCO has upgraded its forecast for the year ahead (first chart). This change was primarily influenced by three trends. First, we believe fiscal policy in the U.S. and Europe will likely be less of a drag on global growth next year. Second, the increase in global financial wealth should strengthen private sector confidence and spending. And third, global central banks will likely continue to use monetary policy to prevent crises. This last point is supported by contained inflation, as seen in the second chart. At these levels, central banks will not be under pressure to raise rates any time soon.
Investment implications
PIMCO’s upgraded forecasts are still below consensus expectations. This caution reflects the persistent headwinds facing specific countries and the global economy overall. Rely on active managers with extensive research capabilities to navigate global portfolios in this fluid and challenging environment.
Cyclical forecast: Upgraded but below consensus
Source: Bloomberg, PIMCO. Current data for real GDP represents four quarters ending Q2 2013. World is a weighted average sum of countries listed in the chart.
Source: Bloomberg. Data through 30 September 2013.
Inflation remains contained, taking pressure off central banks
-2
0
-1
1
2
3%
2001 2002 2003 2004 2005 2006 2007 2008 2009 2010 2011 2012 2013
Core
infla
tion
U.S. Eurozone Japan
PIMCO expects below-consensus real growth of 2.25%–2.75% for the world economy
Low inflation allows central banks to keep policy rates lower for longer

Putt
ing
Mar
kets
in P
ersp
ectiv
e |
4Q
.201
3
Eco
nom
y: U
.S.
05
PIMCO expects U.S. growth to pick up, but to disappoint elevated consensus expectations due to rising market interest rates and weak aggregate spending.What these charts show
PIMCO is forecasting U.S. real growth of 2.0%–2.5% over the next 12 months, knowing that where the economy goes from here will depend in large part on the handoff from Fed-assisted growth to self-sustaining private sector growth. The near-zero fed funds rate has suppressed market interest rates, motivating consumers to borrow for large expenditures such as homes (blue line) and automobiles (green line). The first chart shows the effect Fed policy has had in supporting these two rate-sensitive sectors of the U.S. economy. Of course, recent interest rate increases will likely dampen this trend going forward. In addition, the second chart shows that broader spending remains weak. Corporate spending on capital goods (blue line) and personal consumption (green line) have been growing at decreasing rates. Private sector spending is necessary to fuel economic growth after policy support is withdrawn.
Investment implications
Without the handoff, monetary policy will likely keep the fed funds rate in the zero range for an extended period of time, providing patient bond investors with continued positive returns over cash. In addition, Fed-assisted growth should continue to support credit and equity markets, with opportunities across different sectors of the market.
Source: Bureau of Economic Analysis, Ward’s Automotive Group. Data through 30 June 2013.
Auto sales (RHS)
8
10
14
16
18
12
20
2003 2005 2007 2009 201320112004 2006 2008 2010 2012
Year
-ove
r-yea
r nom
inal
cha
nge
in
resi
dent
ial i
nves
tmen
t
Annualized auto sales (in millions of units, SA)
-40
-30
-20
-10
0
10
20
30% Residential investment (LHS)
Low rates supported gains in housing and autos
Increases in lending rates in 2Q 2013 will likely dampen this trend going forward
Fed policy has boosted select areas of the U.S. economy ...
... but broader corporate and personal spending has not picked up
Personal consumption (RHS)
-10
0
-5
5
10%
1993 1998 201320082003
Year
-ove
r-yea
r nom
inal
chan
ge in
capi
tal e
xpen
ditu
res Year-over-year nom
inal change in consumption
-20
-10
20%
10
0
Capital expenditures (LHS)
Source: Bureau of Economic Analysis. Data through 30 June 2013.
Deceleration in capital expenditures suggests corporations do not have faith in economic recovery
Putt
ing
Mar
kets
in P
ersp
ectiv
e |
4Q
.201
3
Eco
nom
y: E
uro
pea
n
06
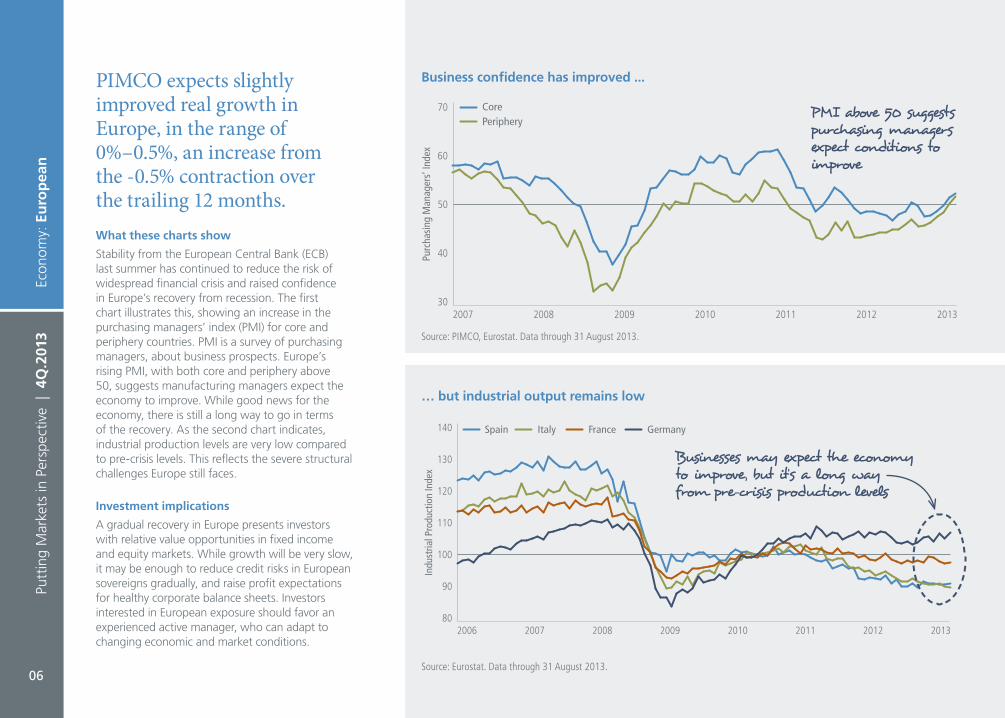
PIMCO expects slightly improved real growth in Europe, in the range of 0%–0.5%, an increase from the -0.5% contraction over the trailing 12 months.What these charts show
Stability from the European Central Bank (ECB) last summer has continued to reduce the risk of widespread financial crisis and raised confidence in Europe’s recovery from recession. The first chart illustrates this, showing an increase in the purchasing managers’ index (PMI) for core and periphery countries. PMI is a survey of purchasing managers, about business prospects. Europe’s rising PMI, with both core and periphery above 50, suggests manufacturing managers expect the economy to improve. While good news for the economy, there is still a long way to go in terms of the recovery. As the second chart indicates, industrial production levels are very low compared to pre-crisis levels. This reflects the severe structural challenges Europe still faces.
Investment implications
A gradual recovery in Europe presents investors with relative value opportunities in fixed income and equity markets. While growth will be very slow, it may be enough to reduce credit risks in European sovereigns gradually, and raise profit expectations for healthy corporate balance sheets. Investors interested in European exposure should favor an experienced active manager, who can adapt to changing economic and market conditions.
30
50
40
60
70
2007 2008 2009 2010 2011 2012 2013
Purc
hasi
ng M
anag
ers’
Inde
x
CorePeriphery
Source: PIMCO, Eurostat. Data through 31 August 2013.
Business confidence has improved ...
80
100
90
110
120
140
130
2006 2007 2008 2009 2010 2011 2012 2013
Indu
stria
l Pro
duct
ion
Inde
xSpain Italy France Germany
Source: Eurostat. Data through 31 August 2013.
… but industrial output remains low
PMI above 50 suggests purchasing managers expect conditions to improve
Businesses may expect the economy to improve, but it’s a long way from pre-crisis production levels

Putt
ing
Mar
kets
in P
ersp
ectiv
e |
4Q
.201
3
Eco
nom
y: E
mer
gin
g m
arke
ts
07
China continues to be the key emerging market economy to follow, with upcoming policy decisions weighing heavily on the outlook for sustained growth.What these charts show
China and the major emerging market countries saw strong but slowing growth over the trailing 12 months. PIMCO expects high-quality emerging markets to stabilize soon, but lower-quality markets will take time and may require assistance from international balance sheets. Tipping the scales may be China. As the first chart shows, China faces a long-term challenge as it seeks to move from an economy driven by investment, production and exports (green and blue bars) to one powered by consumer spending (brown bars). Still, the more immediate outlook looks positive given the recent improvement in sentiment evident in the second chart. Not only has business confidence (as measured by the manufacturing purchasing managers’ index, PMI, which is the green line) increased, but the stock market has also rallied (blue line) from recent lows.
Investment implications
Investment performance in emerging markets will be more differentiated going forward. While EM growth is expected to continue to outpace the world overall, volatility will remain high and returns subject to political and regulatory changes. Fixed income and equity markets remain attractive, but investors should look to active managers with on-the-ground expertise to avoid surprises in specific countries and sectors.
Source: Bloomberg, China Federation of Logistics. Data through 30 September 2013.
-6
0
-2
-4
4
6
8
10
12
14
2
16%
Cont
ribut
ion
to C
hine
se G
DP g
row
th
2009 2010 2011 2012 2013
Net export
InvestmentConsumption
Manufacturing PMI (RHS)
48
50
49
52
51
53
54
1Q12 2Q12 3Q12 4Q12 1Q13 2Q13 3Q13
Inde
x (m
onth
ly c
lose
) Manufacturing PM
I
1,900
2,000
2,400
2,300
2,500
2,200
2,100
Shanghai Stock Exchange Composite Index (LHS)
Source: NBS. Data through 31 August 2013.
China’s transition to a consumption-driven economy is a long-term challenge …
… but the cyclical outlook for China is positive
Chinese growth continues to be highly reliant on investment
Aggressive central bank policies have spurred economic activity
Putt
ing
Mar
kets
in P
ersp
ectiv
e |
4Q
.201
3
Fin
anci
al m
arke
ts: E
qu
itie
s
08
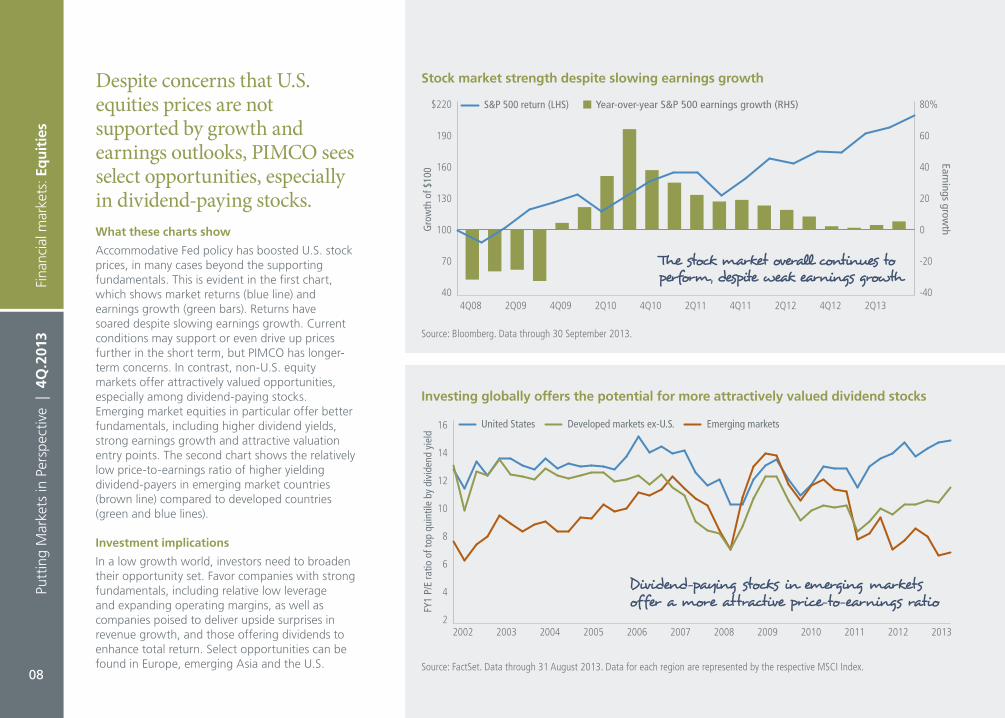
Despite concerns that U.S. equities prices are not supported by growth and earnings outlooks, PIMCO sees select opportunities, especially in dividend-paying stocks.What these charts show
Accommodative Fed policy has boosted U.S. stock prices, in many cases beyond the supporting fundamentals. This is evident in the first chart, which shows market returns (blue line) and earnings growth (green bars). Returns have soared despite slowing earnings growth. Current conditions may support or even drive up prices further in the short term, but PIMCO has longer-term concerns. In contrast, non-U.S. equity markets offer attractively valued opportunities, especially among dividend-paying stocks. Emerging market equities in particular offer better fundamentals, including higher dividend yields, strong earnings growth and attractive valuation entry points. The second chart shows the relatively low price-to-earnings ratio of higher yielding dividend-payers in emerging market countries (brown line) compared to developed countries (green and blue lines).
Investment implications
In a low growth world, investors need to broaden their opportunity set. Favor companies with strong fundamentals, including relative low leverage and expanding operating margins, as well as companies poised to deliver upside surprises in revenue growth, and those offering dividends to enhance total return. Select opportunities can be found in Europe, emerging Asia and the U.S.
Year-over-year S&P 500 earnings growth (RHS)
-40
0
40
-20
20
80%
60
4Q08 2Q09 4Q09 2Q10 4Q10 2Q11 4Q11 2Q12 4Q12 2Q13
Gro
wth
of $
100
Earnings growth
40
100
70
130
160
$220
190
S&P 500 return (LHS)
Stock market strength despite slowing earnings growth
Source: Bloomberg. Data through 30 September 2013.
Investing globally offers the potential for more attractively valued dividend stocks
2
4
6
8
10
12
14
16
2004 20052003 2006 20072002 2008 20102009 20122011 2013
FY1
P/E
ratio
of t
op q
uint
ile b
y di
vide
nd y
ield
Developed markets ex-U.S. Emerging marketsUnited States
Source: FactSet. Data through 31 August 2013. Data for each region are represented by the respective MSCI Index.
The stock market overall continues to perform, despite weak earnings growth
Dividend-paying stocks in emerging markets offer a more attractive price-to-earnings ratio

Putt
ing
Mar
kets
in P
ersp
ectiv
e |
4Q
.201
3
Fin
anci
al m
arke
ts: M
ort
gag
es
09
While we remain optimistic on housing overall, PIMCO has reduced its growth forecast in light of higher mortgage rates and continued tightness in lending standards.What these charts show
The first chart shows the impact increasing rates have had on the U.S. housing recovery. The blue line is the Affordability Index, which measures whether or not a median-income family could qualify for a mortgage loan on a median-priced home. This index shows a sharp decline in recent months. The green line is home sales, which fluctuate, but have been trending downward. Given the impact of rising rates, plus continued tightness in lending standards, PIMCO reduced its outlook, forecasting national home price gains of 5%–10% for the next 18–24 months (down from 8%–12%). Despite this revision, PIMCO remains favorable on opportunities in non-agency mortgage-backed securities (MBS). As the second chart shows, non-agency MBS will likely continue to offer attractive loss-adjusted yields across various housing scenarios.
Investment implications
Investors interested in capitalizing on the housing recovery will want to consider exposure to non-agency MBS. Given the shifting rate environment and the complexity of analyzing the housing market recovery, consider a manager who has demonstrated expertise in this area.
Non-agency MBS are attractive across different recovery scenarios
0
2
6
4
8
10%
-10% 0%-5% 5% 10% 15%
Loss
-adj
uste
d yi
eld
Home price appreciation scenarios
Source: PIMCO. Data through 10 September 2013. Hypothetical example for illustrative purposes only. Non-agency MBS loss-adjusted yields are based on pricing from PIMCO’s survey on the market. Loss-adjusted yields represent the yield earned after expected losses on a specific mortgage bond, across a variety of scenarios. PIMCO’s loss-adjusted yield calculation currently factors in the default risk level. The two-year home price appreciation axis illustrates the different home price depreciation and appreciation levels (e.g., -10% represents 10 depreciation).
Single-family home sales year-over-year (RHS)
-60
-20
20
-40
0
40%
2007 20092008 201320112010 2012
Hom
ebuy
er A
fford
abili
ty In
dex
Year-over-year change in single-family hom
e sales100
150
125
175
200
225 Homebuyer Affordability Index (3-month lead) (LHS)
Rising rates threaten U.S. housing recovery
Source: Census Bureau, National Association of Realtors. Data through 31 August 2013.
PIMCO’s base case: National home prices increase by 5%–10% over the next two years Upside potential
if home prices exceed market expectations
Downside resilience in weaker housing scenarios
A rise in interest rates during 2Q resulted in declining affordability and a drop in home sales

Putt
ing
Mar
kets
in P
ersp
ectiv
e |
4Q
.201
3
Fin
anci
al m
arke
ts: C
red
it
10
PIMCO considers much of the U.S. credit market overvalued, but believes there are still attractive risk/reward oppor-tunities for active managers.What these charts show
Persistently low Treasury yields drove income investors into the credit market, driving prices up and yields down. While the summer sell-off washed out some of this excess, investors have been returning to high yield since September. Finding attractive opportunities in this overvalued market requires a focus on active credit selection. Growth, for example, is a powerful factor in enhancing profits and reducing debt, both of which increase a company’s enterprise value (a measure of total worth). The first chart provides an overview of growing industries (such as appliances, which is benefitting from the housing recovery), showing how these industries have reduced debt relative to enterprise value. As net debt-to-enterprise value falls, a company’s credit fundamentals improve. The second chart shows the strong correlation between debt-to-enterprise value ratio (blue line) and tighter credit spreads (green line).
Investment implications
Investors seeking credit exposure will want to focus on high-quality companies in industries growing faster than the overall economy. Identifying these opportunities requires extensive independent analysis, and is therefore best handled by active managers with extensive credit research capabilities.
Deleveraging varies across industries
Applia
nces
Finan
ce
Gaming
Pape
r
Automoti
ve
Oil/gas
Teleco
ms
Utilitie
s
Metals/m
ining
1-yr
. cha
nge
in n
et d
ebt/e
nter
pris
e va
lue
-15
0
-5
-10
5
10
15%
Source: Bloomberg, S&P Global Industry Classification Standard (GICS) for various sub-industry groups. Data through 7 August 2013.
PIMCO has targeted housing-related industries and energy for attractive yields and improving fundamentals
Credit spread is closely correlated to enterprise value, making the case for targeting growing companies with strong fundamentals
Net debt/enterprise value (RHS)
30
40
35
45
50%
Jan ‘11 Jul ‘11 Jan ‘12 Jul ‘12 Jan ‘13 Jul ‘13
High
yie
ld c
redi
t def
ault
swap
spr
ead
Net debt/enterprise value
200
600
500
700 bps
400
300
High yield credit default swap spread (LHS)
Credit spreads are linked to enterprise values
Source: Capital IQ, Markit. Data through 30 August 2013.

Putt
ing
Mar
kets
in P
ersp
ectiv
e |
4Q
.201
3
Fin
anci
al m
arke
ts: M
un
icip
als
11
PIMCO believes that recent volatility in the municipal market has created attractive opportunities to enhance return through active management.What these charts show
The first chart shows the relatively attractive yield of municipal bonds in recent years. The yield on 30-year AAA municipal bonds (blue line) has been competitive with the yield of maturity-equivalent Treasuries (brown line). Of course, the true value of municipal bonds is on an after-tax basis. The pre-tax equivalent yield of municipal bonds (green line) over this period was consistently superior. Negative headline news in the municipal space has impacted the market, however, as seen in the second chart. Fears of Fed tapering, Detroit’s bankruptcy filing and fiscal challenges in Puerto Rico led to unusually strong outflows starting in June. While volatility is never easy for investors, it can provide opportunities to add value. Redemption-related selling out of municipal mutual funds depressed the overall market, allowing active managers, such as PIMCO, to buy high-quality municipals at attractive prices.
Investment implications
Investors have traditionally treated the municipal bond market as a buy-and-hold asset class. But, recent movement within the market demonstrates the need for comprehensive credit research as well as the value an active manager can add. Investors interested in increasing exposure to the tax-advantaged yields municipals may offer should select an experienced active manager.
Source: Thomson Reuters Municipal Market Data for municipal yields, Federal Reserve for Treasury yields. Data through 30 September 2013.
Tax-exempt municipals are attractive relative to Treasuries
Higher volatility has provided buying opportunity
Source: Lipper for flows, Thomson Reuters Municipal Market Data for yields. Data through 25 September 2013.
01/08
03/09
03/08
06/09
06/08
09/09
12/09
12/10
12/11
12/12
09/08
12/08
03/10
06/10
09/10
03/11
06/11
09/11
03/12
06/12
09/12
03/13
06/13
09/13
-5,000
-4,000
-3,000
-2,000
-1,000
0
1,000
2,000
$3,000
0
1
2
3
4
5
6
7%Weekly municipal fund flows (LHS) 30-year AAA municipal yield (RHS)M
unic
ipal
fund
flow
s (in
mill
ions
)
Yield
0
1
3
2
4
5
6
7
8
9%
12/08
03/09
06/09
09/09
12/09
03/10
06/10
09/10
12/10
03/11
06/11
09/11
12/11
03/12
06/12
09/12
12/12
03/13
06/13
09/13
Pre-tax equivalent municipal 30-year Treasury 30-year AAA municipal
Yiel
d
Negative credit headlines and the interest rate sell-off motivated outflows
On a pre-tax equivalent basis, municipal bonds offer an increasingly attractive yield compared to like-maturity Treasury bonds
Putt
ing
Mar
kets
in P
ersp
ectiv
e |
4Q
.201
3
Ou
tlo
ok
sum
mar
y
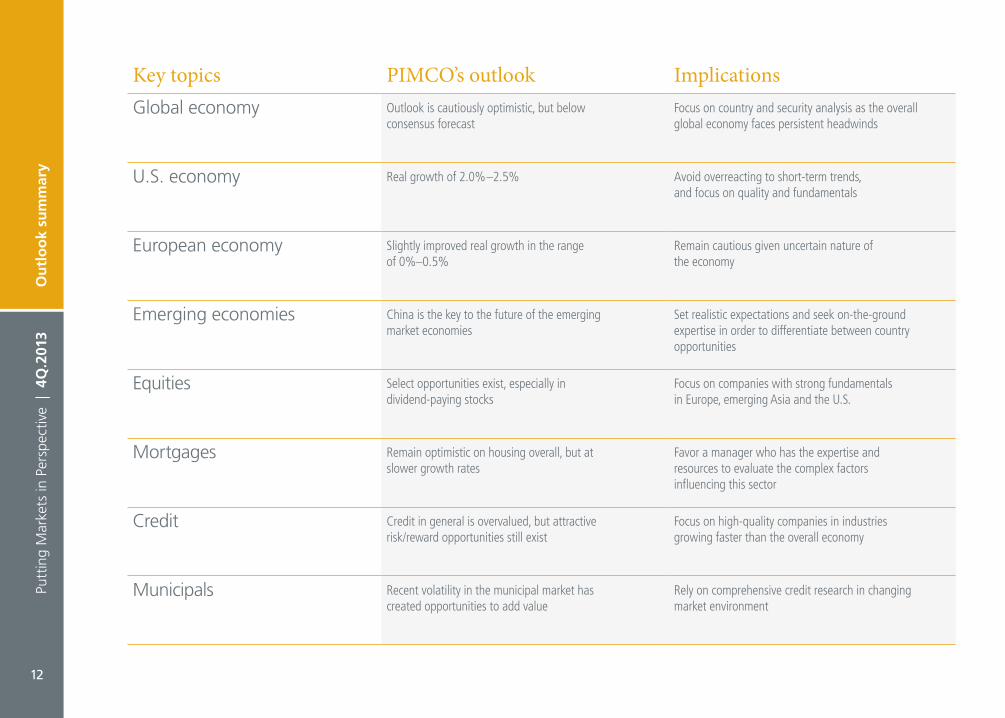
Key topics PIMCO’s outlook ImplicationsGlobal economy Outlook is cautiously optimistic, but below
consensus forecastFocus on country and security analysis as the overall global economy faces persistent headwinds
U.S. economy Real growth of 2.0%–2.5% Avoid overreacting to short-term trends, and focus on quality and fundamentals
European economy Slightly improved real growth in the range of 0%–0.5%
Remain cautious given uncertain nature of the economy
Emerging economies China is the key to the future of the emerging market economies
Set realistic expectations and seek on-the-ground expertise in order to differentiate between country opportunities
Equities Select opportunities exist, especially in dividend-paying stocks
Focus on companies with strong fundamentals in Europe, emerging Asia and the U.S.
Mortgages Remain optimistic on housing overall, but at slower growth rates
Favor a manager who has the expertise and resources to evaluate the complex factors influencing this sector
Credit Credit in general is overvalued, but attractive risk/reward opportunities still exist
Focus on high-quality companies in industries growing faster than the overall economy
Municipals Recent volatility in the municipal market has created opportunities to add value
Rely on comprehensive credit research in changing market environment
12

Putt
ing
Mar
kets
in P
ersp
ectiv
e |
4Q
.201
3
A w
ord
ab
ou
t ri
sk
13
A word about riskPast performance is not a guarantee or a reliable indicator of future results. All investments contain risk and may lose value. Investing in the bond market is subject to certain risks, including market, interest rate, issuer, credit and inflation risk; investments may be worth more or less than the original cost when redeemed. Equities may decline in value due to both real and perceived general market, economic and industry conditions. Dividends are not guaranteed and are subject to change and/or elimination. Investing in foreign-denominated and/or -domiciled securities may involve heightened risk due to currency fluctuations, and economic and political risks, which may be enhanced in emerging markets. Sovereign securities are generally backed by the issuing government. Obligations of U.S. government agencies and authorities are supported by varying degrees, but are generally not backed by the full faith of the U.S. government. Portfolios that invest in such securities are not guaranteed and will fluctuate in value. Income from municipal bonds may be subject to state and local taxes and at times the alternative minimum tax. Mortgage- and asset-backed securities may be sensitive to changes in interest rates, subject to early repayment risk, and while generally supported by a government, government-agency or private guarantor, there is no assurance that the guarantor will meet its obligations. High yield, lower-rated securities involve greater risk than higher-rated securities; portfolios that invest in them may be subject to greater levels of credit and liquidity risk than portfolios that do not. Derivatives may involve certain costs and risks, such as liquidity, interest rate, market, credit, management and the risk that a position could not be closed when most advantageous. Investing in derivatives could lose more than the amount invested. Diversification does not ensure against loss.
The value of most bond strategies and fixed income securities are impacted by changes in interest rates. Bonds and bond strategies with longer durations tend to be more sensitive and more volatile than securities with shorter durations; bond prices generally fall as interest rates rise.
There is no guarantee that these investment strategies will work under all market conditions or are suitable for all investors and each investor should evaluate their ability to invest long-term, especially during periods of downturn in the market. Investors should consult their investment professional prior to making an investment decision.

I-PMIP_11.13_34815
pimco.com
This material contains the current opinions of the manager and such opinions are subject to change without notice. This material has been distributed for informational purposes only. Forecasts, estimates and certain information contained herein are based upon proprietary research and should not be considered as investment advice or a recommendation of any particular security, strategy or investment product. Information contained herein has been obtained from sources believed to be reliable, but not guaranteed.
PIMCO provides services only to qualified institutions and investors. This is not an offer to any person in any jurisdiction where unlawful or unauthorized. | Pacific Investment Management Company LLC (840 Newport Center Drive, Newport Beach, CA 92660) is regulated by the United States Securities and Exchange Commission. PIMCO Investments LLC, U.S. distributor, 1633 Broadway, New York, NY 10019, is a company of PIMCO. | PIMCO Europe Ltd (Company No. 2604517), PIMCO Europe, Ltd Munich Branch (Company No. 157591), PIMCO Europe, Ltd Amsterdam Branch (Company No. 24319743), and PIMCO Europe Ltd - Italy (Company No. 07533910969) are authorized and regulated by the Financial Conduct Authority (25 The North Colonnade, Canary Wharf, London E14 5HS) in the UK. The Amsterdam, Italy and Munich Branches are additionally regulated by the AFM, CONSOB in accordance with Article 27 of the Italian Consolidated Financial Act, and BaFin in accordance with Section 53b of the German Banking Act, respectively. PIMCO Europe Ltd services and products are available only to professional clients as defined in the Financial Conduct Authority’s Handbook and are not available to individual investors, who should not rely on this communication. | PIMCO Deutschland GmbH (Company No. 192083, Seidlstr. 24-24a, 80335 Munich, Germany) is authorized and regulated by the German Federal Financial Supervisory Authority (BaFin) (Marie- Curie-Str. 24-28, 60439 Frankfurt am Main) in Germany in accordance with Section 32 of the German Banking Act (KWG). The services and products provided by PIMCO Deutschland GmbH are available only to professional clients as defined in Section 31a para. 2 German Securities Trading Act (WpHG). They are not available to individual investors, who should not rely on this communication. | PIMCO Asia Pte Ltd (501 Orchard Road #09-03, Wheelock Place, Singapore 238880, Registration No. 199804652K) is regulated by the Monetary Authority of Singapore as a holder of a capital markets services license and an exempt financial adviser. The asset management services and investment products are not available to persons where provision of such services and products is unauthorized. | PIMCO Asia Limited (24th Floor, Units 2402, 2403 & 2405 Nine Queen’s Road Central, Hong Kong) is licensed by the Securities and Futures Commission for Types 1, 4 and 9 regulated activities under the Securities and Futures Ordinance. The asset management services and investment products are not available to persons where provision of such services and products is unauthorized. | PIMCO Australia Pty Ltd (Level 19, 363 George Street, Sydney, NSW 2000, Australia), AFSL 246862 and ABN 54084280508, offers services to wholesale clients as defined in the Corporations Act 2001. | PIMCO Japan Ltd (Toranomon Towers Office 18F, 4-1-28, Toranomon, Minato-ku, Tokyo, Japan 105-0001) Financial Instruments Business Registration Number is Director of Kanto Local Finance Bureau (Financial Instruments Firm) No.382. PIMCO Japan Ltd is a member of Japan Investment Advisers Association and Investment Trusts Association. Investment management products and services offered by PIMCO Japan Ltd are offered only to persons within its respective jurisdiction, and are not available to persons where provision of such products or services is unauthorized. Valuations of assets will fluctuate based upon prices of securities and values of derivative transactions in the portfolio, market conditions, interest rates, and credit risk, among others. Investments in foreign currency denominated assets will be affected by foreign exchange rates. There is no guarantee that the principal amount of the investment will be preserved, or that a certain return will be realized; the investment could suffer a loss. All profits and losses incur to the investor. The amounts, maximum amounts and calculation methodologies of each type of fee and expense and their total amounts will vary depending on the investment strategy, the status of investment performance, period of management and outstanding balance of assets and thus such fees and expenses cannot be set forth herein. | PIMCO Canada Corp. (199 Bay Street, Suite 2050, Commerce Court Station, P.O. Box 363, Toronto, ON, M5L 1G2) services and products may only be available in certain provinces or territories of Canada and only through dealers authorized for that purpose. | PIMCO Latin America Edifício Internacional Rio Praia do Flamengo, 154 1o andar, Rio de Janeiro – RJ Brasil 22210-906. PIMCO and YOUR GLOBAL INVESTMENT AUTHORITY are trademarks or registered trademarks of Allianz Asset Management of America LP. and Pacific Investment Management Company LLC, respectively, in the United States and throughout the world. © 2013 PIMCO


![Welcome! [] · System Source & Nimble Storage: Nimble Storage Partner since 2011 80+ Nimble SAN installations Nimble Storage beneficial for: Server Virtualization VDI - Virtual Desktop](https://static.fdocuments.in/doc/165x107/5f6082a3934cdf44864fdea1/welcome-system-source-nimble-storage-nimble-storage-partner-since-2011.jpg)