YOUniversity Deal Challenge 2021
65
YOUniversity Deal Challenge 2021
Transcript of YOUniversity Deal Challenge 2021

YOUniversity Deal Challenge 2021

1
Executive Summary
Industry Overview
Company
Overview &
SWOT Analysis
Post-COVID
Analysis
Pre-COVID
Valuation
Post-COVID
Valuation
DevourAll is a mid-sized casual dining restaurants operator navigating a highly competitive foodservice industry. Growth in key
markets is expected to slow post-COVID-19 due to weak macroeconomic trends, as declining revenue and high operating costs
translate to mounting margin pressures. However, bright spots remain for the industry, such as the growing demand for delivery.
Although DevourAll remains a market leader, revenue has been declining due to a lack of competitiveness of brands. To turn
the tide, DevourAll has designed a three-pronged business strategy. It can leverage on internal competencies such as a
diversified business portfolio and experienced senior management team to ride on favorable trends, while remaining
cautious of its weaknesses and external threats amidst a competitive, challenging macroeconomic landscape.
The pre-COVID valuation of DevourAll was based on a weighted average between three different analysis methods
used – Discounted Cash Flow (DCF) analysis, Comparable Company analysis (CCA) and the Precedent Transaction
analysis (PTA).
For the DCF, we relied heavily on the projections provided by management as given in the case, to derive a valuation of
GBP 1,240.84mn. Through CCA of 12 peer companies, we arrived at valuations of GBP 1,495.98mn and GBP
1,345.57mn for EV/EBITDA and EV/Revenue respectively. Our PTA, which considers 11 companies that have previously
underwent M&A transactions involving food operators similar to DevourAll, gave us a valuation of GBP 1,451.89mn and
GBP1,439.42mn for EV/EBITDA and EV/Revenue respectively.
Overall, we arrived at a final pre-COVID valuation of GBP 1,323.13mn.
We project two different scenarios for DevourAll post-COVID. In Scenario 1, COVID-19 remains under control and the lifting
of travel restrictions will support the swift recovery of DevourAll’s operations, resulting in store openings of 50/12/15 for
2022P/2023P/2024P. In Scenario 2, we predict a possible second wave, resulting in slower recovery and an increasing demand
for delivery services. Store openings are delayed to 8/10/24 over the same period.
We arrive at a DCF valuation of GBP 451.64mn and GBP 428.06mn for Scenario 1 and 2 respectively. For our market-based
approach, we used comparable company analysis to arrive at a valuation of GBP 837.46mn and GBP 924.11mn for EV/EBITDA
and EV/Revenue respectively. We did not consider precedent transactions. In overall, we arrived at a final valuation of GBP
528.31mn post-COVID, reflecting a 60% decline in value compared to our pre-COVID estimate.

DevourAll’s Journey through COVID-192021 Duff & Phelps YOUniversity Deal Challenge
Lim Kang Li Ada | Lim Tze Pin Raynold | Oong Li Yin
Nanyang Technological University (Singapore)

3
DevourAll’s Journey Through COVID-19
1. Industry Overview
2. Company Overview &
SWOT Analysis
3. Pre-COVID Valuation
4. Post-COVID Analysis
5. Post-COVID Valuation

INDUSTRY
OVERVIEW
SWOT
ANALYSIS
PRE-COVID
VALUATION
POST-COVID
ANALYSIS
POST-COVID
VALUATIONAPPENDIX 4
IntroductionDevourAll is a mid-sized casual dining restaurants operator
United States of America
Henry’s Grill & Bar
United Kingdom
Billy’s Restaurant
France
Cecilia’s Bistro
Scotland
Smith’s Steakhouse
Other brands: Café Rose, Cheeky Chicken, Salad Monster, Munch Munch

5
DevourAll’s Journey Through COVID-19
1. Industry Overview
• The foodservice industry is highly competitive
• Growth in key markets is slowing due to weak macroeconomic trends
• However, bright spots remain for the industry

INDUSTRY
OVERVIEW
SWOT
ANALYSIS
PRE-COVID
VALUATION
POST-COVID
ANALYSIS
POST-COVID
VALUATIONAPPENDIX
0
100
200
300
400
500
600
2014A 2015A 2016A 2017A 2018A 2019A 2020P 2021P 2022P 2023P 2024P
Foodservice Market in US and Europe (GBP Bn)
Europe US
6
Industry OverviewDevourAll operates in the highly competitive foodservice industry
Source: Euromonitor
COVID-19
impact
US, Europe and UK foodservice market growth to slow post-COVID-19…
CAGR of Key Markets UK Europe US
2014-2019 1.8% 3.2% 8.6%
2019-2024P 0.8% 2.9% 3.3%

INDUSTRY
OVERVIEW
SWOT
ANALYSIS
PRE-COVID
VALUATION
POST-COVID
ANALYSIS
POST-COVID
VALUATIONAPPENDIX
Industry TrendsKey markets are negatively impacted by the COVID-19 pandemic
…due to weak macroeconomic trends
7
-30.0
-25.0
-20.0
-15.0
-10.0
-5.0
0.0
5.0
0.0
20.0
40.0
60.0
80.0
100.0
120.0
Q12014
Q22014
Q32014
Q42014
Q12015
Q22015
Q32015
Q42015
Q12016
Q22016
Q32016
Q42016
Q12017
Q22017
Q32017
Q42017
Q12018
Q22018
Q32018
Q42018
Q12019
Q22019
Q32019
Q42019
Q12020
Q22020
Q32020
Q42020
UK
Co
nsu
mer
Co
nfi
den
ce In
dex
US
Co
nsu
mer
Co
nfi
den
ce In
dex
Drop in Consumer Confidence
US UKSource: Euromonitor
COVID-19
impact
Brexit
uncertainties
Reduced expenditure on eating out weighs on revenue…
• UK consumer confidence fell from -0.3% in Q1 2016 to -9.6% in Q4 2019,
dipping to its lowest -23.8% in Q2 2020 due to the pandemic (Euromonitor,
2020)
• UK unemployment rate rises to 5-year highs
• Lockdown restrictions prevented individuals from dining out
• Consumer confidence had already been on a decline due to Brexit
uncertainties
• Inflation and sluggish wage growth place pressure on disposable incomes
… even as operating costs increase
Weakening British
Pound due to Brexit
uncertainties erodes
purchasing power
and increases costs
of imports
Property rentals
increased by 11%
following business
rates revaluation
Tighter immigration
rules post-Brexit
increase labor costs
Declining revenue and high operating costs translate to mounting margin
pressures.

INDUSTRY
OVERVIEW
SWOT
ANALYSIS
PRE-COVID
VALUATION
POST-COVID
ANALYSIS
POST-COVID
VALUATIONAPPENDIX 8
Industry TrendsHowever, bright spots remain for the industry
Increasing demand for home delivery offers growth potential for foodservice operators
16.2% 15.6%
26.8%
9.8%7.1%
5.0%3.4%
13.3% 12.5%
21.3%
0.0%
5.0%
10.0%
15.0%
20.0%
25.0%
30.0%
2018A 2019A 2020P 2021P 2022P 2023P 2024P
Revenue Growth in the UK Online Food Delivery Segment
Platform-to-Consumer Delivery Restaurant-to-Consumer DeliverySource: Statista
• Frost & Sullivan valued the global food delivery market at $82 billion in 2019, and expects this number to double by 2025, reaching a cumulative growth
rate of 14% (Singh, 2019)
• Customers are willing to pay for the quickest and most convenient way to get their food (Chick, 2020)
• Key criteria for convenience include delivery costs, wait time, pick-up locations, and option for contactless delivery
• COVID-19 has accelerated the demand for convenience
• Suspension of on-premises dining and safety concerns have led to a spike in delivery and take-out rates

INDUSTRY
OVERVIEW
SWOT
ANALYSIS
PRE-COVID
VALUATION
POST-COVID
ANALYSIS
POST-COVID
VALUATIONAPPENDIX 9
Industry TrendsHowever, bright spots remain for the industry
94%
81%73%
56% 56%
0%
25%
50%
75%
100%
Are more likely to be loyal to acompletely transparent brand
Are willing to try other products of atransparent brand
Will pay more for a completelytransparent brand
Will be loyal for life to a completelytransparent brand
Will trust a brand that providesmore than basic ingredient
information
Consumer Demand for Greater Transparency
Health-conscious consumers seek greater transparency
Source: 2016 Label Insight Transparency ROI Study
• Modern consumers are more mindful about what they eat and how it affects their health and wellness
• Market for organic, non-GMO, and plant-based foods is growing (Afable, 2019)
• Rise in specific dietary restrictions such as allergies and vegan or gluten-free meals)
• Growing interest in understanding ingredients
• Rising popularity of food activism
• Consumers vote with their dollars to support sustainable companies and clean labels with high ethical values

10
DevourAll’s Journey Through COVID-19
2. Company Overview & SWOT Analysis
• DevourAll is a market leader; however, its financial performance has been on a decline
• DevourAll’s three-pronged business strategy
• SWOT Analysis

INDUSTRY
OVERVIEW
SWOT
ANALYSIS
PRE-COVID
VALUATION
POST-COVID
ANALYSIS
POST-COVID
VALUATIONAPPENDIX 11
Company OverviewDevourAll is a market leader, with revenue growth outperforming the industry
547 578 572 563
857
17% 17%
14%14%
13%
0%
2%
4%
6%
8%
10%
12%
14%
16%
18%
-
100
200
300
400
500
600
700
800
900
2015A 2016A 2017A 2018A 2019A
Historical Total Revenue (GBP M) and EBITDA Margin (%)
Source: Case material
DevourAll’s Financial Performance
• Revenue fell from 2016 to 2018 due to lack of competitiveness of
brands. Spike in 2019 largely attributed to Billy’s Restaurant acquisition
• EBITDA margin fell continuously, reflecting higher food and labor costs
DevourAll faces stiff competition in the foodservices industry
Café/ Bar
Full-Service
Restaurants
Limited-
Service
Restaurants
Direct competitors
Indirect competitors
• Foodservice operators face increasing competition from grocery retailers
who partner with third-party operators to offer convenient meals, increasing
variety of offerings in the market
• E.g. Deliveroo x Sainsbury and Co-Op to deliver food and drink to customers;
Asda is working with Just Eat (Euromonitor, 2020)

INDUSTRY
OVERVIEW
SWOT
ANALYSIS
PRE-COVID
VALUATION
POST-COVID
ANALYSIS
POST-COVID
VALUATIONAPPENDIX 12
Company OverviewDevourAll has designed a three-pronged business strategy
Increase revenue per site
• Invest in menu renovation and
technology
• Elect a data-driven approach
in evaluating demographic
and competitive dynamics for
new sites
Diversify revenue streams
• Develop delivery segment
• Install more bespoke delivery
stations in high traffic outlets
• Collaboration with Deliveroo
and UberEats
Increase profit margin
• Embark on cost-cutting
operations
• Integrate supply chain

INDUSTRY
OVERVIEW
SWOT
ANALYSIS
PRE-COVID
VALUATION
POST-COVID
ANALYSIS
POST-COVID
VALUATIONAPPENDIX
SWOT AnalysisDevourAll can leverage on internal competencies and ride on favorable trends
S W
TO
Strengths
Opportunities
Weaknesses
Threats
• Strategic acquisition of Billy’s Restaurant to boost
profitability
• Revenue and cost synergies from diversified
business portfolio
• Experienced management team
• Lack of competitiveness of existing brands
• Low penetration of delivery service
• Underperforming sites from reduced sales and
cost pressures
• Food delivery wave
• Frictionless digital experiences
• Attractiveness of sustainable and ethical brands
• Demand for healthier options and transparent
labels
• Competitive landscape
• Challenging macroeconomic factors
• Food safety concerns from rising risk of food fraud
• Increasing prices of raw ingredients due to tariffs
and export restrictions
13

INDUSTRY
OVERVIEW
SWOT
ANALYSIS
PRE-COVID
VALUATION
POST-COVID
ANALYSIS
POST-COVID
VALUATIONAPPENDIX
• Acquired in 2018
• Largest full-service Spanish restaurant in the UK
• Consistently outperformed competitors in recent years
SWOT Analysis - StrengthsDevourAll’s strengths will allow it to survive the new normal
0%
5%
10%
15%
20%
25%
30%
35%
2015A 2016A 2017A 2018A 2019A
DevourAll’s Historical Profitability (%)
ROE ROA
DevourAll’s strategic acquisition will boost profitabilityDiversified business portfolio provides revenue and cost
synergies
• Expansion of product line to include Spanish cuisine
• Increase client base by leveraging on Billy’s Restaurant’s
existing recognized brand to reduce barriers to entry and
achieve market synergies
• Total revenue in 2019 increased by a significant 52.2%,
significantly higher compared to like-for-like revenue growth
of 3.2%
• Sharp increase in ROE and ROA highlights DevourAll’s
increased profitability after acquisition
• Expected future revenue growth and margin expansion
Experienced senior management team to guide future
performance
Strategic
Impact
Financial
Impact
• Geographic diversification through operations in UK, US and
Europe, reducing exposure to country-specific risk (e.g. political
and currency volatility)
• Tap on different customer markets through variety of brands
with different food offerings; reduce risk exposure to only one
customer group
• Achieve supply chain synergies by providing ingredients to
multiple brands, providing greater stability of input costs
Source: Case material
• More familiar with how the landscape of the foodservices
industry has changed over time and with the firm’s operations
• Capable of better supporting the business; more competent
• Better poised for workforce optimization to reduce excess “fats”
within the company, and to maximize manpower efficiency and
effectiveness
• More likely to have carried out business continuity planning,
which ensures resilience in the face of COVID-19 disruptions
14
INDUSTRY
OVERVIEW
SWOT
ANALYSIS
PRE-COVID
VALUATION
POST-COVID
ANALYSIS
POST-COVID
VALUATIONAPPENDIX
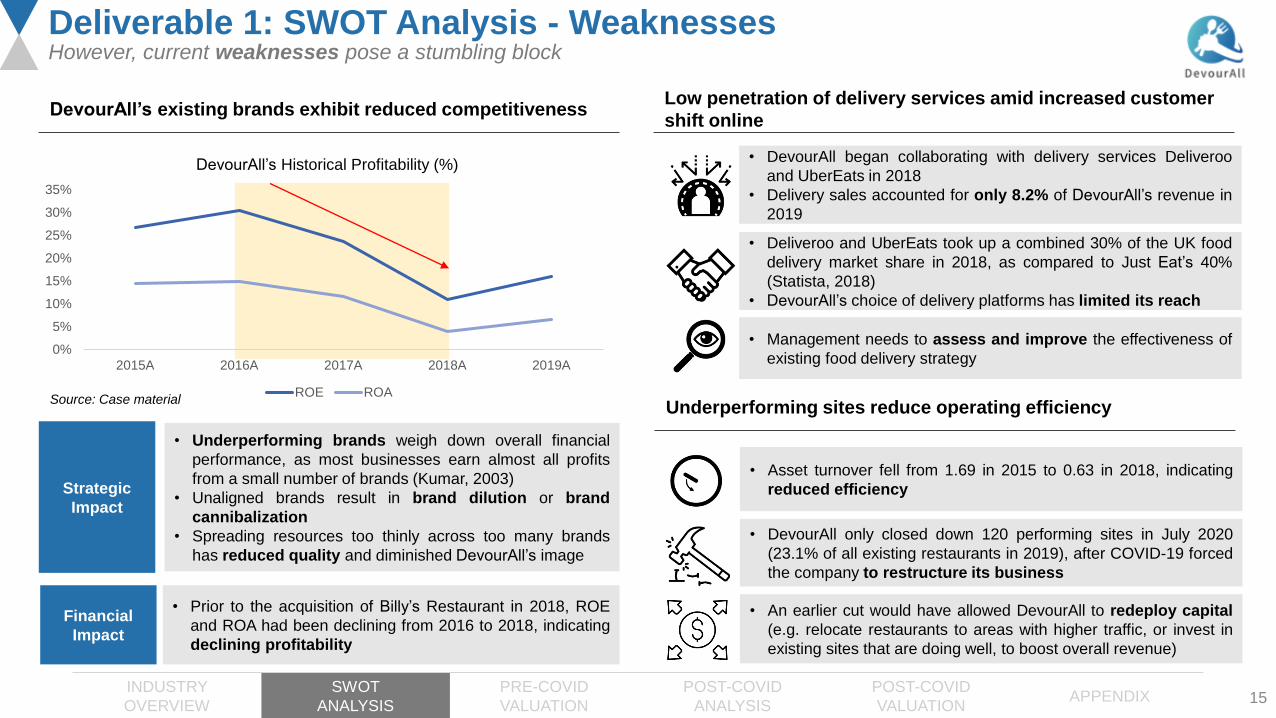
Deliverable 1: SWOT Analysis - WeaknessesHowever, current weaknesses pose a stumbling block
DevourAll’s existing brands exhibit reduced competitivenessLow penetration of delivery services amid increased customer
shift online
Underperforming sites reduce operating efficiency
0%
5%
10%
15%
20%
25%
30%
35%
2015A 2016A 2017A 2018A 2019A
DevourAll’s Historical Profitability (%)
ROE ROASource: Case material
• Underperforming brands weigh down overall financial
performance, as most businesses earn almost all profits
from a small number of brands (Kumar, 2003)
• Unaligned brands result in brand dilution or brand
cannibalization
• Spreading resources too thinly across too many brands
has reduced quality and diminished DevourAll’s image
• Prior to the acquisition of Billy’s Restaurant in 2018, ROE
and ROA had been declining from 2016 to 2018, indicating
declining profitability
Strategic
Impact
Financial
Impact
• DevourAll began collaborating with delivery services Deliveroo
and UberEats in 2018
• Delivery sales accounted for only 8.2% of DevourAll’s revenue in
2019
• Deliveroo and UberEats took up a combined 30% of the UK food
delivery market share in 2018, as compared to Just Eat’s 40%
(Statista, 2018)
• DevourAll’s choice of delivery platforms has limited its reach
• Management needs to assess and improve the effectiveness of
existing food delivery strategy
• Asset turnover fell from 1.69 in 2015 to 0.63 in 2018, indicating
reduced efficiency
• DevourAll only closed down 120 performing sites in July 2020
(23.1% of all existing restaurants in 2019), after COVID-19 forced
the company to restructure its business
• An earlier cut would have allowed DevourAll to redeploy capital
(e.g. relocate restaurants to areas with higher traffic, or invest in
existing sites that are doing well, to boost overall revenue)
15

INDUSTRY
OVERVIEW
SWOT
ANALYSIS
PRE-COVID
VALUATION
POST-COVID
ANALYSIS
POST-COVID
VALUATIONAPPENDIX
9.7% 11.0% 12.4%15.4% 16.7% 17.7% 18.4% 18.9%19.0%
21.1%23.1%
27.4%29.4% 31.0% 32.4% 33.5%
0.0%
10.0%
20.0%
30.0%
40.0%
2017A 2018A 2019A 2020P 2021P 2022P 2023P 2024P
User Penetration (%) in the UK Online Food Delivery Segment
Platform-to-Consumer Delivery Restaurant-to-Consumer Delivery
Deliverable 1: SWOT Analysis - OpportunitiesDevourAll can capitalize on opportunities to grow
9%
13%
2%
16%
26%
11% 10%
20%
16%13%
0%
5%
10%
15%
20%
25%
30%
Gen Z Millennials Gen X Boomers Silent
Percentage increase in customers who order delivery or takeout at least once a month before and after COVID-19
Delivery TakeoutSource: Deloitte Source: Statista
DevourAll can leverage on the food delivery wave DevourAll can offer frictionless digital experiences
• 62% of surveyed consumers are willing to pick up food
from a convenient location other than the restaurant
itself, and 44% will order delivery of uncooked meals they
finish prepping at home (Chick, 2020)
• Redesign store layouts to reduce space for dining-in;
increase capacity for outside, drive-through, and pickup
businesses
• Introduce delivery-only menus that omit foods which don’t
travel well and improve packaging to maintain freshness
• Step up in-house delivery functions to increase control
of the ordering experience and reduce payment to third-
party food delivery platforms
Industry
Trend
Possible
Responses
• Increased demand for convenient, user-friendly end-to-end
digital experiences in both web and mobile environments
• Customized and consistent digital engagement
increases consumer confidence and brand loyalty
• Leverage on business analytics to generate greater value
from customer data, and to drive more effective business
decisions to better meet customer needs
• Develop a new algorithm to precisely time cooking for
pickup
• Use artificial intelligence (AI) for micromarketing, so
customers receive personalized offers and promotions
Industry
Trend
Possible
Responses
16

INDUSTRY
OVERVIEW
SWOT
ANALYSIS
PRE-COVID
VALUATION
POST-COVID
ANALYSIS
POST-COVID
VALUATIONAPPENDIX
1,704
1,475 1,382
1,660 1,660 1,669 1,744
1,810
2,000
2,208
1,200
1,400
1,600
1,800
2,000
2,200
2,400
2009 2010 2011 2012 2013 2014 2015 2016 2017 2018
Sales Revenue (GBP Mn) of Organic Food & Drink in the UK
18101608
2377
677 574694
2000
1720
2955
724885 902
2208
1603
3243
7581000 962
0
500
1000
1500
2000
2500
3000
3500
Organic Fairtrade RainforestAlliance
Free rangeeggs
Plant-basedalternatives
SustainableFish
Average Spending (GBP Mn) on Ethical Food & Drink in the UK
2016 2017 2018
Deliverable 1: SWOT Analysis - OpportunitiesDevourAll can capitalize on opportunities to grow
Source: Statista Source: Statista
DevourAll can become more sustainable and ethical DevourAll can offer healthier options and transparent labels
• Increasing customer focus on sustainability and
provenance
• 75% of UK shoppers want supermarkets to only stock food
from sustainable and ethical sources (FMCG, 2019)
• Source for raw ingredients from ethical suppliers
• Introduce recyclable packaging for deliveries and
takeaways
• Address heightened safety concerns post COVID-19 by
setting a high standard of cleanliness across all sites;
adopt visible changes to signal to customers how seriously
DevourAll is taking safety and cleanliness
Possible
Responses
• The internet and social media provide large volumes of
information on nutritional needs and health benefits of
different ingredients to educate consumers (Attest, 2018)
• Dietary restrictions are becoming increasingly prevalent
• Provide the option of using organic ingredients, which are
often deemed to have increased health benefits and can be
sold at a premium
• Incorporate vegan and gluten-free options into its menus
• Adopt more transparent labels so that customers
understand what ingredients they are consuming
Industry
Trend
Possible
Responses
Industry
Trend
17

INDUSTRY
OVERVIEW
SWOT
ANALYSIS
PRE-COVID
VALUATION
POST-COVID
ANALYSIS
POST-COVID
VALUATIONAPPENDIX
Deliverable 1: SWOT Analysis - Threats
60,000
65,000
70,000
75,000
80,000
85,000
90,000
95,000
2008 2009 2010 2011 2012 2013 2014 2015 2016 2017 2018
Num
ber
of
Ente
rprises
Number of Restaurants and Mobile Foodservice Enterprises in UK from 2008 to 2018
Threats that pose a danger to DevourAll’s survivability
Large number of competitors in the industryIndustry players face decreased revenue and higher cost
pressures
-15.0%-12.0% -14.0%
-21.0%
-57.6% -56.8%-60.0%
-56.4%-70.0%
-60.0%
-50.0%
-40.0%
-30.0%
-20.0%
-10.0%
0.0%
All outlets Pubs Bars Restaurants
Percentage Change in Like-For-Like Sales in UK Before and After COVID-19 in March 2020
Before COVID-19 After COVID-19Source: Statista Source: Statista
• Steady rise in the number of foodservice outlets
(restaurants and enterprises) from 63,368 outlets in 2008 to
88,848 outlets in 2018 (Statista, 2020)
• Stiff competition from existing players
• Indirect competition from grocery retailers offering on-the-go
meals on the rise (Euromonitor, 2020)
• More competitive and saturated landscape due to rising
number of new entrants and expansion by existing operators
• Sharp decrease in sales and revenue across the
foodservices industry due to COVID-19 lockdowns and relative
standstill in the tourism industry
• Higher labor costs, business rates, and costs of raw ingredients
place pressure on profit margins
• Reduced spending on food from restaurants, pubs, and bars
due to falling consumer confidence
• Combined effects of reduced revenue and margin pressures
translate to large decline in profits or even operating losses
and bankruptcy
18

INDUSTRY
OVERVIEW
SWOT
ANALYSIS
PRE-COVID
VALUATION
POST-COVID
ANALYSIS
POST-COVID
VALUATIONAPPENDIX
Deliverable 1: SWOT Analysis - ThreatsThreats that pose a danger to DevourAll’s survivability
$5.06 $4.98
$5.35
$5.80
$4.40
$4.60
$4.80
$5.00
$5.20
$5.40
$5.60
$5.80
$6.00
13/3/20 16/3/20 19/3/20 22/3/20 25/3/20
Global Prices of Wheat per Bushel in March 2020
0.7%
2.3%
3.9%
3.9%
4.0%
4.1%
26.5%
54.6%
Australasia
Rest of Europe
South America
Asia
Africa
North America
EU
UK
UK Food Origins
Share of food consumedSource: Statista
Tariffs and export restrictions imposed by foreign countries increase prices of raw ingredients
Source: Macrotrends
• Governments around the world have put up export restrictions to ensure food security during the COVID-19 pandemic
• One example is Kazakhstan’s temporary export ban on wheat and wheat flour in March 2020 (FAO, 2020)
• Some of these restrictions have drastically reduced exports for specific raw ingredients
• Combined effects of COVID-19 and Brexit result in a surge in prices of raw materials and ingredients widely used in the food industry
• Higher costs of operation for restaurant operators around the globe
• Increased need to stockpile inventory to reduce the risk of business disruptions
• UK food and drinks imports face an average 18% tariff after Brexit without a trade deal (Durisin, 2020)
• Extra paperwork and administrative costs required at borders could trickle down the supply chain
• Longer transport times lead to higher risk of shortages of perishables
$5.63
19

INDUSTRY
OVERVIEW
SWOT
ANALYSIS
PRE-COVID
VALUATION
POST-COVID
ANALYSIS
POST-COVID
VALUATIONAPPENDIX
Deliverable 1: SWOT Analysis - ThreatsThreats that pose a danger to DevourAll’s survivability
Food safety concerns due to rising risk of food fraud
• High risk of COVID-19 transmissions has led to numerous meat production and processing facilities being shut down temporarily to reduce contact
between employees, leading to an unprecedented shortage of meat across the supply chain
• Risk of meat fraud (i.e. substitution of one type of meat for another) has become more prevalent (Southey, 2020)
• Restaurant operators have little control over whether suppliers engage in fraudulent practices without their knowledge
• Questionable ingredients and food preparation methods may lead to transmission of viruses and diseases to customers
• Higher risk of food fraud reduces credibility of foodservices industry, as more customers become increasingly concerned about food safety
• National lockdowns prevented quality checks on supply chains, providing more opportunities for fraud to take place undetected
• An operation by Interpol and Europol resulted in more than $40 million worth of fake food and drinks seized, including bacteria-infested cheese,
meat from illegally slaughtered animals, and expired foods and drinks with falsely altered expiry dates (Askew, 2020)
31% 31%
21% 21%
16%
0%
10%
20%
30%
40%
Food hygienewhen eating out
Food poisoning Falsified orinaccurate labels
Date labels Food hygiene athome
Percentage Concerned of Food Safety Issues
Source: Food Standards Agency (2020)
38%
33%
22%20%
0%
10%
20%
30%
40%
Have low trust insupply chains
Have low trust in theFSA
Often worry aboutwhether food is safe
to eat
Are unsure if foodand groceries boughtin UK are safe to eat
Consumer Attitudes Towards Food Safety in the UK
Source: Food Standards Agency (2019)
20

21
DevourAll’s Journey Through COVID-19
3. Pre-COVID Valuation
• Financial analysis and projections
• Discounted Cash Flow valuation
• Market Approach valuation
➢ Comparable Company analysis
➢ Precedent Transactions analysis

INDUSTRY
OVERVIEW
SWOT
ANALYSIS
PRE-COVID
VALUATION
POST-COVID
ANALYSIS
POST-COVID
VALUATIONAPPENDIX
Deliverable 1: Pre-COVID Discounted Cash Flow ValuationFinancial Analysis and Projections
Revenue to grow on the back of increased store openings and
expansion of delivery services
0
200
400
600
800
1000
1200
0
100
200
300
400
500
600
700
800
900
1000
2015A 2016A 2017A 2018A 2019A 2020P 2021P 2022P 2023P 2024P
Rev
enu
e (G
BP
Mn
)
Nu
mb
er o
f St
ore
s
Revenue and Number of Stores from 2015-2024P
United Kingdom United States Europe Revenue
CAGR
2.8%
• Revenue spike from UK in 2019A post-acquisition of Billy’s Restaurant
• Gross margin improved from 18.3% in 2019 to 19.2% in 2024P
• EBITDA margin improved from 13.2% to 14.2% over the same period
CAGR
5.4%
Capital structure expected to reflect comparable company
median in the future
18%28% 31%
55%50% 49% 45% 40% 41% 40%
82%72% 69%
45%50% 51% 55% 60% 59% 60%
0%
10%
20%
30%
40%
50%
60%
70%
80%
90%
100%
2015A 2016A 2017A 2018A 2019A 2020P 2021P 2022P 2023P 2024P
Capital Structure from 2015 to 2024P
Debt to Total Equity to Total
• Sudden change in 2018 to a debt-heavy capital structure reflects additional
debt taken on by DevourAll in the acquisition of Billy’s Restaurant
• Gradual increase in equity after 2018 drives a shift in capital structure
towards a target debt to equity ratio that is similar to the median amongst
comparable companies
• Long-term target capital structure is therefore assumed to be the median of
comparable companies and used in WACC calculations for our subsequent
DCF analysis
Source: Case material
Source: Case material
22

INDUSTRY
OVERVIEW
SWOT
ANALYSIS
PRE-COVID
VALUATION
POST-COVID
ANALYSIS
POST-COVID
VALUATIONAPPENDIX
Deliverable 1: Pre-COVID Discounted Cash Flow ValuationConsidering the WACC
Cost of Debt
Cost of Equity
Cost of
Debt
Cost of debt is 6.22%, the yield of B-rated corporate bonds
issued in the consumer staples industry as at 31 Dec 2019,
based on the average credit rating of comparable companies.
Risk-free
Rate
Risk-free rate of 0.74% is based on 10Y UK Government Debt
rate as at 31 Dec 2019.
Levered
Beta
The average unlevered beta of comparable companies is
calculated as 0.42, which is taken to be DevourAll’s unlevered
beta.
Risk
Premium
• Market risk premium is 5.75% (KPMG Equity Market Risk
Premium Research, 2019)
• Country risk premium (Damodaran, 2020) was taken as a
blended average given DevourAll’s percentage of revenue
derived from the UK, US and Europe
• Size premium of 3.39% for micro-cap stocks was added
(EY, 2020)
Terminal WACC computation
Target Capital Structure
Debt-to-Total 34.40%
Equity-to-Total 65.60%
Cost of Debt
Cost of Debt 6.22%
Tax Rate 19%
After-Tax Cost of Debt 5.04%
Cost of Equity
Risk-Free Rate 0.74%
Levered Beta 0.60
Market Risk Premium 5.75%
Country risk premium
UK 0.23%
US 0.00%
Europe 2.09%
As of 2019, DevourAll’s revenue is derived from -
UK 69.75%
US 22.74%
Europe 7.51%
Blended country risk premium 0.32%
Size premium 3.39%
Cost of Equity 7.80%
WACC 6.85%
Capital Structure
Target
Capital
Structure
Target capital structure is based on the median debt-to-equity
ratio of comparable companies of 0.52.
23

INDUSTRY
OVERVIEW
SWOT
ANALYSIS
PRE-COVID
VALUATION
POST-COVID
ANALYSIS
POST-COVID
VALUATIONAPPENDIX
Deliverable 1: Pre-COVID Discounted Cash Flow ValuationDiscounted Cash Flow Analysis
Pre-COVID DCF (GBP Mn)
FYE 31 Dec 2020P 2021P 2022P 2023P 2024P
Revenue 890.50 938.10 1,013.30 1,068.00 1,115.00
Less: COGS (728.30) (762.40) (821.00) (863.80) (900.40)
Gross Profit 162.20 175.70 192.30 204.20 214.60
Less: SG&A (45.90) (48.90) (52.90) (54.70) (55.90)
EBITDA 116.30 126.80 139.40 149.50 158.70
Less: Depreciation & Amortization (43.00) (44.50) (46.80) (54.70) (60.30)
EBIT 73.30 82.30 92.60 94.80 98.40
Less: Tax Expense* (13.93) (15.64) (17.59) (18.01) (18.70)
EBIAT 59.37 66.66 75.01 76.79 79.70
Add: Depreciation & Amortization 43.00 44.50 46.80 54.70 60.30
Less: Capex (60.90) (75.00) (100.20) (63.40) (62.10)
Less: Change in net working capital 15.50 (3.70) (3.30) (1.60) (2.40)
Unlevered free cash flow 56.97 32.46 18.31 66.49 75.50
Discount Factor 0.94 0.88 0.82 0.77 0.72
Present Value 53.32 28.44 15.01 51.01 54.22
Terminal Value 1,038.84
Enterprise Value (Terminal Growth) 1,240.84
* The UK Government announced at Budget 2020 that the Corporation Tax main rate will remain at 19% for the years starting 1 April 2020 and 2021. For the purposes of this case, this tax rate has been
projected through DevourAll’s financial years ending 31 December 2020 to 2024.
24

INDUSTRY
OVERVIEW
SWOT
ANALYSIS
PRE-COVID
VALUATION
POST-COVID
ANALYSIS
POST-COVID
VALUATIONAPPENDIX
Deliverable 1: Pre-COVID Discounted Cash Flow ValuationDiscounted Cash Flow Analysis
Terminal Growth Rate Sensitivity Analysis
Implied Valuation Range (GBP Mn)
• Terminal growth rate of 1.55% and Terminal WACC of 6.85% were varied
by ±0.1% to analyze how a change in these two independent variables will
affect DevourAll’s intrinsic valuation
• Sensitivity analysis raises the credibility of the valuation model, creates a
more accurate forecast, and drives data-backed decision-making
UK Inflation Rate 1.30%
US Inflation Rate 2.29%
Europe Inflation Rate 1.60%
Blended Terminal Growth Rate 1.55%
• The terminal growth rate is the constant rate at which a company is expected
to grow in perpetuity
• A blended average of inflation rates in the UK, US and Europe, with
weights based on the proportion of DevourAll’s operations in these
respective countries, was taken as an estimate for the terminal growth rate
Minimum 25th Percentile Median 75th Percentile Maximum
Based on EBITDA 1,117.72 1,196.82 1,240.84 1,288.30 1,395.33
25

INDUSTRY
OVERVIEW
SWOT
ANALYSIS
PRE-COVID
VALUATION
POST-COVID
ANALYSIS
POST-COVID
VALUATIONAPPENDIX
Deliverable 1: Pre-COVID Market Approach ValuationComparable Company Analysis
List of Comparable Companies (All values in GBP Mn except multiples and EBITDA margin)
Company Name Enterprise Value Revenue EBITDA EBIT EV/Revenue EV/EBITDA EV/EBIT EBITDA Margin (%)
Denny’s Corporation 1,192.60 401.30 69.40 54.70 2.97 17.18 21.80 17.29
Ruth’s Hospitality Group, Inc. 687.80 347.00 55.10 39.30 1.98 12.48 17.50 15.88
Red Robin Gourmet Burgers, Inc. 830.70 974.80 72.10 4.00 0.85 11.52 207.68 7.40
Papa John’s International, Inc. 2,069.20 1,200.40 80.40 45.30 1.72 25.74 45.68 6.70
BJ’s Restaurants, Inc. 983.40 861.00 89.10 35.80 1.14 11.04 27.47 10.35
Ibersol, S.G.P.S., S.A. 621.00 438.20 53.90 29.90 1.42 11.52 20.77 12.30
The Restaurant Group plc 1,1,24.20 1,073.10 132.60 88.10 1.05 8.48 12.76 12.36
Domino’s Pizza Group plc 1,715.50 508.30 105.70 99.40 3.37 16.23 17.26 20.79
El Pollo Loco Holdings, Inc. 618.20 327.90 44.10 30.90 1.89 14.02 20.01 13.45
Carrols Restaurant Group, Inc. 1,230.40 1,084.40 55.00 (0.40) 1.13 22.37 (3,076.00) 5.07
Fiesta Restaurant Group, Inc. 455.30 490.00 37.80 8.80 0.93 12.04 51.74 7.71
Shake Shack, Inc. 1,708.80 440.70 51.80 21.80 3.88 32.99 78.39 11.75
Minimum 0.85 8.48 (3,076.00) 5.07
25th Percentile 1.11 11.52 17.44 7.63
Median 1.57 13.25 21.29 12.03
75th Percentile 2.23 18.48 47.19 14.06
Maximum 3.88 32.99 206.78 20.79Source: Capital IQ; Date: 31 Dec 2019
26

INDUSTRY
OVERVIEW
SWOT
ANALYSIS
PRE-COVID
VALUATION
POST-COVID
ANALYSIS
POST-COVID
VALUATIONAPPENDIX
Deliverable 1: Pre-COVID Market Approach ValuationComparable Company Analysis
Valuation Multiples of Comparable Companies
Implied Valuation Range (GBP Mn)
1.05
1.14
1.42
0.85
0.93
1.98
1.89
3.37
2.97
1.13
1.72
3.88
8.48
11.04
11.52
11.52
12.04
12.48
14.02
16.23
17.18
22.37
25.74
32.99
The Restaurant Group plc
BJ's Restaurants, Inc.
Ibersol, S.G.P.S., S.A.
Red Robin Gourmet Burgers, Inc.
Fiesta Restaurant Group, Inc.
Ruth's Hospitality Group, Inc.
El Pollo Loco Holdings, Inc.
Domino's Pizza Group plc
Denny's Corporation
Carrols Restaurant Group, Inc.
Papa John's International, Inc.
Shake Shack Inc.
EV/EBITDA EV/Revenue
Minimum 25th Percentile Median 75th Percentile Maximum
Based on EBITDA 609.66 798.77 1,495.98 2,086.51 3,724.39
Based on Revenue 730.14 953.52 1,345.57 1,910.29 3,322.21
27
INDUSTRY
OVERVIEW
SWOT
ANALYSIS
PRE-COVID
VALUATION
POST-COVID
ANALYSIS
POST-COVID
VALUATIONAPPENDIX
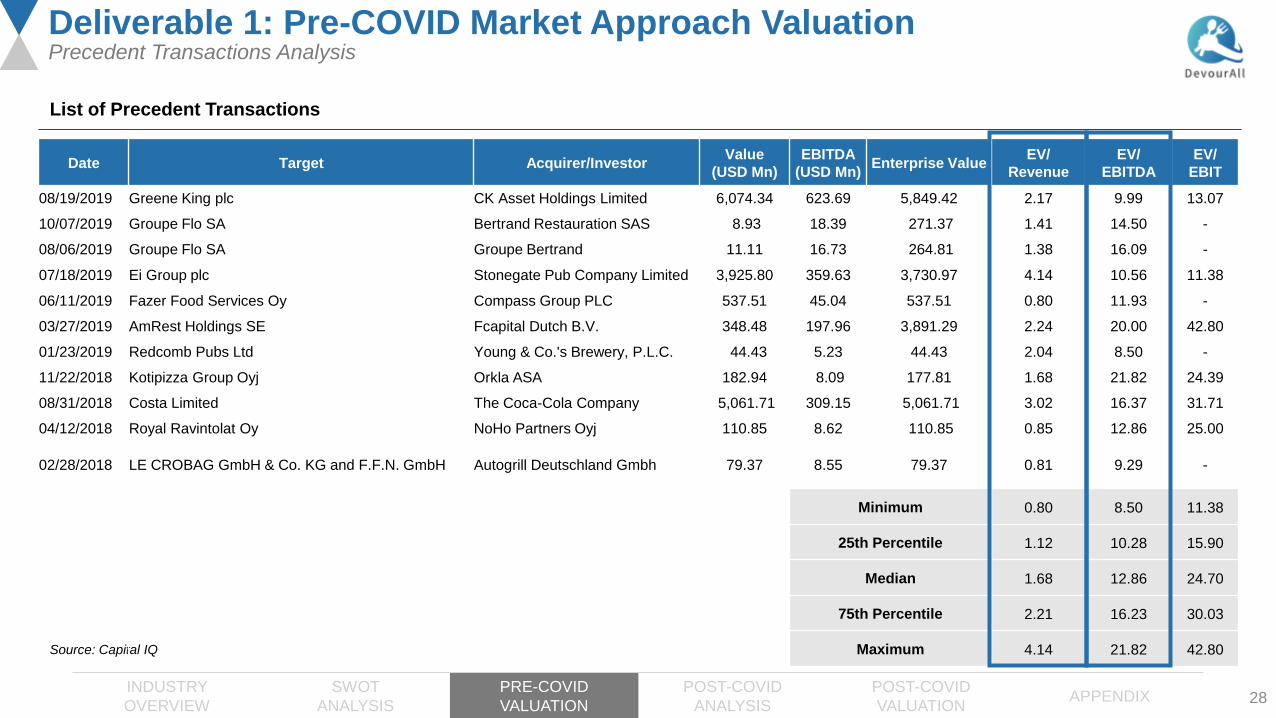
Deliverable 1: Pre-COVID Market Approach ValuationPrecedent Transactions Analysis
List of Precedent Transactions
Source: Capital IQ
28
Date Target Acquirer/InvestorValue
(USD Mn)
EBITDA
(USD Mn)Enterprise Value
EV/
Revenue
EV/
EBITDA
EV/
EBIT
08/19/2019 Greene King plc CK Asset Holdings Limited 6,074.34 623.69 5,849.42 2.17 9.99 13.07
10/07/2019 Groupe Flo SA Bertrand Restauration SAS 8.93 18.39 271.37 1.41 14.50 -
08/06/2019 Groupe Flo SA Groupe Bertrand 11.11 16.73 264.81 1.38 16.09 -
07/18/2019 Ei Group plc Stonegate Pub Company Limited 3,925.80 359.63 3,730.97 4.14 10.56 11.38
06/11/2019 Fazer Food Services Oy Compass Group PLC 537.51 45.04 537.51 0.80 11.93 -
03/27/2019 AmRest Holdings SE Fcapital Dutch B.V. 348.48 197.96 3,891.29 2.24 20.00 42.80
01/23/2019 Redcomb Pubs Ltd Young & Co.'s Brewery, P.L.C. 44.43 5.23 44.43 2.04 8.50 -
11/22/2018 Kotipizza Group Oyj Orkla ASA 182.94 8.09 177.81 1.68 21.82 24.39
08/31/2018 Costa Limited The Coca-Cola Company 5,061.71 309.15 5,061.71 3.02 16.37 31.71
04/12/2018 Royal Ravintolat Oy NoHo Partners Oyj 110.85 8.62 110.85 0.85 12.86 25.00
02/28/2018 LE CROBAG GmbH & Co. KG and F.F.N. GmbH Autogrill Deutschland Gmbh 79.37 8.55 79.37 0.81 9.29 -
Minimum 0.80 8.50 11.38
25th Percentile 1.12 10.28 15.90
Median 1.68 12.86 24.70
75th Percentile 2.21 16.23 30.03
Maximum 4.14 21.82 42.80
INDUSTRY
OVERVIEW
SWOT
ANALYSIS
PRE-COVID
VALUATION
POST-COVID
ANALYSIS
POST-COVID
VALUATIONAPPENDIX
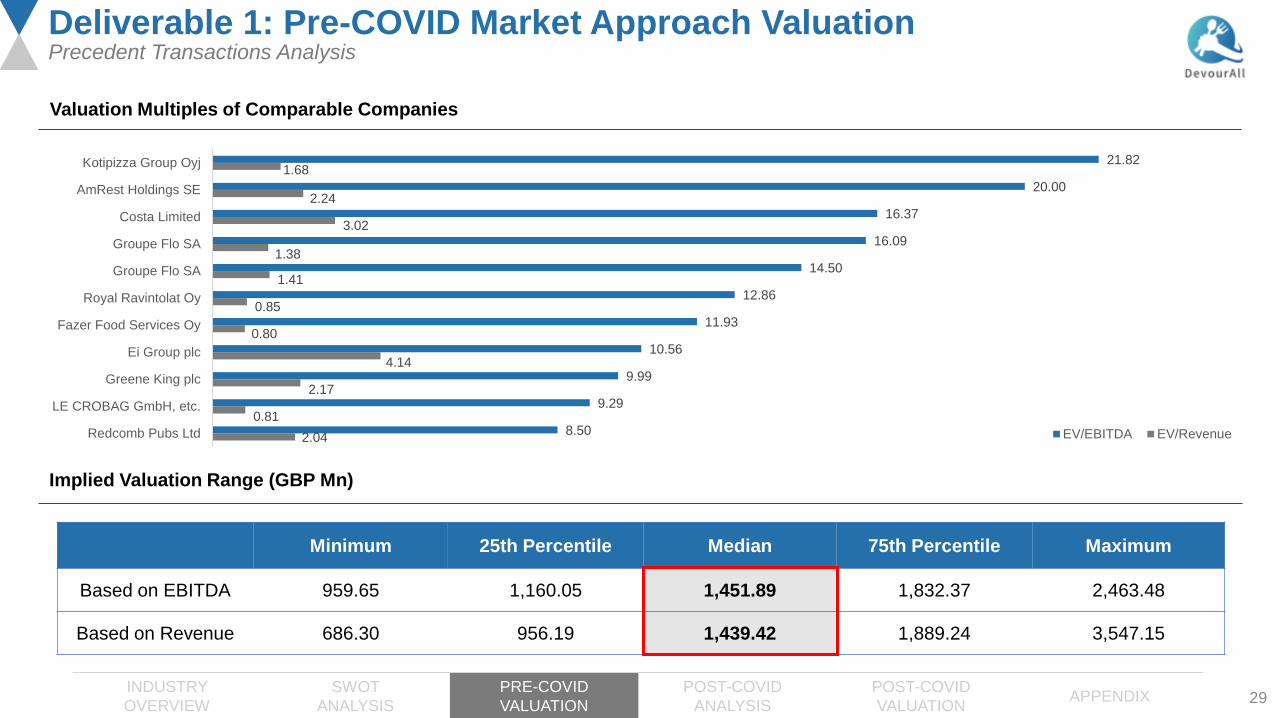
Deliverable 1: Pre-COVID Market Approach ValuationPrecedent Transactions Analysis
Valuation Multiples of Comparable Companies
Implied Valuation Range (GBP Mn)
2.04
0.81
2.17
4.14
0.80
0.85
1.41
1.38
3.02
2.24
1.68
8.50
9.29
9.99
10.56
11.93
12.86
14.50
16.09
16.37
20.00
21.82
Redcomb Pubs Ltd
LE CROBAG GmbH, etc.
Greene King plc
Ei Group plc
Fazer Food Services Oy
Royal Ravintolat Oy
Groupe Flo SA
Groupe Flo SA
Costa Limited
AmRest Holdings SE
Kotipizza Group Oyj
EV/EBITDA EV/Revenue
Minimum 25th Percentile Median 75th Percentile Maximum
Based on EBITDA 959.65 1,160.05 1,451.89 1,832.37 2,463.48
Based on Revenue 686.30 956.19 1,439.42 1,889.24 3,547.15
29

INDUSTRY
OVERVIEW
SWOT
ANALYSIS
PRE-COVID
VALUATION
POST-COVID
ANALYSIS
POST-COVID
VALUATIONAPPENDIX
Deliverable 1: Blended Valuation of DevourAllWeighted average of the three types of valuation methods used
Valuation Method Weightage Rationale
PTA – EV/Revenue 2.5% • No two deals are absolutely comparable due to different synergy benefits and different market conditions at the
time of acquisition.
• Due to these limitations, this approach was assigned the lowest combined weightage of 10%.
• As opposed to Sales Revenue, EBITDA is a better indicator of a firm’s financial performance and earning potential as
it takes into consideration COGS but not non-cash expenses like depreciation and amortization. Thus, the valuation
figure derived from using the EV/EBITDA multiple was assigned a higher weightage.
PTA – EV/EBITDA 7.5%
30

INDUSTRY
OVERVIEW
SWOT
ANALYSIS
PRE-COVID
VALUATION
POST-COVID
ANALYSIS
POST-COVID
VALUATIONAPPENDIX
Deliverable 1: Blended Valuation of DevourAllWeighted average of the three types of valuation methods used
Valuation Method Weightage Rationale
PTA – EV/Revenue 2.5% • No two deals are absolutely comparable due to different synergy benefits and different market conditions at the
time of acquisition.
• Due to these limitations, this approach was assigned the lowest combined weightage of 10%.
• As opposed to Sales Revenue, EBITDA is a better indicator of a firm’s financial performance and earning potential as
it takes into consideration COGS but not non-cash expenses like depreciation and amortization. Thus, the valuation
figure derived from using the EV/EBITDA multiple was assigned a higher weightage.
PTA – EV/EBITDA 7.5%
CCA – EV/EBITDA 20% • Easy to compute a benchmark value from widely available data, but finding appropriate comparable companies can
be subjective and difficult.
• This approach was therefore assigned an intermediate combined weightage of 30%.
• EBITDA is a better indicator of a firm’s financial performance and earning potential as it takes into consideration
COGS but not non-cash expenses like depreciation and amortization. Thus, the valuation figure derived from the
EV/EBITDA multiple was assigned a higher weightage.
CCA – EV/Revenue 10%
31

INDUSTRY
OVERVIEW
SWOT
ANALYSIS
PRE-COVID
VALUATION
POST-COVID
ANALYSIS
POST-COVID
VALUATIONAPPENDIX
Deliverable 1: Blended Valuation of DevourAllWeighted average of the three types of valuation methods used
Valuation Method Weightage Rationale
PTA – EV/Revenue 2.5% • No two deals are absolutely comparable due to different synergy benefits and different market conditions at the
time of acquisition.
• Due to these limitations, this approach was assigned the lowest combined weightage of 10%.
• As opposed to Sales Revenue, EBITDA is a better indicator of a firm’s financial performance and earning potential as
it takes into consideration COGS but not non-cash expenses like depreciation and amortization. Thus, the valuation
figure derived from using the EV/EBITDA multiple was assigned a higher weightage.
PTA – EV/EBITDA 7.5%
CCA – EV/EBITDA 20% • Easy to compute a benchmark value from widely available data, but finding appropriate comparable companies can
be subjective and difficult.
• This approach was therefore assigned an intermediate combined weightage of 30%.
• EBITDA is a better indicator of a firm’s financial performance and earning potential as it takes into consideration
COGS but not non-cash expenses like depreciation and amortization. Thus, the valuation figure derived from the
EV/EBITDA multiple was assigned a higher weightage.
CCA – EV/Revenue 10%
DCF 60%
• Intrinsic valuation is based on the company’s financials, and can provide a more accurate estimate of the company’s
true value as it includes future expectations about the business.
• This approach does not rely on comparable companies. Given DevourAll’s relatively small capitalization, there are
limited comparable companies that reduces the accuracy and reliability of valuation multiples.
• However, the discounted cash flow analysis relies on a large number of assumptions, especially when forecasting
future financial performance. This limitation can be partially overcome by sensitivity analysis. Considering the impact
of terminal growth rate and WACC on DevourAll’s intrinsic value raises the credibility of the model, creates a more
accurate forecast, and drives data-backed decision-making.
• Given the sound theoretical backing of this method, the discounted cash flow approach is given the highest weightage
of 60%.
Based on the weights allocated, DevourAll’s final valuation is derived to be GBP 1,323.13 Mn.
32

INDUSTRY
OVERVIEW
SWOT
ANALYSIS
PRE-COVID
VALUATION
POST-COVID
ANALYSIS
POST-COVID
VALUATIONAPPENDIX
Deliverable 1: Valuation SummaryFootball Field Valuation chart
0 500 1000 1500 2000 2500 3000 3500 4000
DCF
CCA - EV/Sales
CCA - EV/EBITDA
PTA - EV/EBITDA
PTA - EV/Sales
25th Percentile to Median Median to 75th Percentile
GBP 1,323.13 Mn
33

34
DevourAll’s Journey Through COVID-19
4. Post-COVID Analysis
• Scenario 1: Recovery from COVID-19
• Scenario 2: COVID-19 situation worsens

INDUSTRY
OVERVIEW
SWOT
ANALYSIS
PRE-COVID
VALUATION
POST-COVID
ANALYSIS
POST-COVID
VALUATIONAPPENDIX 35
Deliverable 2: Post-COVID Discounted Cash Flow AnalysisAssumptions and forecasts
We projected two post-COVID scenarios going forward
Scenario 1
COVID-19 remains under control; successful recovery
Lifting of restrictions on travel, coupled with UK’s Eat Out to
Help Out scheme, may support swift recovery of foodservice
operations (Smith, 2020).
70
75
80
85
90
95
100
105
UK Historical and Projected GDP (GBP Mn)
Historical
Scenario 2
Source: Office for National Statistics, Team projections for illustration
Possible second wave; delivery becomes new normal
Second wave of infections, especially during winter, can
result in further lockdown measures that restrict recovery of
foodservice operations (Gallagher, 2020).70
75
80
85
90
95
100
105
UK Historical and Projected GDP (GBP Mn)
Historical Scenario 1
70
75
80
85
90
95
100
105
UK Historical and Projected GDP (GBP Mn)
Historical Scenario 1 Scenario 2

INDUSTRY
OVERVIEW
SWOT
ANALYSIS
PRE-COVID
VALUATION
POST-COVID
ANALYSIS
POST-COVID
VALUATIONAPPENDIX 36
Deliverable 2: Post-COVID Discounted Cash Flow AnalysisAssumptions and forecasts
Income statement assumptions
Revenue
Streams
Revenue
Drivers
Balance sheet assumptions
Number of sites x Average spending per site
= Revenue from store operations
Store operations Delivery service
Margins
• Gross margin assumed to remain stable at 20.8% as per
2020P
• EBITDA margin expected to increase from 2020P to
2022P, before tapering off at 13.2% in 2023P
NOWC
Capex
Current Assets (excluding cash) – Current Liabilities
(excluding short-term debt)
• Capital expenditure as a percentage of revenue declines
to 5.0% in 2024P on a straight-line basis
• Depreciation as a percentage of plant, property, and
equipment remains at a historic average of 11.9%
x
-

INDUSTRY
OVERVIEW
SWOT
ANALYSIS
PRE-COVID
VALUATION
POST-COVID
ANALYSIS
POST-COVID
VALUATIONAPPENDIX 37
Deliverable 2: Post-COVID Discounted Cash Flow AnalysisWe forecasted two mutually exclusive possibilities going forward
Store operations projections for our two different scenarios
-200
-150
-100
-50
0
50
100
150
2016A 2017A 2018A 2019A 2020P 2021P 2022P 2023P 2024P
Number of stores added/ (closed)
-200
-150
-100
-50
0
50
100
150
2016A 2017A 2018A 2019A 2020P 2021P 2022P 2023P 2024P
Number of stores added/ (closed)
Historical Scenario 1
-200
-150
-100
-50
0
50
100
150
2016A 2017A 2018A 2019A 2020P 2021P 2022P 2023P 2024P
Number of stores added/ (closed)
Historical Scenario 1 Scenario 2
Scenario 1
Scenario 2
COVID-19 remains under control; successful recovery
DevourAll is expected to open 50 new sites in 2022P.
Thereafter, store growth returns to pre-COVID projected
levels, with more sites being opened as per original pre-
COVID plan for 2020P.
Possible second wave; delivery becomes new normal
Restrictions continue to be imposed on travel and
foodservices operations, forcing DevourAll to delay rapid
expansion. Gradual store expansion of 2% is expected in
2022P instead, reflecting a less aggressive expansion
blueprint.

INDUSTRY
OVERVIEW
SWOT
ANALYSIS
PRE-COVID
VALUATION
POST-COVID
ANALYSIS
POST-COVID
VALUATIONAPPENDIX 38
Deliverable 2: Post-COVID Discounted Cash Flow AnalysisWe forecasted two mutually exclusive possibilities going forward
Delivery service revenue for our two different scenarios
Scenario 1
Scenario 2
COVID-19 remains under control; successful recovery
The food delivery sector is expected to continue to grow,
albeit at a slower rate due to lower demand as customers
can now opt to dine-in at restaurants (Statista, 2020).
Possible second wave; delivery becomes new normal
The food delivery sector grows much more rapidly,
reaching 26.8% in 2020P. Strong delivery and takeaway
sales are expected as consumers seek convenient
alternatives to dining-in (Statista, 2020).
15.60%
9.80%
7.10%
5.00%
3.40%
26.80%
0%
5%
10%
15%
20%
25%
30%
2020P 2021P 2022P 2023P 2024P
Delivery sales growth (projected)
Scenario 1 Scenario 2
INDUSTRY
OVERVIEW
SWOT
ANALYSIS
PRE-COVID
VALUATION
POST-COVID
ANALYSIS
POST-COVID
VALUATIONAPPENDIX
30%
-34%
0%
15%
3% 4%
-40%
-30%
-20%
-10%
0%
10%
20%
30%
40%
0.00
100.00
200.00
300.00
400.00
500.00
600.00
700.00
800.00
900.00
2019A 2020P 2021P 2022P 2023P 2024P
% c
han
ge in
no
. of
ph
ysic
al s
tore
s
Rev
enu
e/G
BP
Mn
On-site Delivery % change
30%
-34%
0%2% 3%
7%
-40%
-30%
-20%
-10%
0%
10%
20%
30%
40%
0.00
100.00
200.00
300.00
400.00
500.00
600.00
700.00
800.00
900.00
2019A 2020P 2021P 2022P 2023P 2024P
% c
han
ge in
no
. of
ph
ysic
al s
tore
s
Rev
enu
e/G
BP
Mn
On-site Delivery % change
39
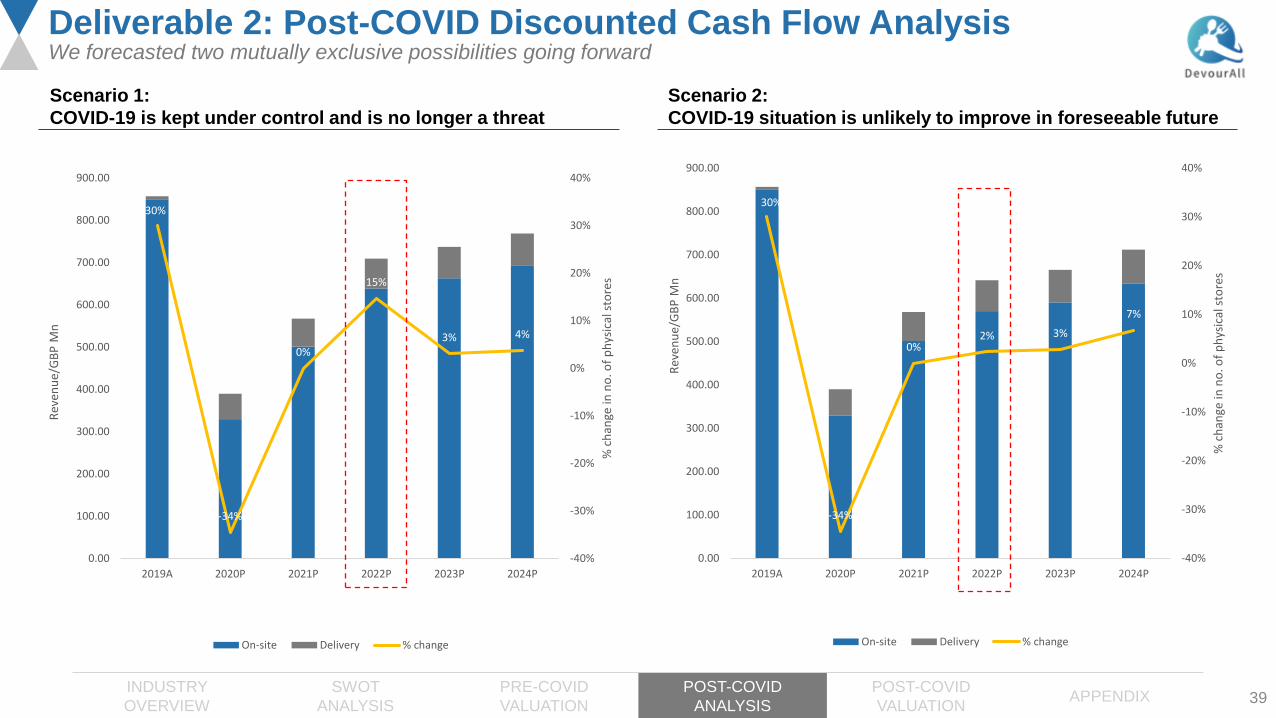
Deliverable 2: Post-COVID Discounted Cash Flow AnalysisWe forecasted two mutually exclusive possibilities going forward
Scenario 1:
COVID-19 is kept under control and is no longer a threat
Scenario 2:
COVID-19 situation is unlikely to improve in foreseeable future

INDUSTRY
OVERVIEW
SWOT
ANALYSIS
PRE-COVID
VALUATION
POST-COVID
ANALYSIS
POST-COVID
VALUATIONAPPENDIX 40
Deliverable 2: Post-COVID Discounted Cash Flow AnalysisPost-COVID Balance sheet projections - Scenario 1
Units: GBP Mn 2015A 2016A 2017A 2018A 2019A 2020P 2021P 2022P 2023P 2024P
Cash 2.40 7.60 7.70 52.60 39.70 48.86 21.54 69.99 120.16 175.51
Receivables 10.70 15.50 11.90 18.20 17.40 12.40 13.59 17.00 17.66 18.43
Inventory 5.10 4.50 4.70 6.90 7.40 4.00 5.24 6.56 6.81 7.11
Prepaid Expenses & Other 12.20 12.60 14.00 25.00 24.20 24.20 16.02 20.04 20.82 21.72
Total Current Assets 30.30 40.30 38.30 102.70 88.70 89.46 56.39 113.59 165.45 222.77
Land, buildings and equipment 272.30 284.00 287.50 296.70 311.80 299.61 298.75 303.40 306.57 308.42
Intangibles & Goodwill 21.10 21.10 21.10 494.70 492.50 492.50 492.50 492.50 492.50 492.50
Other Assets - - - 1.10 1.00 1.00 1.00 1.00 1.00 1.00
Total Non-Current Assets 293.40 305.20 308.60 792.50 805.30 793.11 792.25 796.90 800.07 801.92
Total Assets 323.80 345.50 346.90 895.20 894.00 882.58 848.64 910.49 965.52 1,024.69
Trade Accounts Payable 44.50 34.20 30.50 62.90 52.20 62.20 41.57 52.00 54.03 56.37
Accrued Expenses 50.10 55.00 52.90 91.00 80.90 80.90 60.72 75.95 78.91 82.33
Short-Term Debt 1.00 0.30 0.10 0.20 8.80 10.00 10.00 10.00 10.00 10.00
Other Current Liabilities 13.40 20.40 18.30 26.50 36.20 36.20 36.20 36.20 36.20 36.20
Total Current Liabilities 108.90 109.90 101.80 180.60 178.10 189.30 148.49 174.14 179.13 184.90
Long-Term Debt 24.40 30.20 24.90 283.00 258.60 258.60 258.60 258.60 258.60 258.60
Capital Leases 2.40 2.40 1.10 1.90 9.50 11.88 17.28 21.61 22.46 23.43
Other Liabilities 11.70 34.20 49.10 110.60 83.10 83.10 83.10 83.10 83.10 83.10
Total Non-Current Liabilities 38.40 66.80 75.10 395.50 351.20 353.58 358.98 363.31 364.16 365.13
Total Liabilities 147.30 176.70 176.90 576.10 529.40 542.88 507.47 537.45 543.29 550.03
Total Equities 176.40 168.80 170.00 319.10 364.70 339.70 341.17 373.03 422.23 474.66

INDUSTRY
OVERVIEW
SWOT
ANALYSIS
PRE-COVID
VALUATION
POST-COVID
ANALYSIS
POST-COVID
VALUATIONAPPENDIX 41
Deliverable 2: Post-COVID Discounted Cash Flow AnalysisPost-COVID Balance sheet projections - Scenario 2
Units: GBP Mn 2015A 2016A 2017A 2018A 2019A 2020P 2021P 2022P 2023P 2024P
Cash 2.40 7.60 7.70 52.60 39.70 48.86 21.67 58.26 103.92 158.01
Receivables 10.70 15.50 11.90 18.20 17.40 12.40 13.61 15.37 15.95 17.06
Inventory 5.10 4.50 4.70 6.90 7.40 4.00 5.25 5.93 6.15 6.58
Prepaid Expenses & Other 12.20 12.60 14.00 25.00 24.20 24.20 16.04 18.12 18.80 20.11
Total Current Assets 30.30 40.30 38.30 102.70 88.70 89.46 56.58 97.68 144.82 201.76
Land, buildings and equipment 272.30 284.00 287.50 296.70 311.80 299.61 298.79 299.97 300.06 300.05
Intangibles & Goodwill 21.10 21.10 21.10 494.70 492.50 492.50 492.50 492.50 492.50 492.50
Other Assets - - - 1.10 1.00 1.00 1.00 1.00 1.00 1.00
Total Non-Current Assets 293.40 305.20 308.60 792.50 805.30 793.11 792.29 793.47 793.56 793.55
Total Assets 323.80 345.50 346.90 895.20 894.00 882.58 848.87 891.15 938.38 995.31
Trade Accounts Payable 44.50 34.20 30.50 62.90 52.20 62.20 41.63 47.02 48.78 52.18
Accrued Expenses 50.10 55.00 52.90 91.00 80.90 80.90 60.81 68.68 71.25 76.22
Short-Term Debt 1.00 0.30 0.10 0.20 8.80 10.00 10.00 10.00 10.00 10.00
Other Current Liabilities 13.40 20.40 18.30 26.50 36.20 36.20 36.20 36.20 36.20 36.20
Total Current Liabilities 108.90 109.90 101.80 180.60 178.10 189.30 148.64 161.91 166.23 174.60
Long-Term Debt 24.40 30.20 24.90 283.00 258.60 258.60 258.60 258.60 258.60 258.60
Capital Leases 2.40 2.40 1.10 1.90 9.50 11.88 17.31 19.55 20.28 21.69
Other Liabilities 11.70 34.20 49.10 110.60 83.10 83.10 83.10 83.10 83.10 83.10
Total Non-Current Liabilities 38.40 66.80 75.10 395.50 351.20 353.58 359.01 361.25 361.98 363.39
Total Liabilities 147.30 176.70 176.90 576.10 529.40 542.88 507.65 523.15 528.20 537.99
Total Equities 176.40 168.80 170.00 319.10 364.70 339.70 341.22 368.00 410.18 457.32

INDUSTRY
OVERVIEW
SWOT
ANALYSIS
PRE-COVID
VALUATION
POST-COVID
ANALYSIS
POST-COVID
VALUATIONAPPENDIX
Assumptions Rationale
Income Statement
Number of stores As per the case, DevourAll does not plan to open stores until 2022P.
Scenario 1: We assume 50 stores are opened in 2022P, 12 in 2023P and 15 in 2024P, reflecting postponement of
managerial blueprint for Pre-COVID 2020P.
Scenario 2: We assume 8, 10, 24 stores in 2022P to 2024P respectively, reflecting growth trend of 2%, 3%, 7% in
managerial estimates for Pre-COVID 2022P.
Blended revenue/ site Average spending per site expected to remain relatively constant, growing by inflation since DevourAll operates in the
foodservice industry characterised by low-margins and high price sensitivity (Appendix 1), thus is expected to have little room
to lower or hike prices.
Delivery sales 35 sites converted to focus on delivery expected to boost delivery sales by number of sites x average blended revenue/ site.
Terminal delivery growth at 3.4% (Statista, 2020).
Scenario 1: Smoother growth trend of 15.6% in 2020P, before tapering to 3.4% in 2024P when lockdown measures ease.
New consumer preference towards delivery result in delivery growth that is still relatively strong (Statista, 2020).
Scenario 2: Possible second wave and lockdown measures result in spike in delivery of 26.8%, reflecting industry growth
trends after accounting for COVID-19 (Statista, 2020).
EBITDA Margin Case assumes EBITDA margin reflect 2019A levels in 2023P. Our team assume 2024P margin reflect 2023P level.
Depreciation Depreciation is taken as an average of historical % of PPE at 11.9%.
Tax rate Tax rate is 19%, reflecting UK government budget announcement for 2021P (Gov.UK, 2020)
Balance Sheet
Total Equities No additional share issuances.
Profit after tax (assuming no interest) is added into retained earnings.
42
Deliverable 2: Post-COVID Discounted Cash Flow AnalysisDetailed assumptions

INDUSTRY
OVERVIEW
SWOT
ANALYSIS
PRE-COVID
VALUATION
POST-COVID
ANALYSIS
POST-COVID
VALUATIONAPPENDIX
Assumptions Rationale
Balance Sheet
Cash Cash balance each year assumed to be excess cash that is typically stored in the banks or invested in short term securities,
and are not required in the daily operations of the business. Thus, it is excluded from calculations of NOWC.
Receivables, Inventory Calculated receivables & inventory as a % of revenue each year from 2015A to 2019A, and took the average of the
percentage figures calculated to derive the projected receivables & inventory figures for 2021P onwards respectively.
Land, Buildings & Equipment (PPE) Calculated from adding the current year’s Capex to the previous year’s PPE figure, less current year depreciation.
Intangibles & Goodwill, Other Assets Assumed to be flatlined across the projected years.
Prepaid Expenses,
Trade Account Payables,
Accrued Expenses
Calculated the respective values as a % of revenue each year from 2015A to 2019A, and took the average of the percentage
figures calculated to derive the projected figures for 2021P onwards.
Other current liabilities,
Other non-current liabilities
Both other current and non-current liabilities are flatlined - assume no additional current and non-current liabilities taken up.
Short-term (ST) Debt ST Debt assumed to remain constant at pre-COVID projection levels. Furthermore, since DevourAll had excess cash balance
for previous years, we assume that DevourAll could draw down from their cash reserves and hence would not need to make
use of the new £30.0 million working capital facility, thus no change to ST Debt.
Long-term (LT) Debt LT Debt is flatlined – assume no additional net debt taken up or repaid.
Capital Leases Capital Leases as a % of PPE for 2020P onwards assumed to follow 2019’s % figure.
Net Operating Working Capital
(NOWC)
NOWC was calculated based on: Current Assets (excluding cash) – Current Liabilities (excluding short-term debt)
All cash assumed to be excess cash and thus not included in NOWC.
Capital Expenditure (Capex) Case mentioned that Capex would be 5% of revenue in 2024P, thus assumed that Capex would decrease gradually to 5% of
revenue for each year from 2021P to 2024P.
43
Deliverable 2: Post-COVID Discounted Cash Flow AnalysisDetailed assumptions
44
DevourAll’s Journey Through COVID-19
5. Post-COVID Valuation
• Discounted Cash Flow valuation
• Market Approach valuation - Comparable Company analysis
• Summary

INDUSTRY
OVERVIEW
SWOT
ANALYSIS
PRE-COVID
VALUATION
POST-COVID
ANALYSIS
POST-COVID
VALUATIONAPPENDIX 45
Deliverable 2: Post-COVID Discounted Cash Flow ValuationConsidering the WACC
Cost of Debt Risk Free Rate
Market Risk Premium Levered Beta
6.22%
7.16%
Pre-COVID Post-COVID
0.74%
0.22%
Pre-COVID Post-COVID
5.75%
6.75%
Pre-COVID Post-COVID
0.60
1.48
Pre-COVID Post-COVID

INDUSTRY
OVERVIEW
SWOT
ANALYSIS
PRE-COVID
VALUATION
POST-COVID
ANALYSIS
POST-COVID
VALUATIONAPPENDIX 46
Deliverable 2: Post-COVID Discounted Cash Flow ValuationConsidering the WACC
Cost of Debt
Cost of Equity
Cost of
Debt
Cost of debt is 7.16%, the yield of B-rated corporate bonds
issued in the consumer staples industry as at 30 Sep 2020,
based on the average credit rating of comparable companies.
Risk-free
Rate
Risk-free rate of 0.22% is based on 10Y UK Government Debt
rate as at 30 Sep 2020. BoE is creating a low interest rate
environment to stimulate the UK economy.
Levered
Beta
The average unlevered beta of comparable companies has
increased to 0.90, which is taken to be DevourAll’s unlevered
beta.
Risk
Premium
• Market risk premium is 6.75% (KPMG Equity Market Risk
Premium Research, 2020)
• Country risk premium (Damodaran, 2020) was taken as a
blended average given DevourAll’s percentage of revenue
derived from the UK, US and Europe
• Size premium of 3.39% for micro-cap stocks was added
(EY, 2020)
Terminal WACC computation
Target Capital Structure
Debt-to-Total 43.86%
Equity-to-Total 56.14%
Cost of Debt
Cost of Debt 7.16%
Tax Rate 19%
After-Tax Cost of Debt 5.80%
Cost of Equity
Risk-Free Rate 0.22%
Levered Beta 1.48
Market Risk Premium 6.75%
Country risk premium
UK 0.23%
US 0.00%
Europe 2.09%
As of 2019, DevourAll’s revenue is derived from -
UK 69.75%
US 22.74%
Europe 7.51%
Blended country risk premium 0.32%
Size premium 3.39%
Cost of Equity 14.05%
WACC 10.43%
Capital Structure
Target
Capital
Structure
Target capital structure is based on the median debt-to-equity
ratio of comparable companies of 0.78. Debt levels have
increased from pre-COVID 19.

INDUSTRY
OVERVIEW
SWOT
ANALYSIS
PRE-COVID
VALUATION
POST-COVID
ANALYSIS
POST-COVID
VALUATIONAPPENDIX 47
Deliverable 2: Post-COVID Discounted Cash Flow ValuationDiscounted Cash Flow Analysis – Scenario 1
Post-COVID DCF (GBP Mn)
FYE 31 Dec 2020P 2021P 2022P 2023P 2024P
Revenue 389.84 567.13 709.36 737.04 768.99
Less: COGS (308.74) (449.15) (561.79) (583.71) (609.02)
Gross Profit 81.10 117.98 147.57 153.33 159.97
Less: SG&A (68.71) (81.06) (77.74) (56.21) (58.65)
EBITDA 12.39 36.92 69.83 97.12 101.33
Less: Depreciation & Amortization (37.39) (35.45) (36.01) (36.38) (36.60)
EBIT (25.00) 1.47 33.82 60.74 64.73
Less: Tax Expense* 0 0 (1.95) (11.54) (12.30)
EBIAT (25.00) 1.47 31.87 49.20 52.43
Add: Depreciation & Amortization 37.39 35.45 36.01 36.38 36.60
Less: Capex (25.20) (34.58) (40.66) (39.55) (38.45)
Less: Change in net working capital 18.40 (35.06) 16.91 3.29 3.80
Unlevered free cash flow 5.59 (32.73) 44.12 49.32 54.38
Discount Factor 0.91 0.82 0.74 0.67 0.61
Present Value 5.06 (26.84) 32.76 33.16 33.11
Terminal Value 341.99
Enterprise Value (Terminal Growth) 451.64
* The UK Government announced at Budget 2020 that the Corporation Tax main rate will remain at 19% for the years starting 1 April 2020 and 2021. For the purposes of this case, this tax rate has been
projected through DevourAll’s financial years ending 31 December 2020 to 2024.
INDUSTRY
OVERVIEW
SWOT
ANALYSIS
PRE-COVID
VALUATION
POST-COVID
ANALYSIS
POST-COVID
VALUATIONAPPENDIX 48
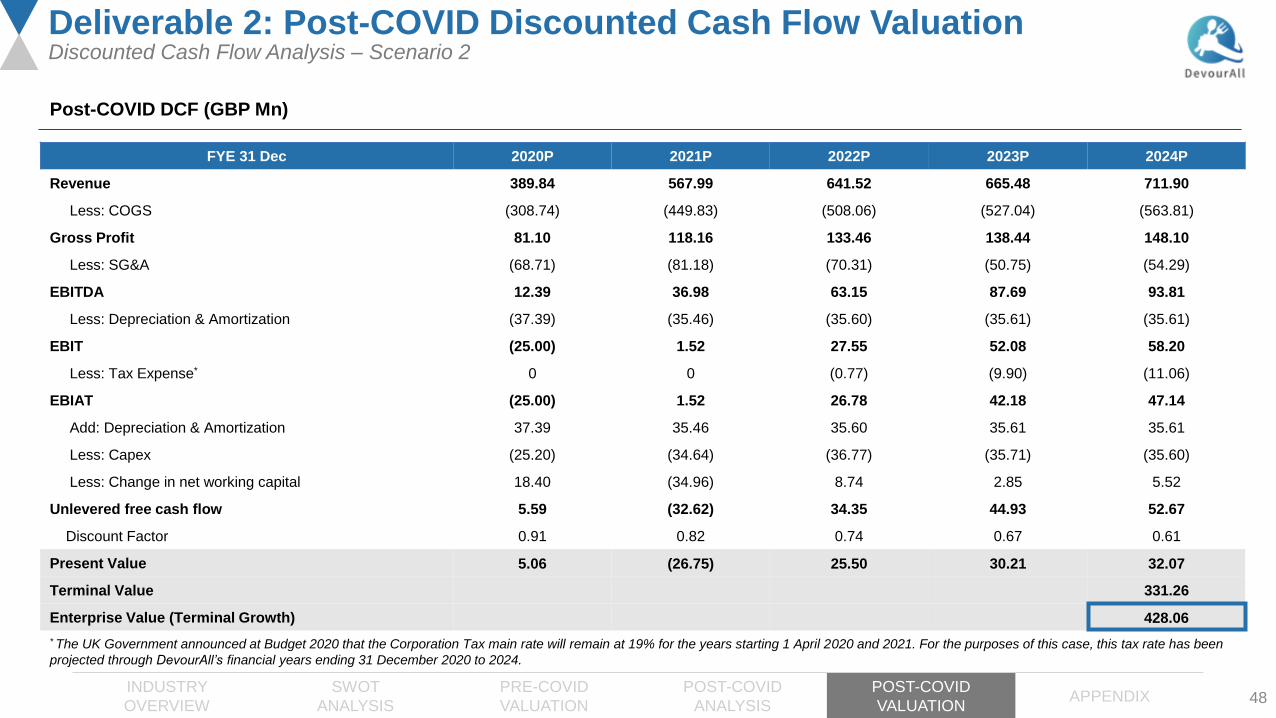
Deliverable 2: Post-COVID Discounted Cash Flow ValuationDiscounted Cash Flow Analysis – Scenario 2
Post-COVID DCF (GBP Mn)
FYE 31 Dec 2020P 2021P 2022P 2023P 2024P
Revenue 389.84 567.99 641.52 665.48 711.90
Less: COGS (308.74) (449.83) (508.06) (527.04) (563.81)
Gross Profit 81.10 118.16 133.46 138.44 148.10
Less: SG&A (68.71) (81.18) (70.31) (50.75) (54.29)
EBITDA 12.39 36.98 63.15 87.69 93.81
Less: Depreciation & Amortization (37.39) (35.46) (35.60) (35.61) (35.61)
EBIT (25.00) 1.52 27.55 52.08 58.20
Less: Tax Expense* 0 0 (0.77) (9.90) (11.06)
EBIAT (25.00) 1.52 26.78 42.18 47.14
Add: Depreciation & Amortization 37.39 35.46 35.60 35.61 35.61
Less: Capex (25.20) (34.64) (36.77) (35.71) (35.60)
Less: Change in net working capital 18.40 (34.96) 8.74 2.85 5.52
Unlevered free cash flow 5.59 (32.62) 34.35 44.93 52.67
Discount Factor 0.91 0.82 0.74 0.67 0.61
Present Value 5.06 (26.75) 25.50 30.21 32.07
Terminal Value 331.26
Enterprise Value (Terminal Growth) 428.06
* The UK Government announced at Budget 2020 that the Corporation Tax main rate will remain at 19% for the years starting 1 April 2020 and 2021. For the purposes of this case, this tax rate has been
projected through DevourAll’s financial years ending 31 December 2020 to 2024.

INDUSTRY
OVERVIEW
SWOT
ANALYSIS
PRE-COVID
VALUATION
POST-COVID
ANALYSIS
POST-COVID
VALUATIONAPPENDIX 49
Deliverable 2: Post-COVID Discounted Cash Flow ValuationDiscounted Cash Flow Analysis – Summary
Sensitivity Analysis Terminal Growth Rate
UK Inflation Rate 0.50%
US Inflation Rate 1.37%
Europe Inflation Rate 0.30%
Blended Terminal Growth Rate 0.68%
• The terminal growth rate is the constant rate at which a company is expected
to grow in perpetuity
• A blended average of inflation rates in the UK, US and Europe, with
weights based on the proportion of DevourAll’s operations in these respective
countries, was taken as an estimate for the terminal growth rate
• Terminal growth rate of 0.68% and Terminal WACC of 10.43% were varied
more widely by ±0.2% and ±1.0% respectively due to greater volatility and
uncertainty post-COVID
• Valuation is most adversely affected by a large decrease in terminal
growth rate and increase in WACC
Scenario 1
Scenario 2
Scenario Minimum25th
PercentileMedian
75th
PercentileMaximum
1 313.91 372.19 451.64 565.59 752.85
2 295.24 351.50 428.06 536.07 719.17
Implied Valuation Range (GBP Mn)

INDUSTRY
OVERVIEW
SWOT
ANALYSIS
PRE-COVID
VALUATION
POST-COVID
ANALYSIS
POST-COVID
VALUATIONAPPENDIX 50
Deliverable 2: Post-COVID Market Approach ValuationComparable Company Analysis
List of Comparable Companies (All values in GBP Mn except multiples and EBITDA margin)
Company Name Enterprise Value Revenue EBITDA EBIT EV/Revenue EV/EBITDA EV/EBIT EBITDA Margin (%)
Denny’s Corporation 887.70 239.00 37.10 24.90 3.71 23.93 35.65 15.52
Ruth’s Hospitality Group, Inc. 489.90 248.60 18.00 1.30 1.97 27.22 376.85 7.24
Red Robin Gourmet Burgers, Inc. 669.60 789.00 2.20 (65.20) 0.85 304.36 (10.27) 0.28
Papa John’s International, Inc. 2,518.40 1,305.40 107.00 70.20 1.93 23.54 35.87 8.20
BJ’s Restaurants, Inc. 902.80 646.80 23.20 (30.90) 1.40 38.91 (29.22) 3.59
Ibersol, S.G.P.S., S.A. 532.60 309.80 (32.80) (21.20) 1.72 (16.24) (25.12) (10.59)
The Restaurant Group plc 589.00 784.40 29.00 (5.80) 0.75 20.31 (101.55) 3.70
Domino’s Pizza Group plc 2,115.40 505.60 100.20 95.70 4.18 21.11 22.10 19.82
El Pollo Loco Holdings, Inc. 645.60 313.80 42.70 29.90 2.06 15.12 21.59 13.61
Carrols Restaurant Group, Inc. 1,222.60 1,132.80 69.70 8.90 1.08 17.54 137.37 6.15
Fiesta Restaurant Group, Inc. 424.90 419.10 22.40 (5.80) 1.01 18.97 (73.26) 5.34
Shake Shack, Inc. 1,986.40 383.10 16.20 (18.90) 5.19 122.62 (105.10) 4.23
Minimum 0.75 (16.24) (105.10) (10.59)
25th Percentile 1.06 18.61 (40.23) 3.67
Median 1.82 22.32 5.66 5.75
75th Percentile 2.47 30.14 35.71 9.55
Maximum 5.19 304.36 376.85 19.82Source: Capital IQ; Date: 30 Sep 2020

INDUSTRY
OVERVIEW
SWOT
ANALYSIS
PRE-COVID
VALUATION
POST-COVID
ANALYSIS
POST-COVID
VALUATIONAPPENDIX 51
Deliverable 2: Post-COVID Market Approach ValuationComparable Company Analysis
Valuation Multiples of Comparable Companies
Implied Valuation Range (GBP Mn)
3.71
1.97
0.85
1.93
1.40
1.72
0.75
4.18
2.06
1.08
1.01
5.19
23.93
27.22
304.36
23.54
38.91
-16.24
20.31
21.11
15.12
17.54
18.97
122.62
EV/EBITDA EV/Revenue
75% 2020P/
25% 2019AMinimum 25th Percentile Median 75th Percentile Maximum
Based on EBITDA (609.14) 698.20 837.46 1,130.70 11,417.84
Based on Revenue 308.39 538.45 924.11 1,252.06 2,626.67
INDUSTRY
OVERVIEW
SWOT
ANALYSIS
PRE-COVID
VALUATION
POST-COVID
ANALYSIS
POST-COVID
VALUATIONAPPENDIX 52
Deliverable 2: Blended Valuation of DevourAllWeighted average of the three types of valuation methods used
Valuation Method Weightage Rationale
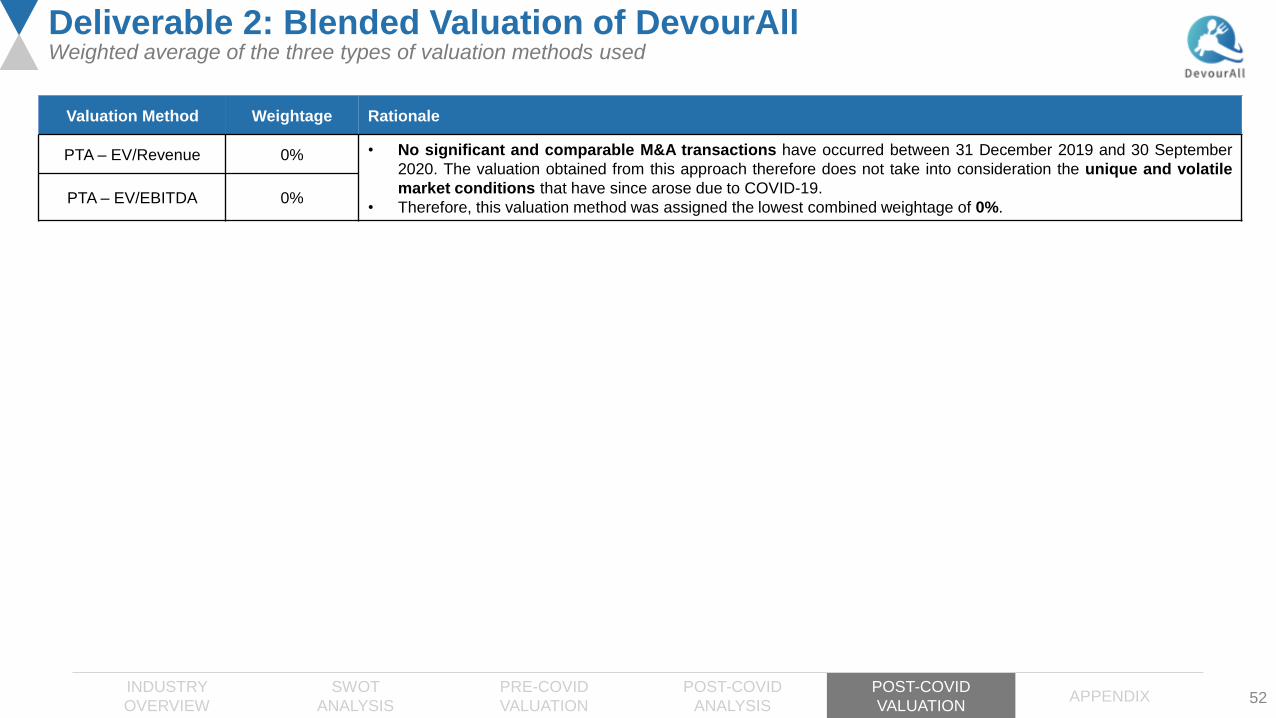
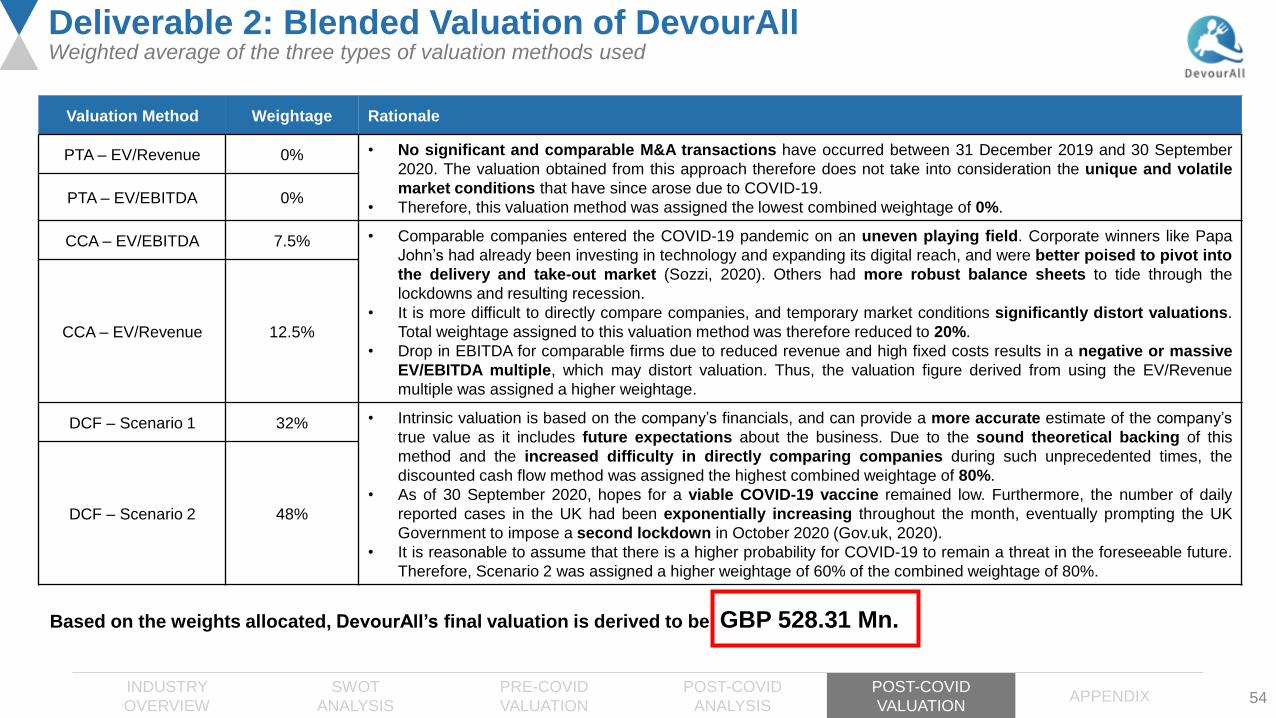
PTA – EV/Revenue 0% • No significant and comparable M&A transactions have occurred between 31 December 2019 and 30 September
2020. The valuation obtained from this approach therefore does not take into consideration the unique and volatile
market conditions that have since arose due to COVID-19.
• Therefore, this valuation method was assigned the lowest combined weightage of 0%.PTA – EV/EBITDA 0%

INDUSTRY
OVERVIEW
SWOT
ANALYSIS
PRE-COVID
VALUATION
POST-COVID
ANALYSIS
POST-COVID
VALUATIONAPPENDIX 53
Deliverable 2: Blended Valuation of DevourAllWeighted average of the three types of valuation methods used
Valuation Method Weightage Rationale
PTA – EV/Revenue 0% • No significant and comparable M&A transactions have occurred between 31 December 2019 and 30 September
2020. The valuation obtained from this approach therefore does not take into consideration the unique and volatile
market conditions that have since arose due to COVID-19.
• Therefore, this valuation method was assigned the lowest combined weightage of 0%.PTA – EV/EBITDA 0%
CCA – EV/EBITDA 7.5% • Comparable companies entered the COVID-19 pandemic on an uneven playing field. Corporate winners like Papa
John’s had already been investing in technology and expanding its digital reach, and were better poised to pivot into
the delivery and take-out market (Sozzi, 2020). Others had more robust balance sheets to tide through the
lockdowns and resulting recession.
• It is more difficult to directly compare companies, and temporary market conditions significantly distort valuations.
Total weightage assigned to this valuation method was therefore reduced to 20%.
• Drop in EBITDA for comparable firms due to reduced revenue and high fixed costs results in a negative or massive
EV/EBITDA multiple, which may distort valuation. Thus, the valuation figure derived from using the EV/Revenue
multiple was assigned a higher weightage.
CCA – EV/Revenue 12.5%
INDUSTRY
OVERVIEW
SWOT
ANALYSIS
PRE-COVID
VALUATION
POST-COVID
ANALYSIS
POST-COVID
VALUATIONAPPENDIX 54
Deliverable 2: Blended Valuation of DevourAllWeighted average of the three types of valuation methods used
Valuation Method Weightage Rationale
PTA – EV/Revenue 0% • No significant and comparable M&A transactions have occurred between 31 December 2019 and 30 September
2020. The valuation obtained from this approach therefore does not take into consideration the unique and volatile
market conditions that have since arose due to COVID-19.
• Therefore, this valuation method was assigned the lowest combined weightage of 0%.PTA – EV/EBITDA 0%
CCA – EV/EBITDA 7.5% • Comparable companies entered the COVID-19 pandemic on an uneven playing field. Corporate winners like Papa
John’s had already been investing in technology and expanding its digital reach, and were better poised to pivot into
the delivery and take-out market (Sozzi, 2020). Others had more robust balance sheets to tide through the
lockdowns and resulting recession.
• It is more difficult to directly compare companies, and temporary market conditions significantly distort valuations.
Total weightage assigned to this valuation method was therefore reduced to 20%.
• Drop in EBITDA for comparable firms due to reduced revenue and high fixed costs results in a negative or massive
EV/EBITDA multiple, which may distort valuation. Thus, the valuation figure derived from using the EV/Revenue
multiple was assigned a higher weightage.
CCA – EV/Revenue 12.5%
DCF – Scenario 1 32% • Intrinsic valuation is based on the company’s financials, and can provide a more accurate estimate of the company’s
true value as it includes future expectations about the business. Due to the sound theoretical backing of this
method and the increased difficulty in directly comparing companies during such unprecedented times, the
discounted cash flow method was assigned the highest combined weightage of 80%.
• As of 30 September 2020, hopes for a viable COVID-19 vaccine remained low. Furthermore, the number of daily
reported cases in the UK had been exponentially increasing throughout the month, eventually prompting the UK
Government to impose a second lockdown in October 2020 (Gov.uk, 2020).
• It is reasonable to assume that there is a higher probability for COVID-19 to remain a threat in the foreseeable future.
Therefore, Scenario 2 was assigned a higher weightage of 60% of the combined weightage of 80%.
DCF – Scenario 2 48%
Based on the weights allocated, DevourAll’s final valuation is derived to be GBP 528.31 Mn.

INDUSTRY
OVERVIEW
SWOT
ANALYSIS
PRE-COVID
VALUATION
POST-COVID
ANALYSIS
POST-COVID
VALUATIONAPPENDIX 55
Deliverable 2: Valuation SummaryFootball Field Valuation chart
0.00 200.00 400.00 600.00 800.00 1000.00 1200.00 1400.00
DCF - Scenario 2
DCF - Scenario 1
CCA - EV/EBITDA
CCA - EV/Revenue
25th Percentile to Median Median to 75th Percentile
GBP 528.31 Mn

INDUSTRY
OVERVIEW
SWOT
ANALYSIS
PRE-COVID
VALUATION
POST-COVID
ANALYSIS
POST-COVID
VALUATIONAPPENDIX 56
Deliverable 2: Post-COVID Discounted Cash Flow ValuationCOVID-19 has resulted in increased volatility
An increase in DevourAll’s levered beta and WACC…
• The more indebted an entity, the more volatile its future
earnings; unlevered beta eliminates the effects of debt to
capture only business risk
• Unlevered beta of comparable companies increased from
0.42 pre-COVID to 0.9 post-COVID, highlighting an
increase in business risk for the foodservices industry
… has resulted in a lower valuation
Unlevered
Beta
Levered
Beta
• DevourAll’s levered beta has increased from 0.60 pre-
COVID to 1.48 post-COVID, indicating not just an increase
in business risk, but also an increase in financial risk
due to increased leverage
WACC
• Increased market risk premium, credit risk, leverage, and
volatility outweigh decline in risk-free rate, resulting in
overall increase in WACC from 6.85% to 10.43%
0.42
0.60
7%
0.90
1.48
10.43%
0
0.2
0.4
0.6
0.8
1
1.2
1.4
1.6
Average unlevered beta ofcomparable companies
DevourAll's levered beta DevourAll's WACC
Pre-COVID Post-COVID
1,323.131240.84
1495.981345.57
528.31437.492
837.46924.11
0
200
400
600
800
1,000
1,200
1,400
1,600
Team's Valuation DCF CCA - EV/EBITDA CCA - EV/Revenue
Valu
ation (
GB
P M
n)
Pre-COVID Post-COVID
• DevourAll’s valuation has declined nearly 60% from
1,323.13 GBP Mn pre-COVID to 528.31 GBP Mn post-
COVID
• Foodservice operators have struggled through the
pandemic, with the US industry projected to lose 240 USD
Bn by the end of 2020 (Kelso, 2020)
Declining
Valuation
Key
Reasons
• Due to a flailing delivery strategy, DevourAll was unable
to pivot rapidly into no-contact delivery and takeout
• However, acquisition of Billy’s restaurant contributed to
relatively robust balance sheets to tide through COVID-19
Going
Forward
• DevourAll’s future performance will depend heavily upon its
ability to adapt to a new normal and the lasting effects of
the pandemic, such as the need for digital engagement

57
DevourAll’s Journey Through COVID-19
5. Post-COVID Valuation
• Discounted Cash Flow valuation
• Market Approach valuation -
Comparable Company analysis
• Summary
1. Industry Overview
• The foodservice industry is highly competitive
• Growth in key markets is slowing due to weak
macroeconomic trends
• However, bright spots remain for the industry
4. Post-COVID Analysis
• Scenario 1: Recovery from COVID-19
• Scenario 2: COVID-19 situation worsens
2. Company Overview & SWOT Analysis
• DevourAll is a market leader; however, its financial
performance has been on a decline
• DevourAll’s three-pronged business strategy
• SWOT Analysis
3. Pre-COVID Valuation
• Financial analysis and projections
• Discounted Cash Flow valuation
• Market Approach valuation
➢ Comparable Company analysis
➢ Precedent Transactions analysis
Appendices
• Appendix 1: Porter’s 5 forces
• Appendix 2: Comparable
Companies list
• Appendix 3: Precedent
Transactions

INDUSTRY
OVERVIEW
SWOT
ANALYSIS
PRE-COVID
VALUATION
POST-COVID
ANALYSIS
POST-COVID
VALUATIONAPPENDIX
Appendix 1: Industry OverviewPorter’s 5 Forces for foodservice industry
58
Degree of
Rivalry
(HIGH)
Bargaining
Power of Buyers
(MEDIUM)
Bargaining
Power of
Suppliers
(MEDIUM)
Threat of
Substitutes
(MEDIUM)
Threat of New
Entrants
(HIGH)
• Many competitors in the market, with top 5 players only accounting for 35.1% of
market share.
• Highly fragmented market with a high proportion of independent operators to
chained operators
• Low switching costs due to wide variety of options
• Low buyer concentration since end consumers are individuals who lack
financial muscle
• Brand building can help foodservice operators differentiate themselves and
achieve higher repeat customer rates
• High price sensitivity due to variety of options limits price setting
• Suppliers are typically wholesalers that sell to numerous businesses, but chain
restaurants can leverage on their size to exert more power over suppliers than
independent players
• Medium switching costs since standardization of ingredient quality may increase
supplier bargaining power
• Low level of capital outlay required, which makes industry attractive to new
entrants
• Low margin industry allows multinational firms to leverage on economies of
scale to capture price-sensitive customers
• Increasingly stringent regulations, such as enforcing that all companies must
display calorie information, may raise costs, deterring new entrants
• Substitutes for dining out include ordering takeaways from grocery retailers or
eating at home
• With lockdown measures post-COVID, there is likely to be increasing trend
towards delivery or dining in
• However, eating out caters to customers who value convenience
Source: Marketline
0
1
2
3
4
5
Degree ofRivalry
BargainingPower ofBuyers
BargainingPower ofSuppliers
Threat ofSubstitutes
Threat of NewEntrants

INDUSTRY
OVERVIEW
SWOT
ANALYSIS
PRE-COVID
VALUATION
POST-COVID
ANALYSIS
POST-COVID
VALUATIONAPPENDIX
Appendix 2: Comparable CompaniesPeer group by geographic location, industry classification and EBITDA between 50 and 200 GBP Mn
Company Ticker Description
1 Denny's Corporation NasdaqCM: DENN
Denny's Corporation, through its subsidiary, Denny's, Inc., owns and operates full-service restaurant
chains under the Denny's brand. As of March 25, 2020, it had 1,695 franchised, licensed, and company
restaurants worldwide.
2 Ruth's Hospitality Group, Inc. NasdaqGS: RUTH
Ruth's Hospitality Group, Inc., together with its subsidiaries, develops, operates, and franchises fine
dining restaurants under the Ruth's Chris Steak House name. The company's restaurants offer food and
beverage products to special occasion diners and frequent customers, as well as business clientele. As
of February 28, 2020, it had approximately 150 company-owned and franchisee-owned restaurants
worldwide.
3 Red Robin Gourmet Burgers, Inc. NasdaqGS: RRGB
Red Robin Gourmet Burgers, Inc., together with its subsidiaries, develops, operates, and franchises full-
service and casual-dining restaurants. The company's restaurants primarily offer burgers; various
appetizers, salads, soups, seafood, and other entrees; and desserts, milkshakes, alcoholic and non-
alcoholic specialty drinks, cocktails, wine, and beers. As of February 25, 2020, it operated approximately
550 Red Robin restaurants across the United States and Canada, including locations operating under
franchise agreements.
4 Papa John's International, Inc. NasdaqGS: PZZA
Papa John's International, Inc. operates and franchises pizza delivery and carryout restaurants under the
Papa John's trademark in the United States and internationally. It operates through four segments:
Domestic Company-Owned Restaurants, North America Commissaries, North America Franchising, and
International Operations. The company also operates dine-in and delivery restaurants. As of December
29, 2019, it operated 5,395 Papa John's restaurants, which included 598 company-owned and 4,797
franchised restaurants.
5 BJ's Restaurants, Inc. NasdaqGS:BJRI
BJ's Restaurants, Inc. owns and operates casual dining restaurants in the United States. Its restaurants
offer pizzas, craft and other beers, appetizers, entrées, pastas, sandwiches, specialty salads, and
desserts. As of October 20, 2020, the company operated 210 casual dining restaurants in 29 states.
6 Ibersol, S.G.P.S., S.A. ENXTLS: IBS
Ibersol, S.G.P.S., S.A., through its subsidiaries, operates a network of restaurant units in Portugal, Spain,
Italy, and Angola. The company operates restaurant units under various brands, including Pizza Hut,
Pasta Caffé, Pans & Company, Ribs, FresCo, SantaMaria, Kentucky Fried Chicken, Burger King, O’ Kilo,
Roulotte, Quiosques, Pizza Móvil, Miit, Taco Bell, Sol, Sugestões e Opções, Silva Carvalho Catering e
Palace Catering, travel, coffe counters, and other concessions contract. As of December 31, 2019, it
operated 659 restaurants, which include 547 owned units and 112 franchised units. Source: Capital IQ
59

INDUSTRY
OVERVIEW
SWOT
ANALYSIS
PRE-COVID
VALUATION
POST-COVID
ANALYSIS
POST-COVID
VALUATIONAPPENDIX
Company Ticker Description
7 The Restaurant Group plc LSE: RTN
The Restaurant Group plc operates restaurants and pub restaurants in the United Kingdom. Its brands
include Frankie & Benny’s, Chiquito, Coast to Coast, Brunning & Price, Garfunkel’s, Firejacks,
Wagamama, and Joe’s Kitchen. The company also operates TRG concessions that provide table service,
counter service, sandwich shops, pubs, and bars. It operates approximately 650 restaurants and pub
restaurants.
8 Domino's Pizza Group plc LSE: DOM
Domino's Pizza Group plc owns, operates, and franchises Domino’s Pizza stores. The company operates
1,184 stores in the United Kingdom and the Republic of Ireland; and 56 stores in Switzerland, Germany,
Iceland, Norway, and Sweden.
9 El Pollo Loco Holdings, Inc. NasdaqGS: LOCO
El Pollo Loco Holdings, Inc., through its subsidiary El Pollo Loco, Inc., develops, franchises, licenses, and
operates quick-service restaurants under the El Pollo Loco name. It offers fire-grilling citrus-marinated
chicken in various entrees, including specialty chicken burritos, chicken quesadillas, chicken tostada
salads, and chicken tortilla soup.
10 Carrols Restaurant Group, Inc. NasdaqGS: TAST
Carrols Restaurant Group, Inc., through its subsidiaries, operates as a restaurant company in the United
States. The company operates as a Burger King franchisee. As of December 29, 2019, it had, as
franchisee, 1,036 Burger King restaurants located in 23 Northeastern, Midwestern, and Southeastern
states; and 65 Popeyes restaurants in seven Southeastern states.
11 Fiesta Restaurant Group, Inc. NasdaqGS: FRGI
Fiesta Restaurant Group, Inc., through its subsidiaries, owns, operates, and franchises fast-casual
restaurants. The company’s Pollo Tropical restaurants offer fire-grilled and citrus marinated chicken; and
Taco Cabana restaurants that provide Mexican inspired food made fresh by hand. As of December 29,
2019, it operated 142 Pollo Tropical restaurants in Florida; 164 company owned Taco Cabana
restaurants; and franchised 32 Pollo Tropical restaurants in Puerto Rico, Panama, Guyana, Bahamas,
Ecuador, and Florida, as well as franchised Taco Cabana restaurants 6 in New Mexico and 2 in Texas.
12 Shake Shack Inc. NYSE: SHAK
Shake Shack Inc. owns, operates, and licenses Shake Shack restaurants (Shacks) in the United States
and internationally. Its Shacks offers hamburgers, hot dogs, chicken, crinkle cut fries, shakes, frozen
custard, beer, wine, and other products. As of December 26, 2018, it operated 208 Shacks, including 124
domestic company-operated Shacks, 12 domestic licensed Shacks, and 72 international licensed
Shacks. Shake Shack Inc. was founded in 2004 and is headquartered in New York, New York.
Appendix 2: Comparable CompaniesPeer group by geographic location, industry classification and EBITDA between 50 and 200 GBP Mn
60
Source: Capital IQ

INDUSTRY
OVERVIEW
SWOT
ANALYSIS
PRE-COVID
VALUATION
POST-COVID
ANALYSIS
POST-COVID
VALUATIONAPPENDIX
Appendix 3: Precedent Transactions Precedent transactions by geographical location, industry classification, M&A closed date
Date Target Acquirer/InvestorValue
(USD Mn)
EBITDA
(USD Mn)
Enterprise Value
(USD Mn)EV/Revenue EV/EBITDA EV/EBIT
08/19/2019 Greene King plc CK Asset Holdings Limited 6,074.34 623.69 5,849.42 2.17 9.99 13.07
10/07/2019 Groupe Flo SA Bertrand Restauration SAS 8.93 18.39 271.37 1.41 14.50 -
08/06/2019 Groupe Flo SA Groupe Bertrand 11.11 16.73 264.81 1.38 16.09 -
07/18/2019 Ei Group plc Stonegate Pub Company Limited 3,925.80 359.63 3,730.97 4.14 10.56 11.38
06/11/2019 Fazer Food Services Oy Compass Group PLC 537.51 45.04 537.51 0.80 11.93 -
03/27/2019 AmRest Holdings SE Fcapital Dutch B.V. 348.48 197.96 3,891.29 2.24 20.00 42.80
01/23/2019 Redcomb Pubs Ltd Young & Co.'s Brewery, P.L.C. 44.43 5.23 44.43 2.04 8.50 -
11/22/2018 Kotipizza Group Oyj Orkla ASA 182.94 8.09 177.81 1.68 21.82 24.39
08/31/2018 Costa Limited The Coca-Cola Company 5,061.71 309.15 5,061.71 3.02 16.37 31.71
04/12/2018 Royal Ravintolat Oy NoHo Partners Oyj 110.85 8.62 110.85 0.85 12.86 25.00
02/28/2018 LE CROBAG GmbH & Co. KG and F.F.N. GmbH Autogrill Deutschland Gmbh 79.37 8.55 79.37 0.81 9.29 -
61
Source: Capital IQ

INDUSTRY
OVERVIEW
SWOT
ANALYSIS
PRE-COVID
VALUATION
POST-COVID
ANALYSIS
POST-COVID
VALUATIONAPPENDIX
Appendix 4: Bibliography
Afable, M. (2019, March 06). Health-Conscious Consumers and The Demand for Holistic Nutrition. Retrieved from https://www.boldbusiness.com/health/health-
conscious-consumers-demand-holistic-nutrition/
Askew, K. (2020, November 09). Brexit and COVID-19 raise threat of food fraud: 'The food industry is facing unprecedented challenges and an uncertain future'.
Retrieved from https://www.foodnavigator.com/Article/2020/11/09/Brexit-and-COVID-19-raise-threat-of-food-fraud-The-food-industry-is-facing-unprecedented-
challenges-and-an-uncertain-future
Attest. (2018, December 14). Consumer Trends & How to Entice Health-Conscious People to your Brand. Retrieved from
https://www.askattest.com/research/consumer-trends-how-to-entice-health-conscious-consumers
Chick, J. (2020, November 23). The Restaurant of the Future. Retrieved from https://www2.deloitte.com/us/en/pages/consumer-business/articles/restaurant-future-
survey-technology-customer-experience.html
Damodaran, A. (2020, July 01). Country Default Spreads and Risk Premiums. Retrieved from
http://pages.stern.nyu.edu/~adamodar/New_Home_Page/datafile/ctryprem.html
Euromonitor International (2020). Economies and Consumers Quarterly Data. Retrieved from
https://www.portal.euromonitor.com.remotexs.ntu.edu.sg/portal/StatisticsEvolution/index.
Euromonitor International (2020, April 3). Consumer Foodservice in the United Kingdom. Retrieved from
https://www.portal.euromonitor.com.remotexs.ntu.edu.sg/portal/Analysis/Tab.
Durisin, M. (2020, October 25). Brexit, Covid and Climate Colluding to Raise U.K. Food Prices. Retrieved from https://www.bloomberg.com/news/articles/2020-10-
25/brexit-covid-and-climate-colluding-to-raise-u-k-food-prices
EY. (2020, February). Practitioner’s guide to cost of capital & WACC calculation. Retrieved from https://www.eycom.ch/en/Publications/20200227-Practitioners-guide-to-
cost-of-capital-And-WACC-calculation/download
FAO. (2020, May 29). Food Price Monitoring and Analysis. Retrieved from http://www.fao.org/giews/food-prices/food-policies/detail/en/c/1278155/
FMCG. (2019, December 02). UK consumers demand ethical and sustainable foods, says new industry report. Retrieved from http://fmcgmagazine.co.uk/uk-
consumers-demand-ethical-and-sustainable-foods-says-new-industry-report/
Food Standards Agency. (April, 2019). The Food and You Survey (Vol. Wave 5). doi:
https://www.food.gov.uk/sites/default/files/media/document/foodandyou_wave5_trust-paper_v8-final_0.pdf
62

INDUSTRY
OVERVIEW
SWOT
ANALYSIS
PRE-COVID
VALUATION
POST-COVID
ANALYSIS
POST-COVID
VALUATIONAPPENDIX
Appendix 4: Bibliography
Food Standards Agency. (November, 2019). Public Attitudes Tracker (Vol. Wave 19). Government Statistical Service. doi:
https://www.food.gov.uk/sites/default/files/media/document/public-attitudes-tracker-wave-19-final-report_0.pdf
Gallagher, J. (2020, July 27). Coronavirus: How bad will winter really be? Retrieved from https://www.bbc.com/news/health-53515077
Gov.uk. (2020). Official UK Coronavirus Dashboard. Retrieved from https://coronavirus.data.gov.uk/details/cases
Gov.uk. (2020). Rates and allowances for Corporation Tax. Retrieved from https://www.gov.uk/government/publications/rates-and-allowances-corporation-
tax/rates-and-allowances-corporation-tax
Kelso, A. (2020, June 16). Restaurant industry expected to lose $240B by the end of 2020. Retrieved from https://www.restaurantdive.com/news/restaurant-
industry-expected-to-lose-240b-by-the-end-of-2020/579857/
Kelso, A. (2020, July 07).The COVID-19 Crisis Will Likely Lead to a Massive Shakeout in the Restaurant Industry. Retrieved from
https://www.forbes.com/sites/aliciakelso/2020/07/07/the-covid-19-crisis-will-likely-lead-to-a-massive-shakeout-in-the-restaurant-industry/?sh=312386c642a0 .
KPMG. (2019). Equity Market Risk Premium – Research Summary. Retrieved from https://assets.kpmg/content/dam/kpmg/nl/pdf/2019/advisory/equity-market-risk-
premium-research-summary-31032019.pdf.
KPMG. (2020). Equity Market Risk Premium – Research Summary. Retrieved from https://assets.kpmg/content/dam/kpmg/nl/pdf/2020/services/equitiy-market-risk-
premium-research-summary-march-2020.pdf
Kumar, N. (2003, December). Kill a Brand, Keep a Customer. Retrieved from https://hbr.org/2003/12/kill-a-brand-keep-a-customer.
Macrotrends. (2020). Wheat Prices - 40 Year Historical Chart. Retrieved from https://www.macrotrends.net/2534/wheat-prices-historical-chart-data
Marketline Advantage (2019). Foodservice in the United Kingdom. Retrieved from
http://advantage.marketline.com.remotexs.ntu.edu.sg/Analysis/ViewasPDF/united-kingdom-foodservice-91596.
Singh, S. (2019, September 10). The Soon To Be $200B Online Food Delivery Is Rapidly Changing. Retrieved from https://ww2.frost.com/frost-perspectives/the-
soon-to-be-200b-online-food-delivery-is-rapidly-changing-the-global-food-industry/
Smith, E. (2020, November 12). UK economy grew by record 15.5% in third quarter, but second lockdown could derail recovery. Retrieved from
https://www.cnbc.com/2020/11/12/uk-gdp-q3.html
63
INDUSTRY
OVERVIEW
SWOT
ANALYSIS
PRE-COVID
VALUATION
POST-COVID
ANALYSIS
POST-COVID
VALUATIONAPPENDIX
Appendix 4: Bibliography
64
Southey, F. (2020, December 09). Are we headed for Horsegate 2.0? COVID-19 escalates risk of meat fraud. Retrieved from
https://www.foodnavigator.com/Article/2020/12/09/Are-we-headed-for-Horsegate-2.0-COVID-19-escalates-risk-of-meat-fraud
Sozzi, B. (2020, May 14). Papa John's business is hot during the COVID-19 pandemic. Retrieved December 26, 2020, from
https://sg.finance.yahoo.com/news/papa-johns-business-is-hot-during-the-covid-19-pandemic-161939466.html
Statista. (2019, December). Average spending on ethical food and drink per household in the United Kingdom (UK) in 2016 and 2018. Retrieved from
https://www.statista.com/statistics/887904/ethical-food-and-drink-average-spend-in-the-uk/.
Statista. (2019, December). Sales revenue of organic food and drink in the United Kingdom from 1999 to 2018. Retrieved from
https://www.statista.com/statistics/282379/organic-food-and-drink-sales-in-the-united-kingdom-uk-since-1999/
Statista. (2020). Online Food Delivery. Retrieved from https://www.statista.com/outlook/374/156/online-food-delivery/united-kingdom
Statista. (2020, April). Percentage change in like-for-like sales of pub, bar and restaurant groups prior to the coronavirus (COVID-19) lockdown in Great Britain in
March 2020. Retrieved from https://www.statista.com/statistics/1105174/uk-pub-and-restaurant-sales-fall-due-to-covid-19/
Statista. (2020, May). Number of restaurants and mobile food service enterprises in the United Kingdom (UK) from 2008-2018. Retrieved from
https://www.statista.com/statistics/298871/number-of-restaurants-in-the-united-
kingdom/#:~:text=Number%20of%20restaurants%20and%20mobile%20food%20businesses%20in%20the%20UK%202008%2D2018&text=After%20a%20de
cline%20in%202009,service%20industry%20in%20the%20UK.
Statista. (2020, June). Origin distribution of foods consumed in the United Kingdom (UK) in 2019, by region. Retrieved from
https://www.statista.com/statistics/282580/origin-of-food-consumed-in-the-united-kingdom-uk-by-
region/#:~:text=This%20statistic%20shows%20the%20origin,originated%20in%20the%20European%20Union.
Statista. (2020, August). Penetration rate forecast for the Online Food Delivery market in the United Kingdom from 2017 to 2024. Retrieved from
https://www.statista.com/forecasts/891105/online-food-delivery-users-by-segment-in-the-united-
kingdom#:~:text=According%20to%20the%20Digital%20Market,Markets%20can%20be%20found%20here.
The 2016 Label Insight Transparency ROI Study. (2016). Driving Long-Term Trust and Loyalty Through Transparency. Retrieved from
https://www.labelinsight.com/hubfs/2016_Transparency_ROI_Study_Label_Insight.pdf.