Young Helium Diffusion Age of Zircons
77
Chapter 2 Young Helium Diffusion Age of Zircons Supports Accelerated Nuclear Decay D. Russell Hu mphreys, Ph.D. * Abstract. Experiments sponsored by RATE show that helium leakage deflates long half-life radioisotopic ages. In 1982 Robert Gentry found amazingly high retentions of nuclear-decay-generated helium (He) in microscopic zircons (ZrSiO 4 crystals) recovered from a borehole in hot Precambrian granitic rock at Fenton Hill, New Mexico. In 2001 RATE contracted with a high-precision laboratory to measure the rate of He diffusion out of the zircons. The measured rates resoundingly confirm a numerical prediction we made based on the report ed retentions and a young age. Combining rate s and retentions gives a He diffusion age of 6000± 2000 ( 1 σ) y ears. T his contrad icts the u niformita rian age of 1 .5 billion years based on nuc lear decay products in the same zi rcons. These data st rongly suppo rt our hypothesis of episodes of highly accelerated nuclear decay occurring within thousands of years ago. Such accelerations shrink the radioisotopic “billions of years” down to t he 6000 -y ear t imescale of the Bible. In section 13 I discuss, in the light of o ur dif fusion data, one of the problems for the accelerated decay hypothesis, disposal of excess radiogenic heat. Appendices A–C present details of our experimental data. Appendix D is an extensive answer to a crit ic of this work. This chapter c ombines and updates t hree publications presented at or i n: ( 1) the Fifth International Conference on Creationism in August 2003, (2) an American Geophysical Union annual meeting in December 2003, and (3) the Creation Research Society Quarterly in June 2004. When I say “we” below, I am referring to my co-authors for those papers. They are my three colleagues on the He diffusion project from the RATE steering committee: * Astrogeophysics Department, Institute for Cr eation Resear ch, Santee, California
Transcript of Young Helium Diffusion Age of Zircons
8/8/2019 Young Helium Diffusion Age of Zircons
http://slidepdf.com/reader/full/young-helium-diffusion-age-of-zircons 1/76
Chapter 2
Young Helium Diffusion Age of Zircons SupportsAccelerated Nuclear Decay
D. Russell Humphreys, Ph.D.*
Abstract. Experiments sponsored by RATE show that helium leakagedeflates long half-life radioisotopic ages. In 1982 Robert Gentry foundamazingly high retentions of nuclear-decay-generated helium (He) inmicroscopic zircons (ZrSiO
4crystals) recovered from a borehole in hot
Precambrian granitic rock at Fenton Hill, New Mexico. In 2001 RATEcontracted with a high-precision laboratory to measure the rate of Hediffusion out of the zircons. The measured rates resoundingly confirm a
numerical prediction we made based on the reported retentions and a youngage. Combining rates and retentions gives a He diffusion age of 6000±2000(1σ) years. This contradicts the uniformitarian age of 1.5 billion years basedon nuclear decay products in the same zircons. These data strongly supportour hypothesis of episodes of highly accelerated nuclear decay occurringwithin thousands of years ago. Such accelerations shrink the radioisotopic“billions of years” down to the 6000-year timescale of the Bible.In section 13 I discuss, in the light of our diffusion data, one of the problems
for the accelerated decay hypothesis, disposal of excess radiogenic heat.Appendices A–C present details of our experimental data. Appendix D isan extensive answer to a critic of this work.This chapter combines and updates three publications presented at or in: (1)the Fifth International Conference on Creationism in August 2003, (2) anAmerican Geophysical Union annual meeting in December 2003, and (3)the Creation Research Society Quarterly in June 2004. When I say “we”
below, I am referring to my co-authors for those papers. They are my threecolleagues on the He diffusion project from the RATE steering committee:
* Astrogeophysics Department, Institute for Creation Research, Santee, California
8/8/2019 Young Helium Diffusion Age of Zircons
http://slidepdf.com/reader/full/young-helium-diffusion-age-of-zircons 2/76
26 D. R. Humphreys
Steven A. Austin, John R. Baumgardner, and Andrew A. Snelling.
1. Introduction
A significant fraction of the earth’s radioactive elements, particularlyU and Th, appear to be in the granitic rock of the upper continentalcrust. In the granites, U and Th tend to be localized inside specialminerals such as zircon (zirconium silicate, ZrSiO
4). Zircon has
high hardness, high density, and high melting point, often forming
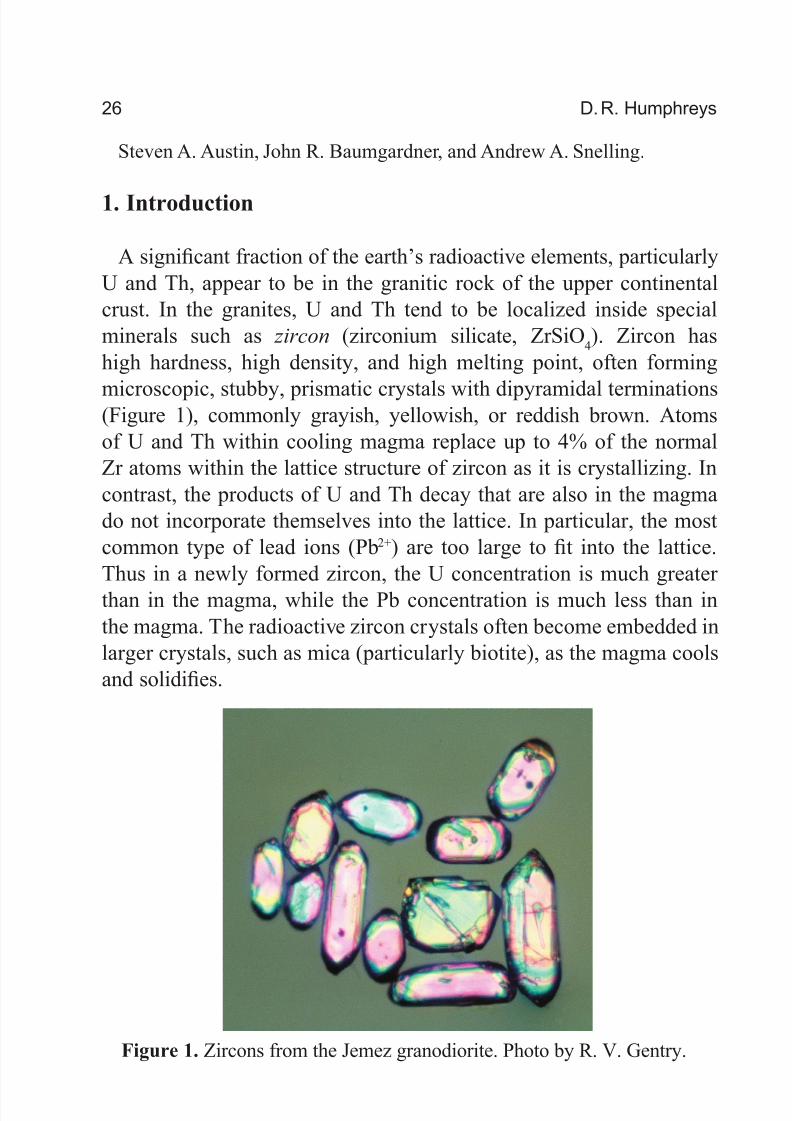
microscopic, stubby, prismatic crystals with dipyramidal terminations(Figure 1), commonly grayish, yellowish, or reddish brown. Atomsof U and Th within cooling magma replace up to 4% of the normalZr atoms within the lattice structure of zircon as it is crystallizing. Incontrast, the products of U and Th decay that are also in the magmado not incorporate themselves into the lattice. In particular, the mostcommon type of lead ions (Pb2+) are too large to fit into the lattice.Thus in a newly formed zircon, the U concentration is much greater than in the magma, while the Pb concentration is much less than inthe magma. The radioactive zircon crystals often become embedded inlarger crystals, such as mica (particularly biotite), as the magma coolsand solidifies.
Figure 1. Zircons from the Jemez granodiorite. Photo by R. V. Gentry.

8/8/2019 Young Helium Diffusion Age of Zircons
http://slidepdf.com/reader/full/young-helium-diffusion-age-of-zircons 3/76
Young Helium Diffusion Age of Zircons Supports Accelerated Nuclear Decay 27
As the U and Th nuclei in a zircon decay, they produce He (Figure 2).For example, 238U emits eight α-particles as it decays through variousintermediate elements to 206Pb. Each α-particle is a 4He nucleus,consisting of two protons and two neutrons. Each explosively expelled4He nucleus eventually comes to a stop, either within the zircon or inthe surrounding material. There it quickly gathers two electrons and becomes a neutral He atom.
Helium is a lightweight, fast-moving atom that does not form chemical bonds with other atoms. It can diffuse through solids relatively fast,
meaning that He atoms wiggle through the spaces between atoms ina crystal lattice and spread themselves out as far from one another as possible. For the same reason it can leak rapidly through tiny holesand cracks, making it ideal for leak detection in laboratory vacuumsystems. The diffusion and leakage rates are so great that believers inthe billions of years had expected most of the He produced during thealleged 4.5 billion years of the earth’s existence to have worked its wayout of the crust and into the earth’s atmosphere long ago. In this chapter we argue that, in this case and similar cases, the He has not had enoughtime (less than 8000 years) to escape from the zircons, much less thecrust.
238U
206Pb
N u c l e a r d e c a y i n z i r c o n
Eight helium atoms
Figure 2. Nuclear decay makes He within zircons.
8/8/2019 Young Helium Diffusion Age of Zircons
http://slidepdf.com/reader/full/young-helium-diffusion-age-of-zircons 4/76
28 D. R. Humphreys
2. The Helium is Still in the Zircons
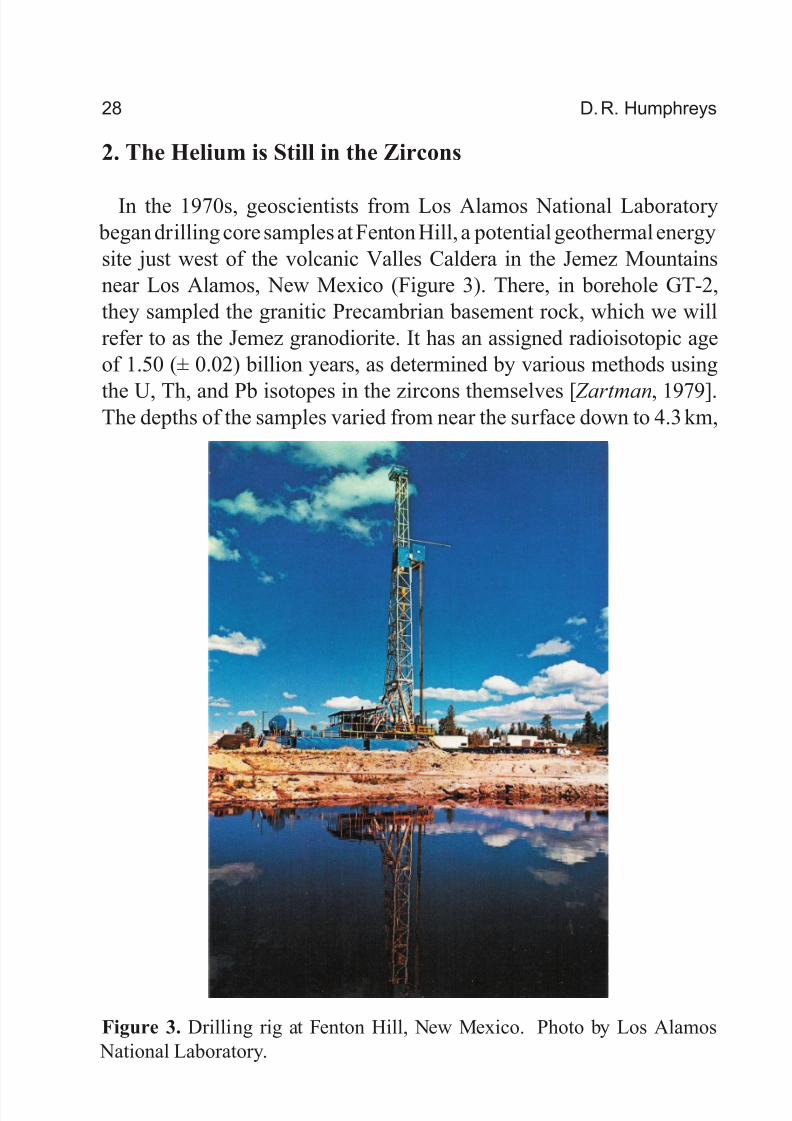
In the 1970s, geoscientists from Los Alamos National Laboratory began drilling core samples at Fenton Hill, a potential geothermal energysite just west of the volcanic Valles Caldera in the Jemez Mountainsnear Los Alamos, New Mexico (Figure 3). There, in borehole GT-2,they sampled the granitic Precambrian basement rock, which we willrefer to as the Jemez granodiorite. It has an assigned radioisotopic ageof 1.50 (± 0.02) billion years, as determined by various methods using
the U, Th, and Pb isotopes in the zircons themselves [ Zartman, 1979].The depths of the samples varied from near the surface down to 4.3 km,
Figure 3. Drilling rig at Fenton Hill, New Mexico. Photo by Los Alamos National Laboratory.
8/8/2019 Young Helium Diffusion Age of Zircons
http://slidepdf.com/reader/full/young-helium-diffusion-age-of-zircons 5/76
Young Helium Diffusion Age of Zircons Supports Accelerated Nuclear Decay 29
with in situ temperatures from 20°C to 313°C (measurement accuracyof ±1°C [ Laney and Laughlin, 1981, p. 502, Table 1]). The Los Alamos
team sent some of these core samples to Oak Ridge National Laboratoryfor isotopic analysis.
Most of the zircons were in biotite [Gentry, 1995], a black micacommon in granitic rock. At Oak Ridge, Robert Gentry, a creationist physicist, crushed the samples (without breaking the much harder zircon grains), extracted a high-density residue (because zirconshave a density of 4.7 g/cm3), and isolated the zircons by microscopic
examination, choosing crystals about 50–75 μm long. The zircon masseswere typically on the order of a microgram. The Oak Ridge team thenheated the zircons to 1000°C in a mass spectrometer and measured theamount of 4He liberated. In 1982 they published the data in Geophysical
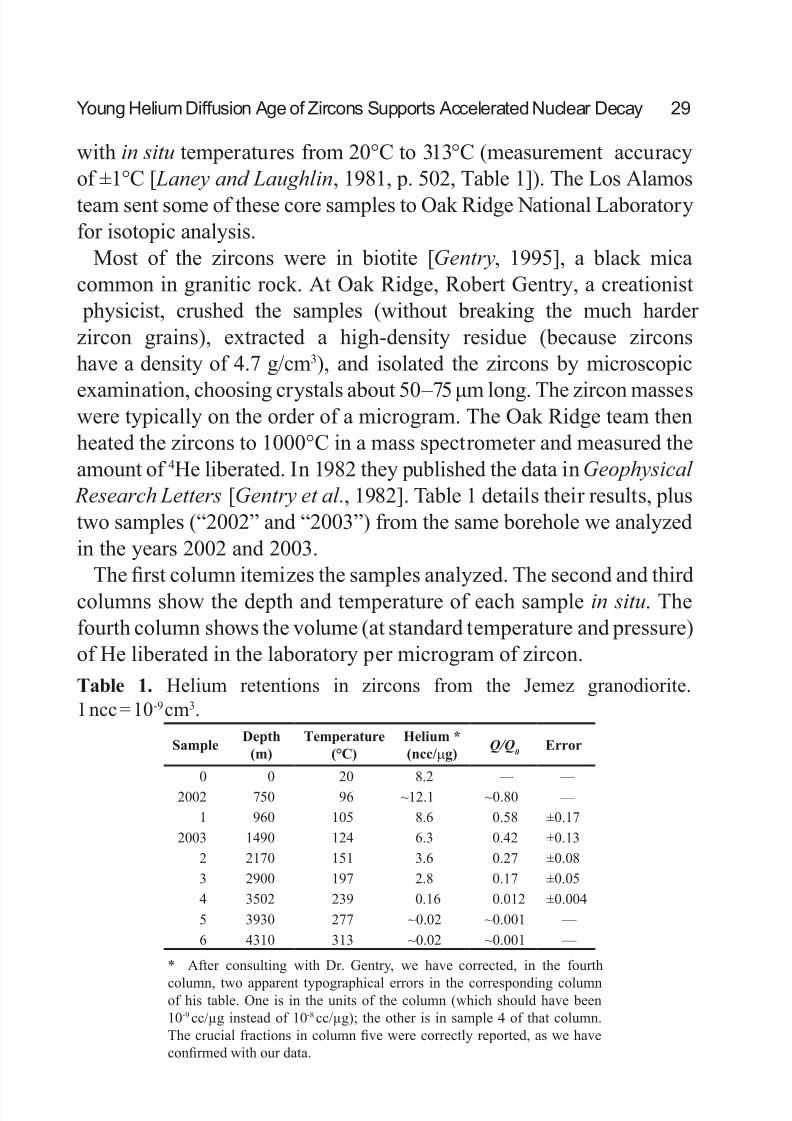
Research Letters [Gentry et al., 1982]. Table 1 details their results, plustwo samples (“2002” and “2003”) from the same borehole we analyzedin the years 2002 and 2003.
The first column itemizes the samples analyzed. The second and thirdcolumns show the depth and temperature of each sample in situ. Thefourth column shows the volume (at standard temperature and pressure)of He liberated in the laboratory per microgram of zircon.
SampleDepth
(m)
Temperature
(°C)
Helium *
(ncc/µg)Q/Q
0Error
0 0 20 8.2 — —
2002 750 96 ~12.1 ~0.80 —
1 960 105 8.6 0.58 ±0.17
2003 1490 124 6.3 0.42 ±0.13
2 2170 151 3.6 0.27 ±0.08
3 2900 197 2.8 0.17 ±0.05
4 3502 239 0.16 0.012 ±0.004
5 3930 277 ~0.02 ~0.001 —
6 4310 313 ~0.02 ~0.001 —
Table 1. Helium retentions in zircons from the Jemez granodiorite.1 ncc = 10-9cm3.
* After consulting with Dr. Gentry, we have corrected, in the fourth
column, two apparent typographical errors in the corresponding columnof his table. One is in the units of the column (which should have been10-9 cc/µg instead of 10-8 cc/µg); the other is in sample 4 of that column.The crucial fractions in column five were correctly reported, as we haveconfirmed with our data.
8/8/2019 Young Helium Diffusion Age of Zircons
http://slidepdf.com/reader/full/young-helium-diffusion-age-of-zircons 6/76
30 D. R. Humphreys
The fifth column is the ratio of the observed quantity of He Q (totalnumber of He atoms in the crystal) to the calculated quantity Q
0that
the zircons would have accumulated and retained if there had been nodiffusion. The Los Alamos team measured the amount of radiogenicPb in zircons 2.9 km deep in the same borehole and same granodiorite[ Zartman, 1979], and the Oak Ridge team confirmed those figures withtheir ion microprobe [Gentry, 1995]. Because the various decay chainsgenerate an average of 7.7 He atoms per Pb atom produced, Gentryand his colleagues were able to calculate Q
0from the amount of Pb
in the zircons. In doing so, they compensated for the estimated lossof α-particles emitted from near the edges of the zircons out into thesurrounding material.
The Oak Ridge team estimated that uncertainties in calculating Q0
might limit the accuracy of the ratio Q/Q0
to ±30%. This is by far thedominant error in the analyses throughout this chapter. We will (veryconservatively) regard it as a 1σ random error. Column 6 of the tableshows the resulting estimated errors in the ratios.
Samples 1 through 6 came from the granodiorite, but sample zerocame from larger zircons in a surface outcrop of an entirely differentrock unit. For that rock unit U/Th/Pb information was not available,making an estimate of Q
0not feasible. Lacking a ratio, we cannot use
sample zero in the calculations.Samples 2002 and 2003 came from the same borehole and same rock
unit as did samples 1 through 6, but we acquired the former as core
samples from Los Alamos National Laboratory only a few years ago.We sent them to Activation Laboratories in Ontario, Canada, wherethey extracted biotite and zircons. We did not select sizes of zirconsin sample 2002, nor measure their total mass accurately, but we did sofor sample 2003. The lengths of the latter were between 50 and 75µm,and the approximately 1200 selected crystals weighed a total of 216 µg.After extraction, we sent both zircon and biotite samples to our diffusionexperimenter (Section 5), where he measured the total quantity of Hecontained in each sample. We used Gentry’s estimate of Q
0to get
our estimate of the fraction retained in sample 2003 (see Section 10for details). We did the same for sample 2002, though we lacked an
8/8/2019 Young Helium Diffusion Age of Zircons
http://slidepdf.com/reader/full/young-helium-diffusion-age-of-zircons 7/76
Young Helium Diffusion Age of Zircons Supports Accelerated Nuclear Decay 31
accurate measurement of its total mass and so did not accurately knowthe He liberated per microgram.
Samples 5 and 6 had the same amount of He. Gentry and his colleaguesnoted that He emerged from those samples in shorter bursts than theother samples, indicating a different distribution of He within thosezircons. In Section 7, we will show that the amount of He from sample5 is just about what would be expected from the trend in the cooler samples. But we allow for the possibility of its error being considerablylarger than the cooler samples.
According to the thermal behavior outlined in the next section, wewould ordinarily expect that the hotter sample 6 would have muchless He than sample 5. The fact that the He content did not decreasesuggests that some additional effect may have occurred which limitedthe outflow of He from the zircon. In Section 7 we suggest a likelyexplanation.
The above considerations suggest that we can use samples 1 through5 in a theoretical analysis with ordinary diffusion. We will treat sample
6 as a special case.Samples 1 through 3 had He retentions of 58, 42, 27, and 17%. The
fact that these percentages are high confirms that a large amount of
nuclear decay did indeed occur in the zircons. Other evidence stronglysupports much nuclear decay having occurred in the past [ Humphreys,2000, pp. 335–337]. We emphasize this point because many creationistshave assumed that “old” radioisotopic ages are merely an artifact of
analysis, not really indicating the occurrence of large amounts of nuclear decay. But according to the measured amount of Pb physically present in the zircons, about 1.5 billion years worth—at today’s rates— of nuclear decay occurred. Supporting that, sample 1 still retains 58%of all the α-particles (the He) that would have been deposited in thezircon during this decay of U and Th to Pb.
It is the uniformitarian (see Endnote i) assumption of invariant decayrates that leads to the usual conclusion that this much decay required1.5 billion years. In this chapter we will include the assumption of billions of years of time in the uniformitarian model we construct for diffusion.

8/8/2019 Young Helium Diffusion Age of Zircons
http://slidepdf.com/reader/full/young-helium-diffusion-age-of-zircons 8/76
32 D. R. Humphreys
Notice that the retention levels decrease as the temperatures increase.That is consistent with ordinary diffusion: a high concentration of Hein the zircons diffusing outward into a much lower concentration in thesurrounding minerals, and diffusing faster in hotter rock. As the nextsection shows, diffusion rates increase strongly with temperature.
In later sections, we will show that these large retentions (see Endnoteii) are quite consistent with diffusion taking place over thousands of years, not billions of years.
3. How Diffusion Works
If the reader is not very familiar with diffusion and wants to knowmore, we recommend a very clear little book, Atomic Migration in
Crystals, written for non-experts [Girifalco, 1964]. Figure 4, adaptedfrom that book [Girifalco, 1964, p. 39, Figure 23], illustrates how anatom diffuses through a solid crystal lattice of other atoms. Figure 4ashows a He atom initially at position A, surrounded by a cell of lattice
Dist ance
E n e r g y
A B C
E
½ cell width
Helium
A B C
(a)
(b)
Figure 4. Helium atom moving through a crystal. Usually, lattice cations aresmaller than He atoms, but lattice anions are somewhat larger. Here for claritywe show all lattice ions as being small.
8/8/2019 Young Helium Diffusion Age of Zircons
http://slidepdf.com/reader/full/young-helium-diffusion-age-of-zircons 9/76
Young Helium Diffusion Age of Zircons Supports Accelerated Nuclear Decay 33
atoms. The lattice atoms repel the He atom, tending to confine it to thecenter of the cell, where the repulsion balances out in all directions.
Heat keeps the atoms of the lattice vibrating at its various resonantfrequencies. The vibrating atoms continually bump into the He atomfrom all sides. The higher the temperature, the more vigorous the bumping.
Every now and then, the lattice atoms will bump the He atom hardenough to push it into the “activated” position B, midway between cells.The lattice atoms must give the He enough kinetic energy to overcome
the repulsive potential energy barrier between the cells, which we haveshown in Figure 4b. This required amount of kinetic energy, E , is calledthe activation energy. If the lattice atoms have given any more energythan E to the He atom, it will not stop at position B. Instead, it willcontinue on to position C at the center of the adjacent cell. The He atomhas thus moved from one cell to the next.
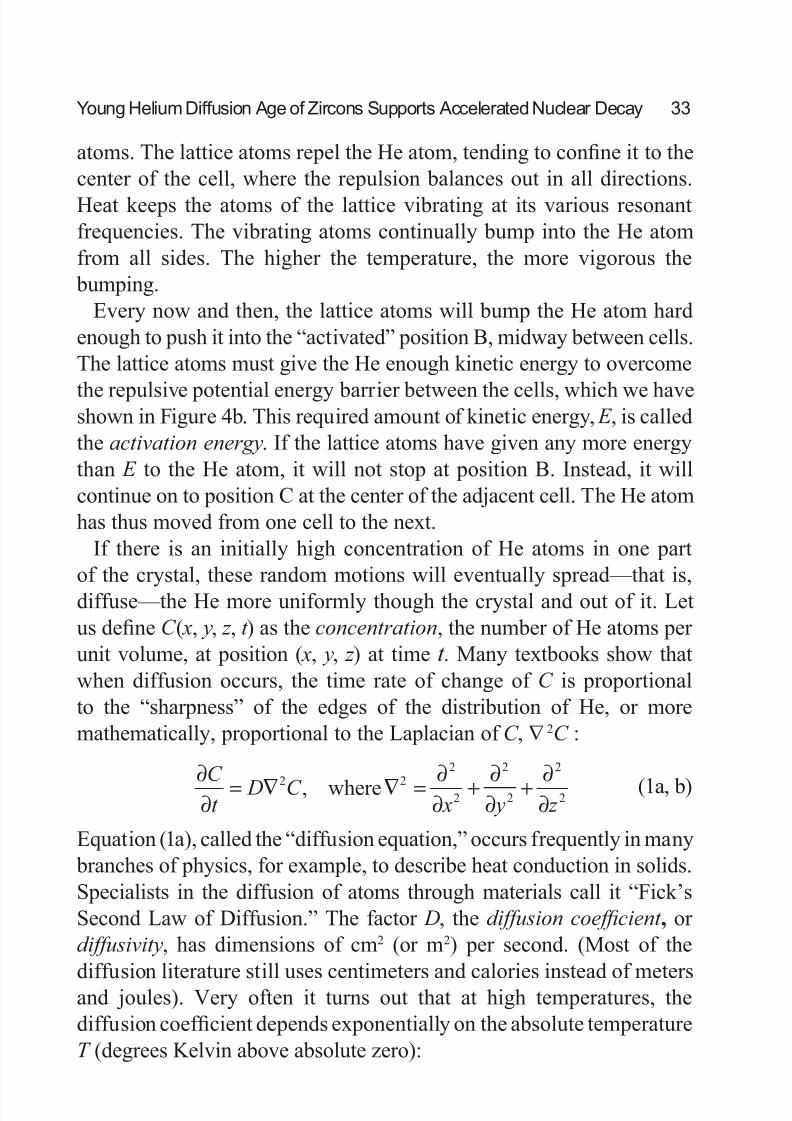
If there is an initially high concentration of He atoms in one partof the crystal, these random motions will eventually spread—that is,diffuse—the He more uniformly though the crystal and out of it. Letus define C ( x, y, z , t ) as the concentration, the number of He atoms per unit volume, at position ( x, y, z ) at time t . Many textbooks show thatwhen diffusion occurs, the time rate of change of C is proportionalto the “sharpness” of the edges of the distribution of He, or moremathematically, proportional to the Laplacian of C , ∇ 2C :
(1a, b)
Equation (1a), called the “diffusion equation,” occurs frequently in many branches of physics, for example, to describe heat conduction in solids.Specialists in the diffusion of atoms through materials call it “Fick’sSecond Law of Diffusion.” The factor D, the diffusion coefficient , or diffusivity, has dimensions of cm2 (or m2) per second. (Most of the
diffusion literature still uses centimeters and calories instead of metersand joules). Very often it turns out that at high temperatures, thediffusion coefficient depends exponentially on the absolute temperatureT (degrees Kelvin above absolute zero):
∂∂ = ∇ ∇ = ∂∂ + ∂∂ + ∂∂C
t D C
x y z 2 2
2
2
2
2
2
2, where
8/8/2019 Young Helium Diffusion Age of Zircons
http://slidepdf.com/reader/full/young-helium-diffusion-age-of-zircons 10/76
34 D. R. Humphreys
(2)
where R is the universal gas constant, 1.986 calories per mole-Kelvin(8.314 J/mol-K). The constant D
0is independent of temperature.
The “intrinsic” activation energy E 0
typically is between 10 and100 kcal/mol (about 40 and 400 kJ/mol). Section 11 discusses how thesequantities are related to the geoscience concept of closure temperature,and it shows why the concept is irrelevant to our conclusions.
If the crystal has defects, such as vacancies in the crystal lattice,impurities, dislocations, grain boundaries, or damage from radiation,then the diffusion coefficient equation will have a second term relatedto the defects:
(3)
The defect parameters ( D1
and E 1
) are almost always smaller than theintrinsic parameters ( D
0and E
0):
(4)
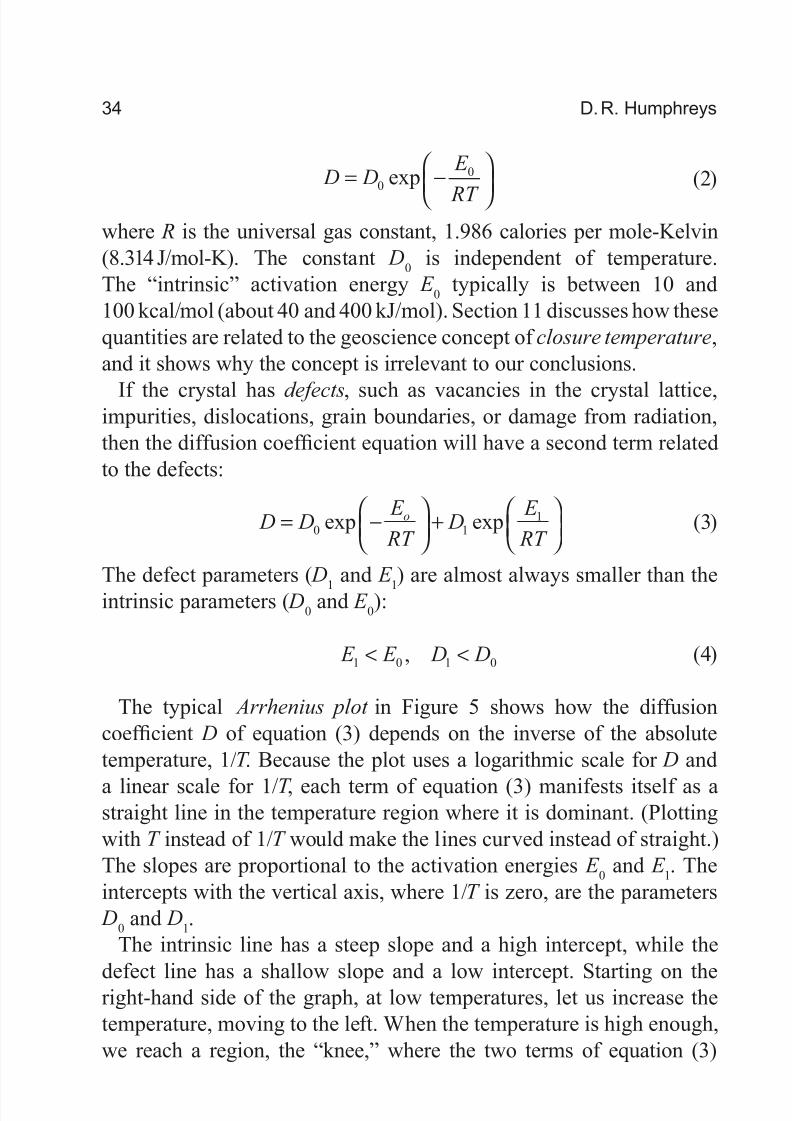
The typical Arrhenius plot in Figure 5 shows how the diffusioncoefficient D of equation (3) depends on the inverse of the absolutetemperature, 1/T . Because the plot uses a logarithmic scale for D and
a linear scale for 1/T , each term of equation (3) manifests itself as astraight line in the temperature region where it is dominant. (Plottingwith T instead of 1/T would make the lines curved instead of straight.)The slopes are proportional to the activation energies E
0and E
1. The
intercepts with the vertical axis, where 1/T is zero, are the parameters D
0and D
1.
The intrinsic line has a steep slope and a high intercept, while the
defect line has a shallow slope and a low intercept. Starting on theright-hand side of the graph, at low temperatures, let us increase thetemperature, moving to the left. When the temperature is high enough,we reach a region, the “knee,” where the two terms of equation (3)
D D E
RT
= −
0
0exp
D D E
RT D
E
RT
o= −
+
0 1
1exp exp
E E D D1 0 1 0< <,
8/8/2019 Young Helium Diffusion Age of Zircons
http://slidepdf.com/reader/full/young-helium-diffusion-age-of-zircons 11/76
Young Helium Diffusion Age of Zircons Supports Accelerated Nuclear Decay 35
are about equal. To the left of that region, at high temperatures, theintrinsic properties of the crystal dominate the diffusion. To the right of the knee, at lower temperatures, the defects dominate. Because defects
are very common in natural crystals, this two-slope character is typical[Girifalco, 1964, pp. 102, 126].
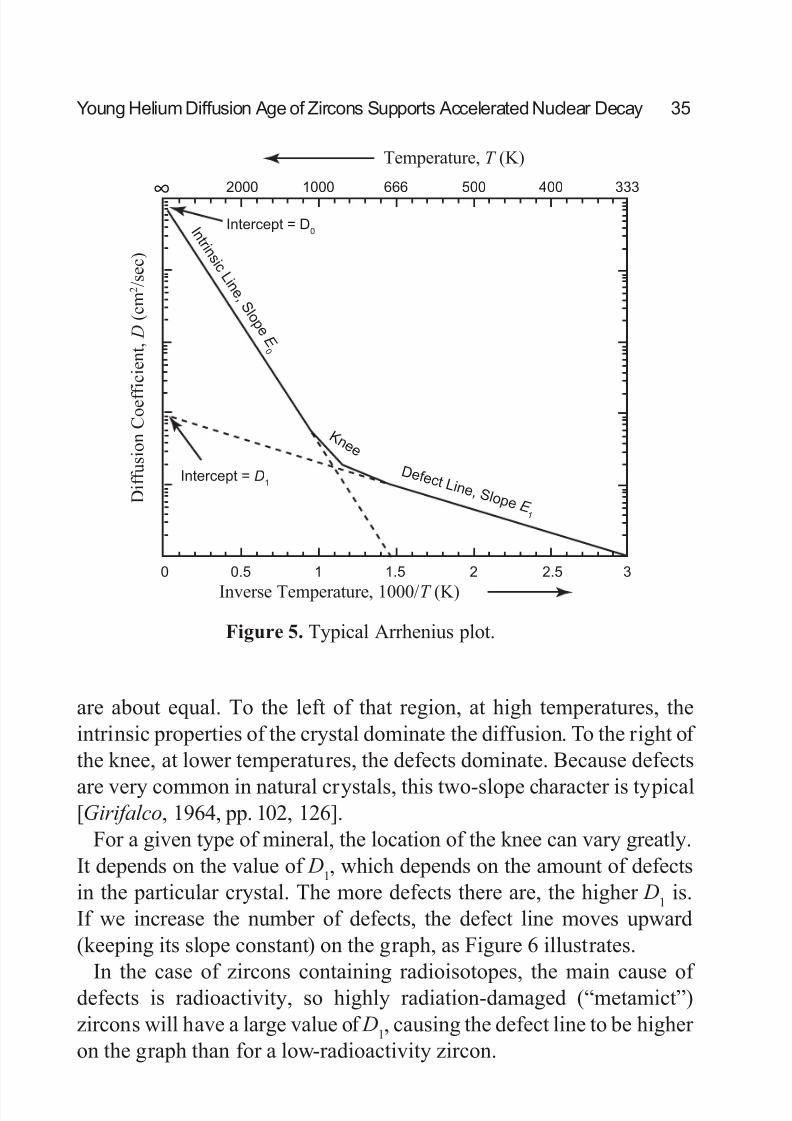
For a given type of mineral, the location of the knee can vary greatly.It depends on the value of D
1, which depends on the amount of defects
in the particular crystal. The more defects there are, the higher D1
is.If we increase the number of defects, the defect line moves upward(keeping its slope constant) on the graph, as Figure 6 illustrates.
In the case of zircons containing radioisotopes, the main cause of defects is radioactivity, so highly radiation-damaged (“metamict”)zircons will have a large value of D
1, causing the defect line to be higher
on the graph than for a low-radioactivity zircon.
Figure 5. Typical Arrhenius plot.
Intercept = D1
Intercept = D0I n
t r i n s i c L i n e , S
l o p e E 0
K n e e
D e f e c t Li n e , S l o p e E 1
2000 1000 666 500 400 333
∞
Temperature, T (K)
D i f f u s i o n C o e f f
i c i e n t , D ( c
m 2 / s e c )
0 0.5 1 1.5 2 2.5 3
Inverse Temperature, 1000/T (K)
8/8/2019 Young Helium Diffusion Age of Zircons
http://slidepdf.com/reader/full/young-helium-diffusion-age-of-zircons 12/76
36 D. R. Humphreys
4. I Misunderstood Early Zircon Data
At the beginning of our investigations in 1997, I did not properlyunderstand the only source of He-in-zircon data that was availablethen, and that influenced the course of the RATE research. Mymisunderstanding caused us: (a) to think that the main restriction onHe outflow from the zircon was not the zircon itself, but rather the biotite surrounding the zircon, and consequently (b) to commission our own experiments. The outcome proved to be very fortunate, becausewe acquired a much better understanding of the He diffusion in situ.
Here are more details.Our initial source of He-in-zircon diffusion data was a 1970 paper
by Sh. A. Magomedov, a researcher in Dagestan (then part of theSoviet Union). He published diffusion data for radiogenic Pb and He inhighly metamict (radiation-damaged) zircons from the Ural Mountains[Magomedov, 1970]. These were the only He-in-zircon diffusion datawe could find during an extensive literature search we did in 1999.
Magomedov was mainly interested in Pb diffusion, so he did not listhis He data explicitly in a table. Instead he showed them in a smallgraph, along with data for Pb diffusion and electrical conductivity, σ .His label for the ordinate was not clear to me: “ln( D,σ ).” In Western
F e w D e f e c t s D i f f u s i o n C o e f f i c i e n t ,
D
0 0.5 1 1.5 2 2.5 3
1000/T (K)
M a n y D e f e c t s
Figure 6. Increasing number of defects slides the defect line upward.
8/8/2019 Young Helium Diffusion Age of Zircons
http://slidepdf.com/reader/full/young-helium-diffusion-age-of-zircons 13/76
Young Helium Diffusion Age of Zircons Supports Accelerated Nuclear Decay 37
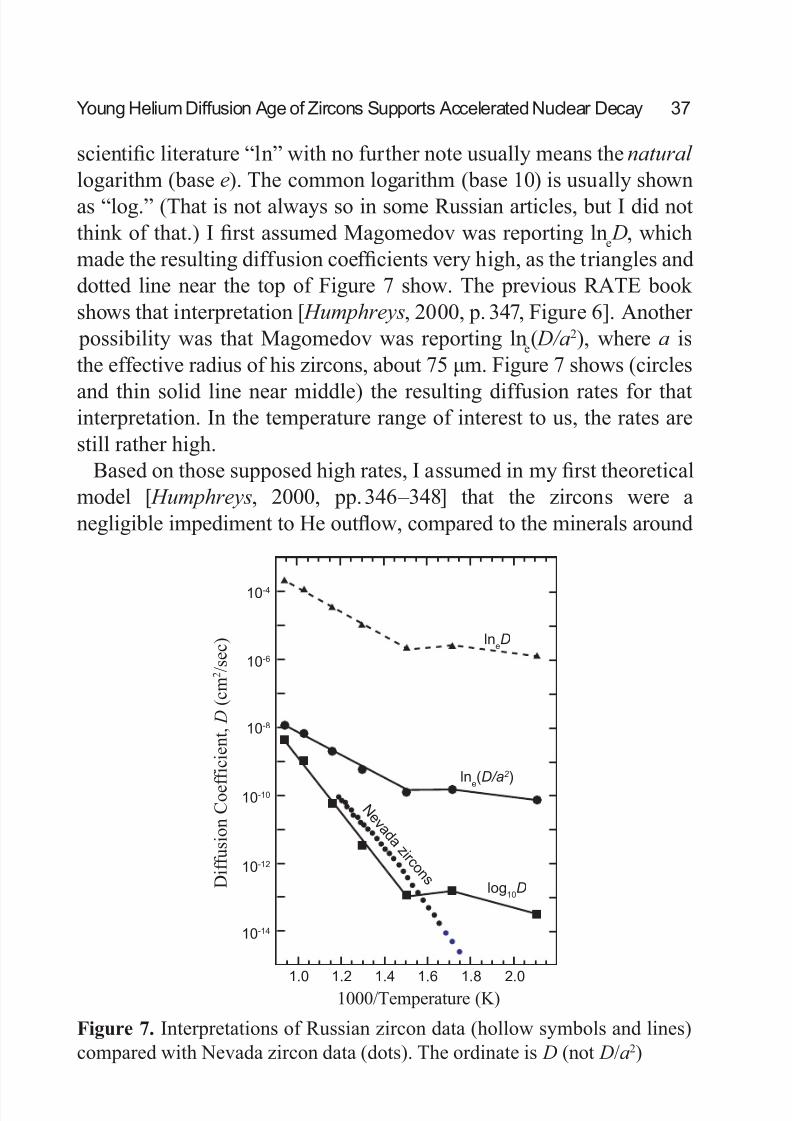
scientific literature “ln” with no further note usually means the natural logarithm (base e). The common logarithm (base 10) is usually shownas “log.” (That is not always so in some Russian articles, but I did notthink of that.) I first assumed Magomedov was reporting ln
e D, which
made the resulting diffusion coefficients very high, as the triangles anddotted line near the top of Figure 7 show. The previous RATE book shows that interpretation [ Humphreys, 2000, p. 347, Figure 6]. Another possibility was that Magomedov was reporting ln
e( D/a2), where a is
the effective radius of his zircons, about 75 μm. Figure 7 shows (circles
and thin solid line near middle) the resulting diffusion rates for thatinterpretation. In the temperature range of interest to us, the rates arestill rather high.
Based on those supposed high rates, I assumed in my first theoreticalmodel [ Humphreys, 2000, pp. 346–348] that the zircons were anegligible impediment to He outflow, compared to the minerals around
lneD
lne
(D/a2 )
log10D
N e v a d a z i r c o n s
1.0 1.2 1.4 1.6 1.8 2.0
10-14
10-12
10-10
10-8
10-6
10-4
D i f f u s i o n C o e f f i c i e n t , D ( c
m 2 / s e c )
1000/Temperature (K)
Figure 7. Interpretations of Russian zircon data (hollow symbols and lines)compared with Nevada zircon data (dots). The ordinate is D (not D/a2)
8/8/2019 Young Helium Diffusion Age of Zircons
http://slidepdf.com/reader/full/young-helium-diffusion-age-of-zircons 14/76
38 D. R. Humphreys
them, such as the biotite. That made the RATE project concentrate our first experiments on He diffusion not in zircon, but rather in biotite, for which we found no previous measurements in the literature.
But in 2001 we received a preprint of a paper [ Reiners et al., 2002]listing new He diffusion data in zircons from several sites in Nevada.Figure 7 shows some of that data (Fish Canyon Tuff sample FCT-1) as aline of solid dots. These data were many orders of magnitude lower thanour interpretation of Magomedov’s graph. The Russian data would agreewith the Nevada data if we re-interpret Magomedov’s label as meaning
“log10 D,” the common logarithm of D. Figure 7 shows that interpretationnear the bottom (squares and thick solid line). We attribute the smalldifference between the high-slope “intrinsic” parts of the Russian and Nevada data to differences in estimates of effective radius (Section 5).The nearly horizontal part of the Russian data is probably a “defect”line due to much radiation damage (see end of previous section). That part of the Russian data is about two orders of magnitude higher thandata from zircons in Nevada and New Mexico (compare D numbers at bottom of Figure 7 with those in Figures 8 and 13). It turns out that thelow-temperature “defect” part of the Russian data is about seven ordersof magnitude too high to support a uniformitarian interpretation.
The new data and my new interpretation of the old data imply thatzircon is a significant impediment to He diffusion, and that we cannotneglect it. In Section 7 of this chapter I report how we changed our theoretical model to account for that fact.
5. Pre-2003 Data for Jemez Granodiorite Minerals
The Nevada zircon data did not extend to low enough temperatures tocompare them with the He retentions. Moreover, they were not from the New Mexico site. Measurements of noble gas diffusion in a given typeof naturally occurring mineral often show significant differences from
site to site, caused by variations in composition and amounts of defects.For that reason it is important to get He diffusion data on zircon and biotite from the same rock unit (the Jemez granodiorite) that was thesource of Gentry’s samples. Accordingly, in 2001 the RATE project
8/8/2019 Young Helium Diffusion Age of Zircons
http://slidepdf.com/reader/full/young-helium-diffusion-age-of-zircons 15/76
Young Helium Diffusion Age of Zircons Supports Accelerated Nuclear Decay 39
commissioned such experimental studies.Through a small mining company, Zodiac Minerals and
Manufacturing, we contracted with a well-recognized expert on Hediffusion measurements in minerals, having many publications relatedto that field. As we wished, Zodiac did not tell him they were under contract to us, the goals of the project, or the sites of the samples. Wehave encouraged him to publish his measurements and offered to sendhim the geologic site information if he does so. Appendices B and Clist his data in detail.
We decided to get data on biotites and zircons from the same borehole,GT-2, from which Gentry’s zircons came. Los Alamos NationalLaboratory kindly gave us several GT-2 core samples from a depth of 750 m. That is somewhat shallower than Gentry’s samples, but still inthe same rock unit. We sent one of them to Activation Laboratories inOntario, Canada, where they extracted the biotite and zircons. Theydid not separate the zircons into size groups. They measured the U andPb isotopes in three of the zircons, getting a U-Pb concordia age of 1439±2 Ma (Appendix A). That is within a few percent of the publishedage for zircons deeper in the same borehole, 1500±20 Ma [ Zartman,1979]. We reserved the rest of the zircons, roughly 0.35 mg, for diffusionmeasurements.
Then we sent both the biotite and the zircons to our diffusionexperimenter. He sieved the biotite sample to get crystals between 75and 100 µm, but he used all the zircons that Activation Laboratories
had extracted, regardless of size. Size of crystals (effective radius) isimportant in converting the raw data into diffusivities. For a descriptionof a typical diffusion experimental apparatus, see an article in Analytical
Chemistry [ Farley et al., 1999]. Our experimenter sent us the raw datain 2002, which is the reason we call the sample “2002” in Table 1.
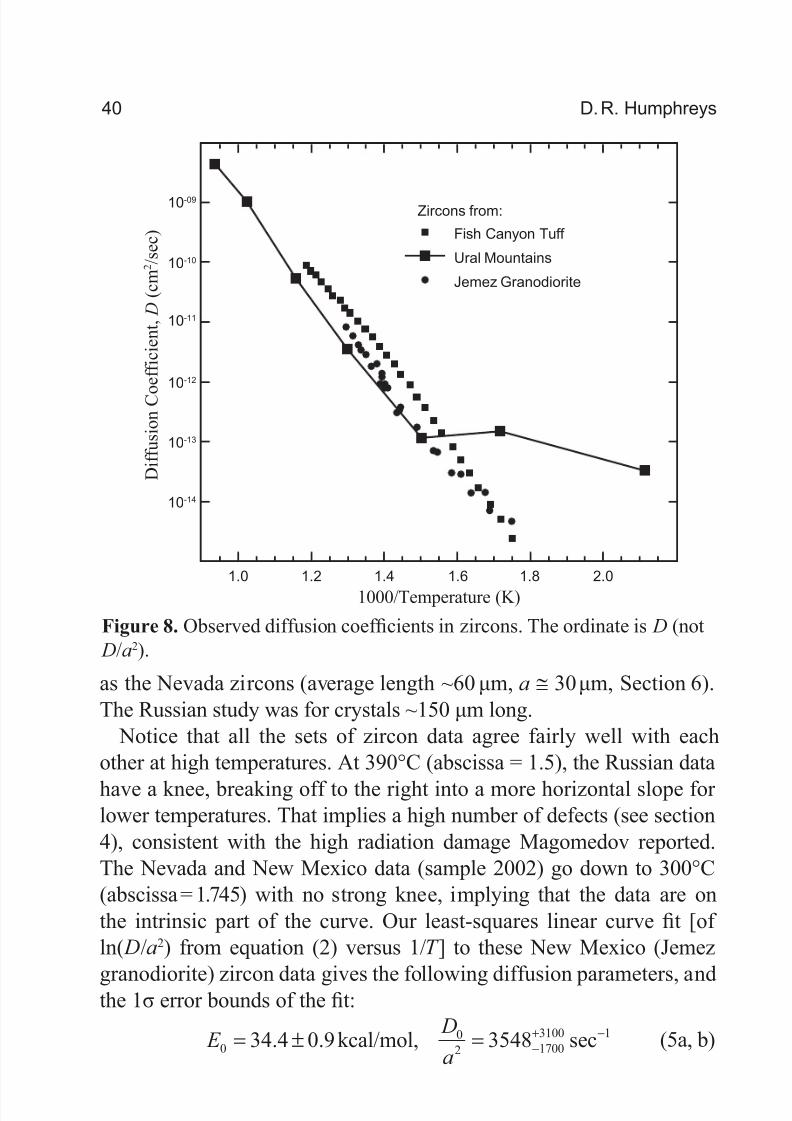
Figures 8 and 9 are Arrhenius plots of the data we had by early 2002for zircon and mica, respectively. The zircon data in Figure 8 are from
the Jemez granodiorite in New Mexico [from our experimenter, seeour Appendix C, Table C1], the Fish Canyon Tuff in Nevada [ Reiners
et al., 2002], and the Ural Mountains in Russia (re-interpreted fromMagomedov [1970]). We are assuming their average size was the same
8/8/2019 Young Helium Diffusion Age of Zircons
http://slidepdf.com/reader/full/young-helium-diffusion-age-of-zircons 16/76
40 D. R. Humphreys
as the Nevada zircons (average length ~60 μm, a ≅ 30 μm, Section 6).The Russian study was for crystals ~150 μm long.
Notice that all the sets of zircon data agree fairly well with eachother at high temperatures. At 390°C (abscissa = 1.5), the Russian data
have a knee, breaking off to the right into a more horizontal slope for lower temperatures. That implies a high number of defects (see section4), consistent with the high radiation damage Magomedov reported.The Nevada and New Mexico data (sample 2002) go down to 300°C(abscissa = 1.745) with no strong knee, implying that the data are onthe intrinsic part of the curve. Our least-squares linear curve fit [of ln( D/a2) from equation (2) versus 1/T ] to these New Mexico (Jemez
granodiorite) zircon data gives the following diffusion parameters, andthe 1σ error bounds of the fit:
(5a, b)
Figure 8. Observed diffusion coefficients in zircons. The ordinate is D (not D/a2).
Fish Canyon Tuff
Ural Mountains
Jemez Granodiorite
10-09
10-10
10-11
10-12
10-13
10-14
1.0 1.2 1.4 1.6 1.8 2.0
1000/Temperature (K)
D i f f u s i o n C o
e f f i c i e n t , D ( c
m 2 / s e c )
Zircons from:
E D
a0
02 1700
3100 134 4 0 9 3548= ± = −+ −. . , seckcal/mol
8/8/2019 Young Helium Diffusion Age of Zircons
http://slidepdf.com/reader/full/young-helium-diffusion-age-of-zircons 17/76
Young Helium Diffusion Age of Zircons Supports Accelerated Nuclear Decay 41
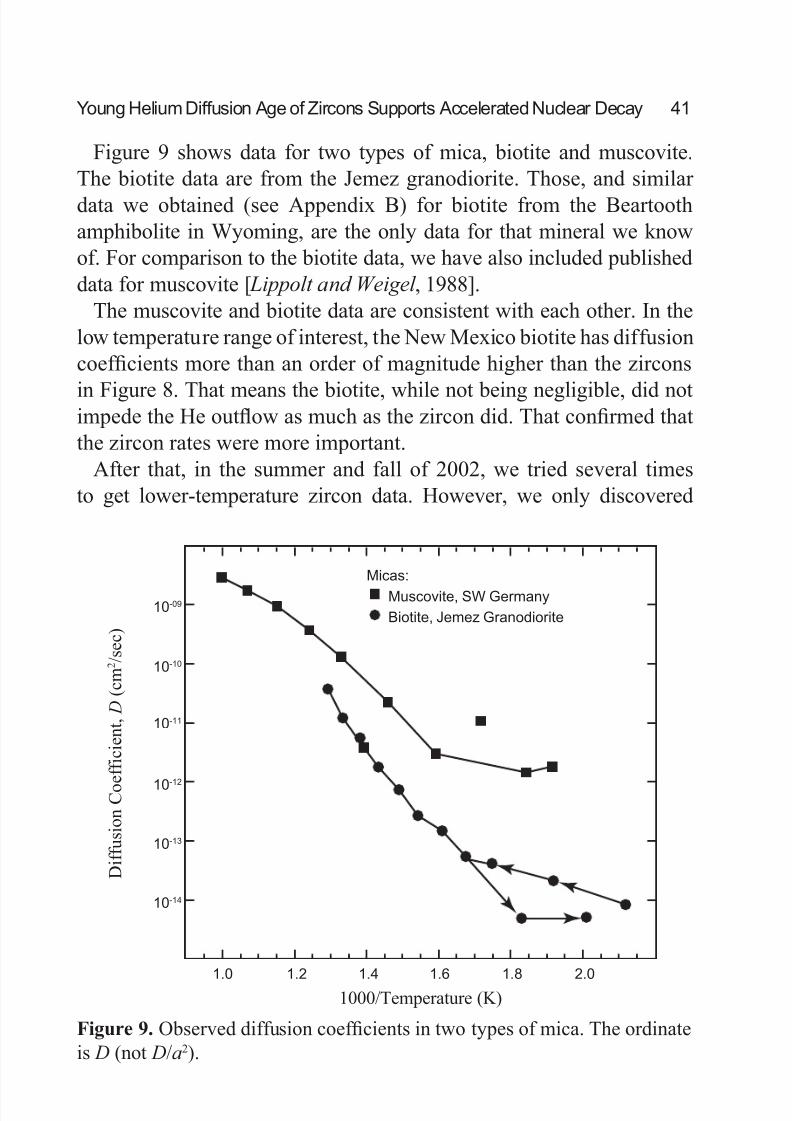
Figure 9 shows data for two types of mica, biotite and muscovite.The biotite data are from the Jemez granodiorite. Those, and similar
data we obtained (see Appendix B) for biotite from the Beartoothamphibolite in Wyoming, are the only data for that mineral we knowof. For comparison to the biotite data, we have also included publisheddata for muscovite [ Lippolt and Weigel , 1988].
The muscovite and biotite data are consistent with each other. In thelow temperature range of interest, the New Mexico biotite has diffusioncoefficients more than an order of magnitude higher than the zircons
in Figure 8. That means the biotite, while not being negligible, did notimpede the He outflow as much as the zircon did. That confirmed thatthe zircon rates were more important.
After that, in the summer and fall of 2002, we tried several timesto get lower-temperature zircon data. However, we only discovered
10-09
10-10
10-11
10-12
10-13
10-14
1.0 1.2 1.4 1.6 1.8 2.0
1000/Temperature (K)
D i f f u s i o n C o e f f i c i e n t , D ( c
m 2 / s e c )
Muscovite, SW Germany
Biotite, Jemez Granodiorite
Micas:
Figure 9. Observed diffusion coefficients in two types of mica. The ordinateis D (not D/a2).

8/8/2019 Young Helium Diffusion Age of Zircons
http://slidepdf.com/reader/full/young-helium-diffusion-age-of-zircons 18/76
42 D. R. Humphreys
several wrong ways to make such measurements. First, we asked theexperimenter to do new runs on the same batch of zircons, but at lower temperatures. The results were ambiguous, an effect we decided wasdue to exhaustion of He from the smaller zircons in the batch, therebyincreasing the effective radius of the remaining part of the batch[ Fechtig and Kalbitzer , 1966, section 2.5, p. 72].
Second, we sent the experimenter a new set of zircons fromthe same depth in GT-2 and asked him to sieve out crystals in the50–75 µm size range. Before sieving, he decided to leach the crystals
in cold concentrated hydrofluoric acid (HF) to remove flecks of biotiteclinging to them. Though the technique was new for zircons, it seemedreasonable. However, the values of D/a2 he then obtained were over fifty times higher than all previous zircon data, both ours and data published by others. Scanning electron microscope images (Figure 10)revealed severe pitting and cracking in the HF-treated zircons. Thatwould allow He to leave the zircons much faster than normally.
These were all the data we had by February 2003, the deadline for thefinal version of our conference paper [ Humphreys et al., 2003a].
Figure 10. Scanning electron microscope photo of a zircon leached in HF.Compare to an untreated zircon in Figure 11. Note 30-µm scale at lower right.Photo by Mark H. Armitage.
8/8/2019 Young Helium Diffusion Age of Zircons
http://slidepdf.com/reader/full/young-helium-diffusion-age-of-zircons 19/76
Young Helium Diffusion Age of Zircons Supports Accelerated Nuclear Decay 43
6. More Recent Data
In the fall of 2002, we acquired new samples from borehole GT-2, thistime from a depth of 1490 m. That is between the depths of Gentry’ssamples 1 and 2 (see Table 1). We sent them to Activation Laboratories,where they extracted both biotites and zircons. This time they sortedthe zircons into several size groups, getting about 1200 crystals in thesize range Gentry used, having lengths of 50–75 µm.
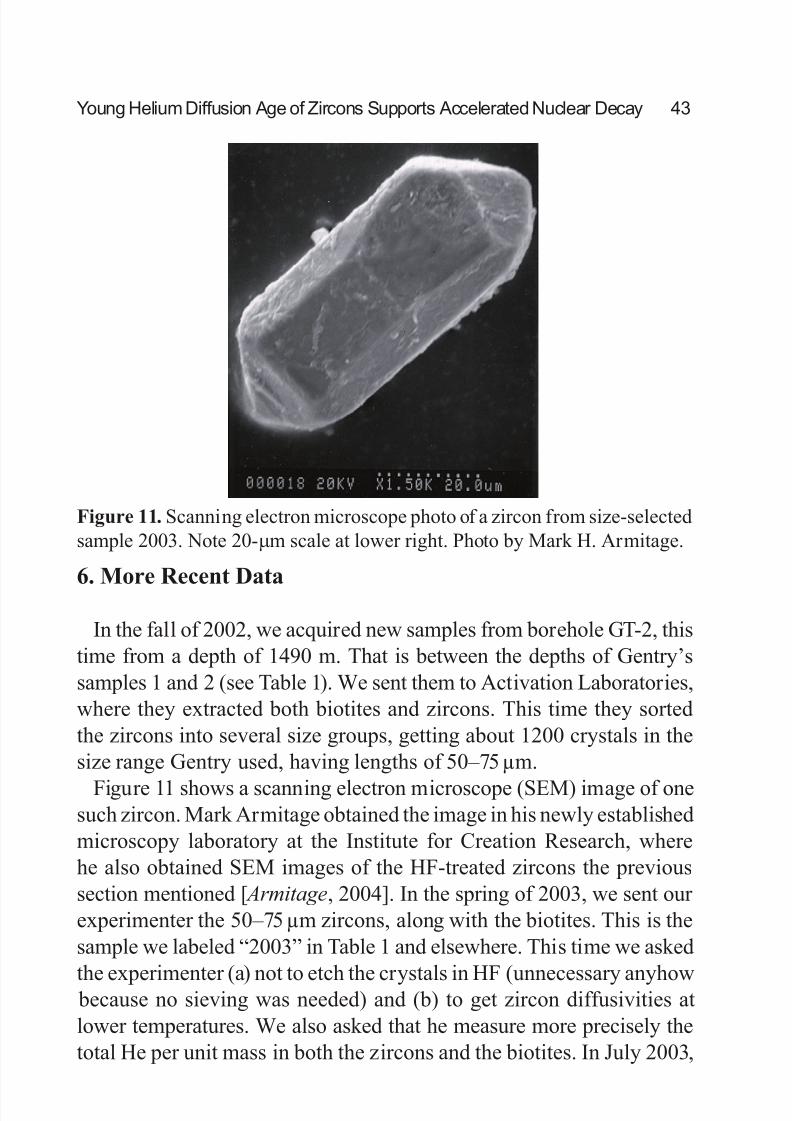
Figure 11 shows a scanning electron microscope (SEM) image of onesuch zircon. Mark Armitage obtained the image in his newly establishedmicroscopy laboratory at the Institute for Creation Research, wherehe also obtained SEM images of the HF-treated zircons the previoussection mentioned [ Armitage, 2004]. In the spring of 2003, we sent our experimenter the 50–75 µm zircons, along with the biotites. This is thesample we labeled “2003” in Table 1 and elsewhere. This time we asked
the experimenter (a) not to etch the crystals in HF (unnecessary anyhow because no sieving was needed) and (b) to get zircon diffusivities atlower temperatures. We also asked that he measure more precisely thetotal He per unit mass in both the zircons and the biotites. In July 2003,
Figure 11. Scanning electron microscope photo of a zircon from size-selectedsample 2003. Note 20-µm scale at lower right. Photo by Mark H. Armitage.

8/8/2019 Young Helium Diffusion Age of Zircons
http://slidepdf.com/reader/full/young-helium-diffusion-age-of-zircons 20/76
44 D. R. Humphreys
one month before the conference, we received his results.As usual, the experimenter measured the rate of He release at various
steps of temperature. Then he put that data into standard formulas tocalculate D/a2, where D is the diffusivity and a is the effective radius of the crystals. The formulas [ Fechtig and Kalbitzer , 1966, p. 71, equations(5a, b, c), with R → a] use the fraction (of the total yield) emitted in agiven step, the fraction emitted in the previous step, and the duration of the step. The result gives the ratio D/a2 during that step directly, withoutthe experimenter having to know a specifically. Column 6 of Table 2
shows the resulting values of D/a2 for the zircons. The experimenter did not report error bounds for D/a2, but elsewhere he reports:
In actual practice, we obtain He ages that reproduce to within 6% (2σ),
demonstrating some natural variability within grain populations [ Farley,2002, p. 833].
The accuracy of such (U-Th)/He ages also reflects the accuracy of the D/a2 measurement.
The standard formulas assume that the initial distribution of He in thezircons is uniform. But in reality, the zircons would have a “rounded”He-versus-radius profile due to the in situ He loss into the biotite. Thatis, less He would emerge during the initial heating steps than otherwise, because the outer regions of the zircon would be He-depleted. In thatcase, said the devisers of the standard formulas [ Fechtig and Kalbitzer ,1966, p. 71],
The apparent diffusion constants will come out too low, and the activation
energies too high.Also see a similar conclusion by Reiners et al., [2004].
In his report on the 2002 zircon runs (Appendix C), our experimenter advised us that to account for this effect, we should ignore the firstset of increasing-temperature steps in his runs. For the 2003 zircons,he reported that we should treat them just the same. Accordingly, weignored steps 1–9 in calculating D. A more sophisticated analysis could
probably extract accurate values of D from the raw He-time data for those steps, but we leave that work for later research.Diffusion researchers conventionally assume the effective radius a
for zircons to be half their length (see next section), which in this case
8/8/2019 Young Helium Diffusion Age of Zircons
http://slidepdf.com/reader/full/young-helium-diffusion-age-of-zircons 21/76
Young Helium Diffusion Age of Zircons Supports Accelerated Nuclear Decay 45
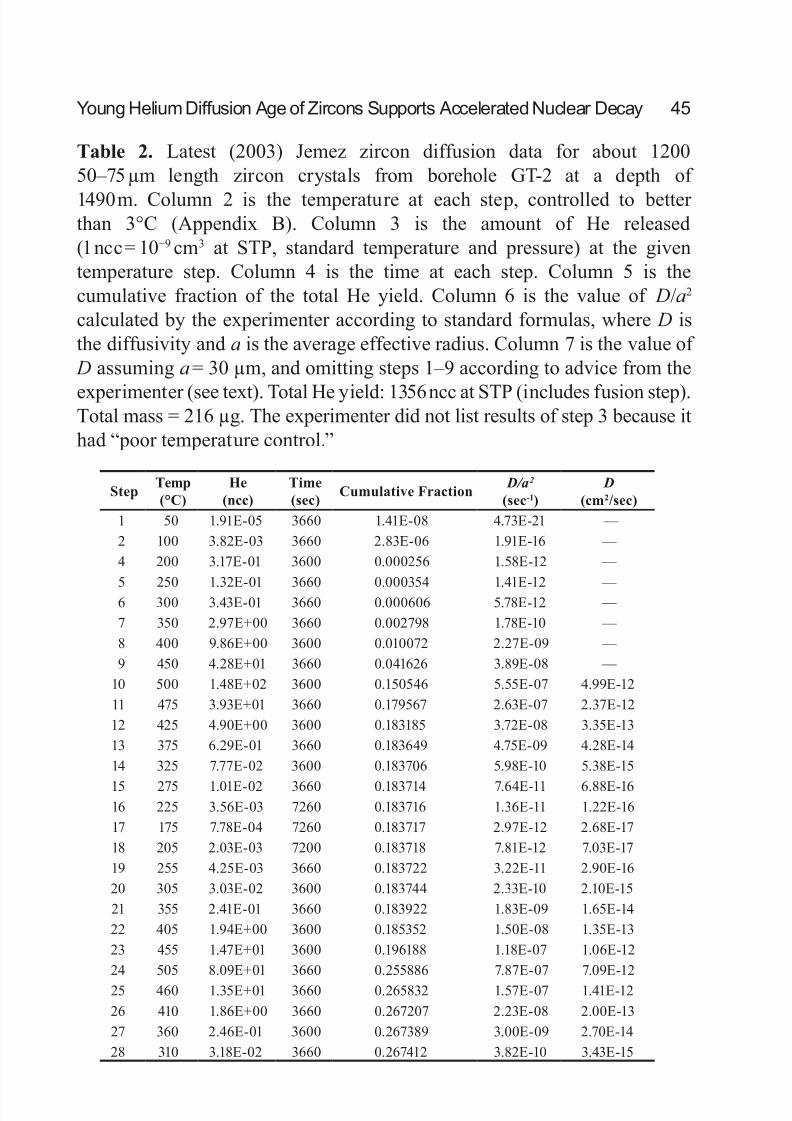
Table 2. Latest (2003) Jemez zircon diffusion data for about 120050–75 µm length zircon crystals from borehole GT-2 at a depth of
1490 m. Column 2 is the temperature at each step, controlled to better than 3°C (Appendix B). Column 3 is the amount of He released(1 ncc = 10−9 cm3 at STP, standard temperature and pressure) at the giventemperature step. Column 4 is the time at each step. Column 5 is thecumulative fraction of the total He yield. Column 6 is the value of D/a2 calculated by the experimenter according to standard formulas, where D isthe diffusivity and a is the average effective radius. Column 7 is the value of
D assuming a= 30 µm, and omitting steps 1–9 according to advice from the
experimenter (see text). Total He yield: 1356 ncc at STP (includes fusion step).Total mass = 216 µg. The experimenter did not list results of step 3 because ithad “poor temperature control.”
StepTemp
(°C)
He
(ncc)
Time
(sec)Cumulative Fraction
D/a2
(sec-1)
D
(cm2/sec)
1 50 1.91E-05 3660 1.41E-08 4.73E-21 —
2 100 3.82E-03 3660 2.83E-06 1.91E-16 —
4 200 3.17E-01 3600 0.000256 1.58E-12 —
5 250 1.32E-01 3660 0.000354 1.41E-12 — 6 300 3.43E-01 3660 0.000606 5.78E-12 —
7 350 2.97E+00 3660 0.002798 1.78E-10 —
8 400 9.86E+00 3600 0.010072 2.27E-09 —
9 450 4.28E+01 3660 0.041626 3.89E-08 —
10 500 1.48E+02 3600 0.150546 5.55E-07 4.99E-12
11 475 3.93E+01 3660 0.179567 2.63E-07 2.37E-12
12 425 4.90E+00 3600 0.183185 3.72E-08 3.35E-13
13 375 6.29E-01 3660 0.183649 4.75E-09 4.28E-14
14 325 7.77E-02 3600 0.183706 5.98E-10 5.38E-15
15 275 1.01E-02 3660 0.183714 7.64E-11 6.88E-1616 225 3.56E-03 7260 0.183716 1.36E-11 1.22E-16
17 175 7.78E-04 7260 0.183717 2.97E-12 2.68E-17
18 205 2.03E-03 7200 0.183718 7.81E-12 7.03E-17
19 255 4.25E-03 3660 0.183722 3.22E-11 2.90E-16
20 305 3.03E-02 3600 0.183744 2.33E-10 2.10E-15
21 355 2.41E-01 3660 0.183922 1.83E-09 1.65E-14
22 405 1.94E+00 3600 0.185352 1.50E-08 1.35E-13
23 455 1.47E+01 3600 0.196188 1.18E-07 1.06E-12
24 505 8.09E+01 3660 0.255886 7.87E-07 7.09E-12
25 460 1.35E+01 3660 0.265832 1.57E-07 1.41E-12
26 410 1.86E+00 3660 0.267207 2.23E-08 2.00E-13
27 360 2.46E-01 3600 0.267389 3.00E-09 2.70E-14
28 310 3.18E-02 3660 0.267412 3.82E-10 3.43E-15

8/8/2019 Young Helium Diffusion Age of Zircons
http://slidepdf.com/reader/full/young-helium-diffusion-age-of-zircons 22/76
46 D. R. Humphreys
gives us an average value for a of about 30 µm. Multiplying column 6 bythe resulting value of a2 gives us values of the diffusivity D for points10–28, which we show in column 7 of Table 2. I estimate that the 1σerror in D is less than ±30% (see Endnote iii).
7. A New Creation Model
We need a theoretical framework in which we can interpret thediffusion data of the previous section. As we mentioned at the end of
section 4, in our first Creation model we wrongly assumed that thezircons were a negligible impediment to the He diffusion. In this sectionwe construct a new Creation model.
As before, the Creation model starts with a brief burst of acceleratednuclear decay generating a high concentration C
0of He uniformly
throughout the zircon (like the distribution of U and Th atoms), butnot in the surrounding biotite. After that the He diffuses out of thezircon into the biotite for a time t . As in our previous model, we chose
t = 6000 years. The time is short enough that the additional amount of He generated by normal nuclear decay would be small compared tothe initial amount. We assume the temperatures to have been constantat today’s values. We will show in Section 8 that this assumption isgenerous to uniformitarians.
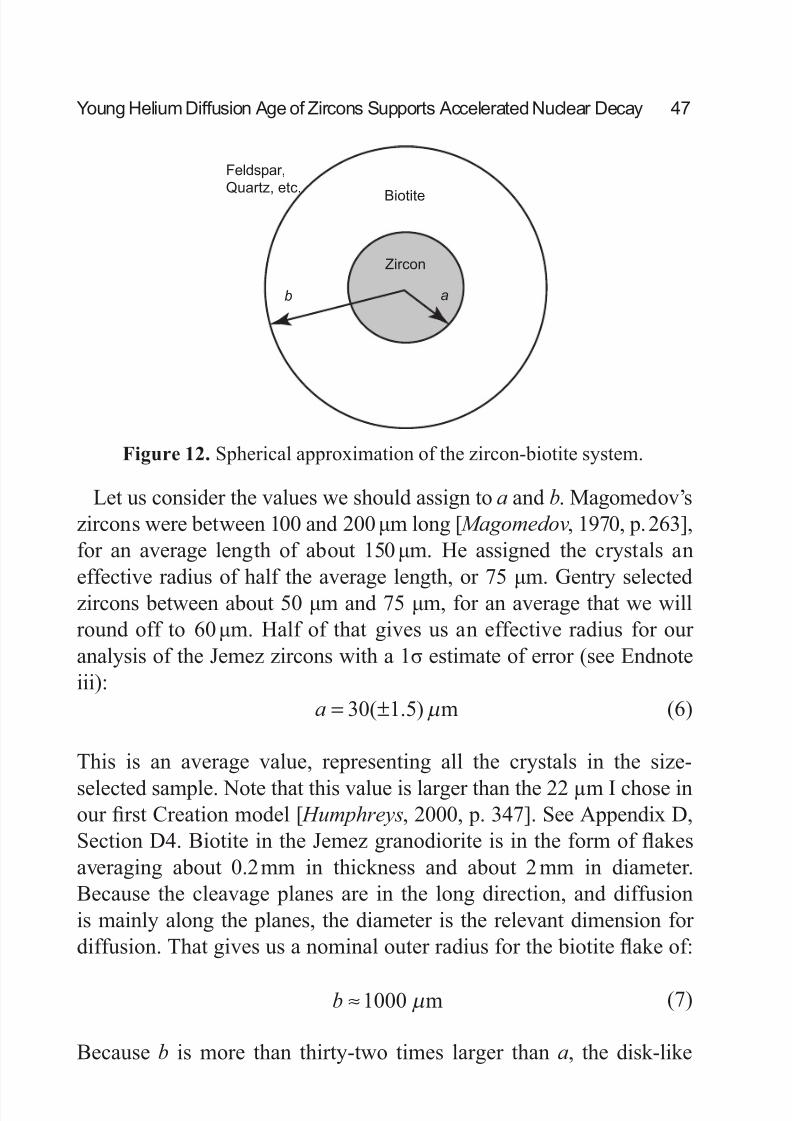
Because the biotite diffusion coefficients are not too different fromthe zircon coefficients, we should have a model accounting for twomaterials. Diffusion in zircon is, as far as anyone knows, approximatelyisotropic, with He flowing essentially at the same rate in all threedirections. Diffusion in biotite is not isotropic, because most of the Heflows two-dimensionally along the cleavage planes of the mica. Butaccounting for anisotropy in the biotite would be quite difficult, so weleave that refinement to the next generation of analysts. (See AppendixD, Section D4 for estimate of size of the error involved in assumingisotropy in biotite.) To keep the mathematics tractable, we will assume
spherical symmetry, with a sphere of zircon of effective radius a insidea spherical shell of material having an outer radius b, as Figure 12shows. Then the concentration C will depend only on time and thedistance r from the center.
8/8/2019 Young Helium Diffusion Age of Zircons
http://slidepdf.com/reader/full/young-helium-diffusion-age-of-zircons 23/76
Young Helium Diffusion Age of Zircons Supports Accelerated Nuclear Decay 47
Let us consider the values we should assign to a and b. Magomedov’szircons were between 100 and 200 μm long [Magomedov, 1970, p. 263],for an average length of about 150 μm. He assigned the crystals aneffective radius of half the average length, or 75 μm. Gentry selectedzircons between about 50 μm and 75 μm, for an average that we willround off to 60 μm. Half of that gives us an effective radius for our analysis of the Jemez zircons with a 1σ estimate of error (see Endnoteiii):
(6)
This is an average value, representing all the crystals in the size-
selected sample. Note that this value is larger than the 22 µm I chose inour first Creation model [ Humphreys, 2000, p. 347]. See Appendix D,Section D4. Biotite in the Jemez granodiorite is in the form of flakesaveraging about 0.2 mm in thickness and about 2 mm in diameter.Because the cleavage planes are in the long direction, and diffusionis mainly along the planes, the diameter is the relevant dimension for diffusion. That gives us a nominal outer radius for the biotite flake of:
(7)
Because b is more than thirty-two times larger than a, the disk-like
Zircon
a
Biotite
b
Feldspar,
Quartz, etc.
Figure 12. Spherical approximation of the zircon-biotite system.
a = ±30 1 5( . ) µ m
b ≈1000 µ m
8/8/2019 Young Helium Diffusion Age of Zircons
http://slidepdf.com/reader/full/young-helium-diffusion-age-of-zircons 24/76
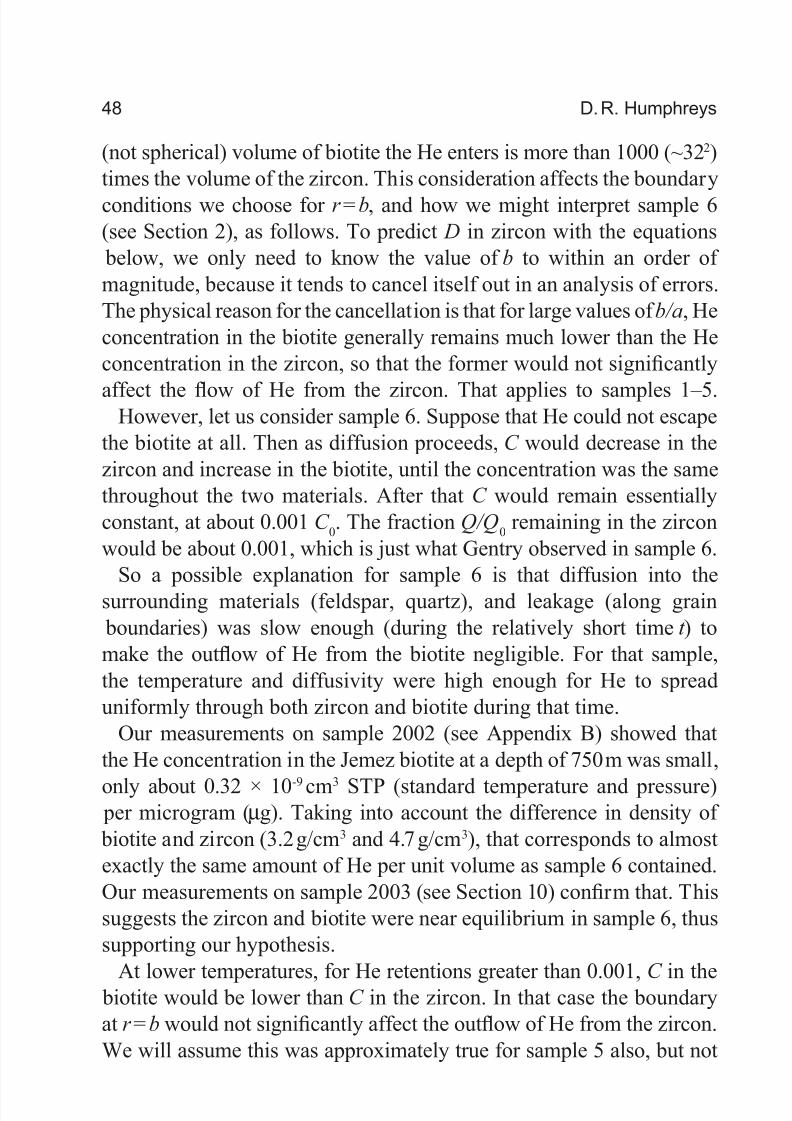
48 D. R. Humphreys
(not spherical) volume of biotite the He enters is more than 1000 (~322)times the volume of the zircon. This consideration affects the boundary
conditions we choose for r = b, and how we might interpret sample 6(see Section 2), as follows. To predict D in zircon with the equations below, we only need to know the value of b to within an order of magnitude, because it tends to cancel itself out in an analysis of errors.The physical reason for the cancellation is that for large values of b/a, Heconcentration in the biotite generally remains much lower than the Heconcentration in the zircon, so that the former would not significantly
affect the flow of He from the zircon. That applies to samples 1–5.However, let us consider sample 6. Suppose that He could not escape
the biotite at all. Then as diffusion proceeds, C would decrease in thezircon and increase in the biotite, until the concentration was the samethroughout the two materials. After that C would remain essentiallyconstant, at about 0.001 C
0. The fraction Q/Q
0remaining in the zircon
would be about 0.001, which is just what Gentry observed in sample 6.So a possible explanation for sample 6 is that diffusion into the
surrounding materials (feldspar, quartz), and leakage (along grain boundaries) was slow enough (during the relatively short time t ) tomake the outflow of He from the biotite negligible. For that sample,the temperature and diffusivity were high enough for He to spreaduniformly through both zircon and biotite during that time.
Our measurements on sample 2002 (see Appendix B) showed thatthe He concentration in the Jemez biotite at a depth of 750 m was small,
only about 0.32 × 10⁻⁹ cm3 STP (standard temperature and pressure) per microgram (µg). Taking into account the difference in density of biotite and zircon (3.2 g/cm3 and 4.7 g/cm3), that corresponds to almostexactly the same amount of He per unit volume as sample 6 contained.Our measurements on sample 2003 (see Section 10) confirm that. Thissuggests the zircon and biotite were near equilibrium in sample 6, thussupporting our hypothesis.
At lower temperatures, for He retentions greater than 0.001, C in the biotite would be lower than C in the zircon. In that case the boundaryat r = b would not significantly affect the outflow of He from the zircon.We will assume this was approximately true for sample 5 also, but not
8/8/2019 Young Helium Diffusion Age of Zircons
http://slidepdf.com/reader/full/young-helium-diffusion-age-of-zircons 25/76
Young Helium Diffusion Age of Zircons Supports Accelerated Nuclear Decay 49
for sample 6. To simplify our analysis for samples 1 through 5, we willassume the usual boundary condition, that the concentration C (r ) falls
to zero at radius r = b:
(8)
Choosing a different boundary condition would have little effect onthe result, because it turns out that in the short time available, littleHe could leave the biotite under any circumstances. For the initial
conditions, we assume that the concentration is a constant, C 0, insidethe zircon, and zero outside it:
(9a, b)
After time zero, there also must be continuity of both C and He flowat r = a. We need a solution to the diffusion equation, equation (1), in itsradial form, for the above boundary conditions. In 1945, Bell publishedsuch a solution for the corresponding problem in heat flow [ Bell , 1945, p. 46, equation (4B)]. His solution, which is mathematically complex,allows for different diffusion coefficients in the two regions. We willsimplify the solution considerably by making the diffusion coefficientsthe same in both regions. Because the diffusion coefficient of biotiteis somewhat higher than that of zircon at the temperatures of interest,our solution will have slightly slower (no more than 30% slower) He
outflows and correspondingly longer times than the real situation. Thisapproximation is generous to the uniformitarian point of view because itincreases the time He could remain in the zircons. For more discussionof the above boundary conditions, and possible alternatives to them,see Appendix D, Section D4.
With the above simplification, Bell’s equation reduces to one given by Carslaw and Jaeger [Carslaw and Jaeger , 1959, p. 236, equation
(19)]. After making the simple changes required to go from heat flow toatomic diffusion [Crank , 1975, p. 8, equation (1.21)], and accounting for notation differences (note meanings of a and b), we get the followingsolution:
C b( ) = 0
At for and for t C r C r a C r r a= = < = >0 00: ( ) , ( )
8/8/2019 Young Helium Diffusion Age of Zircons
http://slidepdf.com/reader/full/young-helium-diffusion-age-of-zircons 26/76
50 D. R. Humphreys
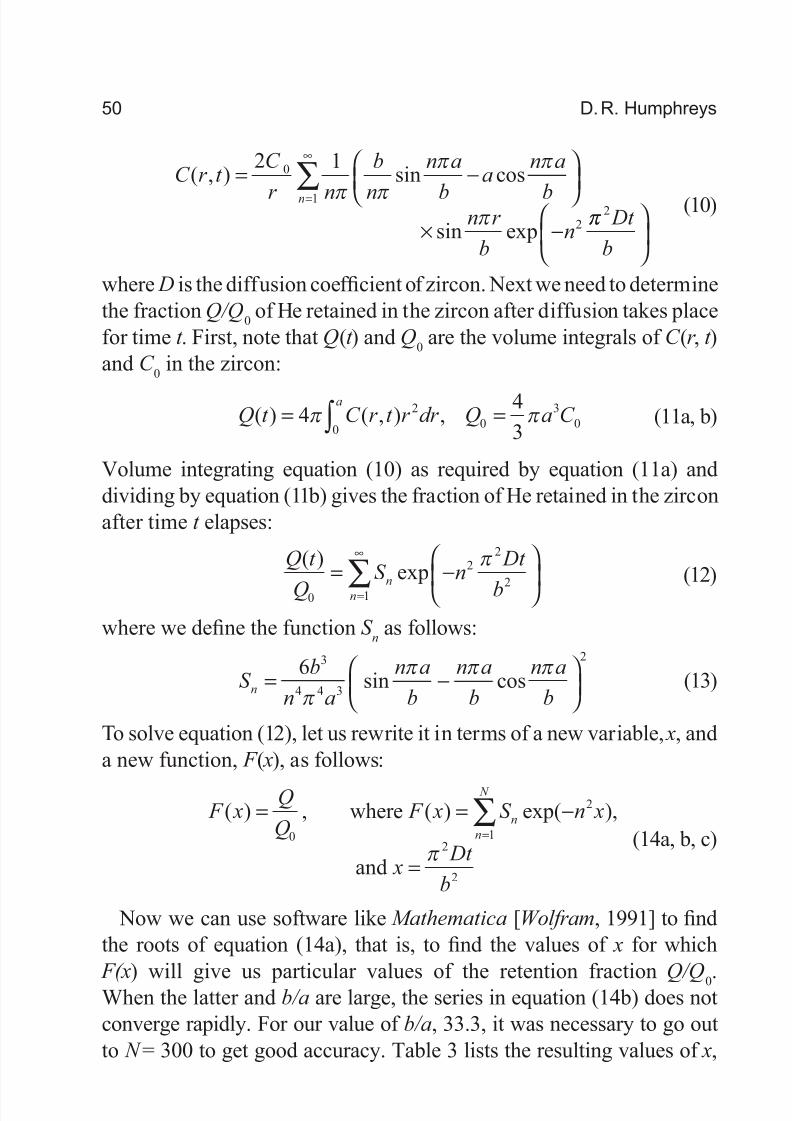
(10)
where D is the diffusion coefficient of zircon. Next we need to determinethe fraction Q/Q
0of He retained in the zircon after diffusion takes place
for time t . First, note that Q(t ) and Q0
are the volume integrals of C (r , t )and C
0in the zircon:
(11a, b)
Volume integrating equation (10) as required by equation (11a) anddividing by equation (11b) gives the fraction of He retained in the zirconafter time t elapses:
(12)
where we define the function S n
as follows:
(13)
To solve equation (12), let us rewrite it in terms of a new variable, x, anda new function, F ( x), as follows:
(14a, b, c)
Now we can use software like Mathematica [Wolfram, 1991] to findthe roots of equation (14a), that is, to find the values of x for which
F(x) will give us particular values of the retention fraction Q/Q0.When the latter and b/a are large, the series in equation (14b) does notconverge rapidly. For our value of b/a, 33.3, it was necessary to go outto N = 300 to get good accuracy. Table 3 lists the resulting values of x,
C r t C
r n
b
n
n a
b
an a
bn r
bn
n
( , ) sin cos
sin exp
= −
× −=
∞
∑2 10
1
2π π
π π
π π π 2 Dt
b
Q t C r t r dr Q a C a
( ) ( , ) ,= =∫ 4 43
20
300
π π
Q t
Q
S n Dt
bn
n
( )exp
0
22
21
= −
=
∞
∑
π
S b
n a
n a
b
n a
b
n a
bn = −
6 3
4 4 3
2
π
π π π sin cos
F xQ
Q F x S n x
x Dt
b
n
n
N
( ) , ( ) exp( ),= = −
=
=∑
0
2
12
2
where
andπ
8/8/2019 Young Helium Diffusion Age of Zircons
http://slidepdf.com/reader/full/young-helium-diffusion-age-of-zircons 27/76
Young Helium Diffusion Age of Zircons Supports Accelerated Nuclear Decay 51
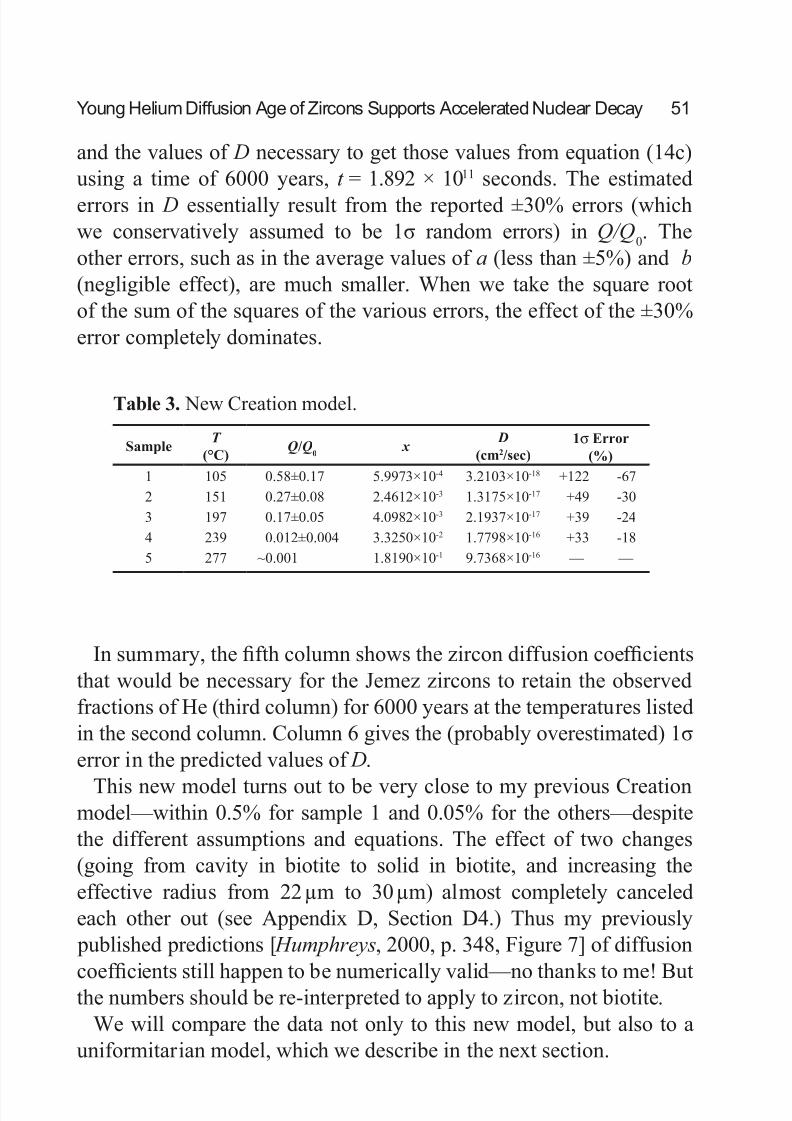
and the values of D necessary to get those values from equation (14c)using a time of 6000 years, t = 1.892 × 10¹¹ seconds. The estimated
errors in D essentially result from the reported ±30% errors (whichwe conservatively assumed to be 1σ random errors) in Q/Q
0. The
other errors, such as in the average values of a (less than ±5%) and b (negligible effect), are much smaller. When we take the square rootof the sum of the squares of the various errors, the effect of the ±30%error completely dominates.
In summary, the fifth column shows the zircon diffusion coefficientsthat would be necessary for the Jemez zircons to retain the observedfractions of He (third column) for 6000 years at the temperatures listedin the second column. Column 6 gives the (probably overestimated) 1σerror in the predicted values of D.
This new model turns out to be very close to my previous Creationmodel—within 0.5% for sample 1 and 0.05% for the others—despitethe different assumptions and equations. The effect of two changes(going from cavity in biotite to solid in biotite, and increasing theeffective radius from 22 µm to 30 µm) almost completely canceledeach other out (see Appendix D, Section D4.) Thus my previously published predictions [ Humphreys, 2000, p. 348, Figure 7] of diffusion
coefficients still happen to be numerically valid—no thanks to me! Butthe numbers should be re-interpreted to apply to zircon, not biotite.We will compare the data not only to this new model, but also to a
uniformitarian model, which we describe in the next section.
SampleT
(°C)Q/Q
0x
D
(cm2/sec)
1σ Error
(%)
1 105 0.58±0.17 5.9973×10⁻⁴ 3.2103×10⁻¹⁸ +122 -67
2 151 0.27±0.08 2.4612×10⁻³ 1.3175×10⁻¹⁷ +49 -30
3 197 0.17±0.05 4.0982×10⁻³ 2.1937×10⁻¹⁷ +39 -24
4 239 0.012±0.004 3.3250×10⁻² 1.7798×10⁻¹⁶ +33 -18
5 277 ~0.001 1.8190×10⁻¹ 9.7368×10⁻¹⁶ — —
Table 3. New Creation model.
8/8/2019 Young Helium Diffusion Age of Zircons
http://slidepdf.com/reader/full/young-helium-diffusion-age-of-zircons 28/76
52 D. R. Humphreys
8. Uniformitarian Model
In the RATE book [ Humphreys, 2000, p. 346], we outlined a simplemodel appropriate for the uniformitarian view, with its billions of years,of the history of the rock unit:
. . . steady low-rate radioactive decay, He production, and He diffusion for 1.5 billion years at today’s temperatures in the formation.
Our assumption of constant temperatures is generous to theuniformitarian model. Two geoscientists from Los Alamos National
Laboratory constructed a theoretical model of the thermal history of the particular borehole (GT-2) we are concerned with [ Kolstad and
McGetchin, 1978, p. 213, Figure 11]. They started by assuming “a background vertical geothermal gradient of 25°C/km.” That meansinitial conditions with absolute (K) temperatures 16 to 31% lower thantoday for samples 1 through 6, putting them in the low-slope “defect”range of diffusion. Their model then has an episode of Pliocene-Pleistocene volcanism starting to increase the temperature severalmegayears ago. It would peak about 0.6 Ma ago at temperatures roughly50 to 120ºC above today’s values, depending on depth. After the peak,temperatures would decline steadily until 0.1 Ma ago, and then level off at today’s values.
Later studies [ Harrison et al., 1986; Sasada, 1989] add a more recent pulse of heat and have past temperatures being higher, 110 to 190ºCmore than today’s levels just 24,000 years ago, and higher before that
[ Harrison et al., 1986, p. 1906, Figure 9]. This would put the sampleswell into the high-slope “intrinsic” range of diffusion.
The effect of such heat pulses would be great. For several million years,the diffusion coefficients would have been about two to three orders of magnitude higher than today’s values. During the previous 1.5 billionyears, supposedly at lower temperatures than today, the diffusion rateswould have been on the “defect” line (Figure 5) and therefore not much
below today’s levels. Thus the long time at lower temperatures wouldnot compensate for high losses during the few million years at higher temperatures. This makes our assumption of constant temperaturesat today’s values quite favorable to the uniformitarian scenario. For
8/8/2019 Young Helium Diffusion Age of Zircons
http://slidepdf.com/reader/full/young-helium-diffusion-age-of-zircons 29/76
Young Helium Diffusion Age of Zircons Supports Accelerated Nuclear Decay 53
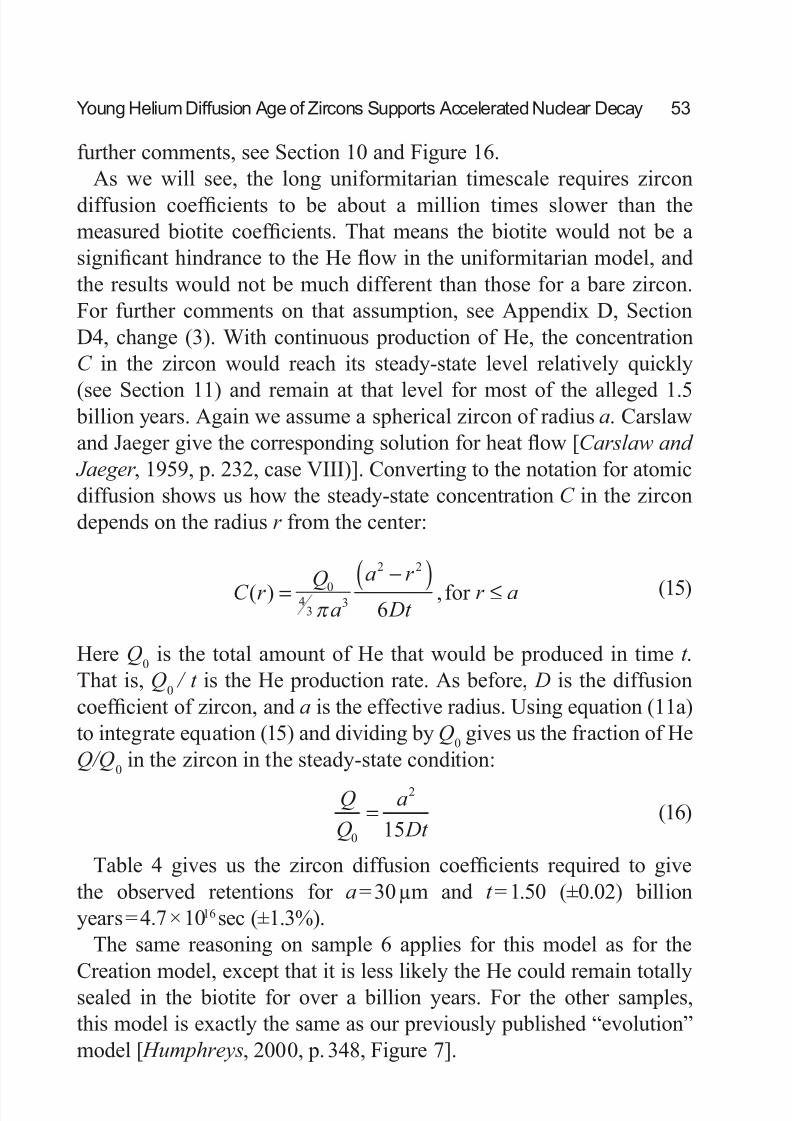
further comments, see Section 10 and Figure 16.As we will see, the long uniformitarian timescale requires zircon
diffusion coefficients to be about a million times slower than themeasured biotite coefficients. That means the biotite would not be asignificant hindrance to the He flow in the uniformitarian model, andthe results would not be much different than those for a bare zircon.For further comments on that assumption, see Appendix D, SectionD4, change (3). With continuous production of He, the concentrationC in the zircon would reach its steady-state level relatively quickly
(see Section 11) and remain at that level for most of the alleged 1.5 billion years. Again we assume a spherical zircon of radius a. Carslawand Jaeger give the corresponding solution for heat flow [Carslaw and
Jaeger , 1959, p. 232, case VIII)]. Converting to the notation for atomicdiffusion shows us how the steady-state concentration C in the zircondepends on the radius r from the center:
(15)
Here Q0
is the total amount of He that would be produced in time t .That is, Q
0 / t is the He production rate. As before, D is the diffusion
coefficient of zircon, and a is the effective radius. Using equation (11a)to integrate equation (15) and dividing by Q
0gives us the fraction of He
Q/Q0
in the zircon in the steady-state condition:
(16)
Table 4 gives us the zircon diffusion coefficients required to givethe observed retentions for a= 30 µm and t = 1.50 (±0.02) billionyears = 4.7 × 10¹⁶sec (±1.3%).
The same reasoning on sample 6 applies for this model as for the
Creation model, except that it is less likely the He could remain totallysealed in the biotite for over a billion years. For the other samples,this model is exactly the same as our previously published “evolution”model [ Humphreys, 2000, p. 348, Figure 7].
C r Qa
a r
Dt r a( ) ,=
−( ) ≤04
33
2 2
6π for
Q
Q
a
Dt 0
2
15=
8/8/2019 Young Helium Diffusion Age of Zircons
http://slidepdf.com/reader/full/young-helium-diffusion-age-of-zircons 30/76
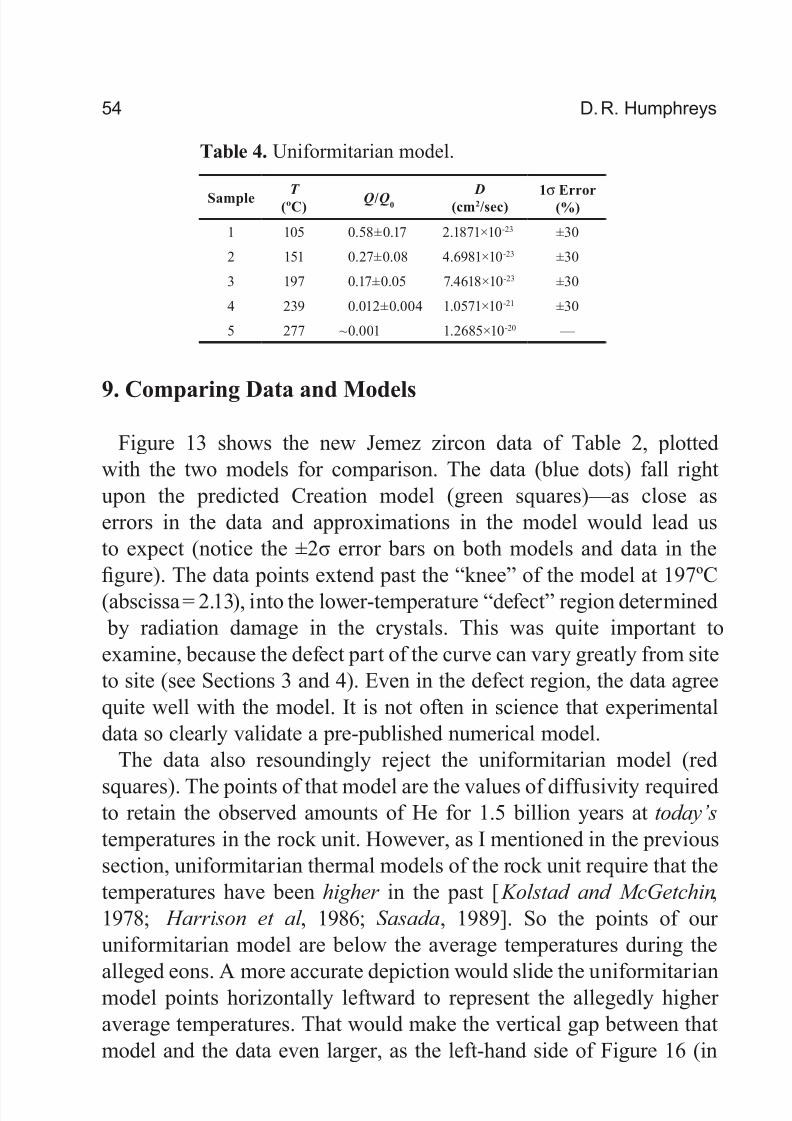
54 D. R. Humphreys
9. Comparing Data and Models
Figure 13 shows the new Jemez zircon data of Table 2, plottedwith the two models for comparison. The data (blue dots) fall rightupon the predicted Creation model (green squares)—as close aserrors in the data and approximations in the model would lead usto expect (notice the ±2σ error bars on both models and data in thefigure). The data points extend past the “knee” of the model at 197ºC(abscissa = 2.13), into the lower-temperature “defect” region determined by radiation damage in the crystals. This was quite important toexamine, because the defect part of the curve can vary greatly from siteto site (see Sections 3 and 4). Even in the defect region, the data agreequite well with the model. It is not often in science that experimentaldata so clearly validate a pre-published numerical model.
The data also resoundingly reject the uniformitarian model (red
squares). The points of that model are the values of diffusivity requiredto retain the observed amounts of He for 1.5 billion years at today’s temperatures in the rock unit. However, as I mentioned in the previoussection, uniformitarian thermal models of the rock unit require that thetemperatures have been higher in the past [ Kolstad and McGetchin,1978; Harrison et al., 1986; Sasada, 1989]. So the points of our uniformitarian model are below the average temperatures during the
alleged eons. A more accurate depiction would slide the uniformitarianmodel points horizontally leftward to represent the allegedly higher average temperatures. That would make the vertical gap between thatmodel and the data even larger, as the left-hand side of Figure 16 (in
Sample T (ºC) Q/Q0 D (cm2/sec) 1σ Error(%)
1 105 0.58±0.17 2.1871×10⁻²³ ±30
2 151 0.27±0.08 4.6981×10⁻²³ ±30
3 197 0.17±0.05 7.4618×10⁻²³ ±30
4 239 0.012±0.004 1.0571×10⁻²¹ ±30
5 277 ~0.001 1.2685×10⁻²⁰ —
Table 4. Uniformitarian model.
8/8/2019 Young Helium Diffusion Age of Zircons
http://slidepdf.com/reader/full/young-helium-diffusion-age-of-zircons 31/76
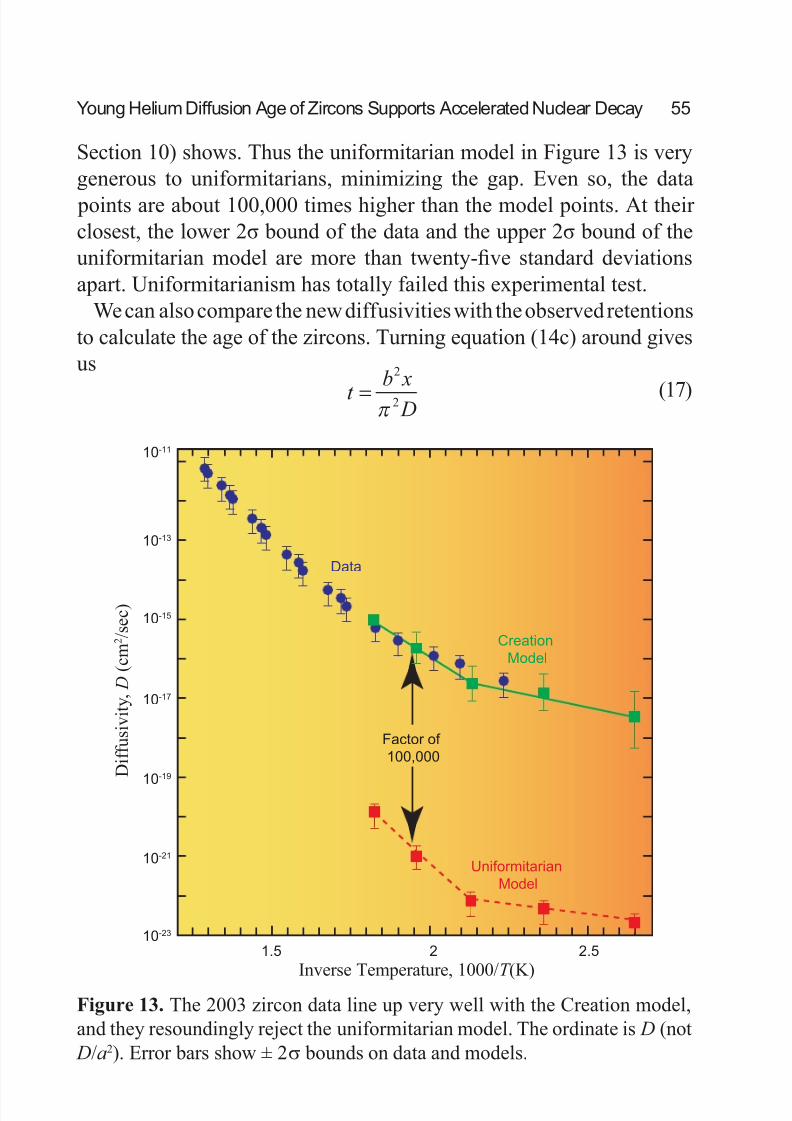
Young Helium Diffusion Age of Zircons Supports Accelerated Nuclear Decay 55
Section 10) shows. Thus the uniformitarian model in Figure 13 is verygenerous to uniformitarians, minimizing the gap. Even so, the data
points are about 100,000 times higher than the model points. At their closest, the lower 2σ bound of the data and the upper 2σ bound of theuniformitarian model are more than twenty-five standard deviationsapart. Uniformitarianism has totally failed this experimental test.
We can also compare the new diffusivities with the observed retentionsto calculate the age of the zircons. Turning equation (14c) around givesus
(17)
10-11
10-13
10-15
10-17
10
-19
10-21
10-23
1.5 2 2.5
Factor of
100,000
Data
Creation
Model
Uniformitarian
Model
Inverse Temperature, 1000/T (K)
D i f f u s i v i t y ,
D ( c
m 2 / s e c )
Figure 13. The 2003 zircon data line up very well with the Creation model,and they resoundingly reject the uniformitarian model. The ordinate is D (not
D/a2). Error bars show ± 2σ bounds on data and models.
t b x
D=
2
2π
8/8/2019 Young Helium Diffusion Age of Zircons
http://slidepdf.com/reader/full/young-helium-diffusion-age-of-zircons 32/76
56 D. R. Humphreys
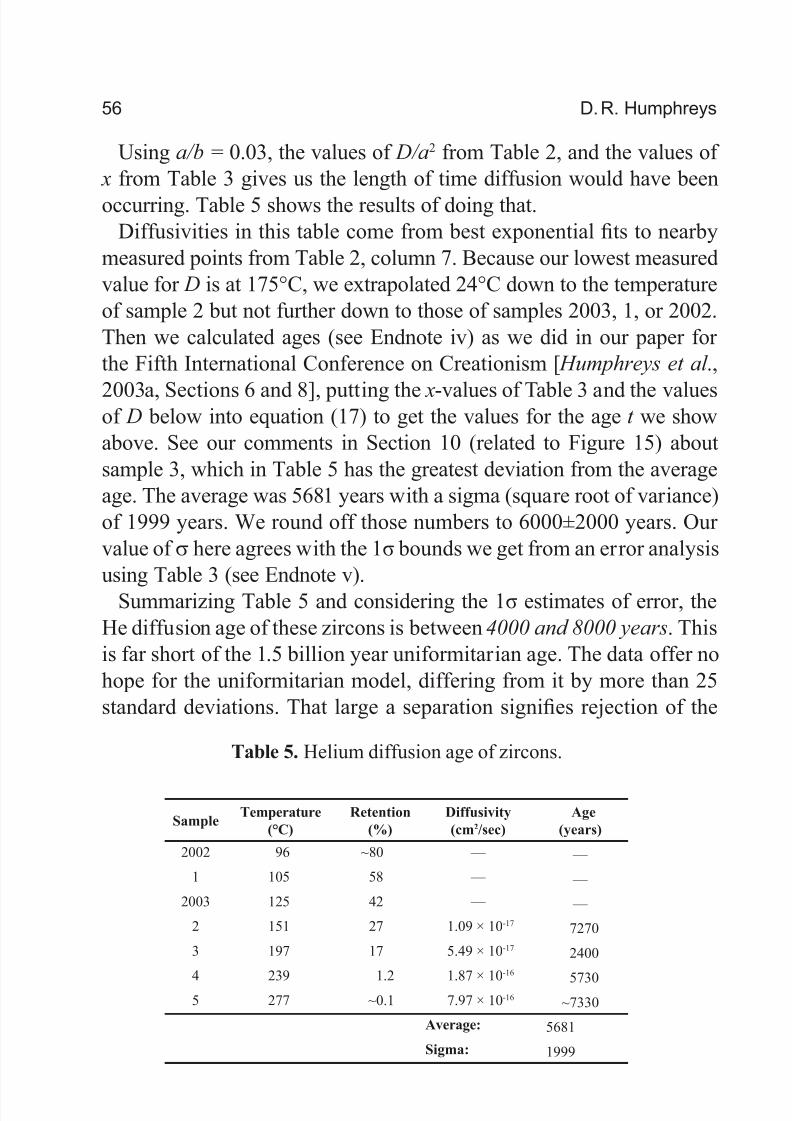
Using a/b = 0.03, the values of D/a2 from Table 2, and the values of x from Table 3 gives us the length of time diffusion would have been
occurring. Table 5 shows the results of doing that.Diffusivities in this table come from best exponential fits to nearby
measured points from Table 2, column 7. Because our lowest measuredvalue for D is at 175°C, we extrapolated 24°C down to the temperatureof sample 2 but not further down to those of samples 2003, 1, or 2002.Then we calculated ages (see Endnote iv) as we did in our paper for the Fifth International Conference on Creationism [ Humphreys et al .,
2003a, Sections 6 and 8], putting the x-values of Table 3 and the valuesof D below into equation (17) to get the values for the age t we showabove. See our comments in Section 10 (related to Figure 15) aboutsample 3, which in Table 5 has the greatest deviation from the averageage. The average was 5681 years with a sigma (square root of variance)of 1999 years. We round off those numbers to 6000±2000 years. Our value of σ here agrees with the 1σ bounds we get from an error analysisusing Table 3 (see Endnote v).
Summarizing Table 5 and considering the 1σ estimates of error, theHe diffusion age of these zircons is between 4000 and 8000 years. Thisis far short of the 1.5 billion year uniformitarian age. The data offer nohope for the uniformitarian model, differing from it by more than 25standard deviations. That large a separation signifies rejection of the
SampleTemperature
(°C)
Retention
(%)
Diffusivity
(cm2/sec)
Age
(years)
2002 96 ~80 — —
1 105 58 — —
2003 125 42 — —
2 151 27 1.09 × 10⁻¹⁷ 7270
3 197 17 5.49 × 10⁻¹⁷ 2400
4 239 1.2 1.87 × 10
-16
57305 277 ~0.1 7.97 × 10⁻¹⁶ ~7330
Average: 5681
Sigma: 1999
Table 5. Helium diffusion age of zircons.
8/8/2019 Young Helium Diffusion Age of Zircons
http://slidepdf.com/reader/full/young-helium-diffusion-age-of-zircons 33/76
Young Helium Diffusion Age of Zircons Supports Accelerated Nuclear Decay 57
uniformitarian hypothesis with an extremely high level of confidence(see endnote vi). The zircon data show a knee, where the data break off horizontally to the right into a shallow-slope “defect” line. But even if that had not been the case, the high-slope “intrinsic” line would still pass well above the uniformitarian model.
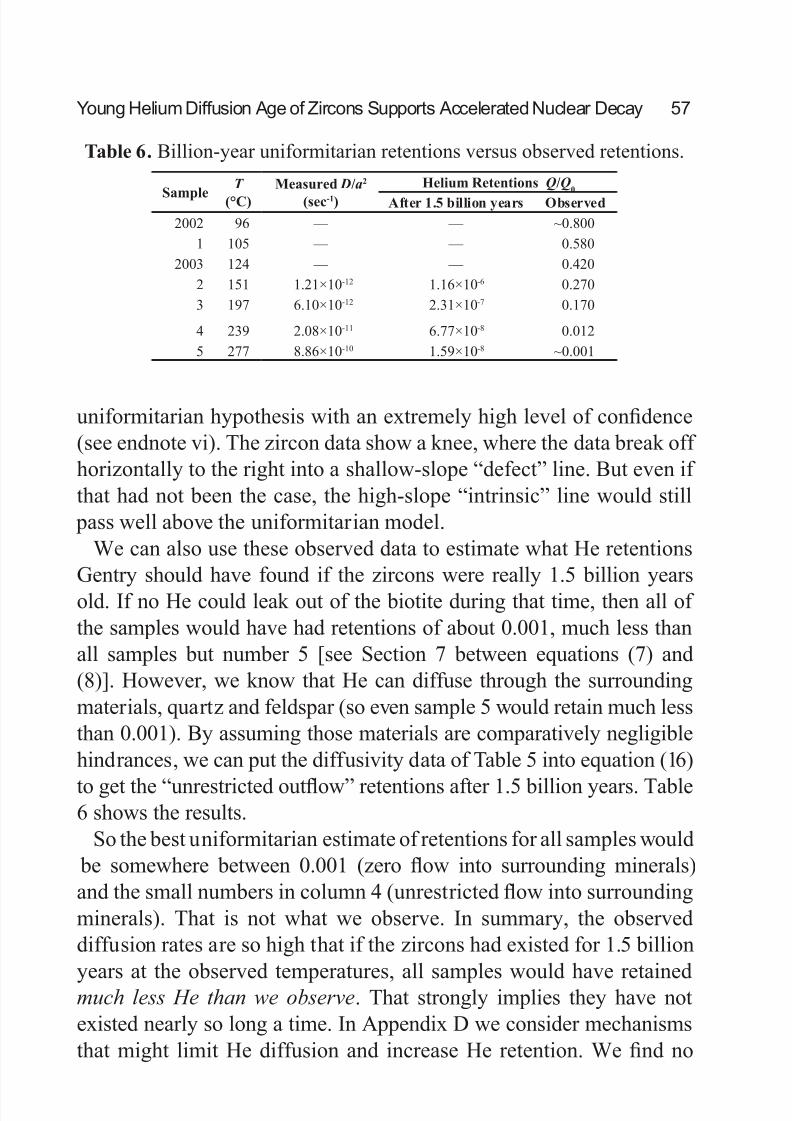
We can also use these observed data to estimate what He retentionsGentry should have found if the zircons were really 1.5 billion yearsold. If no He could leak out of the biotite during that time, then all of the samples would have had retentions of about 0.001, much less thanall samples but number 5 [see Section 7 between equations (7) and(8)]. However, we know that He can diffuse through the surroundingmaterials, quartz and feldspar (so even sample 5 would retain much lessthan 0.001). By assuming those materials are comparatively negligiblehindrances, we can put the diffusivity data of Table 5 into equation (16)
to get the “unrestricted outflow” retentions after 1.5 billion years. Table6 shows the results.
So the best uniformitarian estimate of retentions for all samples would be somewhere between 0.001 (zero flow into surrounding minerals)and the small numbers in column 4 (unrestricted flow into surroundingminerals). That is not what we observe. In summary, the observeddiffusion rates are so high that if the zircons had existed for 1.5 billion
years at the observed temperatures, all samples would have retainedmuch less He than we observe. That strongly implies they have notexisted nearly so long a time. In Appendix D we consider mechanismsthat might limit He diffusion and increase He retention. We find no
Sample
T
(°C)
Measured D/a2
(sec-1)
Helium Retentions Q/Q0
After 1.5 billion years Observed
2002 96 — — ~0.800
1 105 — — 0.580
2003 124 — — 0.420
2 151 1.21×10⁻¹² 1.16×10⁻⁶ 0.270
3 197 6.10×10⁻¹² 2.31×10⁻⁷ 0.170
4 239 2.08×10⁻¹¹ 6.77×10⁻⁸ 0.012
5 277 8.86×10⁻¹⁰ 1.59×10⁻⁸ ~0.001
Table 6. Billion-year uniformitarian retentions versus observed retentions.

8/8/2019 Young Helium Diffusion Age of Zircons
http://slidepdf.com/reader/full/young-helium-diffusion-age-of-zircons 34/76
58 D. R. Humphreys
mechanism that is capable of retaining large amounts of He for even afew million years, much less billions of years.
10. Closing Some Loopholes
After stepwise heating the 216 µg of zircons in sample 2003 to getthe diffusivity data, our experimenter raised the temperature to ahigh value and held it there long enough to get the rest of the He outof the crystals. The total yield of He from the zircons was 1356 ncc
(1 ncc = 10-9
cm3
STP = 0.4462 × 10⁻⁴
nanomole), or 6.05 × 10⁻²
nmol(1σ error ±3%). Dividing by the mass (±1%) gives us 6.28 ncc/µg,or 303 nmol/g (±3%). Multiplying the latter value by the density of zircon, 4.7 g/cm3 (±2%), gives us the He concentration in the zircon:1320 nmol/cm3 (± 4%).
For the 5.562 mg (±1%) of biotite, the total yield of He was257 ncc (±3%), giving 2.06 nmol/g (±3%). Multiplying by the densityof biotite, 3.2 g/cm3 (±2%) gives us the He concentration in the biotite:6.57 nmol/cm3 (±4%).
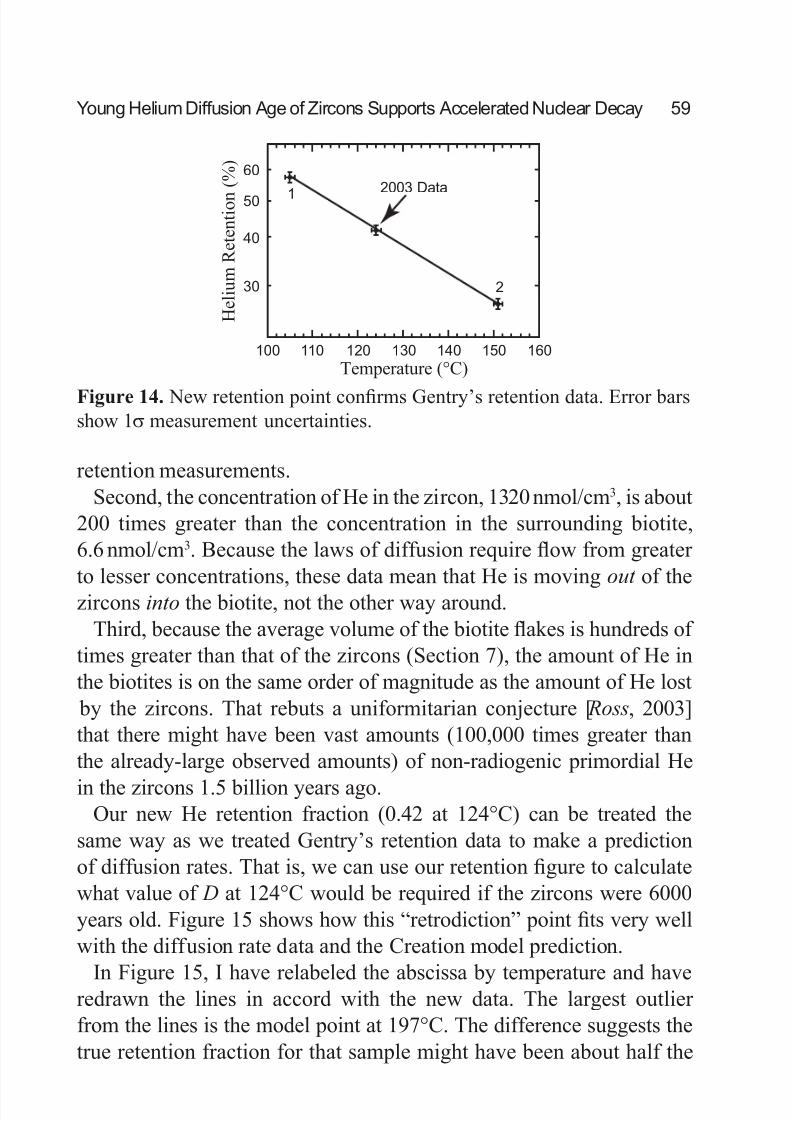
These data are quite useful in closing possible loopholes in our case.First, the 6.28 ncc/µg yield of these zircons is quite consistent withGentry’s retention data. Gentry’s (±30%) estimate of radiogenic Hedeposited in the zircons, 15 ncc/µg ±30% (1σ), is consistent with our data on radiogenic Pb in the zircons. Dividing our retention by thatvalue gives us a retention fraction of 0.42±0.13. Almost all of that error
is systematic, caused by Gentry’s ±30% error. That is, if we were tocorrect all retentions, both Gentry’s and ours, with a new estimate of He deposited, our point would move up or down together with Gentry’s points. Here we only want to compare our retention with those of Gentry, so I will leave the systematic error out of the comparison. TheHe measurement error, on the other hand, has a 1σ random error of ±3% (see Endnote iii). These zircons came from a depth of 1490 m,
nearly midway between Gentry’s samples 1 and 2 in Table 1. Theinterpolated temperature at that depth would be 124 (±1)°C. Figure 14shows that our new retention point fits quite well between Gentry’sretentions for samples 1 and 2. This supports the validity of Gentry’s
8/8/2019 Young Helium Diffusion Age of Zircons
http://slidepdf.com/reader/full/young-helium-diffusion-age-of-zircons 35/76
Young Helium Diffusion Age of Zircons Supports Accelerated Nuclear Decay 59
retention measurements.Second, the concentration of He in the zircon, 1320 nmol/cm3, is about
200 times greater than the concentration in the surrounding biotite,6.6 nmol/cm3. Because the laws of diffusion require flow from greater to lesser concentrations, these data mean that He is moving out of thezircons into the biotite, not the other way around.
Third, because the average volume of the biotite flakes is hundreds of times greater than that of the zircons (Section 7), the amount of He inthe biotites is on the same order of magnitude as the amount of He lost by the zircons. That rebuts a uniformitarian conjecture [ Ross, 2003]that there might have been vast amounts (100,000 times greater thanthe already-large observed amounts) of non-radiogenic primordial He
in the zircons 1.5 billion years ago.Our new He retention fraction (0.42 at 124°C) can be treated the
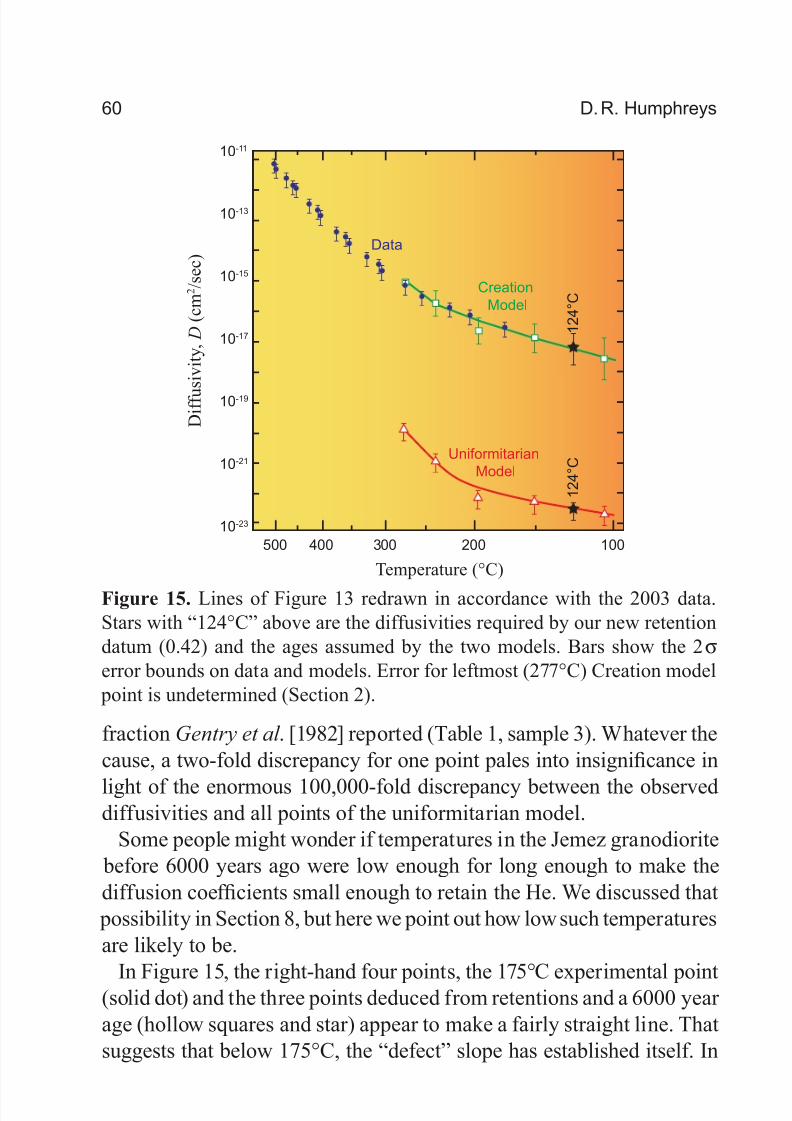
same way as we treated Gentry’s retention data to make a predictionof diffusion rates. That is, we can use our retention figure to calculatewhat value of D at 124°C would be required if the zircons were 6000years old. Figure 15 shows how this “retrodiction” point fits very wellwith the diffusion rate data and the Creation model prediction.
In Figure 15, I have relabeled the abscissa by temperature and haveredrawn the lines in accord with the new data. The largest outlier from the lines is the model point at 197°C. The difference suggests thetrue retention fraction for that sample might have been about half the
60
50
40
30
100 110 120 130 140 150 160
2
2003 Data
1
Temperature (°C)
H e l i u m
R e t e n t i o n
( % )
Figure 14. New retention point confirms Gentry’s retention data. Error barsshow 1σ measurement uncertainties.
8/8/2019 Young Helium Diffusion Age of Zircons
http://slidepdf.com/reader/full/young-helium-diffusion-age-of-zircons 36/76
60 D. R. Humphreys
fraction Gentry et al . [1982] reported (Table 1, sample 3). Whatever thecause, a two-fold discrepancy for one point pales into insignificance in
light of the enormous 100,000-fold discrepancy between the observeddiffusivities and all points of the uniformitarian model.
Some people might wonder if temperatures in the Jemez granodiorite before 6000 years ago were low enough for long enough to make thediffusion coefficients small enough to retain the He. We discussed that possibility in Section 8, but here we point out how low such temperaturesare likely to be.
In Figure 15, the right-hand four points, the 175°C experimental point(solid dot) and the three points deduced from retentions and a 6000 year age (hollow squares and star) appear to make a fairly straight line. Thatsuggests that below 175°C, the “defect” slope has established itself. In
10-11
10-13
10-15
10-17
10-19
10-21
10-23
Data
Creation
Model
Uniformitarian
Model
Temperature (°C)
D i f f u
s i v i t y ,
D ( c
m 2 / s e c )
1 2 4 ° C
500 400 300 200 100
1 2 4 ° C
Figure 15. Lines of Figure 13 redrawn in accordance with the 2003 data.Stars with “124°C” above are the diffusivities required by our new retentiondatum (0.42) and the ages assumed by the two models. Bars show the 2σ error bounds on data and models. Error for leftmost (277°C) Creation model
point is undetermined (Section 2).
8/8/2019 Young Helium Diffusion Age of Zircons
http://slidepdf.com/reader/full/young-helium-diffusion-age-of-zircons 37/76
Young Helium Diffusion Age of Zircons Supports Accelerated Nuclear Decay 61
that case, the best linear fit (to ln D vs 1 /T ) gives parameters (with 1σerror bounds) of the defect line for these zircons from borehole GT-2:
(18)
Because E 1
is small, the slope of the defect line is small. Figure16 extrapolates this line and its 1σ error bounds down to very lowtemperatures. The intercept with D= 10 –23 cm2/sec is (note minussign):
By coincidence, that happens to be the temperature of sublimatingdry ice (frozen CO
2). The “Cold” uniformitarian model in Figure 16
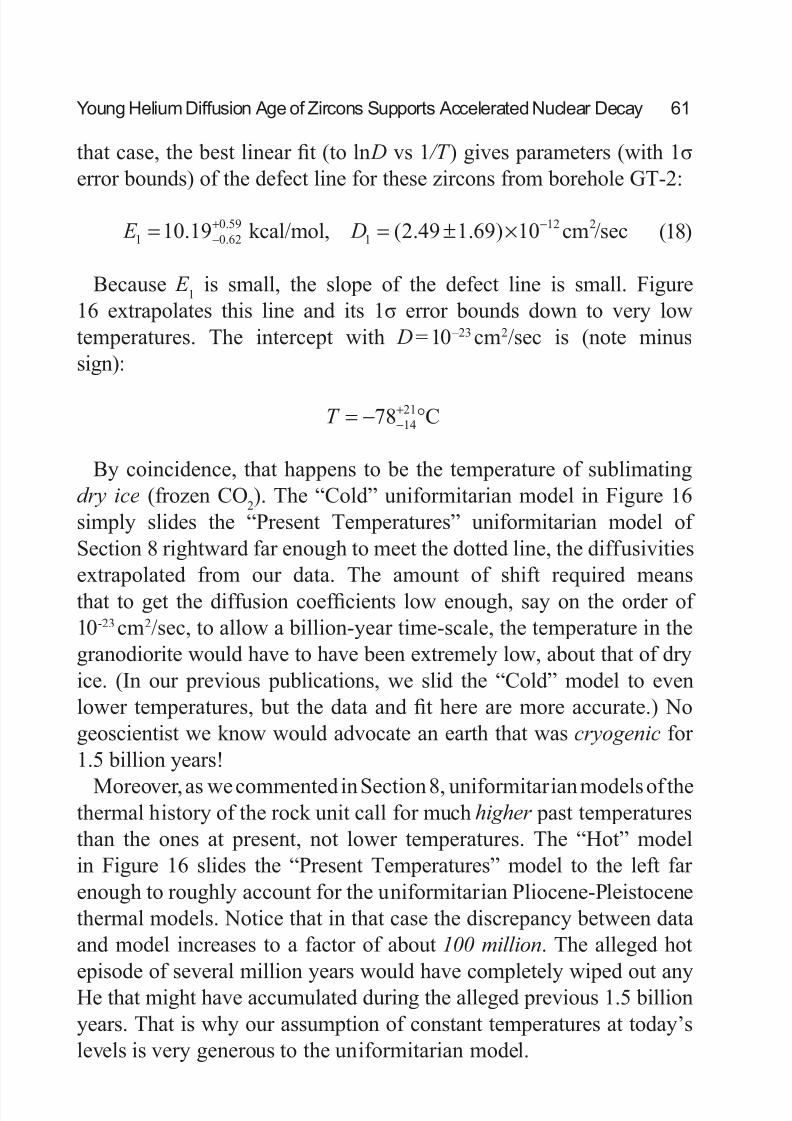
simply slides the “Present Temperatures” uniformitarian model of Section 8 rightward far enough to meet the dotted line, the diffusivitiesextrapolated from our data. The amount of shift required meansthat to get the diffusion coefficients low enough, say on the order of 10-23 cm2/sec, to allow a billion-year time-scale, the temperature in thegranodiorite would have to have been extremely low, about that of dryice. (In our previous publications, we slid the “Cold” model to evenlower temperatures, but the data and fit here are more accurate.) Nogeoscientist we know would advocate an earth that was cryogenic for 1.5 billion years!
Moreover, as we commented in Section 8, uniformitarian models of thethermal history of the rock unit call for much higher past temperaturesthan the ones at present, not lower temperatures. The “Hot” modelin Figure 16 slides the “Present Temperatures” model to the left far enough to roughly account for the uniformitarian Pliocene-Pleistocenethermal models. Notice that in that case the discrepancy between dataand model increases to a factor of about 100 million. The alleged hot
episode of several million years would have completely wiped out anyHe that might have accumulated during the alleged previous 1.5 billionyears. That is why our assumption of constant temperatures at today’slevels is very generous to the uniformitarian model.
E D1 0 620 59
112 210 19 2 49 1 69 10= = ± ×−
+ −. , ( . . ) /sec.. kcal/mol cm
T = − °−+78 14
21 C
8/8/2019 Young Helium Diffusion Age of Zircons
http://slidepdf.com/reader/full/young-helium-diffusion-age-of-zircons 38/76
62 D. R. Humphreys
11. “Closure Temperature” does not Help the UniformitarianModel
Some people misunderstand the geoscience concept of closuretemperature, thinking that zircons cooling below that temperature are permanently closed systems and thereafter would lose no significantamounts of He by diffusion. That argument would not affect our samples2–5 because they are above the closure temperature our experimenter calculated, 128°C (Appendix C). However, our samples below theclosure temperature would also not be affected, because it turns outthat even well below the closure temperature, zircons can re-open and
lose large amounts of He. Here we explain closure temperature and re-opening, and show that in the uniformitarian scenario, even the cooler Jemez granodiorite zircons would re-open early in their history.
Consider a hot zircon cooling down in newly formed granite. If thecooling rate is constant, then the seminal article by Martin Dodson[ Dodson, 1973] on closure temperature shows that the diffusioncoefficient D (of He moving out of the zircon) decreases exponentiallywith a time constant τ given by:
(19)
-78°C
ColdPresent
TemperaturesHot
× 108
10-23
10-19
10-15
10-11
D i f f u s i v i t y ,
D ( c
m 2
/ s e c )
1.5 2 2.5 3 3.5 4 4.5 5
Inverse Temperature, 1000/T (K)
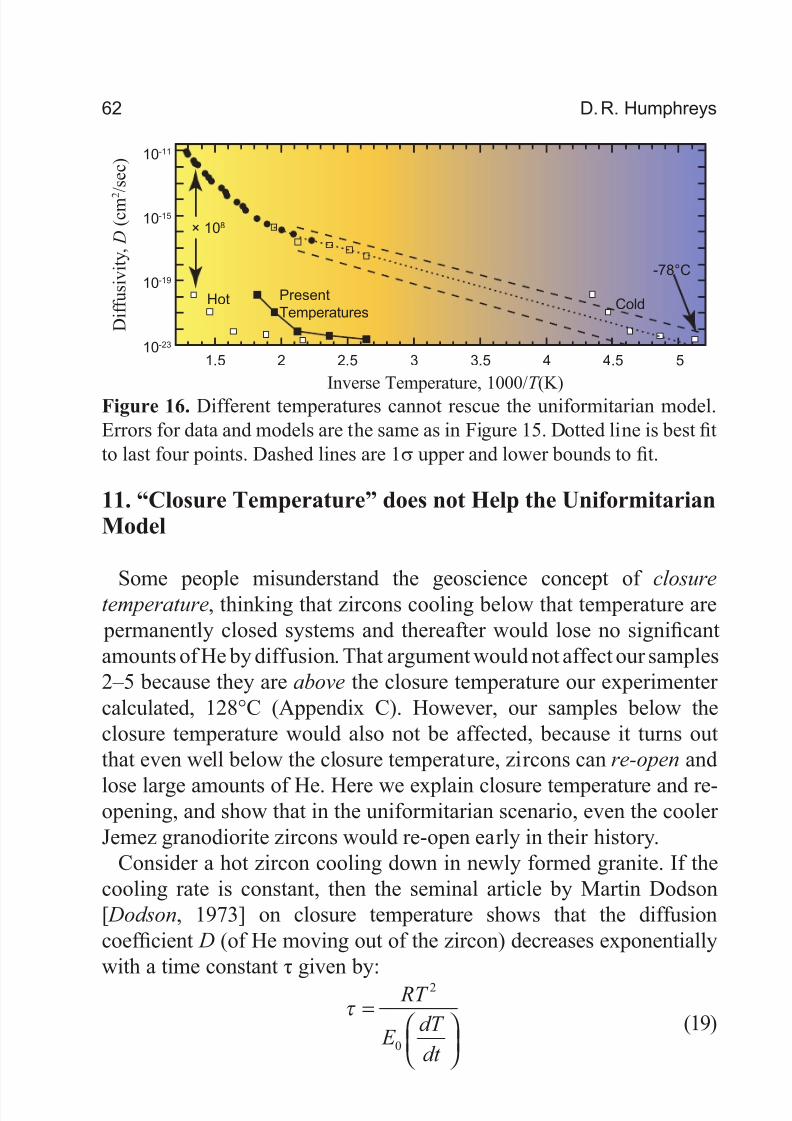
Figure 16. Different temperatures cannot rescue the uniformitarian model.Errors for data and models are the same as in Figure 15. Dotted line is best fitto last four points. Dashed lines are 1σ upper and lower bounds to fit.
τ =
RT
E dT
dt
2
0
8/8/2019 Young Helium Diffusion Age of Zircons
http://slidepdf.com/reader/full/young-helium-diffusion-age-of-zircons 39/76
Young Helium Diffusion Age of Zircons Supports Accelerated Nuclear Decay 63
where T is the absolute temperature, dT /dt is the cooling rate, R is thegas constant, and E
0is the activation energy in the “intrinsic” region
(Section 3).In the uniformitarian scenario, nuclear decay produces He at a nearly
constant rate. At the beginning, when the zircon is very hot, He diffusesout of the crystal as fast as nuclear decay produces it. But as the zirconcools, it will eventually reach a temperature below which the loss rate
becomes less than the production rate. That point is essentially whatDodson meant by the “closure” temperature. He showed that for a
constant cooling rate the closure temperature T c is
(20)
where A is a dimensionless constant (55 for a sphere), D0
is the“intrinsic” intercept in Figure 5, a is the effective radius of the crystal,and τ is the diffusion time constant given by equation (19). Since τ
depends on the cooling rate, hence affecting T csomewhat, geoscientists
imply some conventional cooling rate when they specify a closuretemperature. In Appendix C our experimenter assumes a cooling rateof 10°C per million years and finds that the closure temperature of theJemez granodiorite zircons is 128ºC.
After the zircon cools below the closure temperature, He begins toaccumulate in it, as Figure 17 shows. Later, as the temperature levels
off to that of the surrounding rock, the diffusion coefficient D becomesconstant. (The case of changing long-term temperatures is harder toanalyze, but there will still be a time of re-opening.) As the amountof He in the zircon increases, Fick’s laws of diffusion (Section 3) saysthe loss rate also increases. Eventually, even well below the closuretemperature, the loss rate approaches the production rate, an event wecall the “re-opening” of the zircon. Then the amount of He in the zircon
will level off at a steady-state value, which we called Q in equation(16). After that, the zircon will again lose He as fast as nuclear decay produces it.
Let us estimate the closure interval , the length of time t ci
the zircon
T E
R A D
a
c =
0
02
ln τ
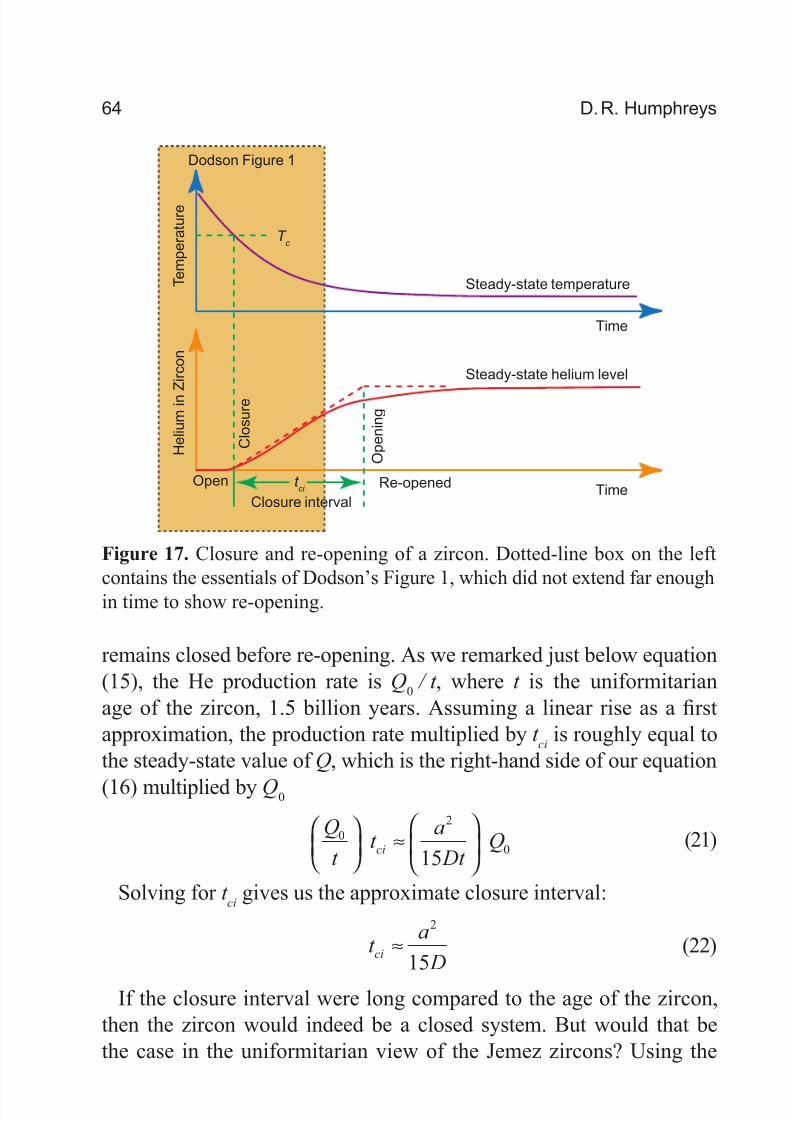
8/8/2019 Young Helium Diffusion Age of Zircons
http://slidepdf.com/reader/full/young-helium-diffusion-age-of-zircons 40/76
64 D. R. Humphreys
remains closed before re-opening. As we remarked just below equation(15), the He production rate is Q
0 / t , where t is the uniformitarian
age of the zircon, 1.5 billion years. Assuming a linear rise as a firstapproximation, the production rate multiplied by t
ciis roughly equal to
the steady-state value of Q, which is the right-hand side of our equation
(16) multiplied by Q0
(21)
Solving for t ci
gives us the approximate closure interval:
(22)
If the closure interval were long compared to the age of the zircon,then the zircon would indeed be a closed system. But would that bethe case in the uniformitarian view of the Jemez zircons? Using the
Dodson Figure 1
T c
C l o s u r e
Open
Closure interval
t ci
O p e n i n g
Re-opened
H e l i u m i n
Z i r c o n
T e m p e r a t u r e
Time
Time
Steady-state helium level
Steady-state temperature
Figure 17. Closure and re-opening of a zircon. Dotted-line box on the leftcontains the essentials of Dodson’s Figure 1, which did not extend far enoughin time to show re-opening.
Q
t t
a
Dt Qci
02
015
≈
t a
Dci ≈
2
15
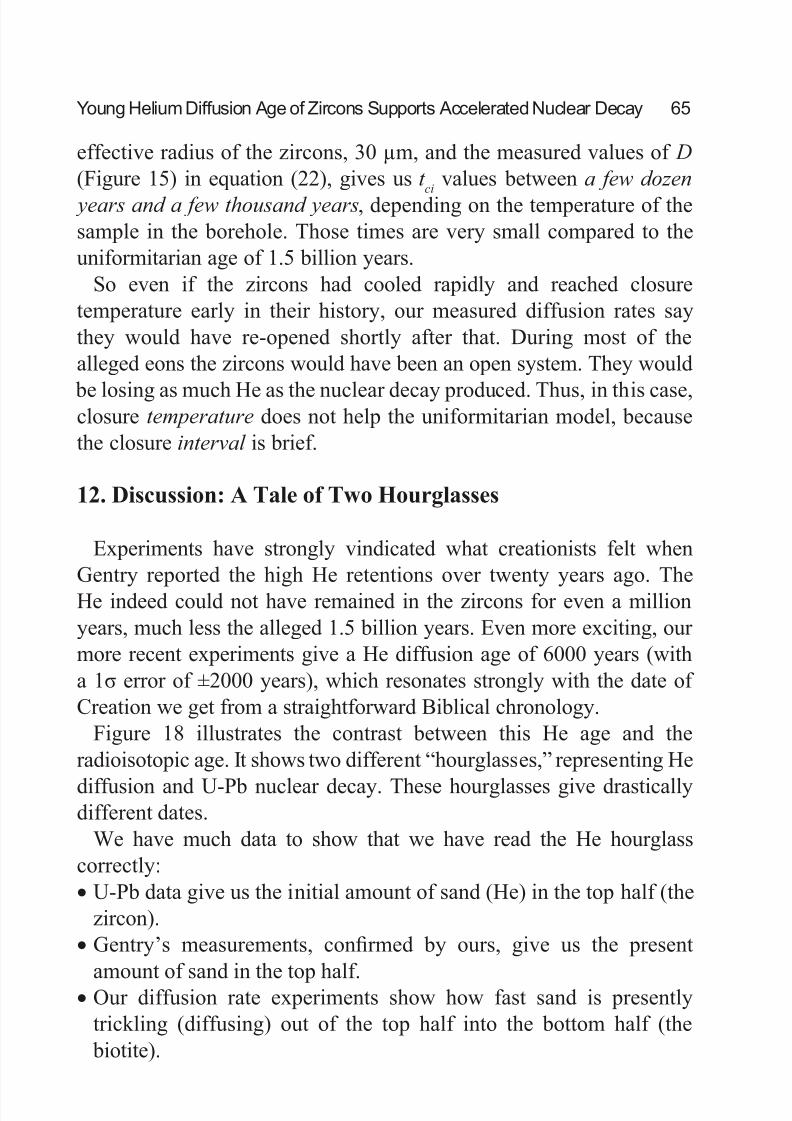
8/8/2019 Young Helium Diffusion Age of Zircons
http://slidepdf.com/reader/full/young-helium-diffusion-age-of-zircons 41/76
Young Helium Diffusion Age of Zircons Supports Accelerated Nuclear Decay 65
effective radius of the zircons, 30 µm, and the measured values of D (Figure 15) in equation (22), gives us t
civalues between a few dozen
years and a few thousand years, depending on the temperature of thesample in the borehole. Those times are very small compared to theuniformitarian age of 1.5 billion years.
So even if the zircons had cooled rapidly and reached closuretemperature early in their history, our measured diffusion rates saythey would have re-opened shortly after that. During most of thealleged eons the zircons would have been an open system. They would
be losing as much He as the nuclear decay produced. Thus, in this case,closure temperature does not help the uniformitarian model, becausethe closure interval is brief.
12. Discussion: A Tale of Two Hourglasses
Experiments have strongly vindicated what creationists felt whenGentry reported the high He retentions over twenty years ago. TheHe indeed could not have remained in the zircons for even a millionyears, much less the alleged 1.5 billion years. Even more exciting, our more recent experiments give a He diffusion age of 6000 years (witha 1σ error of ±2000 years), which resonates strongly with the date of Creation we get from a straightforward Biblical chronology.
Figure 18 illustrates the contrast between this He age and theradioisotopic age. It shows two different “hourglasses,” representing He
diffusion and U-Pb nuclear decay. These hourglasses give drasticallydifferent dates.
We have much data to show that we have read the He hourglasscorrectly:• U-Pb data give us the initial amount of sand (He) in the top half (the
zircon).• Gentry’s measurements, confirmed by ours, give us the present
amount of sand in the top half.• Our diffusion rate experiments show how fast sand is presentlytrickling (diffusing) out of the top half into the bottom half (the biotite).
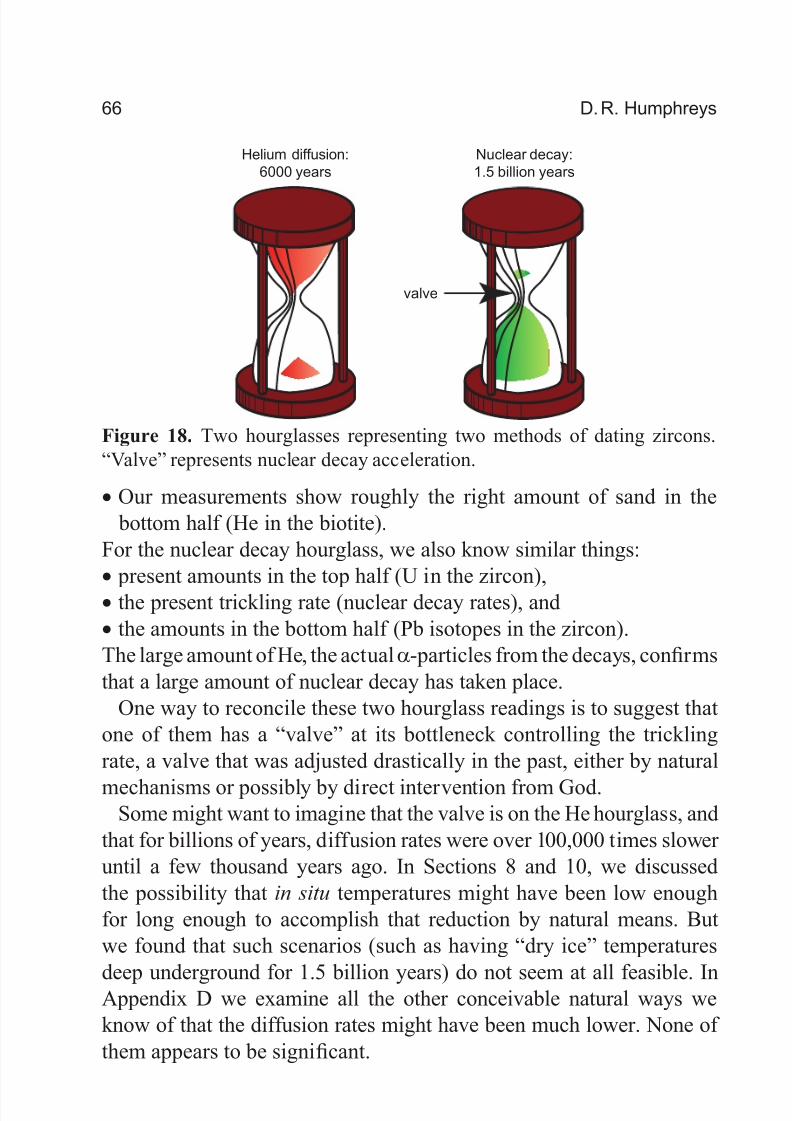
8/8/2019 Young Helium Diffusion Age of Zircons
http://slidepdf.com/reader/full/young-helium-diffusion-age-of-zircons 42/76
66 D. R. Humphreys
• Our measurements show roughly the right amount of sand in the bottom half (He in the biotite).
For the nuclear decay hourglass, we also know similar things:• present amounts in the top half (U in the zircon),• the present trickling rate (nuclear decay rates), and• the amounts in the bottom half (Pb isotopes in the zircon).The large amount of He, the actualα-particles from the decays, confirmsthat a large amount of nuclear decay has taken place.
One way to reconcile these two hourglass readings is to suggest thatone of them has a “valve” at its bottleneck controlling the tricklingrate, a valve that was adjusted drastically in the past, either by natural
mechanisms or possibly by direct intervention from God.Some might want to imagine that the valve is on the He hourglass, and
that for billions of years, diffusion rates were over 100,000 times slower until a few thousand years ago. In Sections 8 and 10, we discussedthe possibility that in situ temperatures might have been low enoughfor long enough to accomplish that reduction by natural means. Butwe found that such scenarios (such as having “dry ice” temperatures
deep underground for 1.5 billion years) do not seem at all feasible. InAppendix D we examine all the other conceivable natural ways weknow of that the diffusion rates might have been much lower. None of them appears to be significant.
valve
Helium diffusion:
6000 years
Nuclear decay:
1.5 billion years
Figure 18. Two hourglasses representing two methods of dating zircons.“Valve” represents nuclear decay acceleration.

8/8/2019 Young Helium Diffusion Age of Zircons
http://slidepdf.com/reader/full/young-helium-diffusion-age-of-zircons 43/76
Young Helium Diffusion Age of Zircons Supports Accelerated Nuclear Decay 67
Another possibility is that God may have changed diffusion rates by some drastic means, say by adjusting the laws of atomic physics
which control diffusion. But the laws of atomic physics also controlthe biochemical processes that sustain life. It is difficult to imagine(although God is not at all restricted by our weak imaginations) anysuch change in atomic physics that would have allowed life on earthto exist. Certainly the theorist would have a very large number of complicated consequences to explain.
On the other hand, it is much simpler to imagine that the valve is on
the nuclear decay hourglass. Nuclear forces affect only a tiny region atthe center of the atom. They have very little effect on the outer electronicstructure of the atom or its chemical interactions. Moreover, a relativelysmall change in nuclear forces can cause a billion-fold acceleration of nuclear decay rates [Chaffin, 2000, 2003; Humphreys, 2000]. Finally,the preponderance of Biblical and geoscience evidence for a youngworld [ Humphreys, 2000, pp. 337–339] points to a change that wouldonly affect dating methods which depend on slowly-decaying nuclei.
Thus our new diffusion data support the hypothesis we proposedin our first book [Vardiman, 2000, pp. 3–5], that God drasticallyaccelerated the decay rates of long half-life nuclei during the earth’srecent past. For a feasibility study of this hypothesis—including God’s possible purposes for such acceleration, Biblical passages hinting at it,disposal of excess heat, preserving life on earth, and effects on stars— see Humphreys [2000, pp. 333–379]. The last three problems are not yet
fully resolved, but we expect to see progress on them in future papers.The next section gives some of our thinking about the heat problem.
13. Disposing of Excess Heat
In the previous RATE book [ Humphreys, 2000, pp. 337, 369–370],my feasibility study of the accelerated decay hypothesis pointed out
and discussed one of the obvious problems: nuclear decay generatesheat! I wrote that without long periods of time in which the heat coulddissipate by normal mechanisms, or without some new and faster mechanism, crustal rocks
8/8/2019 Young Helium Diffusion Age of Zircons
http://slidepdf.com/reader/full/young-helium-diffusion-age-of-zircons 44/76
68 D. R. Humphreys
would melt many times over if decay rates were accelerated. I also pointed out that heat is not merely a problem for accelerated
decay, but also for all Creation or Flood models I know of.There is simply too much geological work to be done in too short a time.So the solution I outline here should be useful to any creationist geologicalmodel.
The RATE initiative has found several lines of evidence implying thatrapid cooling occurred along with accelerated nuclear decay, resultingin a smaller rise of temperature than would have occurred without such
cooling. Andrew Snelling’s successful model for the formation of Poradiohalos requires rapid cooling. He and Mark Armitage concluded,. . . the timescale for cooling of the granitic plutons was also extremelyshort, measured in half-lives of these isotopes (days, not years) [Snelling
and Armitage, 2003, p. 260].John Baumgardner solved a long-standing geothermal mystery byassuming a burst of heat from accelerated decay accompanied by rapidcooling [ Baumgardner , 2000, pp. 80–86]. In both these cases, mostof the cooling could not be by the normal processes of conduction,convection, or radiation. Instead, the process would have to cool theentire volume of material simultaneously (“volume” cooling) andabnormally fast.
The diffusion data in this chapter imply that after the zircons acquiredtheir He, they were never very much hotter than they are now, nor werethey hot for very long. For a simplified illustration of this, imagine
that the zircons experienced a high temperature T h for a short time Δt ,after which the temperature dropped abruptly to today’s level, T , andremained at that level for a time t until now. Let us say that during thehot period, the zircons did not lose more than 30% of their He, thushaving a retention fraction of 0.70. (Otherwise, t would have to be quitea bit less than 4000 years to allow the large retentions we observe.)Solving equation (14a) for a retention fraction Q/Q
0of 0.70 gives us the
value of x that would apply to the hot period:
(23)
Then equation (14c) gives us the diffusivity Dh
required to retain 70%
xh = × −2 9169 10 4.

8/8/2019 Young Helium Diffusion Age of Zircons
http://slidepdf.com/reader/full/young-helium-diffusion-age-of-zircons 45/76
Young Helium Diffusion Age of Zircons Supports Accelerated Nuclear Decay 69
of the He during time Δt :
(24)
Dividing equation (24) by a similar equation using D, x, and t gives usthe ratio of the “hot” diffusivity D
hto today’s diffusivity D:
(25)
If today’s diffusivity is on the “intrinsic” part of the curve, then wecan use equation (2) and a little algebra to give us the temperature T
h
during the hot spell in terms of the present temperature T :
(26)
Here R is the universal gas constant, 1.986 cal/mol/K, and E 0
is theactivation energy given in equation (5a). Let us take as an example the x-value and temperature (197°C = 470K) of point 3 in Table 3, and a t of 6000 years. Then for a Δt of 1 year, T
hwould be about 90°C above
today’s temperature. For a Δt of 1 month, T h
would be about 140°Chotter than today. If the heat pulse had been much hotter or longer thanthose typical values, the diffusion age we calculate would have beensignificantly less than 4000 years, an age not correlating to any known
geological event in the formation. In other words, our data and modelare consistent with at most a short, moderate pulse of heating duringand just after the accelerated decay episode.
It is very likely water was flowing through the cleavage planes of the biotite while it was hot [Snelling , 2005a, p. 133]. That would keep thesezircons cooler than zircons in a material like tuff [Snelling , 2005b, p. 276ff]without clear channels for water flow. But probably that mechanism
alone would not be enough to keep the temperature increase as low as90°C. Also, the heat carried by the water has to go somewhere else onearth, and that heat would be more than enough to melt the earth’s crustglobally. Thus we require significant volume cooling to compensate for
D b xt
hh=
π
2
∆
D
D
x
x
t
t
h h=∆
T T
RT
E
x t
x t
h
h
=−
1
0
ln∆
8/8/2019 Young Helium Diffusion Age of Zircons
http://slidepdf.com/reader/full/young-helium-diffusion-age-of-zircons 46/76
70 D. R. Humphreys
the otherwise large amount of heat from accelerated nuclear decay. Now let us explore a way such volume cooling might occur. In my
feasibility study, I pointed out [ Humphreys, 2000, pp. 370–373] a little-known and less-understood phenomenon in standard General Relativitytheory that seems quite relevant. The mechanism causes photons andmoving material particles in an expanding cosmos to lose energy[ Robertson and Noonan, 1968, pp. 343–344, 354–356; Landau and
Lifshitz , 1983, pp. 374–375; Ohanian and Ruffini, 1994, pp. 582–583; Rindler , 2001, p. 369]. The equations clearly show the loss of energy,
but where and how the energy goes is less clear. From the similarityof one of the equations to the thermodynamic conservation of energyin an expanding gas, Robertson and Noonan conclude (speaking of photons):
Therefore, the radiation energy which is lost in an expanding universe isused up as work in aiding the expansion.
But they do not specify how. Other writers say even less, leaving evenrelativity experts in considerable confusion about whether the lostenergy goes somewhere or simply disappears.
This mechanism offers good potential for removing heat on a largescale. We do not need to resolve the experts’ confusion about wherethe energy goes in order to utilize this mechanism. However, for thosewho would like some understanding of the phenomenon, I offer thefollowing very simplified explanation of my own.
If we take some Biblical and scientific clues seriously and think of
space as being an actual but non-perceived material [ Humphreys, 1994, pp. 66–68, 84, 89], then there is a way to understand the energy lossmechanism. Spacetime would be a “fabric” of three space dimensionsand one time dimension, a deformable surface in a “hyperspace” of four space dimensions and one time dimension [ Humphreys, 1994, pp. 93–96; Humphreys, 2002, pp. 100–101]. The fabric would be bentin the fourth (unperceived) direction with various curvatures. Particles
can move along the surface unhindered, but the surface constrains the particles to follow curved paths conforming to the bends in the surface.For example, if the “fabric” constrains a particle of mass m moving withnon-relativistic velocity v to follow a path whose radius of curvature is
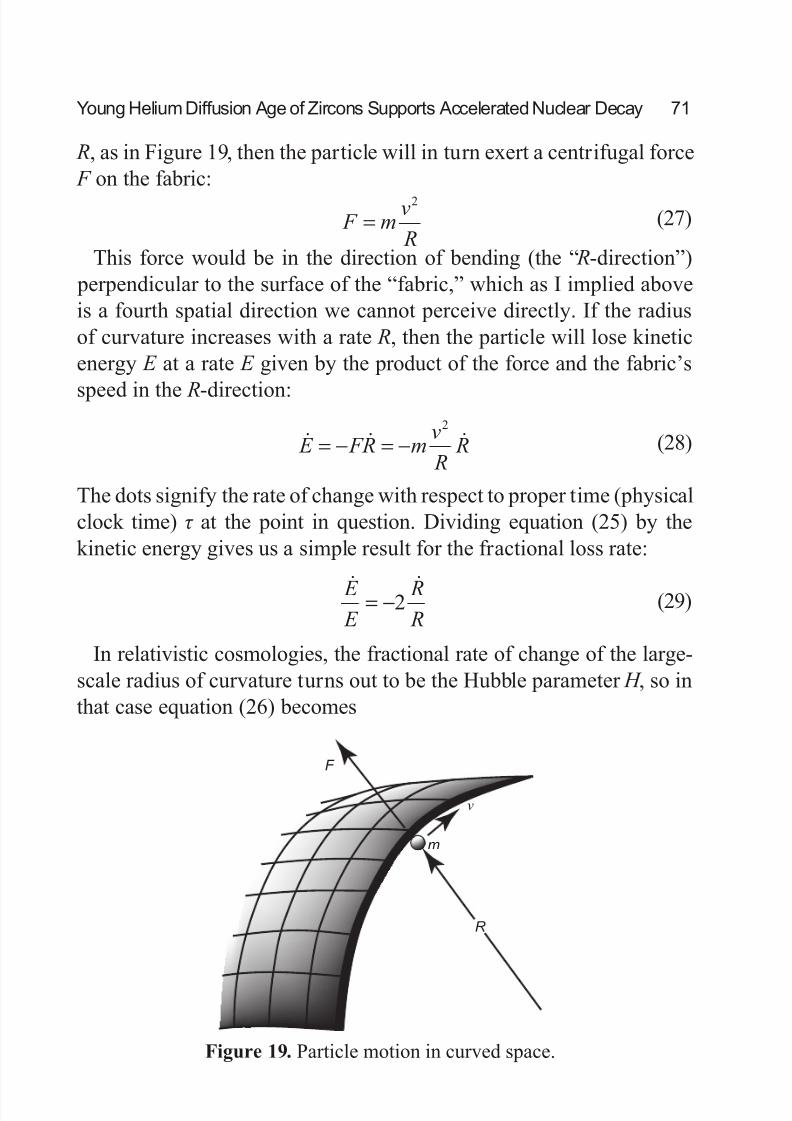
8/8/2019 Young Helium Diffusion Age of Zircons
http://slidepdf.com/reader/full/young-helium-diffusion-age-of-zircons 47/76

8/8/2019 Young Helium Diffusion Age of Zircons
http://slidepdf.com/reader/full/young-helium-diffusion-age-of-zircons 48/76
72 D. R. Humphreys
(30)
For photons and material particles of relativistic speeds, the result issimilar, but with a different numerical factor. This result is exactlythe same as the more rigorous general relativistic calculations give.This derivation shows us where the energy of a particle goes—it aidsthe expansion of the fabric, adding slightly to its kinetic energy. The particle and photon energy losses are by no means the main cause of
the expansion, but the losses are very significant compared to their ownenergies. Eventually, the textbooks say, a free particle having mass willlose all its kinetic energy and come to rest relative to the “fabric.”
Materialist academics will not like my derivation above because theydo not like ascribing physical reality to “hyperspace” (although they doallow it as a mathematical convenience) or ascribing physical substanceto spacetime. There appear to be deep-seated religious reasons for their dislike, as I pointed out in my cosmology book [ Humphreys, 1994, pp. 94–95]. But, as I mentioned above, it is not necessary to accept myexplanation to accept the loss mechanism itself.
As far as I can tell, the loss mechanism would apply not only to free particles, but also to particles under the influence of electromagneticforces (such as forces between atoms), because such forces wouldoperate entirely in the surface of the fabric, not adding vectoriallyto forces in the R-direction perpendicular to the surface. (The loss
mechanism might not apply to particles orbiting in local gravitationalfields, which come from local curvatures in the fabric superposed onthe cosmic curvature [Cooperstock et al., 1998].) That means that atomsand electrons moving thermally in a solid should also experience sucha loss of kinetic energy, that is, thermal energy. If there were no other inputs or outputs of energy to or from the particles, the temperatureT of the material would decrease in the same way as the energy in
equation (30):(31)
When the other inputs and outputs of heat are significant, this equation
E
E
H = −2
T
T H = −2
8/8/2019 Young Helium Diffusion Age of Zircons
http://slidepdf.com/reader/full/young-helium-diffusion-age-of-zircons 49/76
Young Helium Diffusion Age of Zircons Supports Accelerated Nuclear Decay 73
would not apply. Instead, we would have to include equation (30) as oneof the heat losses in the usual heat transport equations.
This mechanism would be insignificant if the Hubble parameter H has always had its present very small value. However, H would havea much higher value during periods of high time dilation, because itis the fractional rate of expansion as measured by proper time, timeas measured by local, physical, clocks. In contrast, we would expectthe rate of expansion to be governed by global parameters, which arein turn most closely related to ideal clocks synchronized with distant
clocks. As a first approximation, we could say that the expansion rateas measured by distant clocks would be roughly constant during the periods of interest. But our local clocks would be very slow relative todistant clocks during periods of high time dilation locally, so the rateof expansion as measured by our local clocks would then be very large.As I suggested in my cosmology book [ Humphreys, 1994, p. 68] and inmy previous RATE chapter [ Humphreys, 2000, pp. 367–368, 372–373],the Bible implies that two such episodes of expansion occurred, oneduring early Creation week and one during the Genesis Flood. Theseare the same two periods that seem most likely to have experiencedaccelerated nuclear decay, and there is probably a connection, as I pointed out [ Humphreys, 2000, 367–369].
The fact that we see destructive events (apparently occurring after the Fall of Adam) in the distant cosmos would be explained by a many-fold (at least an order of magnitude) expansion/time-dilation episode
during the year (as measured by our clocks) of the Genesis Flood. Thatwould make H during the Flood billions of times higher than today’svalue, and we would easily be able to get rid of all the excess radiogenicheat.
The real problem is how to keep non-radioactive materials fromgetting too cold at the same time. I have not had time to pursue this part of the idea further, so here I can only outline a speculation that
may turn out to provide a good explanation later.If the “fabric” of space is a real material, as Scripture implies[ Humphreys, 1994, pp. 67–68], then it must have a temperature. Ispeculate that its temperature might set a minimum on how much heat
8/8/2019 Young Helium Diffusion Age of Zircons
http://slidepdf.com/reader/full/young-helium-diffusion-age-of-zircons 50/76
74 D. R. Humphreys
could be transferred to the fabric during rapid expansion. For example,equation (31) might become:
(32)
where T min
is a minimum temperature that might depend on the amountof time dilation occurring at the moment. If T
minwere about 300 K
during the Genesis Flood, then creatures aboard the Ark could staywarm. Though this is sheer guesswork now, I am confident that a goodexplanation exists (whether or not we can find it). That is because (a)
the evidence convinces me that accelerated nuclear decay did indeedoccur, and (b) as one of Noah’s descendants, I know that his family didnot freeze to death aboard the Ark!
To summarize the heat problem, we have several lines of physicalevidence for volume cooling having occurred, and there is at least one promising theoretical approach we can try. When we can devote moretime to the problem, we may see good progress on it.
14. Conclusion
The experiments the RATE project commissioned have clearlyconfirmed the numerical predictions of our Creation model (updatedslightly in Section 7), which we published beforehand [ Humphreys,2000, p. 348, Figure 7]. Other experimental data published since the beginning of our experiments agree with our data. The data also clearly
reject the uniformitarian model. The data and our analysis show thatover a billion years worth of nuclear decay has occurred very recently, between 4000 and 8000 years ago. This strongly supports our hypothesisof recent episodes of highly accelerated nuclear decay.
These diffusion data are not precise enough to reveal details about theacceleration episodes. Were there one, two, or three? Were they duringearly Creation week, after the Fall, or during the Flood? Were there
only 500 to 600 million years worth of acceleration during the year of the Flood, with the rest of the acceleration occurring before that? Wecannot say from this analysis. However, the fact that these zircons arefrom a Precambrian rock unit sheds some light on various creationist
T H T T = − −2 ( )min
8/8/2019 Young Helium Diffusion Age of Zircons
http://slidepdf.com/reader/full/young-helium-diffusion-age-of-zircons 51/76
Young Helium Diffusion Age of Zircons Supports Accelerated Nuclear Decay 75
models about when strata below the Cambrian formed. We can saythat the “diffusion clock” requires a large amount of nuclear decay
to have taken place within thousands of years ago, after the zircons became solid. At whatever time in Biblical history Precambrian rockscame into existence, these data suggest that “1.5 billion years” worth of nuclear decay took place after the rocks solidified not long ago. Sincethe Phanerozoic strata usually give nuclear dates of 545 Ma or less, our zircons started accumulating He a significant time before the GenesisFlood began depositing the major fossil layers.
Previously we have presented the technical data in this chapter inthree different scientific venues. The first was at the Fifth InternationalConference on Creationism in Pittsburgh, Pennsylvania, U. S. A.,August 4–9, 2003, and archived in its Proceedings [ Humphreys et al.,2003a]. Then we presented new results in a poster and an abstract at theAmerican Geophysical Union Annual Fall Meeting in San Francisco inDecember 2003, with the abstract being published in the Transactions of that organization [ Humphreys et al., 2003b]. Last, the Creation
Research Society Quarterly documented the new data and results in itsJune 2004 issue [ Humphreys et al., 2004].
Our most important result is this: He diffusion casts doubt on
uniformitarian long-age interpretations of nuclear data and strongly
supports the young world of Scripture.
Acknowledgments
Many people and institutions have contributed to collecting andinterpreting these data. In particular, we would like to express our appreciation to Robert Gentry for his seminal research and goodadvice, to Los Alamos National Laboratory for giving us the FentonHill samples, to Yakov Kapusta and Activation Laboratories, Ltd.,for processing them, to Mark Armitage for his microscope work, to
William (Bill) Hoesch for his laboratory work, to Roger Lenard andMajdah Al-Qutani of Zodiac Mining and Manufacturing, Inc., for itsservices as intermediary, and especially to the donors whose generositymade this work possible.
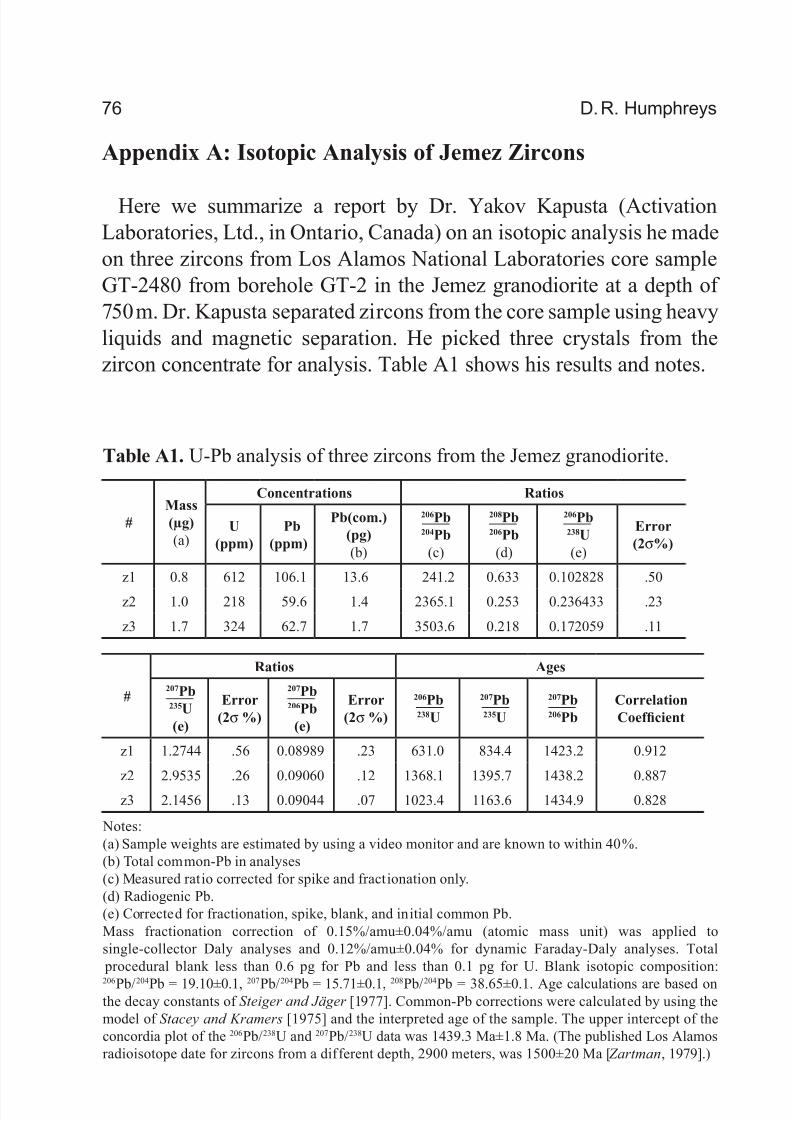
8/8/2019 Young Helium Diffusion Age of Zircons
http://slidepdf.com/reader/full/young-helium-diffusion-age-of-zircons 52/76
76 D. R. Humphreys
Appendix A: Isotopic Analysis of Jemez Zircons
Here we summarize a report by Dr. Yakov Kapusta (ActivationLaboratories, Ltd., in Ontario, Canada) on an isotopic analysis he madeon three zircons from Los Alamos National Laboratories core sampleGT-2480 from borehole GT-2 in the Jemez granodiorite at a depth of 750 m. Dr. Kapusta separated zircons from the core sample using heavyliquids and magnetic separation. He picked three crystals from thezircon concentrate for analysis. Table A1 shows his results and notes.
#
Mass
(µg)
(a)
Concentrations Ratios
U
(ppm)
Pb
(ppm)
Pb(com.)
(pg)
(b)
206Pb204Pb
(c)
208Pb206Pb
(d)
206Pb238U
(e)
Error
(2σ%)
z1 0.8 612 106.1 13.6 241.2 0.633 0.102828 .50
z2 1.0 218 59.6 1.4 2365.1 0.253 0.236433 .23
z3 1.7 324 62.7 1.7 3503.6 0.218 0.172059 .11
#
Ratios Ages
207Pb235U
(e)
Error
(2σ %)
207Pb206Pb
(e)
Error
(2σ %)
206Pb238U
207Pb235U
207Pb206Pb
Correlation
Coefficient
z1 1.2744 .56 0.08989 .23 631.0 834.4 1423.2 0.912
z2 2.9535 .26 0.09060 .12 1368.1 1395.7 1438.2 0.887
z3 2.1456 .13 0.09044 .07 1023.4 1163.6 1434.9 0.828
Notes:(a) Sample weights are estimated by using a video monitor and are known to within 40%.(b) Total common-Pb in analyses(c) Measured ratio corrected for spike and fractionation only.(d) Radiogenic Pb.(e) Corrected for fractionation, spike, blank, and initial common Pb.Mass fractionation correction of 0.15%/amu±0.04%/amu (atomic mass unit) was applied tosingle-collector Daly analyses and 0.12%/amu±0.04% for dynamic Faraday-Daly analyses. Total
procedural blank less than 0.6 pg for Pb and less than 0.1 pg for U. Blank isotopic composition:206Pb/204Pb = 19.10±0.1, 207Pb/204Pb = 15.71±0.1, 208Pb/204Pb = 38.65±0.1. Age calculations are based onthe decay constants of Steiger and Jäger [1977]. Common-Pb corrections were calculated by using themodel of Stacey and Kramers [1975] and the interpreted age of the sample. The upper intercept of theconcordia plot of the 206Pb/238U and 207Pb/238U data was 1439.3 Ma±1.8 Ma. (The published Los Alamosradioisotope date for zircons from a different depth, 2900 meters, was 1500±20 Ma [ Zartman, 1979].)
Table A1. U-Pb analysis of three zircons from the Jemez granodiorite.
8/8/2019 Young Helium Diffusion Age of Zircons
http://slidepdf.com/reader/full/young-helium-diffusion-age-of-zircons 53/76
Young Helium Diffusion Age of Zircons Supports Accelerated Nuclear Decay 77
Appendix B: Diffusion Rates in Biotite
Following are two reports by our diffusion experimenter (with our
comments in brackets) on his measurements of He diffusion in biotite
from two locations. As far as we know, these are the only He-in-biotite
diffusion data that have been reported. The first sample, BT-1B, was from
the Beartooth amphibolite near Yellowstone National Park. The second
sample, GT-2, was from the Jemez granodiorite, borehole GT-2, from
a depth of 750 m. The geology laboratory at the Institute for CreationResearch extracted the biotite from both rock samples by crushing,
density separation with heavy liquids, and magnetic separation. The
experimenter sieved both samples to get flakes between 75 and 100µm
in diameter. Taking half of the average diameter to get an effective
radius of 44µm, we plotted the resulting diffusion coefficients for the
GT-2 sample in Figure 9. We plotted the muscovite data in Figure 9
using the effective radius recommended in the report [ Lippolt and Weigel , 1988], 130µm.
Results of He Diffusion on Zodiac Biotite, BT-1B
(Beartooth Amphibolite) October 18, 2000
Experiment:
Approximately 10 mg of biotite BT-1B, sieved to be between 75 and100 µm, was subjected to step heating. Steps ranged in temperature from
50°C to 500°C in 50°C increments, with an estimated uncertainty on T
of < 3ºC. Durations ranged from 6 to 60 minutes, with longer durations
at lower temperatures; uncertainty on time is < 1% for all steps. After
the ten steps the partially degassed biotite was fused to establish the
total amount of He in the sample. Helium was measured by isotope
dilution quadrupole mass spectrometry, with an estimated precision of 2%. Helium diffusion coefficients were computed using the equations
of Fechtig and Kalbitzer [1966] assuming spherical geometry.
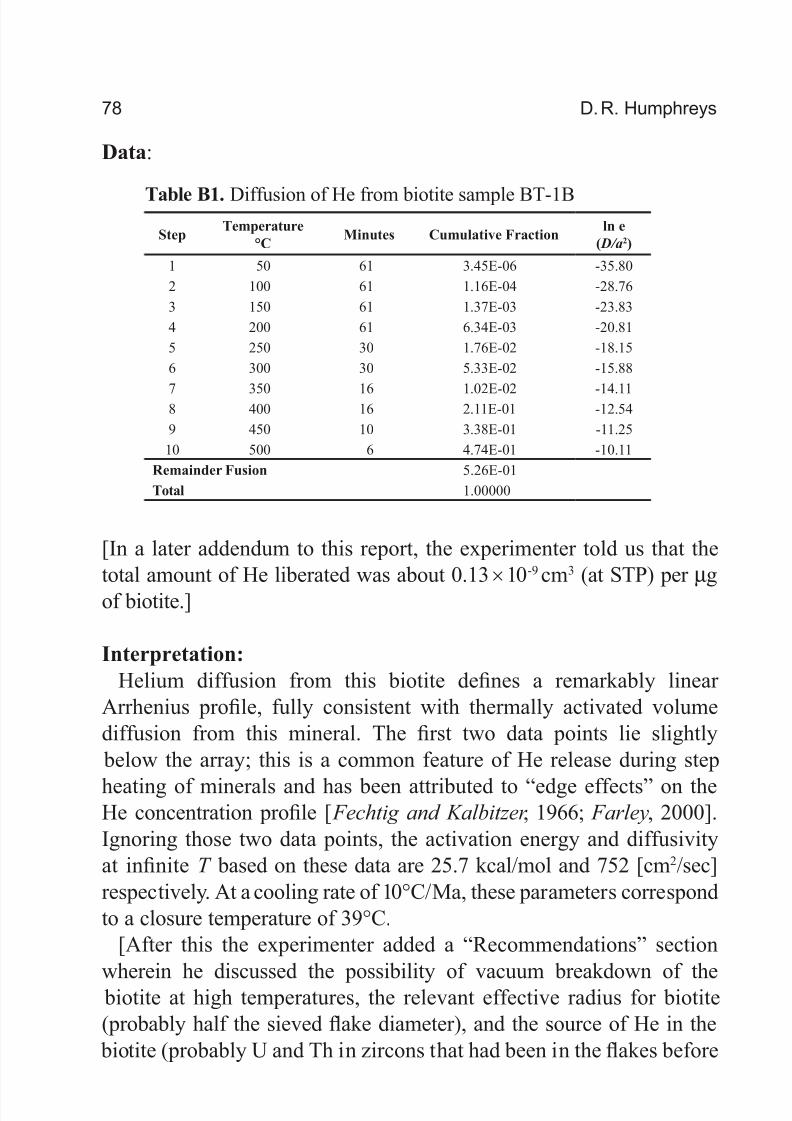
8/8/2019 Young Helium Diffusion Age of Zircons
http://slidepdf.com/reader/full/young-helium-diffusion-age-of-zircons 54/76
78 D. R. Humphreys
Data:
[In a later addendum to this report, the experimenter told us that thetotal amount of He liberated was about 0.13×10⁻⁹ cm3 (at STP) per µgof biotite.]
Interpretation:
Helium diffusion from this biotite defines a remarkably linear Arrhenius profile, fully consistent with thermally activated volumediffusion from this mineral. The first two data points lie slightly below the array; this is a common feature of He release during step
heating of minerals and has been attributed to “edge effects” on theHe concentration profile [ Fechtig and Kalbitzer , 1966; Farley, 2000].Ignoring those two data points, the activation energy and diffusivityat infinite T based on these data are 25.7 kcal/mol and 752 [cm2/sec]respectively. At a cooling rate of 10°C/Ma, these parameters correspondto a closure temperature of 39°C.
[After this the experimenter added a “Recommendations” section
wherein he discussed the possibility of vacuum breakdown of the biotite at high temperatures, the relevant effective radius for biotite(probably half the sieved flake diameter), and the source of He in the biotite (probably U and Th in zircons that had been in the flakes before
StepTemperature
°CMinutes Cumulative Fraction
ln e
( D/a2)
1 50 61 3.45E-06 -35.80
2 100 61 1.16E-04 -28.76
3 150 61 1.37E-03 -23.83
4 200 61 6.34E-03 -20.81
5 250 30 1.76E-02 -18.15
6 300 30 5.33E-02 -15.88
7 350 16 1.02E-02 -14.118 400 16 2.11E-01 -12.54
9 450 10 3.38E-01 -11.25
10 500 6 4.74E-01 -10.11
Remainder Fusion 5.26E-01
Total 1.00000
Table B1. Diffusion of He from biotite sample BT-1B
8/8/2019 Young Helium Diffusion Age of Zircons
http://slidepdf.com/reader/full/young-helium-diffusion-age-of-zircons 55/76
Young Helium Diffusion Age of Zircons Supports Accelerated Nuclear Decay 79
separation). We decided none of these questions were important enoughto investigate in detail for now, since this sample was not from a site
we were interested in at the time. It merely happened to be on handat the Institute for Creation Research geology laboratory, making itideal for an initial run to look for possible difficulties in experimentaltechnique.]
Results of He Diffusion Experiment on Zodiac Biotite, GT2
[Jemez Granodiorite] March 24, 2001
Experiment:
Approximately 10 mg of biotite GT-2, sieved to be between 75 and100 µm, was subjected to step heating. Steps ranged in temperaturefrom 50°C to 500°C in 50°C increments, with an estimated uncertaintyon T of <3°C. Durations ranged from seven to 132 minutes, with longer durations at lower temperatures; uncertainty on time is <1% for allsteps. After eleven steps of increasing T , the sample was brought back tolower temperature, and then heated in six more T -increasing steps. After the seventeen steps the partially degassed biotite was fused to establishthe total amount of He in the sample. Helium was measured by isotopedilution quadrupole mass spectrometry, with an estimated precision of 2% (steps 12 and 13 are much more uncertain owing to low gas yield).Helium diffusion coefficients were computed using the equations of Fechtig and Kalbitzer [1966] assuming spherical geometry.
Data:
See Table B2. [In a later addendum to this report, the experimenter told us that the total amount of He liberated was about 0.32 × 10 -9 cm3 (at STP) per µg of biotite.]
Interpretation:
Helium diffusion in this sample follows a rather strange pattern, witha noticeable curve at intermediate temperatures. I have no obviousexplanation for this phenomenon. Because biotite BT-1B did not showthis curve, I doubt it is vacuum breakdown. I ran more steps, with a
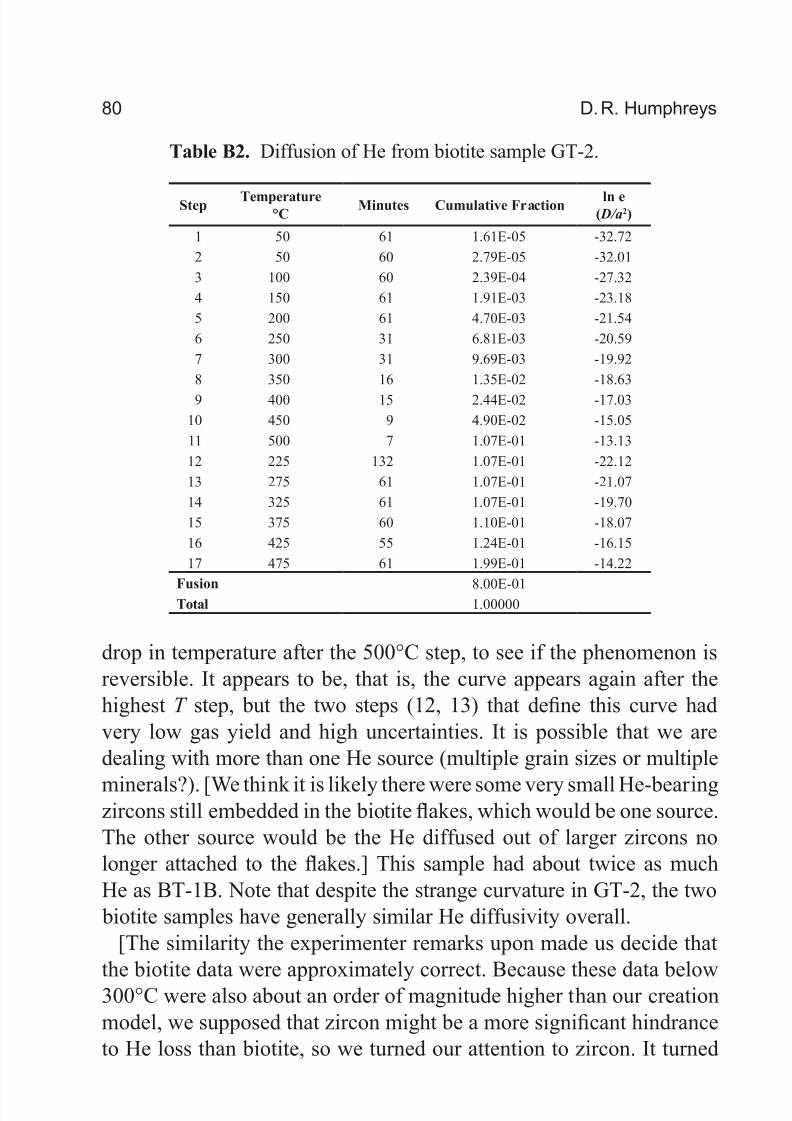
8/8/2019 Young Helium Diffusion Age of Zircons
http://slidepdf.com/reader/full/young-helium-diffusion-age-of-zircons 56/76
80 D. R. Humphreys
drop in temperature after the 500°C step, to see if the phenomenon isreversible. It appears to be, that is, the curve appears again after thehighest T step, but the two steps (12, 13) that define this curve hadvery low gas yield and high uncertainties. It is possible that we aredealing with more than one He source (multiple grain sizes or multiple
minerals?). [We think it is likely there were some very small He-bearingzircons still embedded in the biotite flakes, which would be one source.The other source would be the He diffused out of larger zircons nolonger attached to the flakes.] This sample had about twice as muchHe as BT-1B. Note that despite the strange curvature in GT-2, the two biotite samples have generally similar He diffusivity overall.
[The similarity the experimenter remarks upon made us decide thatthe biotite data were approximately correct. Because these data below300°C were also about an order of magnitude higher than our creationmodel, we supposed that zircon might be a more significant hindranceto He loss than biotite, so we turned our attention to zircon. It turned
Step Temperature°C
Minutes Cumulative Fraction ln e( D/a2)
1 50 61 1.61E-05 -32.72
2 50 60 2.79E-05 -32.01
3 100 60 2.39E-04 -27.32
4 150 61 1.91E-03 -23.18
5 200 61 4.70E-03 -21.54
6 250 31 6.81E-03 -20.59
7 300 31 9.69E-03 -19.92
8 350 16 1.35E-02 -18.63
9 400 15 2.44E-02 -17.03
10 450 9 4.90E-02 -15.05
11 500 7 1.07E-01 -13.13
12 225 132 1.07E-01 -22.12
13 275 61 1.07E-01 -21.07
14 325 61 1.07E-01 -19.70
15 375 60 1.10E-01 -18.07
16 425 55 1.24E-01 -16.15
17 475 61 1.99E-01 -14.22
Fusion 8.00E-01Total 1.00000
Table B2. Diffusion of He from biotite sample GT-2.

8/8/2019 Young Helium Diffusion Age of Zircons
http://slidepdf.com/reader/full/young-helium-diffusion-age-of-zircons 57/76
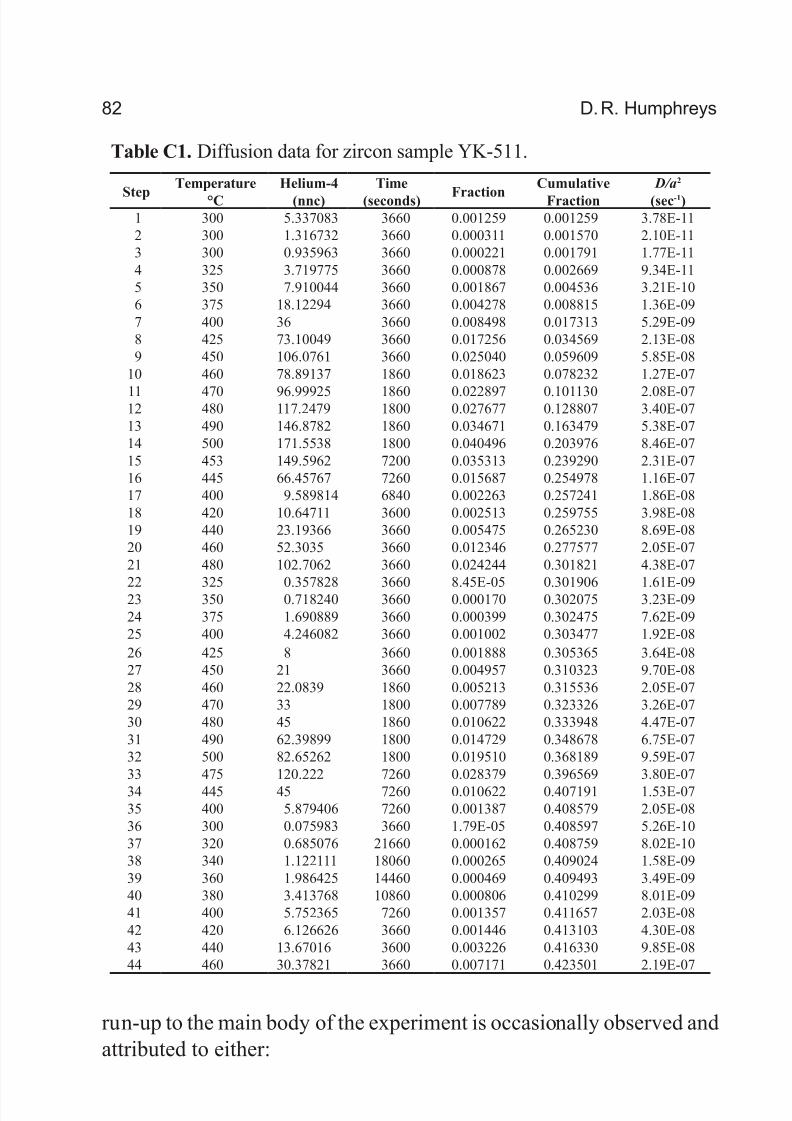
8/8/2019 Young Helium Diffusion Age of Zircons
http://slidepdf.com/reader/full/young-helium-diffusion-age-of-zircons 58/76
82 D. R. Humphreys
run-up to the main body of the experiment is occasionally observed andattributed to either:
Step
Temperature
°C
Helium-4
(nnc)
Time
(seconds) Fraction
Cumulative
Fraction
D/a2
(sec-1)
1 300 5.337083 3660 0.001259 0.001259 3.78E-112 300 1.316732 3660 0.000311 0.001570 2.10E-113 300 0.935963 3660 0.000221 0.001791 1.77E-114 325 3.719775 3660 0.000878 0.002669 9.34E-115 350 7.910044 3660 0.001867 0.004536 3.21E-106 375 18.12294 3660 0.004278 0.008815 1.36E-097 400 36 3660 0.008498 0.017313 5.29E-098 425 73.10049 3660 0.017256 0.034569 2.13E-089 450 106.0761 3660 0.025040 0.059609 5.85E-08
10 460 78.89137 1860 0.018623 0.078232 1.27E-07
11 470 96.99925 1860 0.022897 0.101130 2.08E-0712 480 117.2479 1800 0.027677 0.128807 3.40E-0713 490 146.8782 1860 0.034671 0.163479 5.38E-0714 500 171.5538 1800 0.040496 0.203976 8.46E-0715 453 149.5962 7200 0.035313 0.239290 2.31E-0716 445 66.45767 7260 0.015687 0.254978 1.16E-0717 400 9.589814 6840 0.002263 0.257241 1.86E-0818 420 10.64711 3600 0.002513 0.259755 3.98E-0819 440 23.19366 3660 0.005475 0.265230 8.69E-0820 460 52.3035 3660 0.012346 0.277577 2.05E-0721 480 102.7062 3660 0.024244 0.301821 4.38E-07
22 325 0.357828 3660 8.45E-05 0.301906 1.61E-0923 350 0.718240 3660 0.000170 0.302075 3.23E-0924 375 1.690889 3660 0.000399 0.302475 7.62E-0925 400 4.246082 3660 0.001002 0.303477 1.92E-0826 425 8 3660 0.001888 0.305365 3.64E-0827 450 21 3660 0.004957 0.310323 9.70E-0828 460 22.0839 1860 0.005213 0.315536 2.05E-0729 470 33 1800 0.007789 0.323326 3.26E-0730 480 45 1860 0.010622 0.333948 4.47E-0731 490 62.39899 1800 0.014729 0.348678 6.75E-0732 500 82.65262 1800 0.019510 0.368189 9.59E-0733 475 120.222 7260 0.028379 0.396569 3.80E-0734 445 45 7260 0.010622 0.407191 1.53E-0735 400 5.879406 7260 0.001387 0.408579 2.05E-0836 300 0.075983 3660 1.79E-05 0.408597 5.26E-1037 320 0.685076 21660 0.000162 0.408759 8.02E-1038 340 1.122111 18060 0.000265 0.409024 1.58E-0939 360 1.986425 14460 0.000469 0.409493 3.49E-0940 380 3.413768 10860 0.000806 0.410299 8.01E-0941 400 5.752365 7260 0.001357 0.411657 2.03E-0842 420 6.126626 3660 0.001446 0.413103 4.30E-0843 440 13.67016 3600 0.003226 0.416330 9.85E-0844 460 30.37821 3660 0.007171 0.423501 2.19E-07
Table C1. Diffusion data for zircon sample YK-511.
8/8/2019 Young Helium Diffusion Age of Zircons
http://slidepdf.com/reader/full/young-helium-diffusion-age-of-zircons 59/76
Young Helium Diffusion Age of Zircons Supports Accelerated Nuclear Decay 83
(1) A rounded He concentration profile in the zircons, such that theinitial He release is anomalously retarded. In other words, the He
concentration profile is shallower than the computational modelused to estimate diffusivities assumes. This effect goes away asthe experiment proceeds and the effects of the initial concentration profile become less significant. This rounding could be due to slowcooling or possibly to recent reheating.
(2) The change in slope might be due to changes in the zircons duringthe heating experiment. For example, it is possible that annealing
of radiation damage has occurred. This sample has a very highHe yield (540 nmol/g) so radiation damage is likely. However thezircons were only marginally within the window where radiationdamage is thought to anneal in zircons, so this hypothesis is deemedless likely.
Consideration of geologic history and/or further experiments arenecessary to firmly distinguish between these possibilities.
Conclusion:
The most reasonable conclusion from the data is that the main bodyof the experiment, steps 15–44, yields the best estimate of the closuretemperature, about 130°C. This is somewhat cooler than we haveobserved before in zircons though the database is not large. Radiationdamage may be important in the He release kinetics from this He-richsample.
[End of report by diffusion experimenter.]
Appendix D: Effects of the Interface and of Model Variations
Recently a critic sought very hard to find loopholes in our arguments.While his critique is unpublished and none of his points had anysignificant impact on our conclusions, it is worthwhile to review the
specifics of his critique and answer them here. The critic felt a crucialissue was the possibility that the interface between zircon and biotitemight slow or stop He diffusion because of He having different chemical
potentials or solubilities in those two minerals, or because of interface
8/8/2019 Young Helium Diffusion Age of Zircons
http://slidepdf.com/reader/full/young-helium-diffusion-age-of-zircons 60/76
84 D. R. Humphreys
resistance between them due to other causes. In the next three sectionswe will explain those terms and quantify their effects.
D.1 Differences in Chemical Potential
A diffusion theorist [Manning , 1968, section 5-3, p. 180, equation5-36] expresses the chemical potential , µ, for He atoms constituting afraction N of all the atoms in a crystal at temperature T as the sum of two parts:
(D1)
where k is the Boltzmann constant. The first term on the right, the“entropy of mixing,” contains no information related to the forces between atoms. The second term, µ́ , is the one we are interested in.It is the contribution from all other factors, particularly the interactionenergy between He and the other atoms of the crystal.
The same theorist [Manning , 1968, section 5-3, p. 180, equations5-37 and 5-39] then expresses the flux J of He atoms in the x-directionthrough a region with diffusivity D as:
(D2)
The first term on the right represents ordinary diffusion. It is thesecond term that represents an additional flux due to a driving force,
the gradient of µ́ . This force originates in whatever chemical attractionthe He atom might have for the atoms of the crystal in which it resides.Inside the crystal, these forces average to zero, but at the interface withanother crystal, there may be a jump in µ́ . If a He atom were to havegreater chemical attraction for the atoms of zircon than for the atoms of biotite, that would result in a force at the interface hindering its outwardmotion into the biotite. The question we need to address is, “Just how
great is the effect?”Because He is one of the noble gases, we might suspect that it wouldhave very little chemical attraction for any other atoms. In fact, Heis the least chemically active of all the noble gases [ Holloway, 1968,
µ µ = + ′kT N ln
J DC
x
DC
kT x= −
∂∂
−∂ ′∂µ

8/8/2019 Young Helium Diffusion Age of Zircons
http://slidepdf.com/reader/full/young-helium-diffusion-age-of-zircons 61/76
Young Helium Diffusion Age of Zircons Supports Accelerated Nuclear Decay 85
p. 45, Table 2.1]. Nevertheless it does exhibit a faint attraction for other atoms. Theory and experiments [Wilson et al ., 1988, p. 936, Table XI]
show that He atoms adhere very slightly to the surfaces of alkali halidecrystals, with interaction potentials on the order of a few hundredcalories per mole of He. The largest estimated potential is 293.4cal/mol, at the “saddle point” between the Na and F ions at the surfaceof NaF. The smallest potential listed is beside a Cl ion at the surface of NaCl, 111.7 cal/mol.
The difference of those potentials provides an estimate of the
difference of µ́ at an interface between NaF and NaCl: 181.7 cal/mol, or 0.00788 eV per He atom. Because noble gases have a greater chemicalaffinity for halides [ Holloway, 1968, p. 89] than for most other ions, theabove number is almost certainly greater than the corresponding number for the silicate minerals we are considering. So at the interface betweenzircon and biotite, we can take the following value as a generous upper bound on the magnitude (absolute value) of the difference in µ́ :
(D3)
Now we need to quantify the effect of that difference on the flux of He atoms in equation (D2). As we did in Sections 7 and 8, we assumefor simplicity that the diffusivity D is the same for biotite as for zircon,and therefore constant across the interface. Because the observed valueof C in the biotite is hundreds of times smaller than in the zircon (this
chapter, Section 10), the magnitude of the change in concentration,∆C , across the interface is nearly equal to the concentration C in thezircon:
(D4)
Assuming that the changes ∆C and ∆µ́ both occur within roughly thesame small distance δ x, the width of the interface, the He flux J in
equation (D2) becomes:
(D5)
∆ ′ <µ 0 0079. eV/atom
∆C C ≈
J DC
x D
C
x kT ≈ − −
′∆ ∆ ∆δ δ
µ
8/8/2019 Young Helium Diffusion Age of Zircons
http://slidepdf.com/reader/full/young-helium-diffusion-age-of-zircons 62/76
86 D. R. Humphreys
To make this mechanism a viable possibility for rescuing theuniformitarian scenario, the second term on the right-hand side must
be: (1) of opposite sign to the first (∆µ́ must be negative, meaning Heis more attracted to zircon than biotite), and (2) large enough to reduce J to a level about 100,000 times lower than what the first term alonewould give. That could reduce the He flow enough to let the zirconretain the He for 1.5 billion years. In the coolest sample we analyzed, at100°C, the average thermal energy kT of the atoms was 0.0321 eV. Then| ∆µ́ / kT | would be less than 0.246 for that sample, and even smaller
for the hotter samples. That makes the magnitude of the second termless than 25% of that of the first term for all the samples we analyzed.However, our upper bound on the value of ∆µ́ based on the chemicalaffinity of He with alkali halides is likely at least an order of magnitudelarger than the actual value. So a magnitude of the second term lessthan 2.5% of the first term is probably more realistic. The secondterm obviously does not provide the large reduction of He flow theuniformitarian scenario requires.
However, an even more basic consideration shows our measurement procedures have already accounted for such differences. We note thatthe magnitude of ∆µ́ is several times greater for a zircon-vacuuminterface than for a zircon-biotite interface. That is, the attraction of aHe atom for the biotite it is entering partly cancels its attraction for thezircon it is leaving. But our experimenter measured the diffusivities of zircons in a vacuum. So the zircon diffusivities we report in Table 2
already include the effect of a stronger interface reflection than wouldexist for the zircons in their natural biotite setting. So however strongor weak the “chemical potential” interface effect may be, our measureddiffusivities already account for it in a way that is generous to theuniformitarian model.
D.2 Solubility
Solubility in this context corresponds to the maximum number of He atoms one gram of crystal can absorb per bar of pressure [Weast ,1986, p. 101]. The critic used the term as a measure of the difficulty

8/8/2019 Young Helium Diffusion Age of Zircons
http://slidepdf.com/reader/full/young-helium-diffusion-age-of-zircons 63/76
Young Helium Diffusion Age of Zircons Supports Accelerated Nuclear Decay 87
with which a He atom could enter biotite. As a hypothetical example,if all the spaces between atoms in biotite were much smaller than thediameter of a He atom, then He could never enter the crystal, so Hewould be completely insoluble in biotite. If an α-decaying nucleusinside the biotite were to generate a He atom therein, then the atomcould distort the lattice and push its way out. The crystal would have asmall but non-zero He diffusivity and zero solubility.
However, real minerals have non-zero solubilities. The solubilities of He in obsidian and basaltic glass between 200° and 300°C, for example,
are on the order of 50 nmol/g per bar [ Jambon and Shelby, 1980, Figure2c] and on the same order in other minerals [ Broadhurst et al ., 1992].The solubility of He in biotite has not been measured (we were the firstto measure even diffusivity for that pair of substances), so we must finda way to estimate its effect in this case.
One way is to consider the interaction potential part µ́ of the chemical potential we mentioned in the previous section. For a He atom near the
surface of a crystal, the gradient of the potential is negative, makingthe force attractive. But the force can become repulsive for a He atomentering a tightly packed crystal. For example, imagine that a Heatom has to come very close to an O atom. If their nuclei are closer together than 2.94 Å (1 Å = 1 angstrom = 1 × 10⁻⁸ cm ≈ diameter of aneutral H atom), the force between the two atoms is repulsive [ Kar and
Chakravarty, 2001, Table I, σos
column and gradient of their equation
2].However the space between silicate sheets in biotite is much larger than that [ Deer et al ., 1962, Vol. 3, pp. 1–3, 55; Dahl , 1996, Figure 1and Table 4]. The large spacing is the reason the diffusivity of He in biotite (section 5, Figure 9) is about ten times higher than in zircon,which has tighter spacing [ Deer et al ., 1962, Vol. 1, pp. 59–68]. Therelative spacings and diffusivities imply the solubility of He in biotiteis greater than in zircon, so the force related to solubility, included inthe gradient of µ́ , would tend to push He atoms out of zircon and into biotite. Hence their respective solubilities would not hinder He outflowfrom the zircon but rather enhance it.
8/8/2019 Young Helium Diffusion Age of Zircons
http://slidepdf.com/reader/full/young-helium-diffusion-age-of-zircons 64/76
88 D. R. Humphreys
D.3 Interface Resistance
Our critic also postulated some type of interface resistance arisingfrom special distortion of the crystalline lattices at the interface between zircon and biotite. We can model such hypothetical interfaceresistance [Crank , 1975, p. 40, section 3.4.1] as a very thin layer of verylow diffusivity between the zircon and biotite. The concentration of He would drop rapidly across the layer, approximating a discontinuouschange of concentration between zircon and biotite. Such a layer might
consist of physically or chemically altered zircon or biotite. Typicalinterface layers, such as oxides on metals, range from a few dozenangstroms to hundreds of angstroms in thickness.
Let us estimate how low the diffusivity D of the interface would haveto be in order to retain the He in the zircon for 1.5 billion years. Since D is supposed to be much lower than the diffusivities of both zircon and biotite, we can approximate the situation as a hollow sphere with a wallof diffusivity D having an inner radius a and outer radius b. A source(representing nuclear decay) inside the sphere generates He at a steadyrate q
0, and the He diffuses through the wall out into a vacuum outside
the sphere. Textbooks show [Carslaw and Jaeger , 1959, section 9.2, p. 231, equation (7), Q
0→ q
0, K → D, υ
1→ C, υ
2→ 0] that the steady-
state He outflow q0
is
(D6)
where C is the steady-state concentration of He inside the sphere.Taking the wall thickness δ (b=a+ δ) to be small compared toa (δ<<a), integrating q
0for time t , and C over the sphere volume
(Section 7, equation 16) gives us the ratio of He retained, Q, to total Hegenerated, Q
0:
(D7)
Turning this around gives us the interface diffusivity D required toretain a fraction Q/Q
0of He for time t in a zircon of effective radius a
q DC ab
b a
0 4=
−
π
Q
Q
a
D t 0 3≈
δ
8/8/2019 Young Helium Diffusion Age of Zircons
http://slidepdf.com/reader/full/young-helium-diffusion-age-of-zircons 65/76
Young Helium Diffusion Age of Zircons Supports Accelerated Nuclear Decay 89
surrounded by an interface of thickness δ:
(D8)
For example, with a (large) interface thickness of 300 Å, a= 30 µm,and a time of 1.5 billion years, the 17% retention of sample 3 requiresan interface diffusivity of
(D9)
This is over one billion times lower than the diffusivities we measuredin biotite (Section 5, Figure 9) and zircon (Section 5, Figure 8) at thesame temperature, 197°C. To see whether this is an achievable value or not, let us examine an example the critic gave for physical alteration of the minerals at the zircon-biotite interface.
The critic suggested that when biotite crystallizes around a zircon,it possibly forms with its silicate sheets (along which are the cleavage planes) everywhere parallel to the surface of the zircon, so that the biotite wraps up the zircon like layers of cellophane. But in the hundredsof thousands of zircon-containing biotite flakes that we ourselves haveobserved under the microscope [Snelling and Armitage, 2003; Snelling et al ., 2003; Snelling , 2005a], the silicate sheets remain parallel allthe way to the edge of the zircon crystal and do not wrap around theincluded zircons. A Los Alamos report has a photo of a radiohalo in
biotite from borehole GT-2 showing the biotite cleavage staying parallelto itself, running right up against the zircon, and not becoming parallelto the zircon surface [ Laughlin and Eddy, 1977, Figure 6, p. 18]. Thereis simply no observational support for the critic’s hypothesis that layersof biotite totally envelop an included zircon.
However, for the sake of having a specific illustration of interfaceresistance, let us indulge the critic and imagine that a few dozen of
the biotite layers closest to the zircon wrap around it, having a totalinterface thickness of 300 Å. We will even imagine that there are noopenings in the biotite wrapping at the edges and corners of the zirconfaces. In that case, diffusion in the interface would have to take place
D aQ Q t
≈ δ 3 0( / )
D ≈ × −3 8 10 25 2. /seccm

8/8/2019 Young Helium Diffusion Age of Zircons
http://slidepdf.com/reader/full/young-helium-diffusion-age-of-zircons 66/76
90 D. R. Humphreys
in the harder direction, perpendicular to the silicate sheets rather than parallel to them.
Let us estimate the diffusivity in that harder direction. Measurementsshow that in biotite, “Ar diffusion is ~500 times faster parallel to thesilicate sheets than perpendicular to the silicate sheets” [Onstott et al .,1991, section 7, p. 166]. Because a He atom has a smaller diameter,2.28 Å, than an Ar atom, 3.35 Å [ Kar and Chakravarty, 2001, TableI; σ
sscolumn], then for He there should not be as great a difference
between “parallel” diffusivity D| | and “perpendicular” diffusivity
D⊥. So for He in biotite, the ratio D | |/ D⊥ should be less than 500. Our measurements for He in biotite (Section 5, Figure 9) gave, for example, D
| | = 8.6 × 10⁻¹⁵ cm2/sec at 200°C. Dividing that diffusivity by 500 gives
us a lower bound on the diffusivity in the difficult direction:
(D10)
That is over 40 million times greater than the maximum diffusivity,equation (D9), that a 300 Å interface could have and still retain theHe for 1.5 Ga. Hence such a hypothetical mechanism fails to accountfor the high He retention we document. Moreover, as we have alreadyindicated, there is no observational support for the sort of interfacecrystallographic structure our critic speculates might exist.
D.4 Effects of Model Assumptions
The critic also explored the effects of several changes in theassumptions of our models:(1) inserting a large interface resistance,(2) increasing the Creation model D for biotite to infinity,(3) decreasing the uniformitarian model D for biotite from infinity
down to that of zircon,(4) accounting for anisotropy of biotite and zircon, and
(5) changing the effective radius a from our early value of 22 µm[ Humphreys, 2000, p. 347] to our more recent and more appropriatevalue of 30 µm (Section 7, after equation 9).
We have discussed change (1) in the preceding section, showing that
D⊥−> ×1 7 10 17 2. /seccm
8/8/2019 Young Helium Diffusion Age of Zircons
http://slidepdf.com/reader/full/young-helium-diffusion-age-of-zircons 67/76

8/8/2019 Young Helium Diffusion Age of Zircons
http://slidepdf.com/reader/full/young-helium-diffusion-age-of-zircons 68/76
92 D. R. Humphreys
D.5 Closing Criticisms
Finally, the critic proposed we postpone publication until (a) further theoretical and experimental investigations would close all allegedloopholes, and (b) until we have much more data supporting our casefrom boreholes all over the world. We disagree with him. On point(a), detractors can allege loopholes eternally, and we think we haveaddressed all the so-far-alleged loopholes well enough to place the burden of proof on the detractors.
On point (b), the critic was not clear as to what he meant. If he wanteddiffusion rate data on zircons from more sites, it is doubtful that suchdata would be much different than what we measured. Our zircon datagive essentially the same intrinsic parameters, E
0and D
0, as those of
several other experimenters (Section 5, Figure 8). As for the defect parameters, E
1and D
1, there is no reason to expect them to generally
give defect lines more than one or perhaps two orders of magnitudedifferent from ours. That is because the radiation levels in our zirconsare fairly typical (in contrast to those of Magomedov, see our Section4). Defect lines for zircons at future sites would have to be more thanfive orders of magnitude lower than ours in order to have even a chanceof rescuing the uniformitarian scenarios.
Possibly the critic meant his point (b) to imply that the high Heretentions in the Jemez granodiorite could be unusual, so we would needto do similar studies on a large amount of sites to assure ourselves that
high retentions are normal. Of course it would be good to do more suchstudies, but we feel that the data in this chapter are so well establishedthat it would be wrong to withhold them for the several years requiredfor other site studies. In fact, our data here may stimulate more suchstudies.
As an encouragement to creationists considering such work, we offer the following opinion: high He retentions are probably the rule, not
the exception. Otherwise the large amount of geoscience literaturereporting great (U-Th)/He chronometry ages (Section 9) would notexist. That is because the method essentially divides the amount of Heretained by today’s nuclear decay rate, so large retentions of He are
8/8/2019 Young Helium Diffusion Age of Zircons
http://slidepdf.com/reader/full/young-helium-diffusion-age-of-zircons 69/76
Young Helium Diffusion Age of Zircons Supports Accelerated Nuclear Decay 93
necessary to get great ages. If their zircons had lost most of their He by diffusion, their dates would be in great disarray, and usually rather
young. Because their zircons are often of similar size as ours [ Reiners,2002], the He loss rates will be similarly fast. That suggests youngdiffusion ages such as ours will turn out to be common.
I would like to take this opportunity to thank Roger Lenard, a physicistat Sandia National Laboratories in Albuquerque, New Mexico, for his expert advice on chemical thermodynamics, which helped me to prepare Sections D2 and D3 above.
Endnotes
i Uniformitarianism is the conscious or unconscious assumptionthat “all continues just as it was from the beginning” [2 Peter 3:4],omitting the possibility of any large-scale physical interventions by God into the natural realm. Often scientists do this because,whether they are aware of it or not, they have accepted“methodological naturalism,” the incorrect teaching that scientistsmust ignore scientific evidence for non-natural phenomena.The teaching is incorrect because such an a priori naturalismwould lead to incorrect interpretations of the data if God has infact intervened in the natural world in a way that leaves physicalevidence of the intervention. Many uniformitarians interpretscientific data to support their preconception of cosmic and
biological evolution occurring during supposed billions of years.Such interpretations misunderstand clear observational dataall around us [ Humphreys, 2000, p. 339]. The Bible predicted[2 Peter 3:5–6] that a time would come when many thinkers wouldignore “elephant in the living room” evidence for a recent Creationand a worldwide catastrophic Flood.
ii Note that the large retentions are not what uniformitarian
geoscientists mean by “excess He” [ Baxter , 2003]. In the context of these zircons, “excess” He would correspond to retentions greater
than 100% of the amount nuclear decay could produce in 1.5 Ga.We are not claiming such “excess” He at all. The uniformitarian
8/8/2019 Young Helium Diffusion Age of Zircons
http://slidepdf.com/reader/full/young-helium-diffusion-age-of-zircons 70/76
94 D. R. Humphreys
method of “He dating,” called (U-Th)/He chronometry [ Reiners,2002] is entirely different from the He diffusion dating we are
employing here. (See endnote iv.) (U-Th)/He chronometry wouldnot call attention to the large He retentions we are concerned with(in fact, it depends upon large retentions, Appendix D, sectionD4), so it may turn out that sites like borehole GT-2 are commonthroughout the world.
iii Half the cited 2σ experimental reproducibility error of 6% in D/a2 gives us a 1σ error of ±3%. I estimate the 1σ error in the average
value of a2
for these size-selected zircons is less than ±10%. A possible shape factor error [ Fechtig and Kalbitzer , 1966, p. 72,Section 2.4] for the shape distribution in our Figure 1 could add a1σ error in a2 of ±25%. (I measured the length/width ratio of eachzircon in Figure 1 and used the resulting ratios in this analysis.) Thaterror is systematic, shifting the whole D(T ) curve up or down bythe same factor. Also, it cancels itself out in comparisons with the predictions based on the same value of a2 for crystals of the samesize from the same site. But here I will regard it as random. Takingthe square root of the sum of the squares of those errors gives us27.0%, which I round upward to 30%. So in Table 2, multiplying D/a2 in column 6 by a2 gives values of the diffusivity D in column7 whose 1σ error I estimate as ±30%.
iv Our diffusion dating method in Section 9 differs entirely fromthe “He dating” of (U-Th)/He chronometry [ Reiners, 2002]. Very
crudely, the difference is this: (U-Th)/He chronometry divides thenumber of He atoms in a crystal by nuclear decay rate. Diffusiondating divides the number of He atoms lost from the crystal bythe diffusion rate. Some practitioners of (U-Th)/He chronometry, intheir unpublished comments about our work, have not yet understoodthis distinction.
v Because b is nominal and ultimately cancels itself out of the analysis
(see paragraph under equation (7) in Section 7), the 1σ error boundson D/b2 in equation (17) are the same as those of D/a2, ±3%, asEndnote iii above shows. The error for extrapolation between data points with the curve fit is smaller than that. The effects of those
8/8/2019 Young Helium Diffusion Age of Zircons
http://slidepdf.com/reader/full/young-helium-diffusion-age-of-zircons 71/76
Young Helium Diffusion Age of Zircons Supports Accelerated Nuclear Decay 95
errors are small compared to the effect of the (assumed 1σ) ±30%error in Q/Q
0on x in Table 3 and equation (17). The resulting bounds
on x (and D) in samples 2–4 of Table 3 (the age calculation does notuse sample 1 and the error in sample 5 is indeterminate) average outto ±32%. That correlates well with the error of ±(2000 years/6000years) = ±33% from the statistics of the individual age calculationsin Table 5.
vi The probability that a single data point could be separated by morethan 25 standard deviations on a given side away from the mean
of the normal distribution governing the data is less than 6×10 –8
[ Abramowitz and Stegun, 1967, p. 933, equation (26.2.25), using1 - P
4( x) and x = 25].
References
Abramowitz, M., and I. A. Stegun, Handbook of Mathematical Functions,sixth printing, National Bureau of Standards, Washington, DC, 1967.
Armitage, M. H., Helium retention in deep-core zircons, American Laboratory,
36 (14), 17-20, 2004.Baumgardner, J. R., Distribution of radioactive isotopes in the earth, in
Radioisotopes and the Age of the Earth: A Young-Earth Creationist
Research Initiative, edited by L. Vardiman, A. A. Snelling, and E. F.
Chaffin, pp. 49–94, Institute for Creation Research, El Cajon, California,and Creation Research Society, St. Joseph, Missouri, 2000.
Baxter, E. F., Quantification of the factors controlling the presence of excess
40Ar or 4He, Earth and Planetary Science Letters, 216 , 619–634, 2003.Bell, R. P., A problem of heat conduction with spherical symmetry, Proceedings
of the Physical Society (London), 57 , 45–48,1945.
Broadhurst, C. L., M. J. Drake, B. E. Hagee, and T. J. Bernatowicz, Solubilityand partitioning of Ne, Ar, Kr, and Xe in minerals and synthetic basaltic
melts, Geochimica et Cosmochimica Acta, 56 , 709–723, 1992.Carslaw, H. S., and J. C. Jaeger, Conduction of Heat in Solids, second edition,
Clarendon Press, Oxford, 1959.
Chaffin, E. F., Theoretical mechanisms of accelerated nuclear decay, in Radioisotopes and the Age of the Earth: A Young-Earth Creationist
Research Initiative, edited by L. Vardiman, A. A. Snelling, and E. F.

8/8/2019 Young Helium Diffusion Age of Zircons
http://slidepdf.com/reader/full/young-helium-diffusion-age-of-zircons 72/76
96 D. R. Humphreys
Chaffin, pp. 305–331, Institute for Creation Research, El Cajon, California,
and Creation Research Society, St. Joseph, Missouri, 2000.
Chaffin, E. F., Accelerated decay: theoretical models, in Proceedings of the
Fifth International Conference on Creationism, edited by R. L. Ivey, Jr., pp. 3–15, Creation Science Fellowship, Pittsburgh, Pennsylvania, 2003. Seehttp://www.icr.org/research/icc03/pdf/RATE_ICC_Chaffin.pdf .
Cooperstock, F. I., V. Faraoni, and D. N. Vollick, The influence of thecosmological expansion on local systems, Astrophysical Journal , 503,61–66, 1998.
Crank, J., The Mathematics of Diffusion, second edition, Oxford UniversityPress, Oxford, 1975.
Dahl, P. S., The crystal-chemical basis for Ar retention in micas: inferencesfrom interlayer partitioning and implications for geochronology,Contributions to Mineral Petrology, 123, 22–39, 1996.
Deer, W. A., R. A. Howe, and M. A. Zussman, Rock-Forming Minerals, vol. I,Ortho- and Ring Silicates, vol. III, Sheet Silicates, Longmans, Green, andCompany, London, 1962.
Dodson, M. H., Closure temperature in cooling geochronological and petrological systems, Contributions to Mineralogy and Petrology, 40,
259–274, 1973.Farley, K. A., Helium diffusion from apatite: general behavior as illustrated
by Durango fluorapatite, Journal of Geophysical Research, 105(B2),
2903–2914, 2000.Farley, K. A., (U-Th)/He dating: techniques, calibrations, and applications, in
Noble Gases in Geochemistry and Cosmochemistry, edited by D. Porcelli,C. J. Ballentine, and R. Wieler, pp. 819–844, Mineralogical Society of America, Washington, DC, Reviews in Minerology and Geochemistry,
vol. 47, 2002.Farley, K. A., P. W. Reiners, and V. Nenow, An apparatus for high-precision
helium diffusion measurements from minerals, Analytical Chemistry,
71(10), 2059–2061, 1999.Fechtig, H., and S. Kalbitzer, The diffusion of argon in potassium-bearing
solids, in Potassium-Argon Dating , edited by O. A. Schaeffer and J.
Zähringer, pp. 68–107, Springer-Verlag, New York, 1966.Gentry, R. V., private communication, December 31, 1995.

8/8/2019 Young Helium Diffusion Age of Zircons
http://slidepdf.com/reader/full/young-helium-diffusion-age-of-zircons 73/76
Young Helium Diffusion Age of Zircons Supports Accelerated Nuclear Decay 97
Gentry, R. V., G. J. Glish, and E. H. McBay, Differential helium retention in
zircons: implications for nuclear waste management, Geophysical Research
Letters, 9(10), 1129–1130, 1982.Girifalco, L. A., Atomic Migration in Crystals , Blaisdell Publishing Company,
New York, pp. 39, 89, 1964.Harrison, T. M., P. Morgan, and D. D. Blackwell, Constraints on the age of
heating at the Fenton Hill site, Valles Caldera, New Mexico, Journal of
Geophysical Research, 91(B2), 1899–1908, 1986.Holloway, J. H., Noble-Gas Chemistry, Methuen, London, 1968.
Humphreys, D. R., Starlight and Time: Solving the Puzzle of Distant Starlight in a Young Universe, Master Books, Green Forest, Arkansas, 1994.
Humphreys, D. R., Accelerated nuclear decay: a viable hypothesis?, in Radioisotopes and the Age of the Earth: A Young-Earth Creationist
Research Initiative, edited by L. Vardiman, A. A. Snelling, and E. F.
Chaffin, pp. 333–379, Institute for Creation Research, El Cajon, California,and Creation Research Society, St. Joseph, Missouri, 2000.
Humphreys, D. R., Our galaxy is the centre of the universe, ‘quantized’ red
shifts show, TJ , 16 (2), 95–104, 2002. See http://www.answersingenesis.
org/home/area/magazines/tj/docs/TJv16n2_CENTRE.pdf
Humphreys, D. R., S. A. Austin, J. R. Baumgardner, and A. A. Snelling,Helium diffusion rates support accelerated nuclear decay, in Proceedings of
the Fifth International Conference on Creationism, edited by R. L. Ivey, Jr.,
pp. 175–195, Creation Science Fellowship, Pittsburgh, Pennsylvania, 2003a.See http://www.icr.org/research/icc03/pdf/Helium_ICC_7-22-03.pdf .
Humphreys, D. R., S. A. Austin, J. R. Baumgardner, and A. A. Snelling,Recently measured helium diffusion rate for zircon suggests inconsistencywith U-Pb age for Fenton Hill granodiorite, EOS, Transactions of
the American Geophysical Union, 84(46), Fall Meeting Supplement,Abstract V32C-1047, 2003b. Poster at http://www.icr.org/research/
AGUHeliumPoster_Humphreys.pdf .
Humphreys, D. R., S. A. Austin, J. R. Baumgardner, and A. A. Snelling,Helium diffusion age of 6,000 years supports accelerated nuclear decay,
Creation Research Society Quarterly, 41(1), 1–16, 2004. See http://www.
creationresearch.org/crsq/articles/41/41_1/Helium_lo_res.pdf .
Jambon, A., and J. E. Shelby, Helium diffusion and solubility in obsidians
8/8/2019 Young Helium Diffusion Age of Zircons
http://slidepdf.com/reader/full/young-helium-diffusion-age-of-zircons 74/76
98 D. R. Humphreys
and basaltic glass in the range 200–300°C, Earth and Planetary Science
Letters, 51, 206–214, 1980.
Kar, S., and C. Chakravarty, Diffusional anisotropy of simple sorbates insilicalite, Journal of Chemical Physics A, 105, 5785–5793, 2001.
Kolstad, C. D., and T. R. McGetchin, Thermal evolution models for the VallesCaldera with reference to a hot-dry-rock geothermal experiment, Journal
of Volcanology and Geothermal Research, 3, 197–218, 1978.Landau, L. D., and E. M. Lifshitz, The Classical Theory of Fields, fourth
English edition, Pergamon Press, Oxford, 1983.
Laney, R., and A. W. Laughlin, Natural annealing of pleochroic halos in biotitesamples from deep drill holes, Fenton Hill, New Mexico, Geophysical
Research Letters, 8(5), 501–504, 1981.
Laughlin, A. W., and A. C. Eddy, Petrography and geochemistry of Precambrian rocks from GT-2 and EE-1, Los Alamos Scientific Laboratory
Report LA-6930-MS, 1977.Lippolt, H. J., and E. Weigel, 4He diffusion in 40Ar-retentive minerals,
Geochimica et Cosmochimica Acta, 52, 1449–1458, 1988.
Magomedov, Sh. A., Migration of radiogenic products in zircon, Geokhimiya,1970(2), 263–267 (in Russian), 1970. English abstract in Geochemistry
International , 7 (1), 203, 1970. English translation available from D. R.
Humphreys.Manning, J. R., Diffusion Kinetics for Atoms in Crystals, Van Nostrand,
Princeton, 1968.Ohanian, H. C., and R. Ruffini, Gravitation and Spacetime, second edition,
W. W. Norton and Company, New York, 1994.Onstott, T. C., D. Phillips, and L. Pringle-Goodell, Laser microprobe
measurement of chlorine and argon zonation in biotite, Chemical Geology,
90, 145–168, 1991.
Reiners, P. W., (U-Th)/He chronometry experiences a renaissance, EOS,
Transactions of the American Geophysical Union, 83(3):21, 26–27, 2002.
Reiners, P. W., K. A. Farley, and H. J. Hickes, He diffusion and (U-Th)/Hethermochronometry of zircon: initial results from Fish Canyon Tuff andGold Butte, Nevada, Tectonophysics, 349(1–4), 297–308, 2002.
Reiners, P. W., T. L. Spell, S. Nicolescu, and K. A. Zanetti, Zircon (U-Th)/Hethermochronometry: He diffusion and comparisons with 40Ar/39Ar dating,
8/8/2019 Young Helium Diffusion Age of Zircons
http://slidepdf.com/reader/full/young-helium-diffusion-age-of-zircons 75/76
Young Helium Diffusion Age of Zircons Supports Accelerated Nuclear Decay 99
Geochimica et Cosmochimica Acta, 68(8), 1857–1887, 2004.
Rindler, W., Relativity: Special, General, and Cosmological , Oxford
University Press, Oxford, 2001.Robertson, H. P., and T. W. Noonan, Relativity and Cosmology, W. B. Saunders
Company, Philadelphia, 1968.Ross, H. N., Reasons to Believe radio broadcast, September 18, 6 to 8 p.m.
Pacific time, 2003. Moderator: Krista Bontrager. Studio participants: HughRoss, Fazale Rana, and Marge Harmon. Telephone participant: Roger Wiens. Broadcast archive web link and response at http://www.icr.org/
headlines/rate-hughross.html .Sasada, M., Fluid inclusion evidence for recent temperature increases at
Fenton Hill hot dry rock test site west of the Valles Caldera, New Mexico,U. S. A., Journal of Volcanology and Geothermal Research, 36 , 257–266,1989.
Snelling, A. A., Radiohalos in granites: evidence for accelerated nuclear decay, in Radioisotopes and the Age of the Earth: Results of a Young-Earth
Creationist Initiative, edited by L. Vardiman, A. A. Snelling, and E. F.
Chaffin, pp. 101–207, Institute for Creation Research, El Cajon, California,and Creation Research Society, Chino Valley, Arizona, 2005a.
Snelling, A. A., Fission tracks in zircons: evidence for abundant nuclear decay, in Radioisotopes and the Age of the Earth: Results of a Young-Earth
Creationist Initiative, edited by L. Vardiman, A. A. Snelling, and E. F.
Chaffin, pp. 209–324, Institute for Creation Research, El Cajon, California,and Creation Research Society, Chino Valley, Arizona, 2005b.
Snelling, A. A., and M. H. Armitage, Radiohalos—a tale of three granitic plutons, in Proceedings of the Fifth International Conference on
Creationism, edited by R. L. Ivey, Jr., pp. 243–267, Creation Science
Fellowship, Pittsburgh, Pennsylvania, 2003. See http://www.icr.org/
research/icc03/pdf/ICCRADIOHALOS-AASandMA.pdf .Snelling, A. A., J. R. Baumgardner, and L. Vardiman, Abundant Po radiohalos
in Phanerozoic granites and timescale implications for their formation, EOS, Transactions of the American Geophysical Union, 84(46), FallMeeting Supplement, Abstract V32C-1046, 2003. Poster at http://www.icr.
org/research/AGURadiohaloPoster_Snelling.pdf .Stacey, J. S., and J. D. Kramers, Approximation of terrestrial lead isotope
8/8/2019 Young Helium Diffusion Age of Zircons
http://slidepdf.com/reader/full/young-helium-diffusion-age-of-zircons 76/76
100 D. R. Humphreys
evolution by a two-stage model, Earth and Planetary Science Letters, 26 ,
201–221, 1975.
Steiger, R. H., and E. Jäger, Subcommission on geochronology: conventionon the use of decay constants in geo- and cosmochronology, Earth and
Planetary Science Letters, 36 , 359–362, 1977.Vardiman, L., Introduction, in Radioisotopes and the Age of the Earth: A
Young-Earth Creationist Research Initiative, edited by L. Vardiman, A. A.Snelling, and E. F. Chaffin, pp. 1–25, Institute for Creation Research, ElCajon, California, and Creation Research Society, St. Joseph, Missouri,
2000.Weast, R. C. (editor), Handbook of Chemistry and Physics, sixty-seventh
edition, CRC Press, Boca Raton, Florida, 1986.Wilson, J. W., J. H. Heinbockel, and R. A. Outlaw, Atomic forces between
noble gas atoms, alkali ions, and halogen ions for surface interactions,
Journal of Chemical Physics, 89(2), 929–937, 1988.Wolfram, S., Mathematica, second edition, Addison-Wesley, New York,
1991.Zartman, R. E., Uranium, thorium, and lead isotopic composition of biotite
granodiorite (Sample 9527-2b) from LASL Drill Hole GT-2, Los Alamos
Scientific Laboratory Report LA-7923-MS, 1979.