Improving Traffic Safety And Drivers' Behavior In Reduced ...
Upload
hoangduongCategory
view
220download
5
Traffic Accidents
Eman K. Ali
Mansoura 35516, Egypt
Email: [email protected]
Sherif M. El-Badawy and El-Sayed A. Shawaly
35516, Egypt
Email: sbadawy, [email protected]
Abstract—Recently, media, researchers, and others have
brought increased attention to young drivers' risk, hoping to
find ways to reduce it. This paper investigated the risk
factors of young drivers, who are considered a vulnerable
road user group. A questionnaire was carried out among
750 drivers in Mansoura city, Egypt between July and
September 2012 aiming to obtain information on
demographic factors, drivers' behavior while driving, as
well as information on the traffic violations and accident
faults. Analysis of the questionnaire results proved that the
main reason of young driver involved in road accidents is
careless driving. Results of the questionnaire demonstrated
that young drivers are more prone than other drivers to
negative behavior as well as traffic violations and accidents.
Index Terms—young drivers, distraction, traffic violation,
traffic accidents, crashes, risky driving.
I. INTRODUCTION
Every year around 12,000 Egyptians lose their lives as
a result of road traffic crashes, 48% of those killed in
motor vehicle crashes are occupants (passengers and
drivers) of four-wheeled vehicles although pedestrians
make up an additional one-fifth [1]. The Egyptian Central
Agency for Public Mobilization and Statistics (CAPMAS)
reported that 60% of road accidents occur due to
individual behavior (23% due to excessive speed, 12%
wrong passing, 15% drivers inattention, 8% sudden
defects, 14% blown tire, 9% due to the loose of control,
1% vehicle roll over, 9% two vehicle collisions, 1% due
to weather condition and 2% for other reasons) [2].
Derivers at the age of 16 to 24 are usually called young or
teen drivers. They have higher crash rates than any other
age group, including not only minor crashes but also
crashes resulting in injuries or fatalities [3]. Young and
novice drivers high crash rates primarily result from
immaturity, lack of experience, and lifestyles associated
with their age and gender.
Lack of brain development is a common risk factor in
the younger age group. A research study concluded
that the brain doesn't mature until the age of 25 that's
Manuscript received January 5, 2014; revised March 25, 2014.
where brain studies have shown that the frontal lobes
which control emotion, risk-taking, and decision-making
are not fully developed until young people reach the age
of 25, the same time the age disappears as a risk factor for
crashes after that the experience had been gained [4].
Risky driving young inexperienced drivers
significantly increases their risk of having a crash; this is
especially true among men [5]. In a study of over 20,000
young drivers in New South Wales, self-reported risky
driving behaviors were associated with a 50% increase in
the risk of crashing [6]. The younger drivers were more
likely to engage in non-driving tasks within their vehicle
[7]. Using in-vehicle technology (cell/smart phones, MP3
players, etc.) while driving increases the risk of a
collision [8]. Research showed that, a driver’s crash risk
is four times higher if he or she is talking on a cell phone
and 23 times higher if he/she is texting on a cell phone [9]
-[11] .
A study in Finland showed that 26% of the young
drivers’ accidents occurred at night [12]. Less visibility,
less ability to accurately estimate distances, increase from
the average speed because of the low traffic volume at
night, and the wrong use of the high beam light, all of
these factors increase the likelihood of accidents at night.
Passengers pose a significant risk to young drivers,
especially when they are at the same age. Research
conducted in the United States demonstrated that carrying
one peer passenger increases young drivers’ fatality risk
by 50% compared to driving alone, whereas carrying
three or more peer passenger’s increases fatality risk
three-fold [13]. Another study explored that, the crash rate
for those at ages 16 to 19 approximately doubled with the
presence of passengers, but this was not true for drivers
aged 20 to 24 or 25 to 59 [14].
As reported in the literature, seatbelts, when worn
properly, reduce the risk of fatal injury to front-seat
passenger car occupants by 47% and cuts the risk of
injury by 52% [15]. A study in Qatar showed that 57.3%
of the young drivers (71% of them are male drivers while
29% are females) do not wear seat belts [16]. According
to data compiled by National Highway Traffic Safety
Administration (NHTSA), more than 5,341 people at the
age of 15 to 20 were killed or seriously injured in traffic
Journal of Traffic and Logistics Engineering Vol. 2, No. 1, March 2014
©2014 Engineering and Technology Publishing 45doi: 10.12720/jtle.2.1.45-51
Young Drivers Behavior and Its Influence on
Public Works Engineering Department, Faculty of Engineering, Mansoura University,
Public Works Engineering Department, Faculty of Engineering, Mansoura University, Mansoura
crashes in 2001; two-thirds of them were not wearing
safety belts [17].
II. OBJECTIVES
The main purpose of the current study is to identify the
risky driving behavior of young drivers and its influence
on traffic violations and accidents. The specific objectives
of the study are as follows:
To investigate the effect of demographic
characteristics on driving behavior and crash risk.
To understand the nature and magnitude of risks
associated with various behaviors of young drivers.
To determine the frequency of distraction
activities among young drivers and their relation
to crash risk.
To study the causes of accidents and the most
common causes among young drivers.
To understand the nature of passengers influence
on teenage driving and crash risk.
III. METHODOLGY
A driver behavior questionnaire was formulated to
collect all important information needed to achieve the
objectives of this study. Participants were selected to
contain all age categories but the majority was from
youth, most of them students at several educational
institutions in Mansoura city (Mansoura University, Delta
Academy for Science, and Misr Higher Institute for
Technology). The questionnaire forms were handed to the
participants between July and September 2012. The
questionnaire forms were distributed during academic
lectures and assembled later. Some forms were posted on
Facebook and others were handed to the participants and
they were interviewed face to face. The participation was
quite high and only fifty participants (6.25%) were
excluded from the analysis for failing to answer some of
the questions. The sample size of this study consisted of
750 drivers, whereof 560 males and 190 females, out of
them 80.1% are young drivers (aged 16 to 24).
To design the questionnaire, previous literature studies
were investigated and factors affecting behavior of young
drivers were studied. Based on the studied literature and
keeping in mind the Egyptian culture and habits, 29
different questions were included in the questionnaire and
arranged in five sections as follows:
The first section refers to the demographic
characteristics including age, gender, marital
status, education level, license type, and the age at
which the driver obtained his license.
The second section consists of eight questions
measuring participants’ risky and aggressive
behavior while driving such as not wearing seat
belts, exceeding the speed limit, racing with
neighboring cars, etc. The third section includes seven questions
regarding the frequency of engaging in distraction
activities while driving such as making or
answering a cell phone call, reading or sending
text messages, etc.
The fourth section refers to the traffic violations
and consists of two questions. The first question is
“have you ever been exposed to traffic violation(s)
in the last year?” and the second question is “If
yes, what are these traffic violations?”
The fifth and final section concerns the traffic
crashes and consists of six questions such as
accident time, presence of passengers, type of
injuries and material losses.
IV. RESULTS AND ANALYSIS
The following subsections summarize the
questionnaire results and analyses of the participants'
answers.
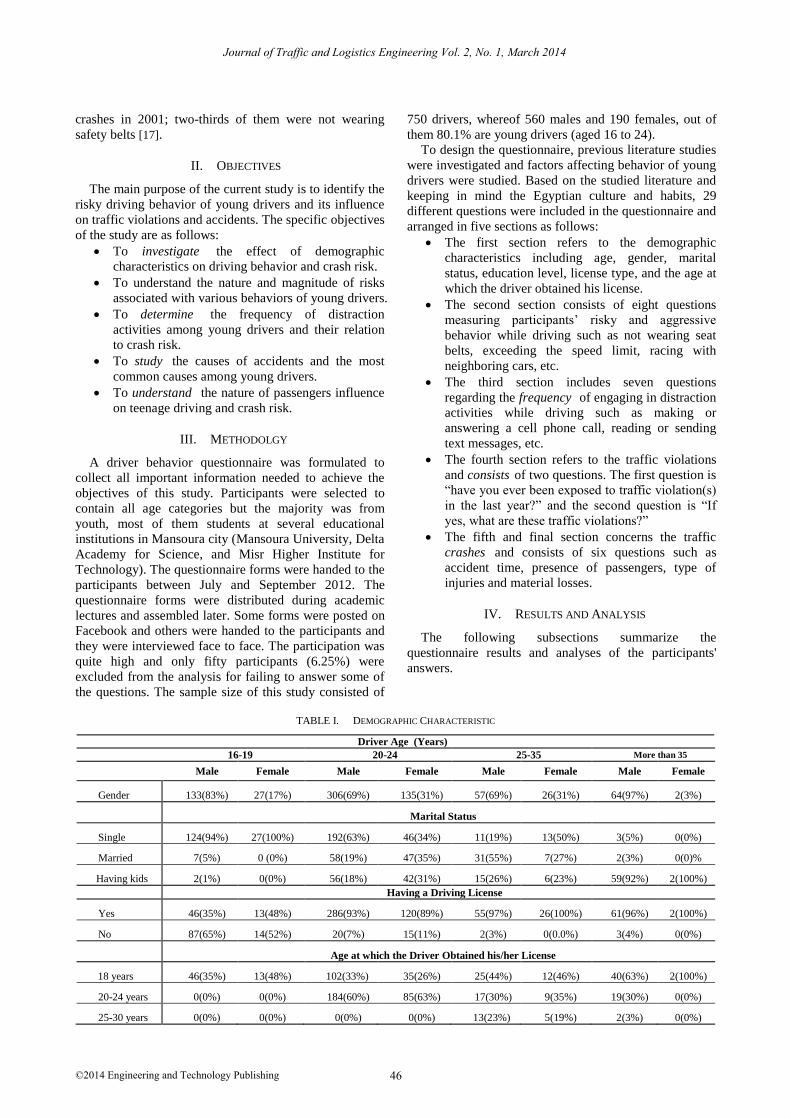
TABLE I. DEMOGRAPHIC CHARACTERISTIC
Driver Age (Years)
16-19 20-24 25-35 More than 35
Male Female Male Female Male Female Male Female
Gender 133(83%) 27(17%) 306(69%) 135(31%) 57(69%) 26(31%) 64(97%) 2(3%)
Marital Status
Single 124(94%) 27(100%) 192(63%) 46(34%) 11(19%) 13(50%) 3(5%) 0(0%)
Married 7(5%) 0 (0%) 58(19%) 47(35%) 31(55%) 7(27%) 2(3%) 0(0)%
Having kids 2(1%) 0(0%) 56(18%) 42(31%) 15(26%) 6(23%) 59(92%) 2(100%)
Having a Driving License
Yes 46(35%) 13(48%) 286(93%) 120(89%) 55(97%) 26(100%) 61(96%) 2(100%)
No 87(65%) 14(52%) 20(7%) 15(11%) 2(3%) 0(0.0%) 3(4%) 0(0%)
Age at which the Driver Obtained his/her License
18 years 46(35%) 13(48%) 102(33%) 35(26%) 25(44%) 12(46%) 40(63%) 2(100%)
20-24 years 0(0%) 0(0%) 184(60%) 85(63%) 17(30%) 9(35%) 19(30%) 0(0%)
25-30 years 0(0%) 0(0%) 0(0%) 0(0%) 13(23%) 5(19%) 2(3%) 0(0%)
Journal of Traffic and Logistics Engineering Vol. 2, No. 1, March 2014
©2014 Engineering and Technology Publishing 46
A. Demographic Characteristics
Table I summarizes the results of the demographic
characteristics. It shows that among the 750 drivers
participated in the study, 560 participants (74.6%) of
them are males, with 601 (80.1%) are young drivers
(between the ages 16-24 years). Results show that 87% of
male teen drivers driven without a driving license A
question about the age at which driver got his/her license,
helped to obtain information about the driver experience.
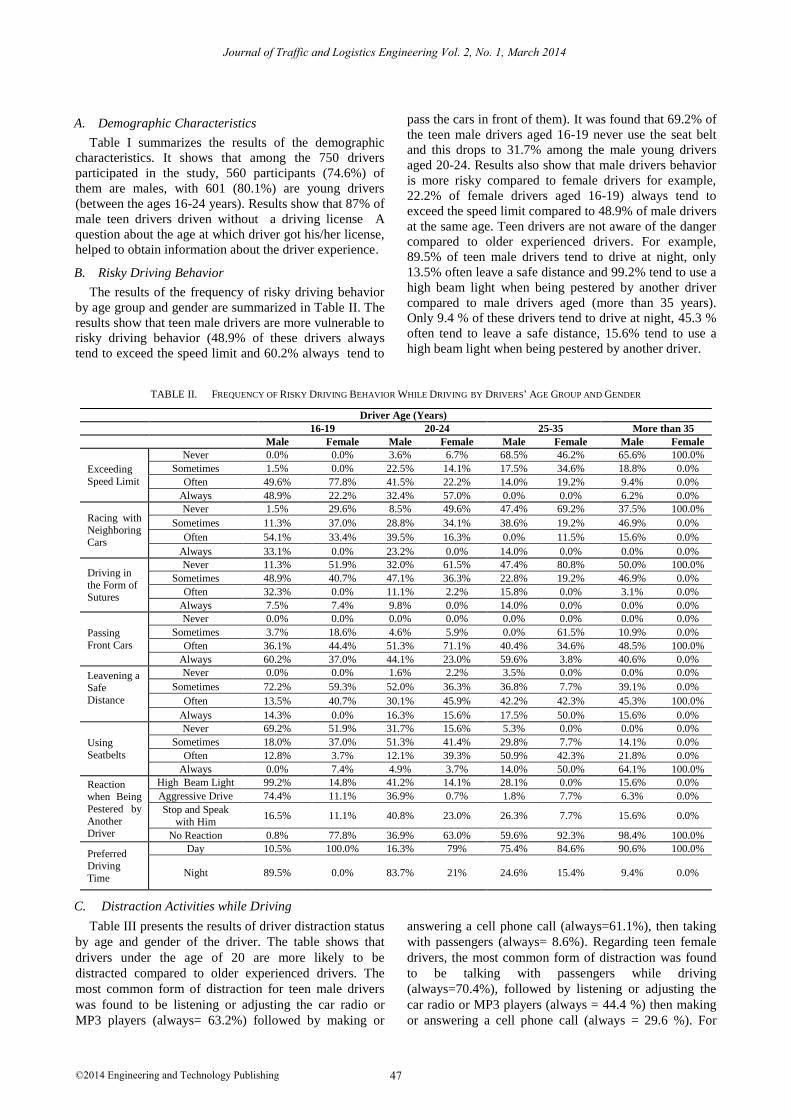
B. Risky Driving Behavior
The results of the frequency of risky driving behavior
by age group and gender are summarized in Table II. The
results show that teen male drivers are more vulnerable to
risky driving behavior (48.9% of these drivers always
tend to exceed the speed limit and 60.2% always tend to
pass the cars in front of them). It was found that 69.2% of
the teen male drivers aged 16-19 never use the seat belt
and this drops to 31.7% among the male young drivers
aged 20-24. Results also show that male drivers behavior
is more risky compared to female drivers for example,
22.2% of female drivers aged 16-19) always tend to
exceed the speed limit compared to 48.9% of male drivers
at the same age. Teen drivers are not aware of the danger
compared to older experienced drivers. For example,
89.5% of teen male drivers tend to drive at night, only
13.5% often leave a safe distance and 99.2% tend to use a
high beam light when being pestered by another driver
compared to male drivers aged (more than 35 years).
Only 9.4 % of these drivers tend to drive at night, 45.3 %
often tend to leave a safe distance, 15.6% tend to use a
high beam light when being pestered by another driver.
TABLE II. FREQUENCY OF RISKY DRIVING BEHAVIOR WHILE DRIVING BY DRIVERS’ AGE GROUP AND GENDER
Driver Age (Years)
16-19 20-24 25-35 More than 35
Male Female Male Female Male Female Male Female
Exceeding
Speed Limit
Never 0.0% 0.0% 3.6% 6.7% 68.5% 46.2% 65.6% 100.0%
Sometimes 1.5% 0.0% 22.5% 14.1% 17.5% 34.6% 18.8% 0.0%
Often 49.6% 77.8% 41.5% 22.2% 14.0% 19.2% 9.4% 0.0%
Always 48.9% 22.2% 32.4% 57.0% 0.0% 0.0% 6.2% 0.0%
Racing with Neighboring
Cars
Never 1.5% 29.6% 8.5% 49.6% 47.4% 69.2% 37.5% 100.0%
Sometimes 11.3% 37.0% 28.8% 34.1% 38.6% 19.2% 46.9% 0.0%
Often 54.1% 33.4% 39.5% 16.3% 0.0% 11.5% 15.6% 0.0%
Always 33.1% 0.0% 23.2% 0.0% 14.0% 0.0% 0.0% 0.0%
Driving in
the Form of Sutures
Never 11.3% 51.9% 32.0% 61.5% 47.4% 80.8% 50.0% 100.0%
Sometimes 48.9% 40.7% 47.1% 36.3% 22.8% 19.2% 46.9% 0.0%
Often 32.3% 0.0% 11.1% 2.2% 15.8% 0.0% 3.1% 0.0%
Always 7.5% 7.4% 9.8% 0.0% 14.0% 0.0% 0.0% 0.0%
Passing
Front Cars
Never 0.0% 0.0% 0.0% 0.0% 0.0% 0.0% 0.0% 0.0%
Sometimes 3.7% 18.6% 4.6% 5.9% 0.0% 61.5% 10.9% 0.0%
Often 36.1% 44.4% 51.3% 71.1% 40.4% 34.6% 48.5% 100.0%
Always 60.2% 37.0% 44.1% 23.0% 59.6% 3.8% 40.6% 0.0%
Leavening a Safe
Distance
Never 0.0% 0.0% 1.6% 2.2% 3.5% 0.0% 0.0% 0.0%
Sometimes 72.2% 59.3% 52.0% 36.3% 36.8% 7.7% 39.1% 0.0%
Often 13.5% 40.7% 30.1% 45.9% 42.2% 42.3% 45.3% 100.0%
Always 14.3% 0.0% 16.3% 15.6% 17.5% 50.0% 15.6% 0.0%
Using
Seatbelts
Never 69.2% 51.9% 31.7% 15.6% 5.3% 0.0% 0.0% 0.0%
Sometimes 18.0% 37.0% 51.3% 41.4% 29.8% 7.7% 14.1% 0.0%
Often 12.8% 3.7% 12.1% 39.3% 50.9% 42.3% 21.8% 0.0%
Always 0.0% 7.4% 4.9% 3.7% 14.0% 50.0% 64.1% 100.0%
Reaction when Being
Pestered by
Another Driver
High Beam Light 99.2% 14.8% 41.2% 14.1% 28.1% 0.0% 15.6% 0.0%
Aggressive Drive 74.4% 11.1% 36.9% 0.7% 1.8% 7.7% 6.3% 0.0%
Stop and Speak
with Him 16.5% 11.1% 40.8% 23.0% 26.3% 7.7% 15.6% 0.0%
No Reaction 0.8% 77.8% 36.9% 63.0% 59.6% 92.3% 98.4% 100.0%
Preferred Driving
Time
Day 10.5% 100.0% 16.3% 79% 75.4% 84.6% 90.6% 100.0%
Night 89.5% 0.0% 83.7% 21% 24.6% 15.4% 9.4% 0.0%
C. Distraction Activities while Driving
Table III presents the results of driver distraction status
by age and gender of the driver. The table shows that
drivers under the age of 20 are more likely to be
distracted compared to older experienced drivers. The
most common form of distraction for teen male drivers
was found to be listening or adjusting the car radio or
MP3 players (always= 63.2%) followed by making or
answering a cell phone call (always=61.1%), then taking
with passengers (always= 8.6%). Regarding teen female
drivers, the most common form of distraction was found
to be talking with passengers while driving
(always=70.4%), followed by listening or adjusting the
car radio or MP3 players (always = 44.4 %) then making
or answering a cell phone call (always = 29.6 %). For
Journal of Traffic and Logistics Engineering Vol. 2, No. 1, March 2014
©2014 Engineering and Technology Publishing 47
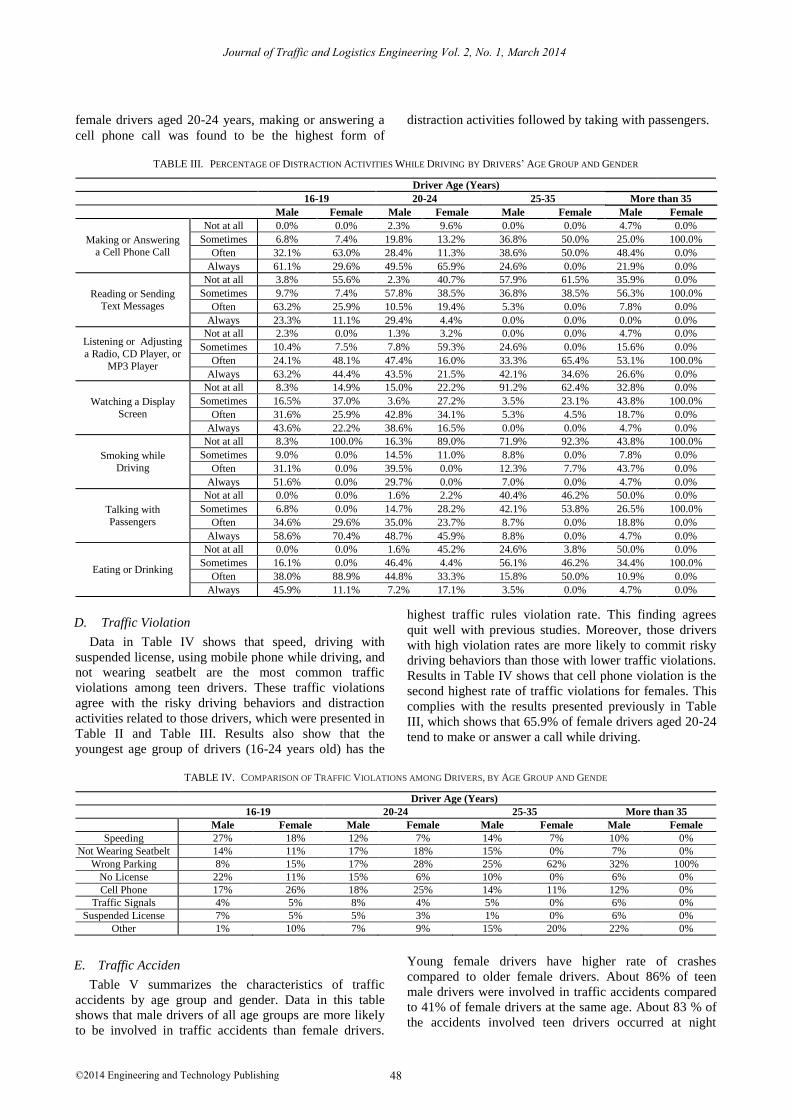
female drivers aged 20-24 years, making or answering a
cell phone call was found to be the highest form of
distraction activities followed by taking with passengers.
TABLE III. PERCENTAGE OF DISTRACTION ACTIVITIES WHILE DRIVING BY DRIVERS’ AGE GROUP AND GENDER
Driver Age (Years)
16-19 20-24 25-35 More than 35
Male Female Male Female Male Female Male Female
Making or Answering a Cell Phone Call
Not at all 0.0% 0.0% 2.3% 9.6% 0.0% 0.0% 4.7% 0.0%
Sometimes 6.8% 7.4% 19.8% 13.2% 36.8% 50.0% 25.0% 100.0%
Often 32.1% 63.0% 28.4% 11.3% 38.6% 50.0% 48.4% 0.0%
Always 61.1% 29.6% 49.5% 65.9% 24.6% 0.0% 21.9% 0.0%
Reading or Sending Text Messages
Not at all 3.8% 55.6% 2.3% 40.7% 57.9% 61.5% 35.9% 0.0%
Sometimes 9.7% 7.4% 57.8% 38.5% 36.8% 38.5% 56.3% 100.0%
Often 63.2% 25.9% 10.5% 19.4% 5.3% 0.0% 7.8% 0.0%
Always 23.3% 11.1% 29.4% 4.4% 0.0% 0.0% 0.0% 0.0%
Listening or Adjusting
a Radio, CD Player, or
MP3 Player
Not at all 2.3% 0.0% 1.3% 3.2% 0.0% 0.0% 4.7% 0.0%
Sometimes 10.4% 7.5% 7.8% 59.3% 24.6% 0.0% 15.6% 0.0%
Often 24.1% 48.1% 47.4% 16.0% 33.3% 65.4% 53.1% 100.0%
Always 63.2% 44.4% 43.5% 21.5% 42.1% 34.6% 26.6% 0.0%
Watching a Display
Screen
Not at all 8.3% 14.9% 15.0% 22.2% 91.2% 62.4% 32.8% 0.0%
Sometimes 16.5% 37.0% 3.6% 27.2% 3.5% 23.1% 43.8% 100.0%
Often 31.6% 25.9% 42.8% 34.1% 5.3% 4.5% 18.7% 0.0%
Always 43.6% 22.2% 38.6% 16.5% 0.0% 0.0% 4.7% 0.0%
Smoking while
Driving
Not at all 8.3% 100.0% 16.3% 89.0% 71.9% 92.3% 43.8% 100.0%
Sometimes 9.0% 0.0% 14.5% 11.0% 8.8% 0.0% 7.8% 0.0%
Often 31.1% 0.0% 39.5% 0.0% 12.3% 7.7% 43.7% 0.0%
Always 51.6% 0.0% 29.7% 0.0% 7.0% 0.0% 4.7% 0.0%
Talking with
Passengers
Not at all 0.0% 0.0% 1.6% 2.2% 40.4% 46.2% 50.0% 0.0%
Sometimes 6.8% 0.0% 14.7% 28.2% 42.1% 53.8% 26.5% 100.0%
Often 34.6% 29.6% 35.0% 23.7% 8.7% 0.0% 18.8% 0.0%
Always 58.6% 70.4% 48.7% 45.9% 8.8% 0.0% 4.7% 0.0%
Eating or Drinking
Not at all 0.0% 0.0% 1.6% 45.2% 24.6% 3.8% 50.0% 0.0%
Sometimes 16.1% 0.0% 46.4% 4.4% 56.1% 46.2% 34.4% 100.0%
Often 38.0% 88.9% 44.8% 33.3% 15.8% 50.0% 10.9% 0.0%
Always 45.9% 11.1% 7.2% 17.1% 3.5% 0.0% 4.7% 0.0%
D. Traffic Violation
Data in Table IV shows that speed, driving with
suspended license, using mobile phone while driving, and
not wearing seatbelt are the most common traffic
violations among teen drivers. These traffic violations
agree with the risky driving behaviors and distraction
activities related to those drivers, which were presented in
Table II and Table III. Results also show that the
youngest age group of drivers (16-24 years old) has the
highest traffic rules violation rate. This finding agrees
quit well with previous studies. Moreover, those drivers
with high violation rates are more likely to commit risky
driving behaviors than those with lower traffic violations.
Results in Table IV shows that cell phone violation is the
second highest rate of traffic violations for females. This
complies with the results presented previously in Table
III, which shows that 65.9% of female drivers aged 20-24
tend to make or answer a call while driving.
TABLE IV. COMPARISON OF TRAFFIC VIOLATIONS AMONG DRIVERS, BY AGE GROUP AND GENDE
Driver Age (Years)
16-19 20-24 25-35 More than 35
Male Female Male Female Male Female Male Female
Speeding 27% 18% 12% 7% 14% 7% 10% 0%
Not Wearing Seatbelt 14% 11% 17% 18% 15% 0% 7% 0%
Wrong Parking 8% 15% 17% 28% 25% 62% 32% 100%
No License 22% 11% 15% 6% 10% 0% 6% 0%
Cell Phone 17% 26% 18% 25% 14% 11% 12% 0%
Traffic Signals 4% 5% 8% 4% 5% 0% 6% 0%
Suspended License 7% 5% 5% 3% 1% 0% 6% 0%
Other 1% 10% 7% 9% 15% 20% 22% 0%
E. Traffic Acciden
Table V summarizes the characteristics of traffic
accidents by age group and gender. Data in this table
shows that male drivers of all age groups are more likely
to be involved in traffic accidents than female drivers.
Young female drivers have higher rate of crashes
compared to older female drivers. About 86% of teen
male drivers were involved in traffic accidents compared
to 41% of female drivers at the same age. About 83 % of
the accidents involved teen drivers occurred at night
Journal of Traffic and Logistics Engineering Vol. 2, No. 1, March 2014
©2014 Engineering and Technology Publishing 48
compared to 12% of older drivers (ages more than 35
years). About 77.9 % of injuries in young drivers’
accidents occurred to drivers and passengers while
pedestrians made up only 22.1%. Compared to other
drivers of the same age without passengers, the risk of
fatal injury for 20-24 years old drivers with one passenger
was 1.19 times higher, 1.88 times higher with two
passengers, and 2.76 times higher with three passengers
or more. In contrast, the risk of fatal injury for older
drivers (more than 25 years) decreased if there were no
passengers in the car, as well as older drivers are
positively impacted by young passengers.
TABLE V. CHARACTERISTICS OF TRAFFIC ACCIDENTS BY AGE GROUP AND GENDER
Driver Age (Years)
16-19
Number (%)
20-24
Number (%)
25-35
Number (%)
More than
35 Number (%)
Male Female Male Female Male Female Male
Exposure to Accidents
Yes 115(86) 11(41) 200(65) 70(51) 20(35) 9(33) 17(27)
No 18(14) 16(59) 106(35) 65(49) 37(65) 18(67) 47(73)
Time of Accident
Day 20(17) 9(82) 120(60) 45(64) 15(75) 7(78) 15(88)
Night 95(83) 2(18) 80(40) 25(36) 5(25) 2(22) 2(12)
Injuries
Driver Injury 77(52) 11(69) 136(40) 47(46) 22(39) 6(37) 13(48)
Injury of Passengers 49(33) 0(0) 125(36) 30(29) 7(13) 2(13) 2(7)
Pedestrian Injury 23(15) 5(31) 82(24) 25(25) 27(48) 8(50) 12(45)
Material Losses
Car 78(54) 11(69) 162(57) 60(58) 25(89) 9(41) 18(41)
Public Ownership 61(42) 5(31) 105(37) 32(31) 3(11) 3(14) 11(25)
Other 5(4) 0(0) 18(6) 11(11) 0(0) 10(45) 15(34)
Presence of Passengers
No Passengers 11(10) 1(9) 20(10) 26(37) 18(90) 7(78) 15(88)
One 18(16) 1(9) 30(15) 20(29) 1(5) 1(11) 1(6)
Two 27(23) 5(46) 65(33) 12(17) 1(5) 1(11) 1(6)
Three or More 59(51) 4(36) 85(42) 12(17) 0(0) 0(0) 0(0)
Age of Passengers
16-19 years 75(72) 8(80) 45(25) 14(32) 0(0) 0(0) 0(0)
20-24 years 23(22) 2(20) 96(53) 22(50) 0(0) 0(0) 0(0)
25-35 years 4(4) 0(0) 30(17) 8(18) 1(50) 1(50) 1(50)
More than 35 Years Old 2(2) 0(0) 9(5) 0(0) 1 (50) 1(50) 1(50)
Table VI presents the causes of traffic accidents by age
group and gender. Data shows that there is a significant
difference existed between the younger and experienced
driver groups in the contributing factors for traffic crashes.
Results show that weather condition is a significant
contributing factor in case of experienced driver crashes.
For teen/adult young drivers driving at night, speed,
distracted driving, and risky passing are the major factors
for crashes.
Driving at night is a significant contributing factor in
male teen drivers’ crashes (25% of the crashes). Speeding
is even a more significant contributing factor for male
drivers’ aged 20-24 years crashes (27%, compared to
13% for the experienced drivers aged more than 35 years).
Results also show that lack of attention is a major
contributing factor in female teen drivers crashes
followed by speeding then driving at night, which
represent 23%, 18%, and 12% respectively.
TABLE VI. THE PERCENTAGE OF CAUSES OF TRAFFIC ACCIDENTS, BY AGE GROUP AND GENDER
Driver Age (Years)
16-19 20-24 25- 35 More than 35
Male Female Male Female Male Female Male Female
Speeding 23% 18% 27% 10% 22% 13% 13% 0%
Lack of Attention 21% 23% 21% 22% 4% 6% 3% 0%
Driving at Night 25% 12% 23% 6% 13% 13% 17% 0%
Wrong Passing 21% 10% 17% 25% 4% 13% 2% 0%
Road Condition 5% 10% 6% 6% 5% 14% 21% 0%
Weather Condition 2% 13% 2% 16% 22% 29% 21% 0%
Fault of Others 2% 7% 2% 2% 20% 0% 17% 0%
Other 1% 8% 2% 14% 10% 11% 8% 0%
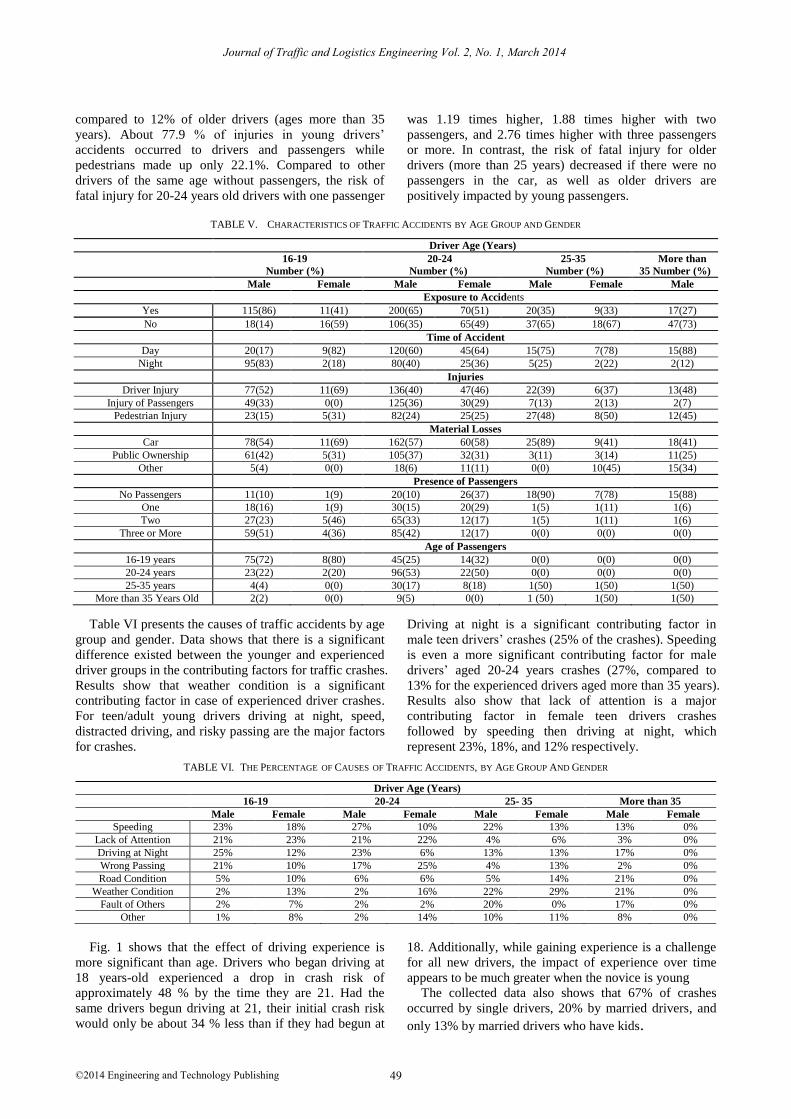
Fig. 1 shows that the effect of driving experience is
more significant than age. Drivers who began driving at
18 years-old experienced a drop in crash risk of
approximately 48 % by the time they are 21. Had the
same drivers begun driving at 21, their initial crash risk
would only be about 34 % less than if they had begun at
18. Additionally, while gaining experience is a challenge
for all new drivers, the impact of experience over time
appears to be much greater when the novice is young
The collected data also shows that 67% of crashes
occurred by single drivers, 20% by married drivers, and
only 13% by married drivers who have kids.
Journal of Traffic and Logistics Engineering Vol. 2, No. 1, March 2014
©2014 Engineering and Technology Publishing 49
0
20
40
60
80
100
120
140
15 20 25 30 35 40 45 50 55 60 65
Num
ber
of
Cra
shes
Driver Age (Year)
Licence at 18 years
License at 20-24 years
License at 25-30 years
Figure 1. Relationship between number of crashes and driving experience
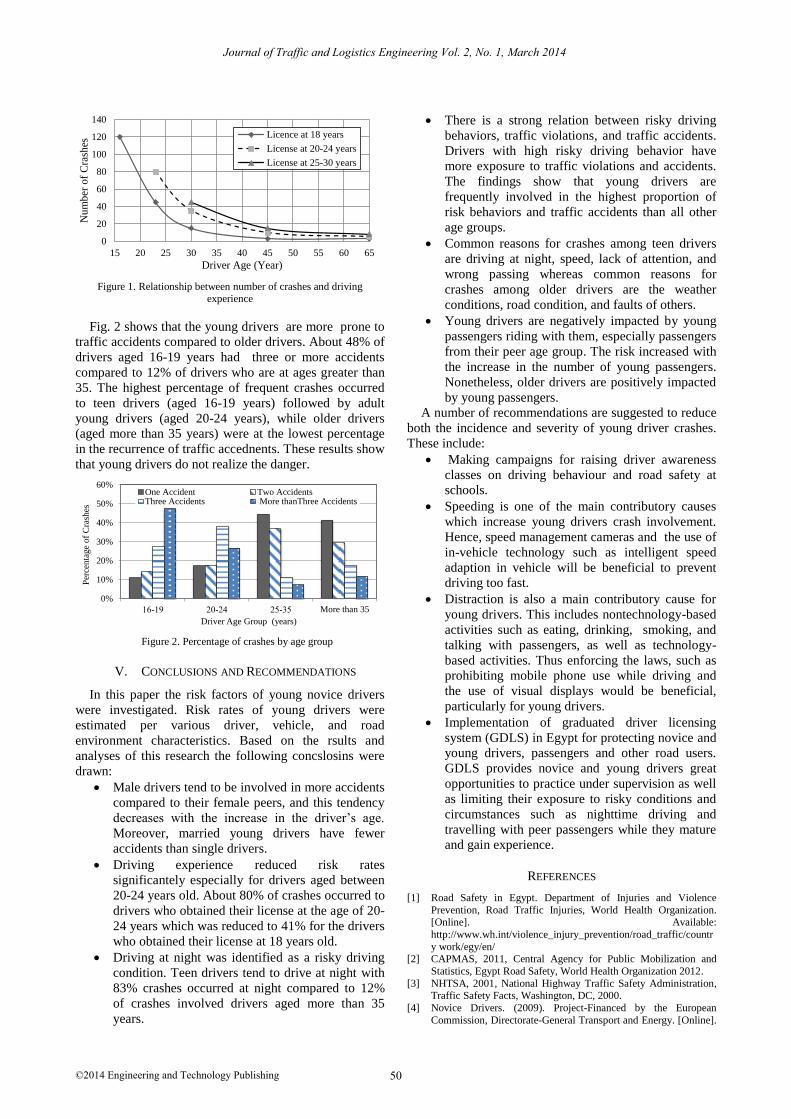
Fig. 2 shows that the young drivers are more prone to
traffic accidents compared to older drivers. About 48% of
drivers aged 16-19 years had three or more accidents
compared to 12% of drivers who are at ages greater than
35. The highest percentage of frequent crashes occurred
to teen drivers (aged 16-19 years) followed by adult
young drivers (aged 20-24 years), while older drivers
(aged more than 35 years) were at the lowest percentage
in the recurrence of traffic accednents. These results show
that young drivers do not realize the danger.
0%
10%
20%
30%
40%
50%
60%
More than 35
Per
centa
ge
of
Cra
shes
Driver Age Group (years)
One Accident Two AccidentsThree Accidents More thanThree Accidents
Figure 2. Percentage of crashes by age group
V. CONCLUSIONS AND RECOMMENDATIONS
In this paper the risk factors of young novice drivers
were investigated. Risk rates of young drivers were
estimated per various driver, vehicle, and road
environment characteristics. Based on the rsults and
analyses of this research the following concslosins were
drawn:
Male drivers tend to be involved in more accidents
compared to their female peers, and this tendency
decreases with the increase in the driver’s age.
Moreover, married young drivers have fewer
accidents than single drivers.
Driving experience reduced risk rates
significantely especially for drivers aged between
20-24 years old. About 80% of crashes occurred to
drivers who obtained their license at the age of 20-
24 years which was reduced to 41% for the drivers
who obtained their license at 18 years old.
Driving at night was identified as a risky driving
condition. Teen drivers tend to drive at night with
83% crashes occurred at night compared to 12%
of crashes involved drivers aged more than 35
years.
There is a strong relation between risky driving
behaviors, traffic violations, and traffic accidents.
Drivers with high risky driving behavior have
more exposure to traffic violations and accidents.
The findings show that young drivers are
frequently involved in the highest proportion of
risk behaviors and traffic accidents than all other
age groups.
Common reasons for crashes among teen drivers
are driving at night, speed, lack of attention, and
wrong passing whereas common reasons for
crashes among older drivers are the weather
conditions, road condition, and faults of others.
Young drivers are negatively impacted by young
passengers riding with them, especially passengers
from their peer age group. The risk increased with
the increase in the number of young passengers.
Nonetheless, older drivers are positively impacted
by young passengers.
A number of recommendations are suggested to reduce
both the incidence and severity of young driver crashes.
These include:
Making campaigns for raising driver awareness
classes on driving behaviour and road safety at
schools.
Speeding is one of the main contributory causes
which increase young drivers crash involvement.
Hence, speed management cameras and the use of
in-vehicle technology such as intelligent speed
adaption in vehicle will be beneficial to prevent
driving too fast.
Distraction is also a main contributory cause for
young drivers. This includes nontechnology-based
activities such as eating, drinking, smoking, and
talking with passengers, as well as technology-
based activities. Thus enforcing the laws, such as
prohibiting mobile phone use while driving and
the use of visual displays would be beneficial,
particularly for young drivers.
Implementation of graduated driver licensing
system (GDLS) in Egypt for protecting novice and
young drivers, passengers and other road users.
GDLS provides novice and young drivers great
opportunities to practice under supervision as well
as limiting their exposure to risky conditions and
circumstances such as nighttime driving and
travelling with peer passengers while they mature
and gain experience.
REFERENCES
[1] Road Safety in Egypt. Department of Injuries and Violence
Prevention, Road Traffic Injuries, World Health Organization. [Online]. Available:
http://www.wh.int/violence_injury_prevention/road_traffic/countr
y work/egy/en/ [2] CAPMAS, 2011, Central Agency for Public Mobilization and
Statistics, Egypt Road Safety, World Health Organization 2012.
[3] NHTSA, 2001, National Highway Traffic Safety Administration, Traffic Safety Facts, Washington, DC, 2000.
[4] Novice Drivers. (2009). Project-Financed by the European
Commission, Directorate-General Transport and Energy. [Online].
Journal of Traffic and Logistics Engineering Vol. 2, No. 1, March 2014
©2014 Engineering and Technology Publishing 50

Available:http://ec.europa.eu/transport/road_safety/specialist/kno
wledge /young/index.htm
[5] R. Isler, “THE ‘Frontal Lobe’ project–a double-blind, randomized
controlled study of the effectiveness of higher level driving skills training to improve frontal lobe (executive) function related
driving performance in young drivers,” Final Report, June 2008.
[6] R. Ivers, T. Senserrick, S. Boufous, M. Stevenson, H-Y Chen, M. Woodward, and R. Norton, “Novice drivers’ risky driving
behavior, risk perception, and crash risk: Findings from the
DRIVE study,” American Journal of Public Health, vol. 99, no. 9, pp. 1638-1644, Sep 2009.
[7] T. A. Ranney, “Driver distraction: A review of the current state of
knowledge,” Technical Report DOT HS 810 810 787. National Highway Traffic Safety Administration, U.S. Department of
Transportation, Washington D.C., 2008.
[8] K. Kircher, C. Patten, and C. Ahlstrom, Mobile Telephones and other Communication Devices and their Impact on Traffic Safety,
The Swedish National Road and Transport Research Institute
(VTI), 2011. [9] S. P. McEvoy, M. R. Stevenson, A. T. McCartt, M. Woordward, et
al., “Role of mobile phones in motor vehicle crashes resulting in
hospital attendance: A case-crossover study,” British Medical Journal, vol. 331, no. 7514, pp. 428-430, 2005.
[10]
From Virginia Tech Transportation Institute Provides Insight into Cell Phone Use and Driving Distraction. Virginia Tech News.
Virginia Tech. [Online]. Available:
http://www.vtnews.vt.edu/articles/2009/07/2009-571.htm [11] National Highway Traffic Safety Administration, National Phone
Survey on Distracted Driving Attitudes and Behaviors, December
2011. DOT HS 811 555. U.S Department of Transportation. Washington, D.C., 2011.
[12] S. Laapotti, E. Keskinen, M. Hatakka, and A. Katila, “Novice
drivers’ accidents and violations- a failure on higher or lower hierarchical levels of driving behavior,” Accident Analysis and
Preventation, vol. 33, no. 6, pp. 759-769, 2001.
[13] L. H. Chen, S. P. Baker, E. R. Braver, and G. Li, “Carrying passengers as a risk factor for crashes fatal to 16- and 17-year-old
drivers,” Journal of the American Medical Association, vol. 283, no. 12, pp. 1578-1582, March 22-29 2000.
[14] S. T. Doherty, J. C. Andrey, and C. MacGregor, “The situational
risks of young drivers: The influence of passengers, time of day
and day of week on accident rates,” Accident Analysis and
Prevention, vol. 30, no. 1, pp. 45-52, 1998.
[15] D. E. Stewart, H. R. Arora, and D. Dalmotas, Estimation Methodologies for Assessing Effectiveness of Seat Belt Restraint
Systems and the National Occupant Restraint Program, Road
Safety and Motor Vehicle Regulation Directorate, Transport Canada, Ottawa, Canada. Publication No. TP 13110 E., 1997.
[16] K. Shaban, “On road observational survey of seat belt use among
young drivers in Qatar,” in Measuring Behavior, A. J. Spink, F.
Grieco, O. E. Krips, L. W. S. Loijens, L. P. J .J. Noldus, and P. H.
Zimmerman, Eds., Utrecht, The Netherlands, Aug 28-31, 2012.
[17] Traffic Safety Facts 2001, National Highway Traffic Safety
Administration, DOT HS 809 484.
Eman K. Ali was born in September 1987.
She received a BSc degree in Civil Engineering from Mansoura University, Egypt
in 2009. She is currently a teaching and
research assistant in Public Works Engineering Department, Mansoura
University, Egypt. She helps in teaching the
following undergraduate courses: Highway and Airport Engineering, Survey Engineering,
Railway Engineering and Transportation &
Traffic Engineering. Her research focuses on traffic characterization.
Sherif El-Badawy is associate professor at
Mansoura University, Egypt and adjunct faculty at University of Idaho, USA. He also
serves as the director of Highway and Airport
Engineering Laboratory, Vice Director of the Center of Scientific, Experimental, and
Technical Services, Deputy Vice Dean for
Graduate Studies and Research at Faculty of Engineering, Mansoura University. He
received a BSc degree in 1995 in Civil
Engineering with honors from Mansoura University, Egypt, MSc in 1999 from Mansoura University, and Ph.D.
Degree from Arizona State University, USA in 2006. He worked as a
Postdoctoral Research Associate at ASU from June 2006 until July 2007 and Research Fellow at University of Idaho from December 2009 until
January 2012. He serves as a TRB Committee Member on Flexible
Pavement Design (AFD60). He is also an elected board member of the Middle East Society of Asphalt Technologists (MESAT). His research
interest focuses on pavement materials characterization, mechanistic-
empirical pavement design method, and traffic characteristics. Through research and graduate advising, he published more than 38 technical
papers and reports.
Dr. Sayed Shawaly graduated from Cairo
University in 1972, got his Ph.D from
sheffield University in 1986 in roads traffic
and transport. Since then he has extensive
experience in education and consultancy in this career. In addition to carrying out many
research work in highway traffic, road design,
and transport planning. He has participated in a large number of relevant projects, in both
design and site supervision in Egypt and
U.A.E during last 25 years.
Journal of Traffic and Logistics Engineering Vol. 2, No. 1, March 2014
©2014 Engineering and Technology Publishing 51
(2009). New Data Virginia Tech Transportation Institute (VTTI).