Young-Bean Song AnalyticsDNA September 18, 1015.
35
Young-Bean Song AnalyticsDNA September 18, 1015 Demystifying Big Data
-
Upload
ashlee-collins -
Category
Documents
-
view
217 -
download
0
Transcript of Young-Bean Song AnalyticsDNA September 18, 1015.

Young-Bean SongAnalyticsDNA
September 18, 1015
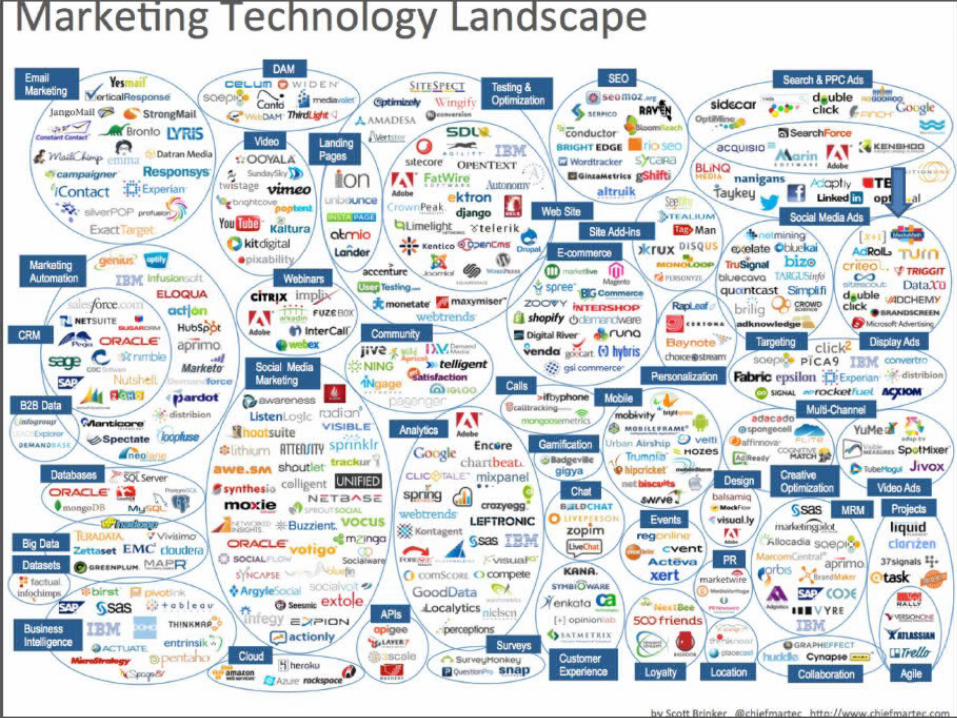
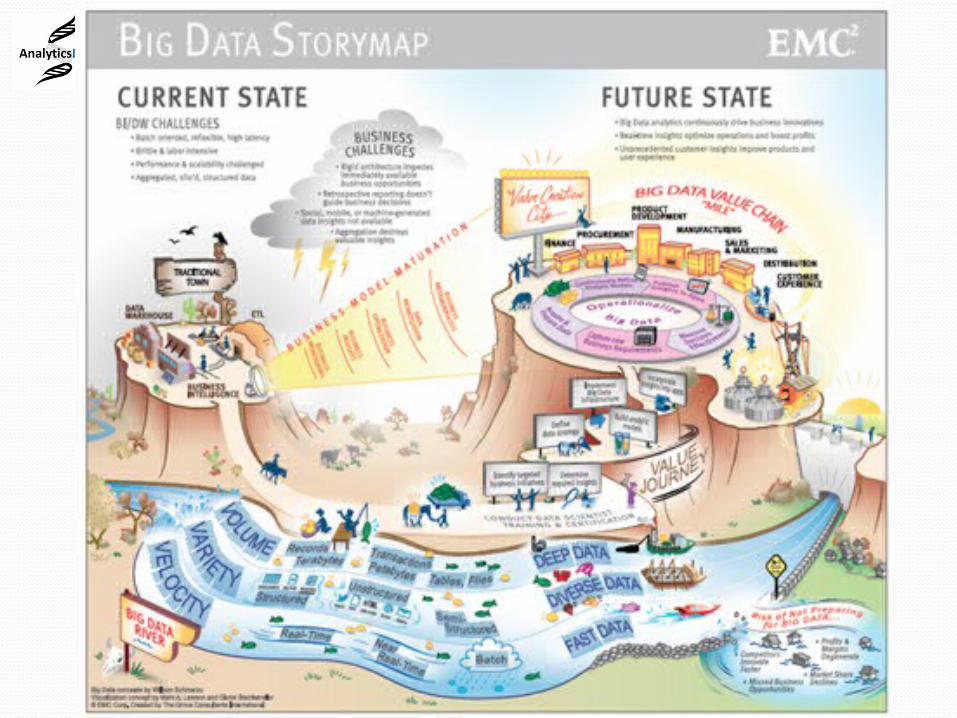
Demystifying Big Data


“Every two days now we create as much information as we did from the dawn of civilization up until
2003” – Eric Schmidt


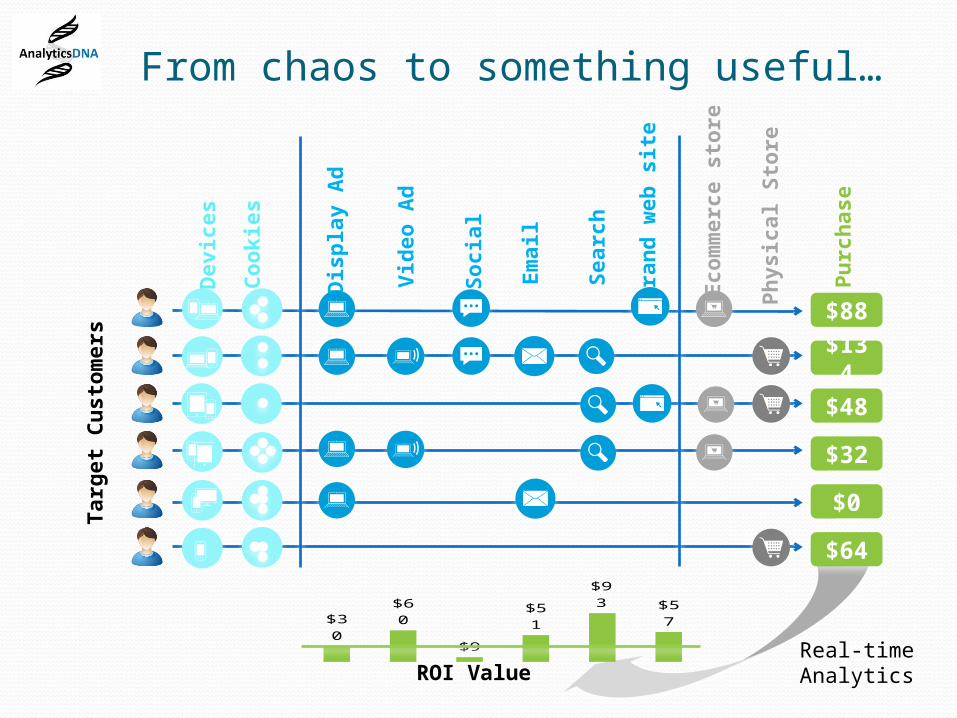
From chaos to something useful…
Dis
pla
y A
d
Vid
eo A
d
Searc
h
Socia
l
Em
ail
Bra
nd
web
sit
e
Ph
ysic
al
Sto
re
Pu
rch
ase
$88$134$48$32$0$64
Real-time Analytics
$30
$60
$9
$51
$93 $5
7
ROI Value
Ecom
merc
e s
tore
Targ
et
Cu
stom
ers
Devi
ces
Cookie
s

What we are covering today?
Framework for a analytics roadmap
Simplify what all this muck means
Demystify lots of buzz words and hype
Case studies & research

Connecting the dots…
Define Success
•Metrics or proxies
•By customer segments
•How do I want to see the results
•Benchmarks•What decisions will I make from the outcomes?
Methodology
•Experimental Design
•Buy-in across organization
•Prototype•Start fast, simple
Data Alignment
•What data do I need?
•Where can I get it?
•User level or macro level?
•How can I use my own data?
•Start fast, simple
Framework for an Analytics Strategy and Roadmap

“Hello Mr, Wood…”

Pagliacci’s Definition of Success
• Sales & Profitability• Segment by
• Volume x (Revenue & Profit) • Household or business
• Toppings to infer kids, Day of Week• What to do about it?
• Speed• Retention• Cross-sell product
recommendations

How am I going to convince myself and others that Big Data works?
Methodology
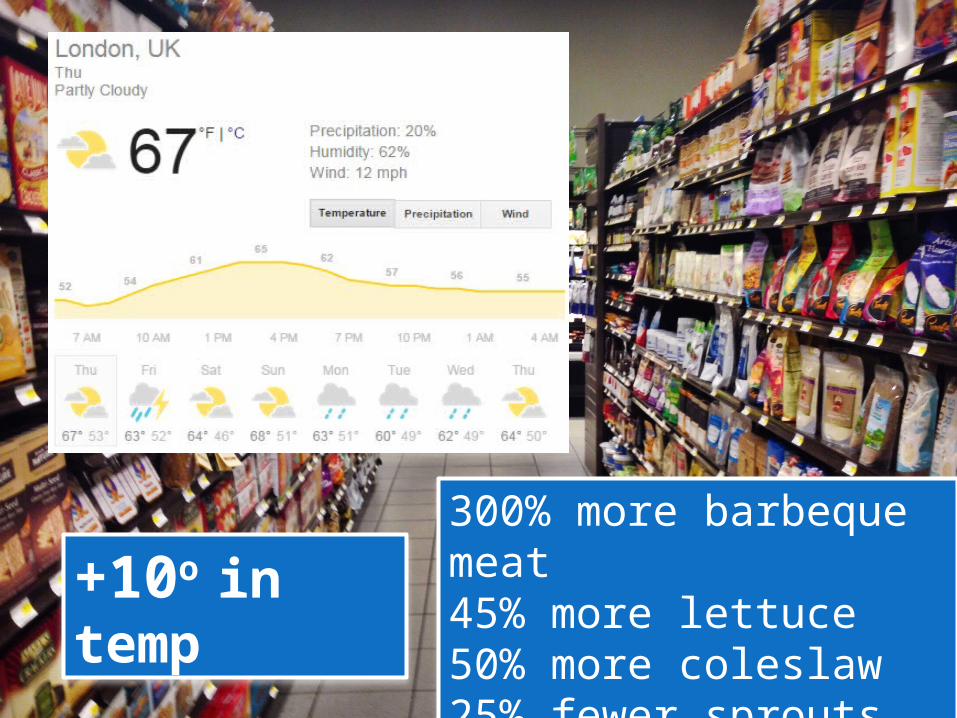
+10o in temp
300% more barbeque meat 45% more lettuce50% more coleslaw25% fewer sprouts

Where do I get the data and how do I make it all work?
Data Alignment

How did IKEA do it?1. Link online surfing to in-store sales2. Inputs: Onsite Behavior 3. Methodology: Multi-linear regression to
predict: In-store sales user level (95% accuracy)
4. Proxy metric that combine:1. Products added to shopping list2. Stock availability3. Local store look ups4. Ikea product searches5. Number of products viewed
Conversion Metrics
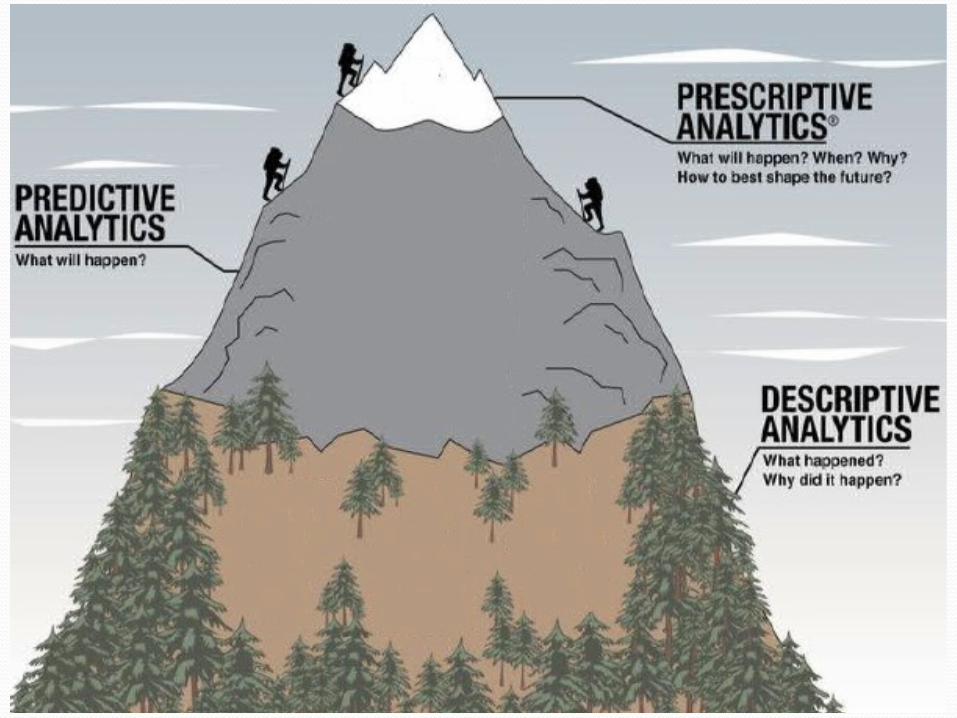
How to scale…?? Predictive >> Prescriptive
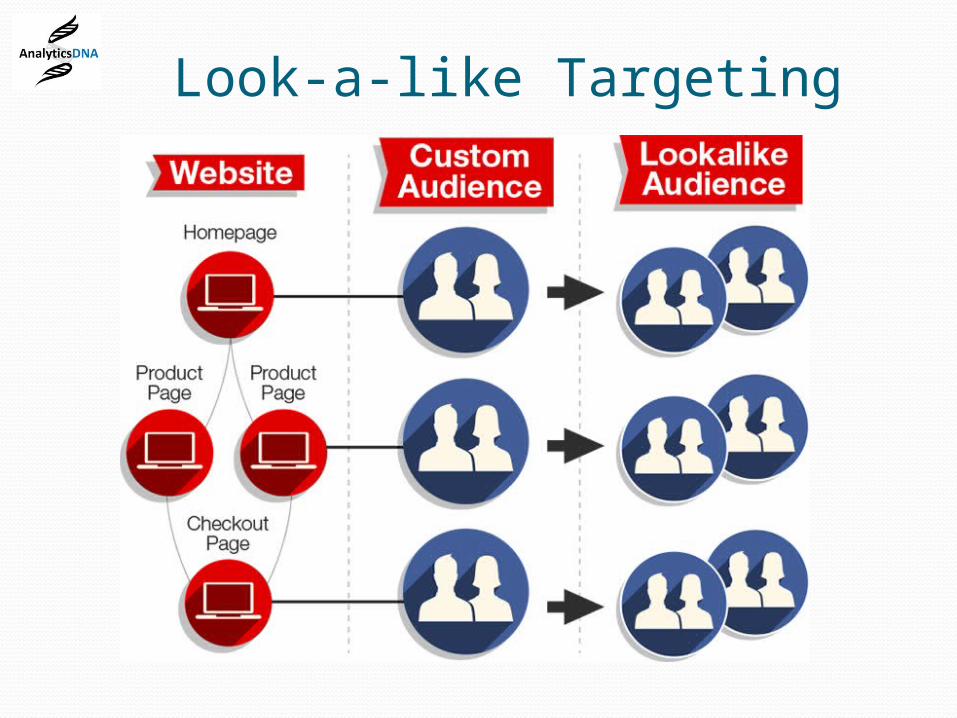
Look-a-like Targeting

IKEA Case Study Results
Average basket size of exposed was 45% higher than non-exposed
Campaign drove 4.6 to 1 ROIYOY performance increase 91%Cost per conversion down by 51%


Myth #1 “We need a dashboard”
Sorry… rarely helpful
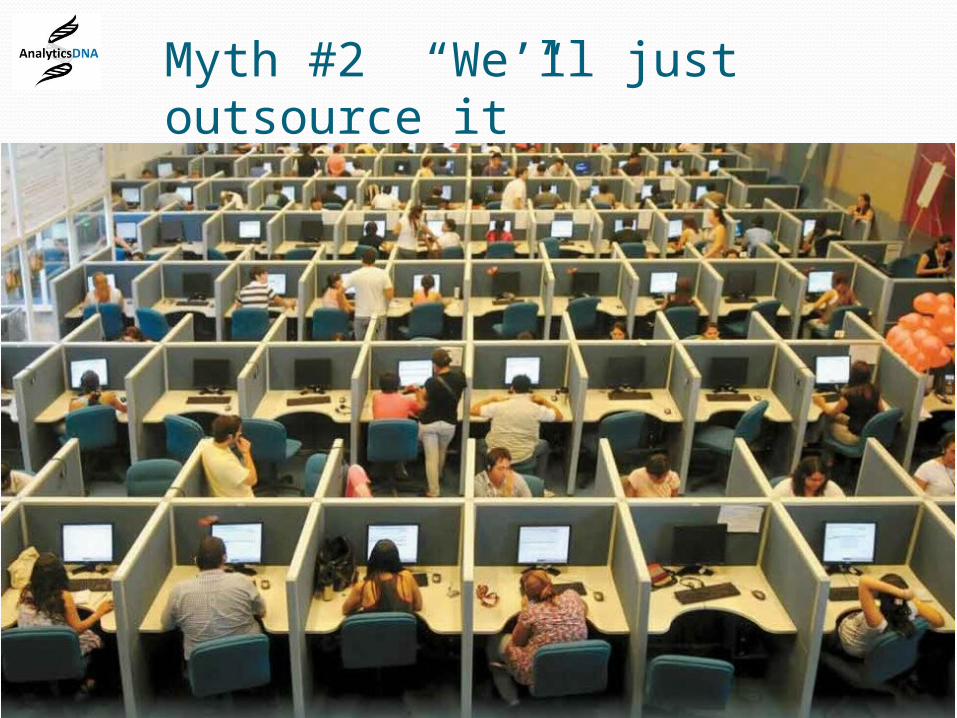
Myth #2 “We’ll just outsource it”
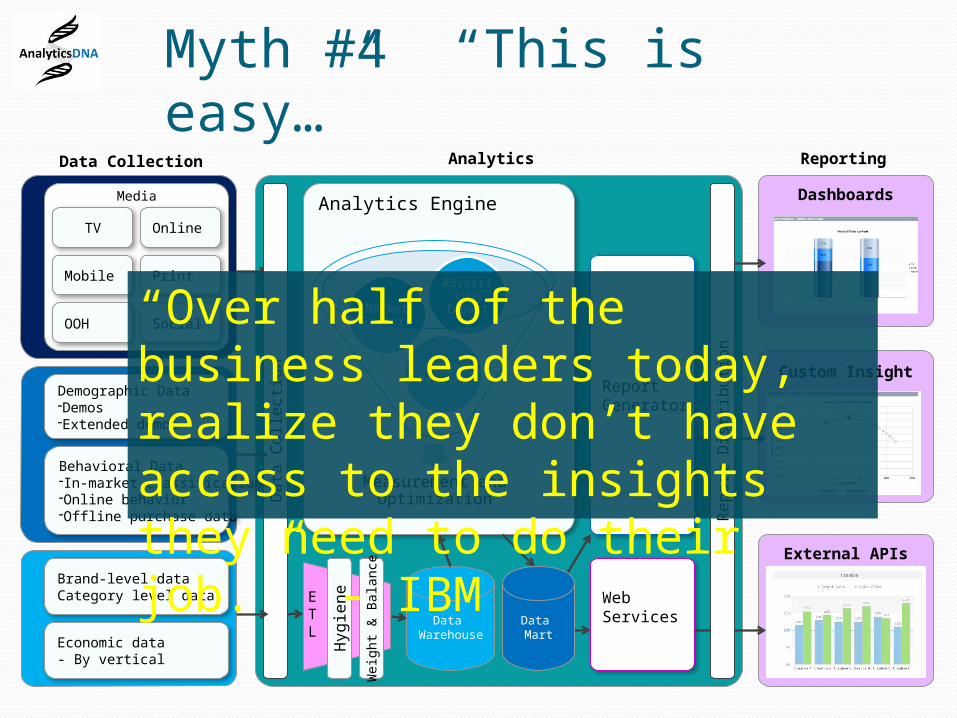
Myth #4 “This is easy…”
External APIs
Custom Insight
Dashboards
Da
Media
TV
Mobile
Online
Radio
Analytics Engine
PrintD
ata
Co
llect
ion
Demographic Data-Demos-Extended demos
OOH Social
Behavioral Data-In-market classification-Online behavior-Offline purchase data
Brand-level data Category level data
Economic data- By vertical
Hyg
ien
e
Weig
ht
& B
ala
nce
ETL
Data Warehouse
Measurement and Optimization
Sales Proxies
Market Factors
Advertising
Impact
Web Services
Report Generator
Re
po
rt D
istr
ibu
tion
Data Mart
Data Collection Analytics Reporting
“Over half of the business leaders today, realize they don’t have access to the insights they need to do their job.” - IBM

Case Study: How to TED Talk
@ 4:10

So what does this all mean???

The Biggest Myth in Marketing:“Advertising makes people do
what I want time to do…”
REALLY GOOD MARKETINGMake us feel good, make us laugh, or at least, help us do what we already want to do,
easier…