You cant control what you cant measure - Measuring requirements quality
25
Software Quality Lab Markus Unterauer Consultant and trainer You can‘t control what you can‘t measure Measuring requirements quality
-
Upload
markus-unterauer -
Category
Technology
-
view
169 -
download
0
Transcript of You cant control what you cant measure - Measuring requirements quality
SWQL Präsentationsvorlage V8.0
Software Quality Lab
Markus UnterauerConsultant and trainer
You can‘t control what you can‘t
measureMeasuring requirements quality
www.software-quality-lab.com | improve your quality
SWQL Präsentationsvorlage V8.0
At the end of this session you know …Agenda
Why good requirements are important
What makes good requirements
How you can measure requirements quality
How to define metrics using G-Q-M
How you use metrics to improve
Slide 2
www.software-quality-lab.com | improve your quality
SWQL Präsentationsvorlage V8.0
… and how reality often looks like
Why good requirements are
important
Slide 3
www.software-quality-lab.com | improve your quality
SWQL Präsentationsvorlage V8.0
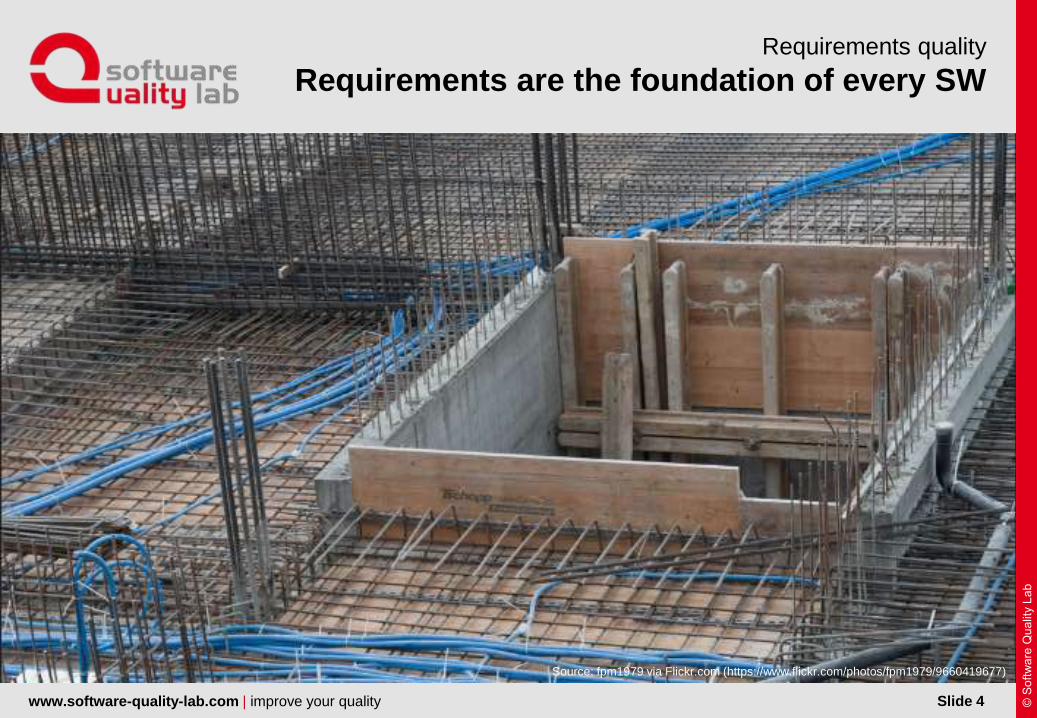
Requirements are the foundation of every SWRequirements quality
Slide 4
Source: fpm1979 via Flickr.com (https://www.flickr.com/photos/fpm1979/9660419677)
www.software-quality-lab.com | improve your quality
SWQL Präsentationsvorlage V8.0
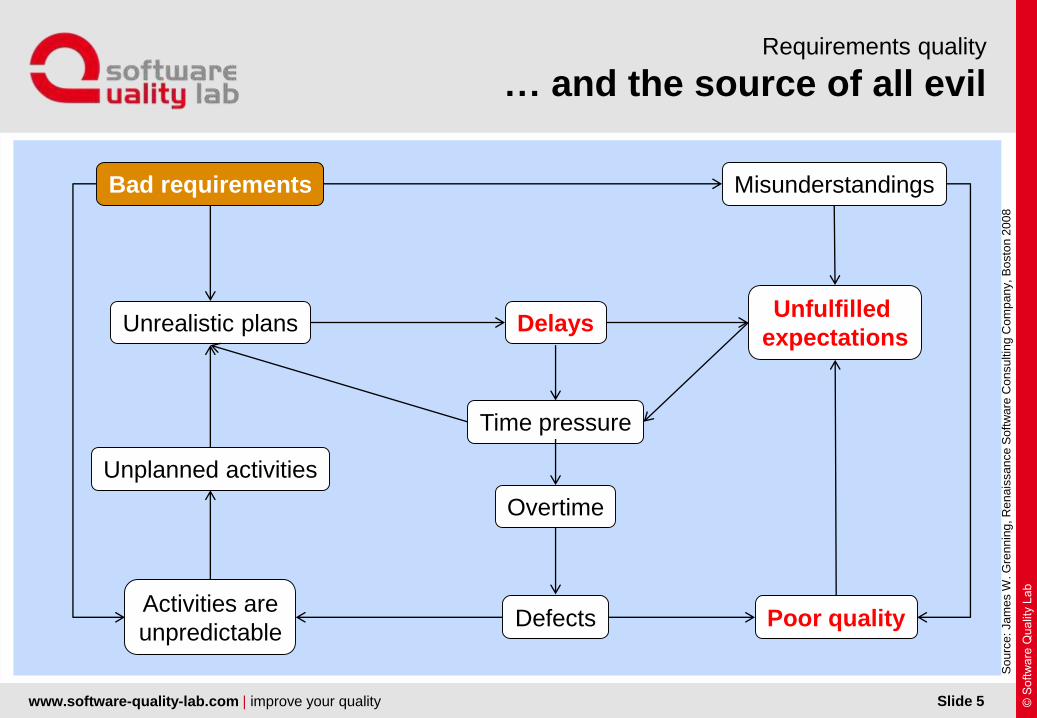
… and the source of all evilRequirements quality
Slide 5
Bad requirements
Unrealistic plans
Unplanned activities
Activities are
unpredictable
DelaysUnfulfilled
expectations
Poor quality
Misunderstandings
Time pressure
Overtime
Defects
So
urc
e: Ja
me
s W
. G
ren
nin
g, R
en
ais
sa
nce
So
ftw
are
Co
nsu
ltin
g C
om
pa
ny, B
osto
n 2
00
8

www.software-quality-lab.com | improve your quality
SWQL Präsentationsvorlage V8.0
If we specify badly …Requirements quality
Slide 6
Source: Thomas R. Stegelmann via Flickr.com
https://www.flickr.com/photos/thomasrstegelmann/2731846156Source: Joel Kramer via Flickr.com
https://www.flickr.com/photos/75001512@N00/4518848983
www.software-quality-lab.com | improve your quality
SWQL Präsentationsvorlage V8.0
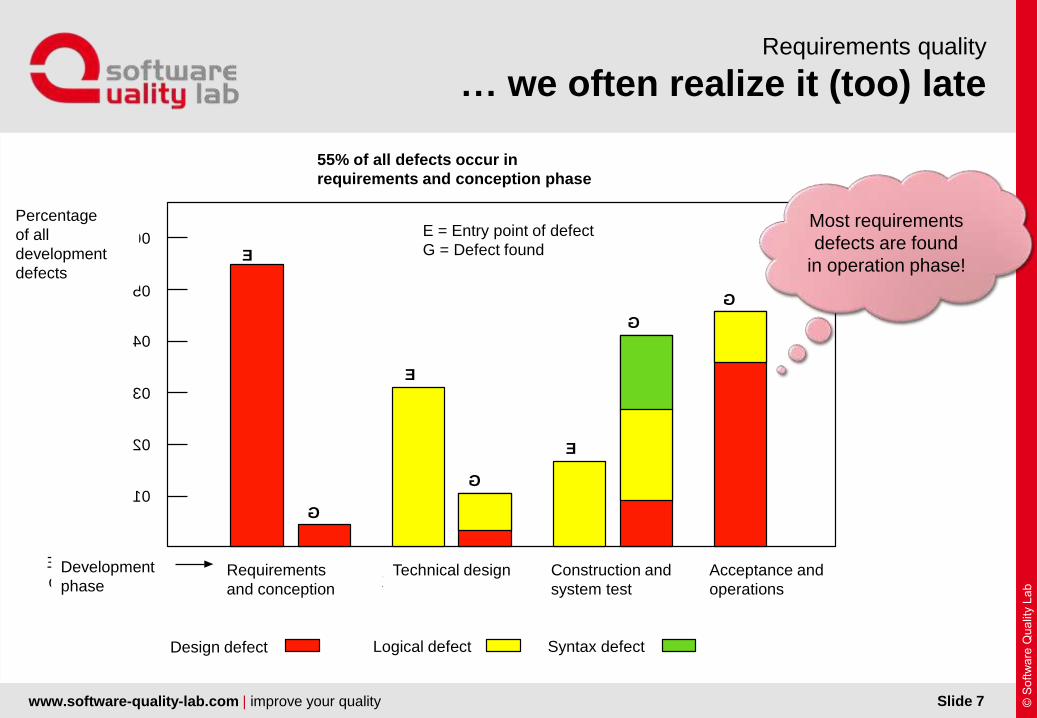
… we often realize it (too) lateRequirements quality
Slide 7
55% aller Fehler entstehen in der
Anforderungs– und Entwurfsphase
Prozent aller
Entwicklungs-
fehler
Anforderungs-
und Entwurfs-
phase
Technische
Entwurfsphase
Konstruktion-–
und System-
testphase
Abnahmetest
und Betriebs-
phase
Entwicklungs-
phasen
60
50
40
30
20
10
Entwurfsfehler Logische Fehler Syntaxfehler
E
E
E
G
G
G
G
E = Eingebrachte FehlerG = Gefundene Fehler
Fehlerbeseitigungskosten (abgeleitet von Alberts 1985)
(Zitiert nach: IEEE Software, Jan. 1985, S. 83)
Most requirements
defects are found
in operation phase!
Percentage
of all
development
defects
Development
phase
Design defect Logical defect Syntax defect
Requirements
and conception
Technical design Construction and
system test
Acceptance and
operations
E = Entry point of defect
G = Defect found
55% of all defects occur in
requirements and conception phase
www.software-quality-lab.com | improve your quality
SWQL Präsentationsvorlage V8.0
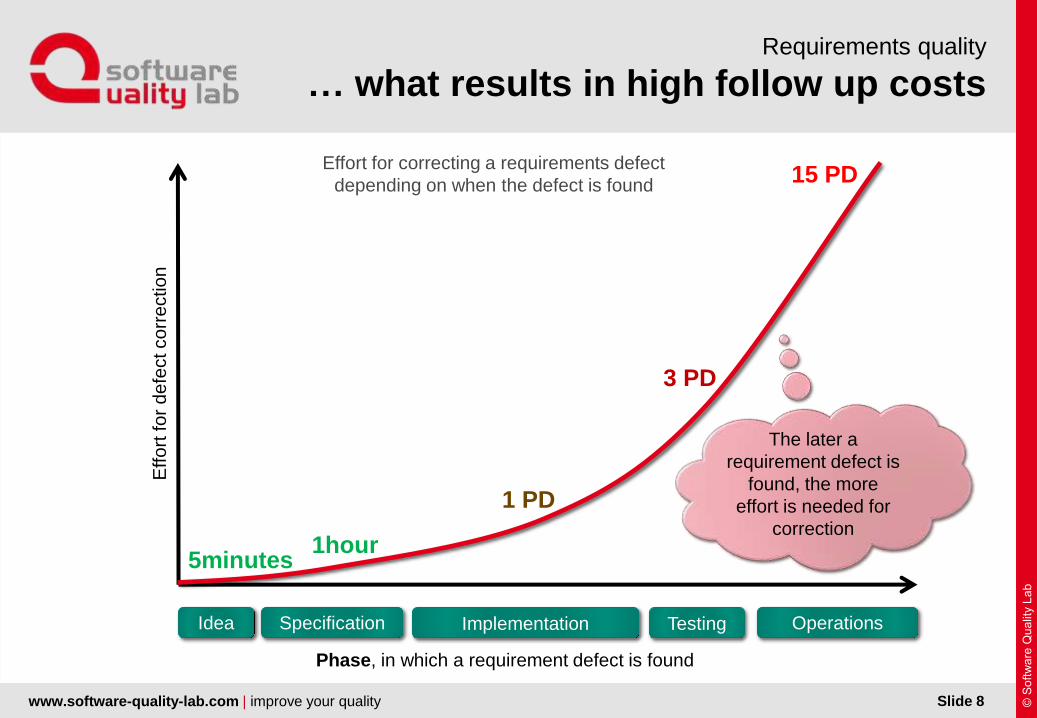
… what results in high follow up costsRequirements quality
Slide 8
Idea Specification Implementation Testing Operations
Effo
rtfo
r d
efe
ctco
rre
ctio
n
5minutes1hour
1 PD
3 PD
15 PD
Phase, in which a requirement defect is found
Effort for correcting a requirements defect
depending on when the defect is found
The later a
requirement defect is
found, the more
effort is needed for
correction
www.software-quality-lab.com | improve your quality
SWQL Präsentationsvorlage V8.0
Status quo and causes
Slide 9
www.software-quality-lab.com | improve your quality
SWQL Präsentationsvorlage V8.0
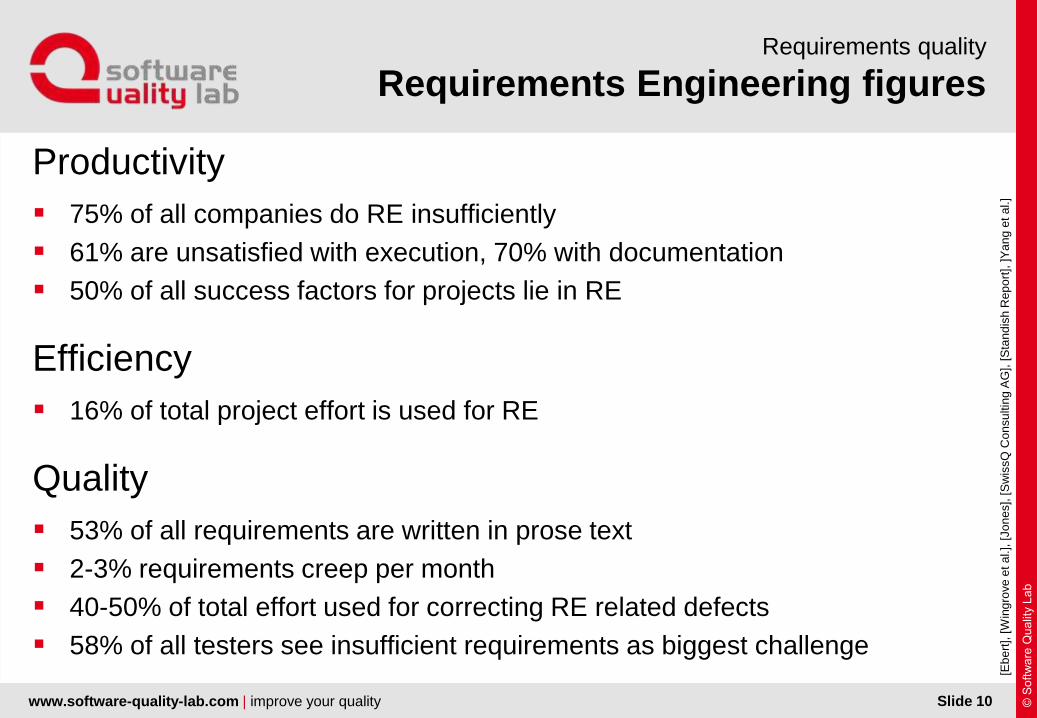
Requirements Engineering figuresRequirements quality
Productivity
75% of all companies do RE insufficiently
61% are unsatisfied with execution, 70% with documentation
50% of all success factors for projects lie in RE
Efficiency
16% of total project effort is used for RE
Quality
53% of all requirements are written in prose text
2-3% requirements creep per month
40-50% of total effort used for correcting RE related defects
58% of all testers see insufficient requirements as biggest challenge
Slide 10
[Eb
ert
], [W
ing
rove
et a
l.],
[Jo
ne
s],
[S
wis
sQ
Con
su
ltin
g A
G],
[S
tan
dis
h R
ep
ort
], ]Y
an
g e
t a
l.]
www.software-quality-lab.com | improve your quality
SWQL Präsentationsvorlage V8.0
… and how to get them
We need better requirements!
Slide 11
www.software-quality-lab.com | improve your quality
SWQL Präsentationsvorlage V8.0
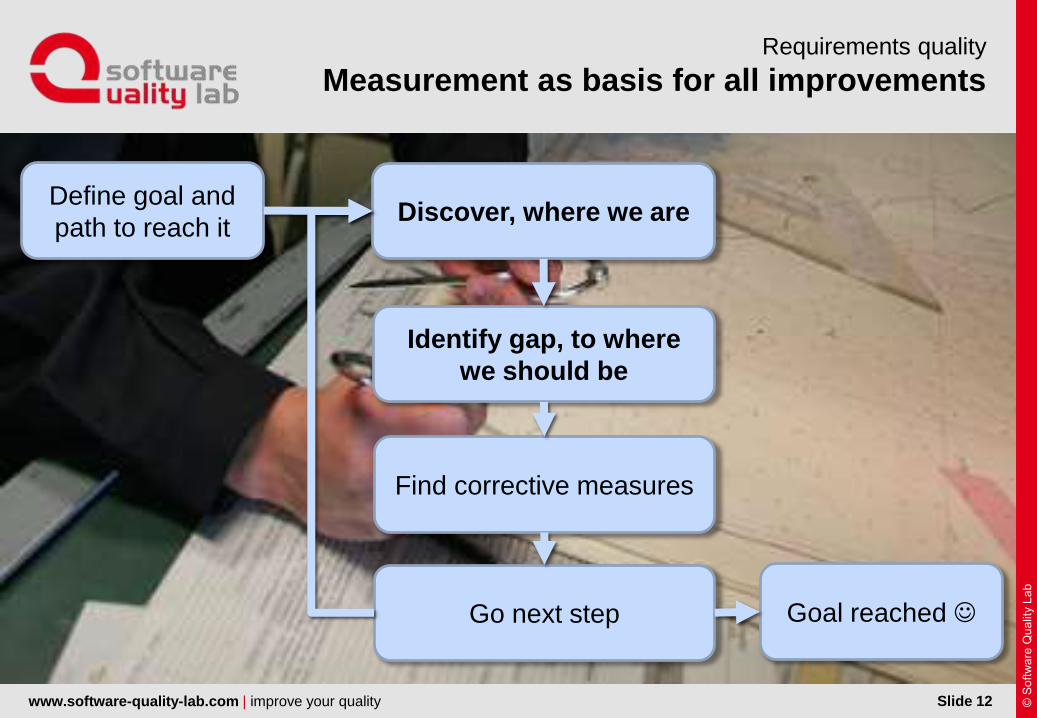
Measurement as basis for all improvementsRequirements quality
Slide 12
Define goal and
path to reach itDiscover, where we are
Identify gap, to where
we should be
Find corrective measures
Go next step Goal reached
www.software-quality-lab.com | improve your quality
SWQL Präsentationsvorlage V8.0
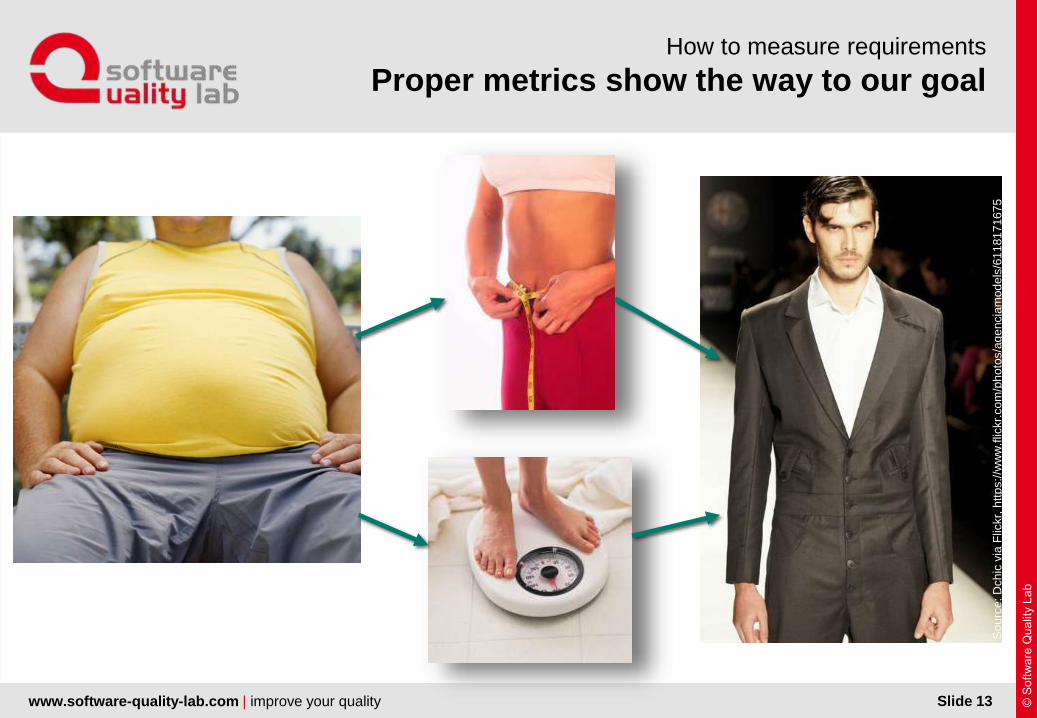
Proper metrics show the way to our goalHow to measure requirements
Slide 13
So
urc
e: D
ch
icvia
Flic
kr,
htt
ps:/
/ww
w.f
lickr.
co
m/p
ho
tos/a
ge
ncia
mod
els
/61
181
716
75
www.software-quality-lab.com | improve your quality
SWQL Präsentationsvorlage V8.0
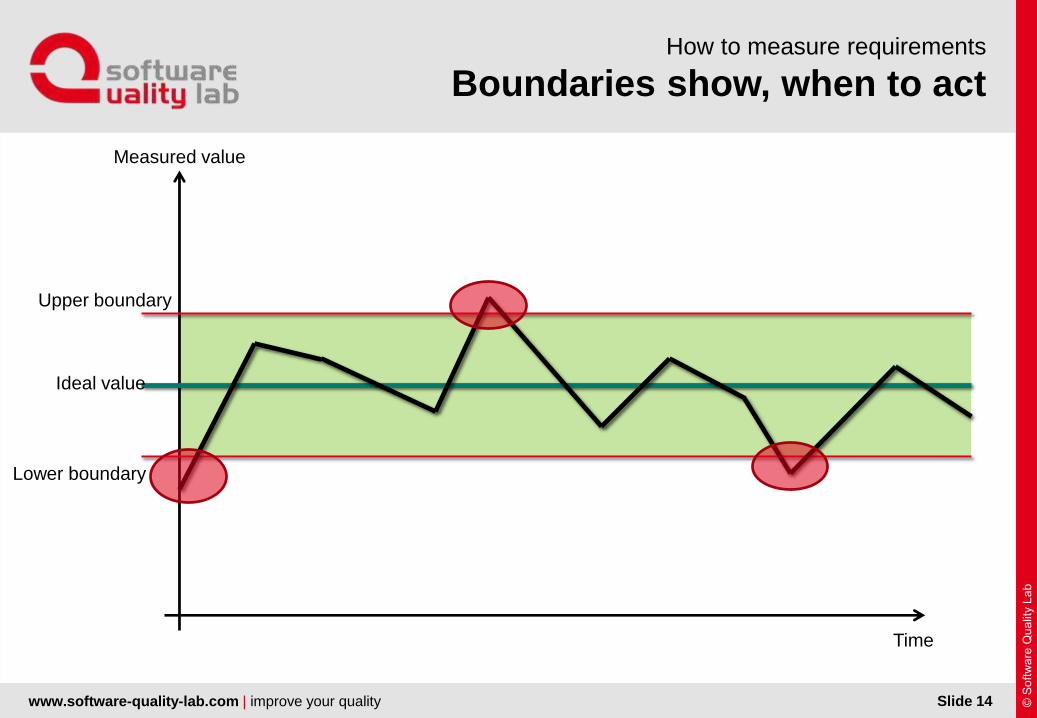
Boundaries show, when to actHow to measure requirements
Slide 14
Upper boundary
Lower boundary
Ideal value
Measured value
Time
www.software-quality-lab.com | improve your quality
SWQL Präsentationsvorlage V5.00
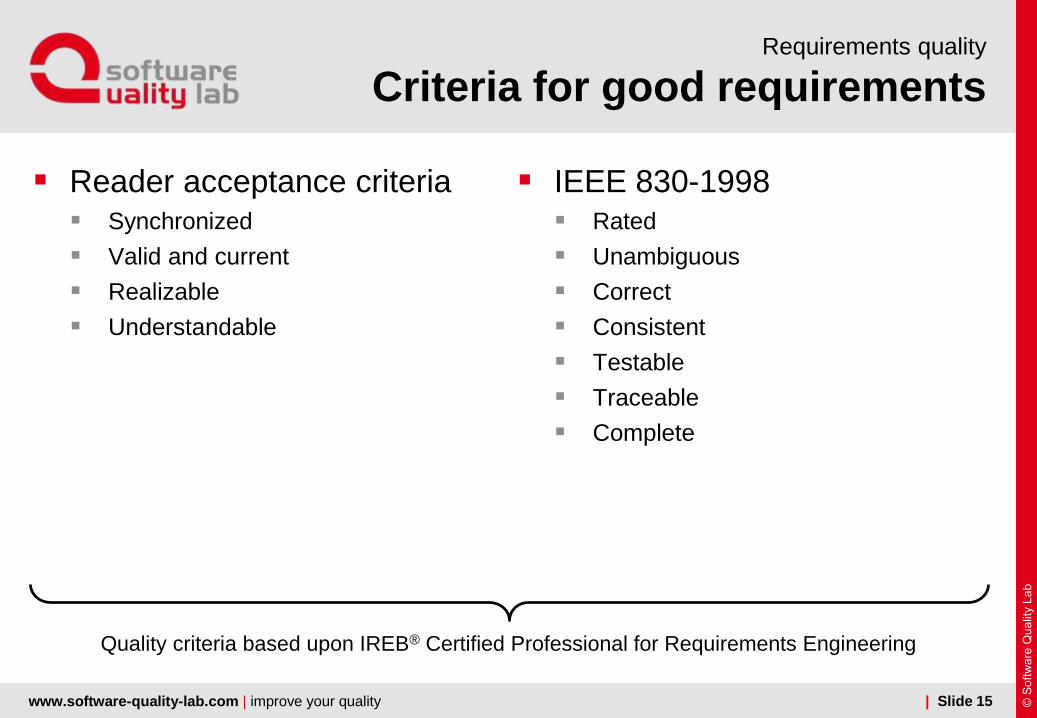
Criteria for good requirementsRequirements quality
Reader acceptance criteria Synchronized
Valid and current
Realizable
Understandable
IEEE 830-1998 Rated
Unambiguous
Correct
Consistent
Testable
Traceable
Complete
Quality criteria based upon IREB® Certified Professional for Requirements Engineering
| Slide 15
www.software-quality-lab.com | improve your quality
SWQL Präsentationsvorlage V8.0
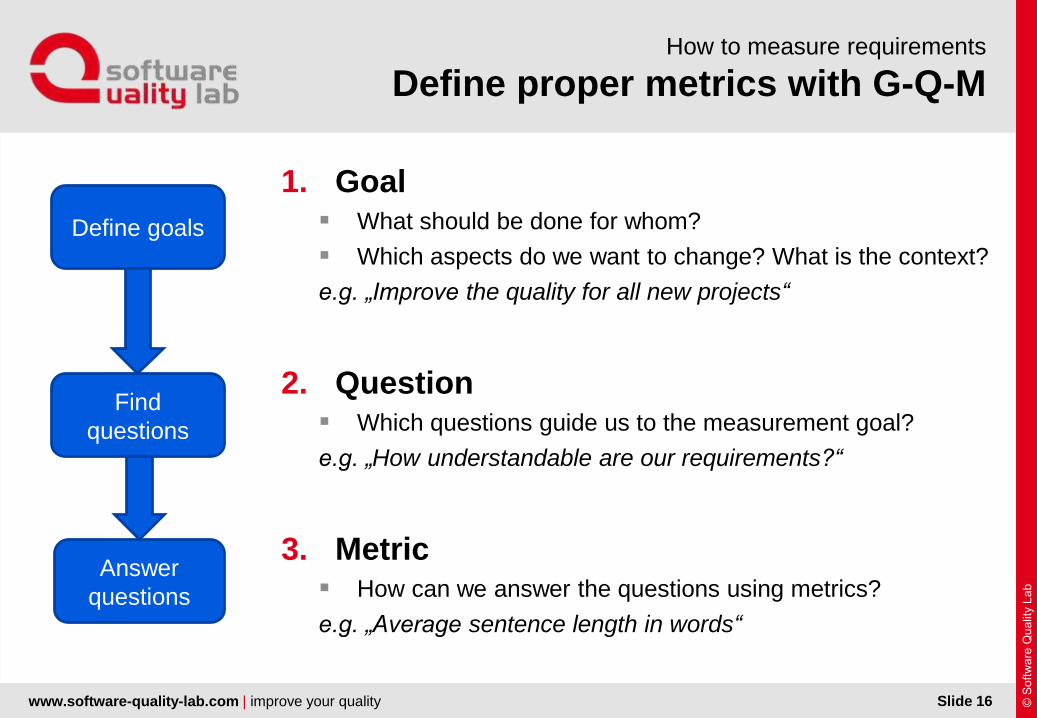
Define proper metrics with G-Q-MHow to measure requirements
1. Goal What should be done for whom?
Which aspects do we want to change? What is the context?
e.g. „Improve the quality for all new projects“
2. Question Which questions guide us to the measurement goal?
e.g. „How understandable are our requirements?“
3. Metric How can we answer the questions using metrics?
e.g. „Average sentence length in words“
Slide 16
Define goals
Find
questions
Answer
questions
www.software-quality-lab.com | improve your quality
SWQL Präsentationsvorlage V8.0
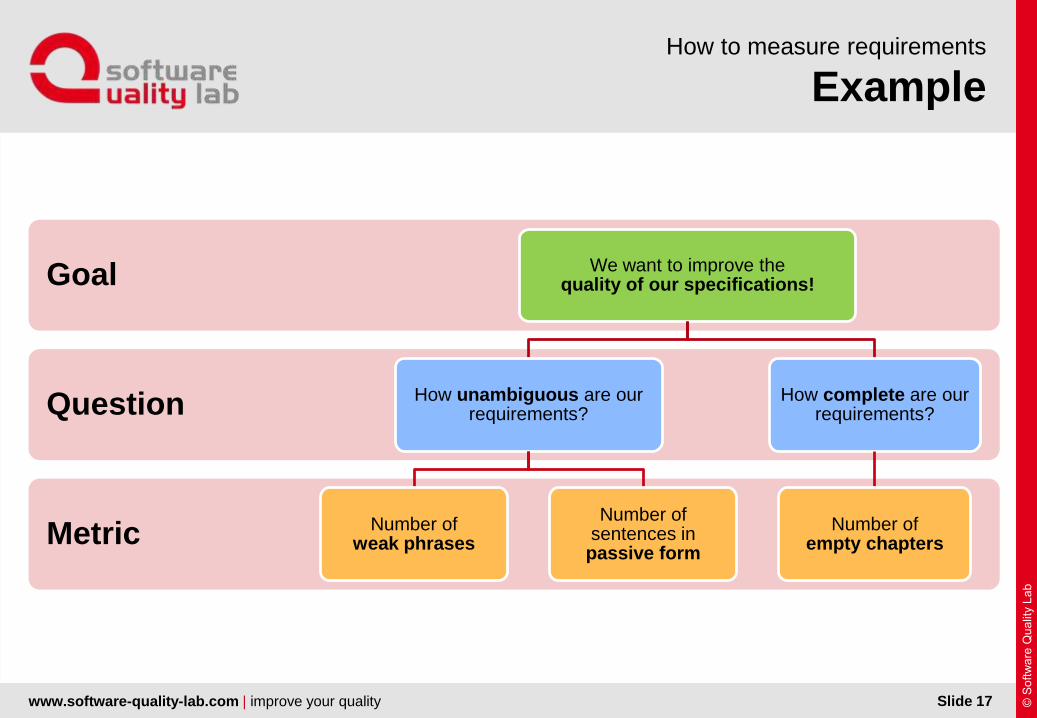
ExampleHow to measure requirements
Slide 17
Metric
Question
Goal We want to improve thequality of our specifications!
How unambiguous are ourrequirements?
Number ofweak phrases
Number ofsentences in
passive form
How complete are ourrequirements?
Number ofempty chapters
www.software-quality-lab.com | improve your quality
SWQL Präsentationsvorlage V8.0
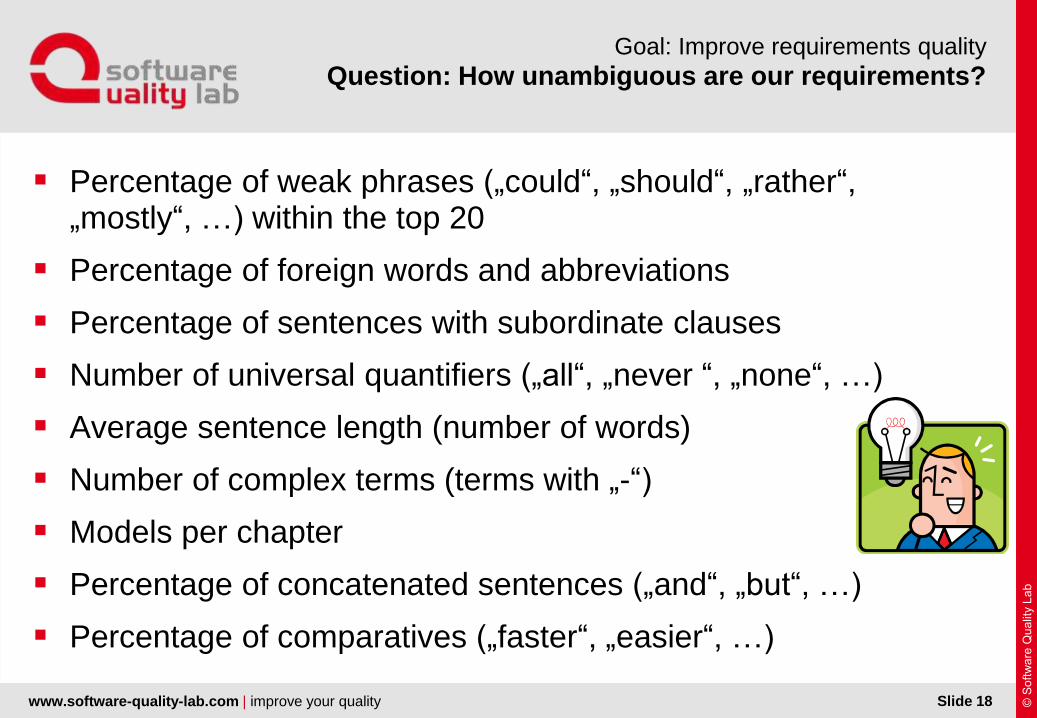
Question: How unambiguous are our requirements?Goal: Improve requirements quality
Percentage of weak phrases („could“, „should“, „rather“, „mostly“, …) within the top 20
Percentage of foreign words and abbreviations
Percentage of sentences with subordinate clauses
Number of universal quantifiers („all“, „never “, „none“, …)
Average sentence length (number of words)
Number of complex terms (terms with „-“)
Models per chapter
Percentage of concatenated sentences („and“, „but“, …)
Percentage of comparatives („faster“, „easier“, …)
Slide 18
www.software-quality-lab.com | improve your quality
SWQL Präsentationsvorlage V8.0
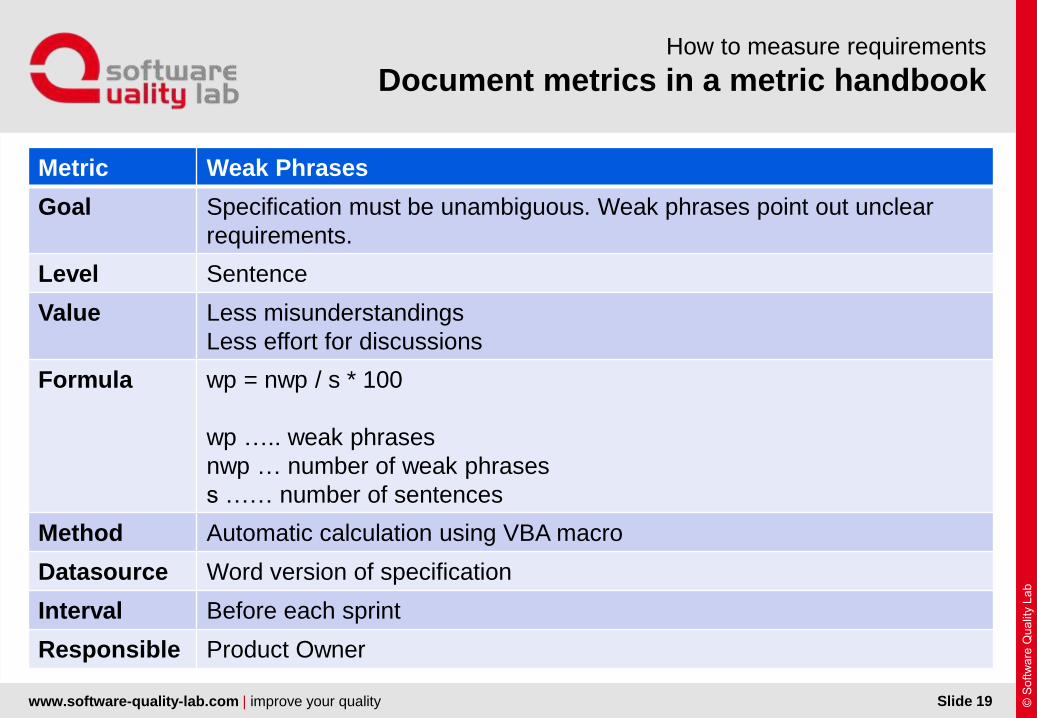
Document metrics in a metric handbookHow to measure requirements
Slide 19
Metric Weak Phrases
Goal Specification must be unambiguous. Weak phrases point out unclear
requirements.
Level Sentence
Value Less misunderstandings
Less effort for discussions
Formula wp = nwp / s * 100
wp ….. weak phrases
nwp … number of weak phrases
s …… number of sentences
Method Automatic calculation using VBA macro
Datasource Word version of specification
Interval Before each sprint
Responsible Product Owner
www.software-quality-lab.com | improve your quality
SWQL Präsentationsvorlage V8.0
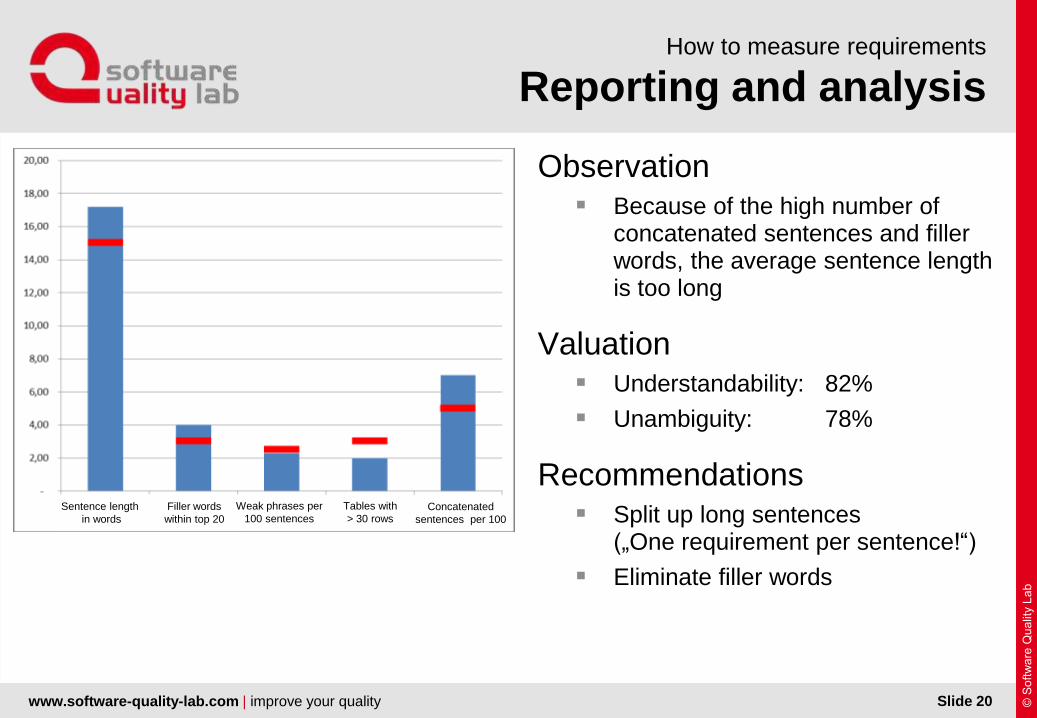
Reporting and analysisHow to measure requirements
Observation Because of the high number of
concatenated sentences and fillerwords, the average sentence lengthis too long
Valuation Understandability: 82%
Unambiguity: 78%
Recommendations Split up long sentences
(„One requirement per sentence!“)
Eliminate filler words
Slide 20
Sentence length
in words
Filler words
within top 20
Weak phrases per
100 sentences
Tables with
> 30 rowsConcatenated
sentences per 100
www.software-quality-lab.com | improve your quality
SWQL Präsentationsvorlage V8.0
Sample metrics with target rangeHow to measure requirements
Slide 21
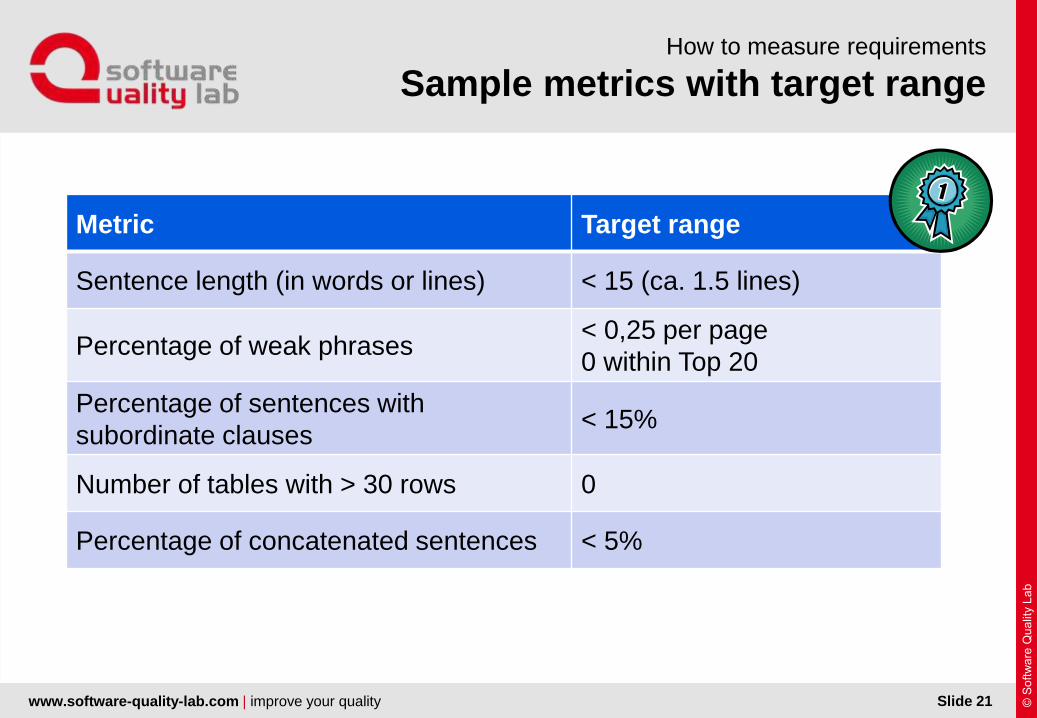
Metric Target range
Sentence length (in words or lines) < 15 (ca. 1.5 lines)
Percentage of weak phrases< 0,25 per page
0 within Top 20
Percentage of sentences with
subordinate clauses< 15%
Number of tables with > 30 rows 0
Percentage of concatenated sentences < 5%
www.software-quality-lab.com | improve your quality
SWQL Präsentationsvorlage V8.0
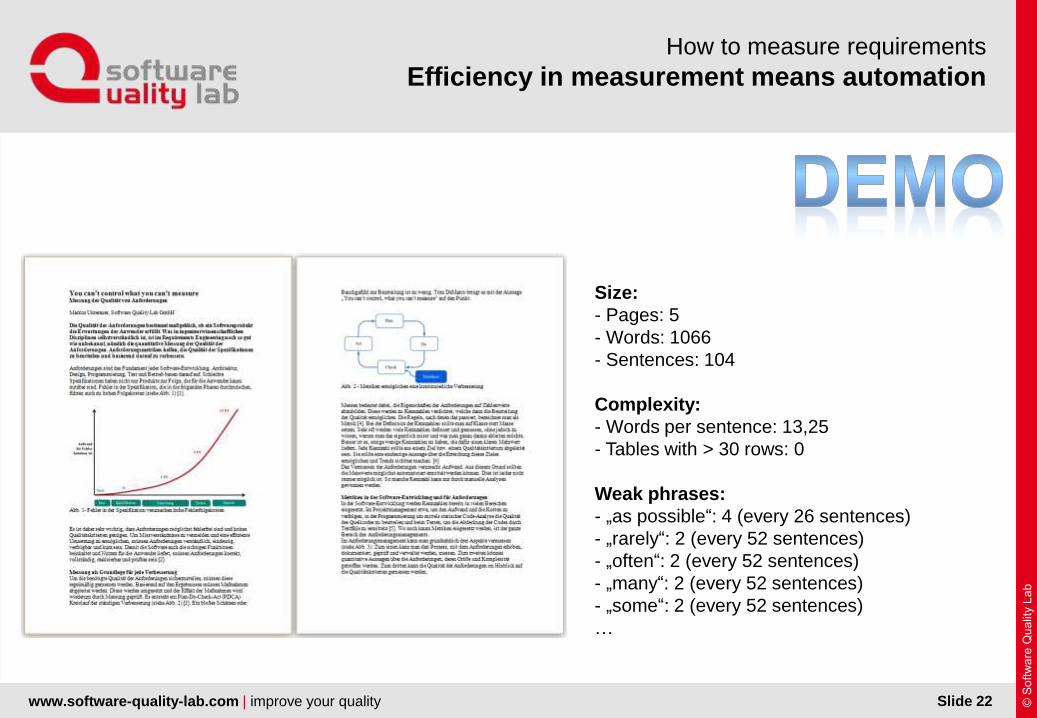
Efficiency in measurement means automationHow to measure requirements
Slide 22
Size:
- Pages: 5
- Words: 1066
- Sentences: 104
Complexity:
- Words per sentence: 13,25
- Tables with > 30 rows: 0
Weak phrases:
- „as possible“: 4 (every 26 sentences)
- „rarely“: 2 (every 52 sentences)
- „often“: 2 (every 52 sentences)
- „many“: 2 (every 52 sentences)
- „some“: 2 (every 52 sentences)
…
www.software-quality-lab.com | improve your quality
SWQL Präsentationsvorlage V8.0
Tips for starting your requirements quality metric system
How to measure requirements
Define metrics top down, not bottom up
Goal > Question > metric
Not: „Hey, look how many things we can measure!“
Concentrate on 5 - 10 metrics, e.g. these:
Sentence length (in words or lines)
Percentage of weak phrases
Percentage of sentences with subordinate clauses
Number of tables with > 30 rows
Percentage of concatenated sentences
Define lower and upper boundary together with your team … or measure without boundaries for some iterations and define boundaries then
Start with automatically measurable measures
Define, what to do with the metrics
Slide 23
Image: htt
p:/
/pix
abay.c
om
/en/b
ulb
-lig
ht-
lam
p-e
lectr
ic-1
60207/
www.software-quality-lab.com | improve your quality
SWQL Präsentationsvorlage V8.0
SummaryKey learnings from this session
Poor requirements lead to bad software
Measuring requirements quality using metrics is essential Objectivly judge quality
Derive actions and evaluate effectiveness
Use GQM method for metric definition G – Define goals
Q – Ask questions
M – Define metrics to answer the questions
Automate measurement
Slide 24
SWQL Präsentationsvorlage V6.00
Your Partner in Software Quality and Testing
Software Quality Lab GmbH
www.software-quality-lab.com
Consulting | Service | Academy | Tool Expertise
Markus [email protected]