Yoojung kim Air Pollution Modeling Lab. Dept. Environmental Engineering, Konkuk Univ. Seoul, Korea.
25
Yoojung kim Air Pollution Modeling Lab. Dept. Environmental Engineering, Konkuk Univ. Seoul, Korea.
-
Upload
mary-gorsuch -
Category
Documents
-
view
219 -
download
2
Transcript of Yoojung kim Air Pollution Modeling Lab. Dept. Environmental Engineering, Konkuk Univ. Seoul, Korea.

Yoojung kim
Air Pollution Modeling Lab.Dept. Environmental Engineering,
Konkuk Univ.Seoul, Korea.

Introduce of Konkuk Univ. since 1946 No. of Student : 18,856
(2001) faculty : 590 (2001) The undergraduate
school 13 colleges 58 major fields
the graduate school 54 major fields on the
master's level 41 major fields on the
doctoral level

Introduce of Air Pollution Modeling Lab.
Faculty Prof. Young Sunwoo
Research Regional/Local scale air quality Air pollution modeling, measurement & analysis, EIA
Project Long-Range Transboundary Air Pollutants In background area (col
laboration with 4 Univ.) Regional air quality measurement 5 stations
Emission inventories for air pollutants (collaboration with 2 Univ.) Developing on emission factor for anthropogenic VOCs in Korea (e
x. Printing, dry cleaning, gas station) Members
6 post-graduate collaborator 9 graduate students

The study of fugitive dust impact under construction
Title The study of fugitive dust impact under the secondary construction of Inchon International Airport
Purpose The prediction of fugitive dust concentration on the airport f
acility & the residence site nearby construction site of the Inchon airport extension and mountain cutting (the source of fill up the field)
The possible abrasion influence for aircraft Period
Oct. 2002 ~ July 2003 (10 months)

Inchon International Airport
reclaim field
Passenger Terminal Building
runway

Inchon International Airport Map
Main Source(200
5)
Reclaim land from the sea to build a new
airport
Main Source(200
7)
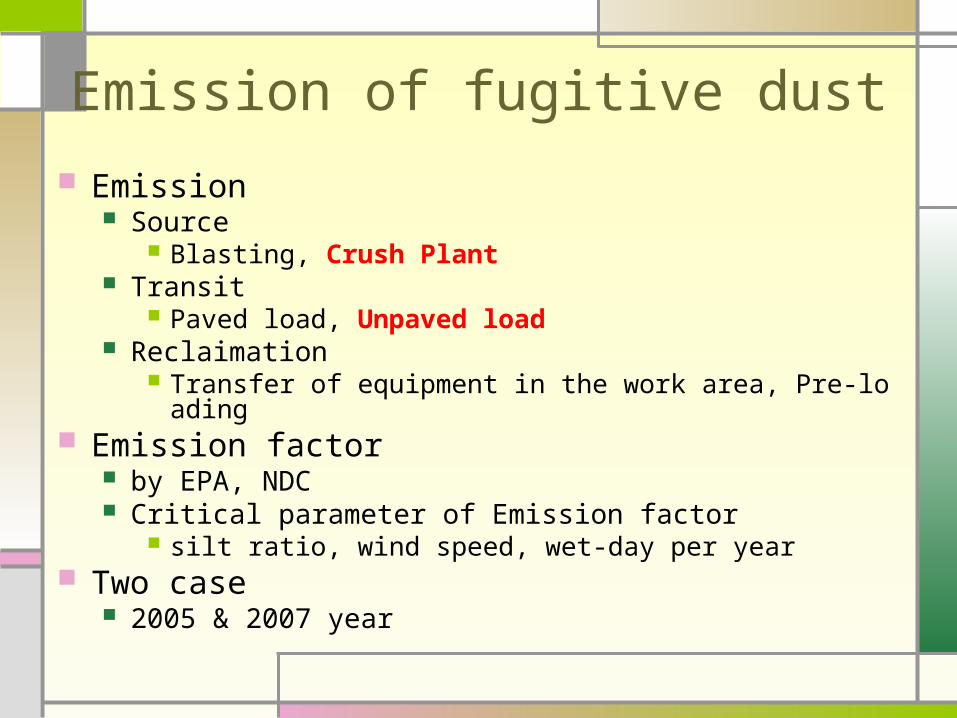
Emission of fugitive dust
Emission Source
Blasting, Crush Plant Transit
Paved load, Unpaved load Reclaimation
Transfer of equipment in the work area, Pre-loading Emission factor
by EPA, NDC Critical parameter of Emission factor
silt ratio, wind speed, wet-day per year Two case
2005 & 2007 year

Meteorological data & Parameter for Model
Use the ISCST3 (Inderstrial Source Complex) Model Gaussian model Useful for non-reaction pollutant
Meteorological data The data from the AWS at Inchon airport(2001) Wind direction, wind speed, temp., stability, mixing height
Domain 13km x 10km
Receptor Grid (500m by 500m)
Add on the receptor point at Airport facility & residence Pollutant
PM10 Annual/24h average conc.
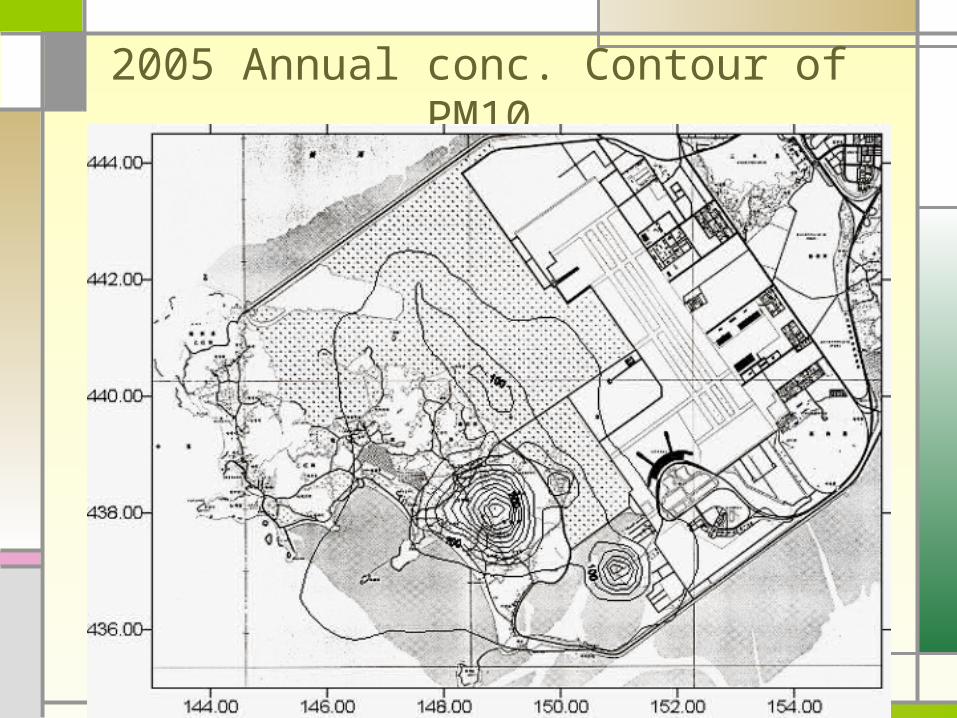
2005 Annual conc. Contour of PM10

2007 Annual conc. Contour of PM10

Discussion In 2005, the level of ambient PM10 conc. would not meet
air quality standard The residence area nearby the source (mountain) In
annual/24h average Air quality standard of PM10
70㎛ /㎥ (annual avg.) and 120㎛ /㎥ (24h avg.) In 2007, meet air quality standard at the residence and the
airport Crush Plant is the important source of PM10 Dust influence for aircraft
Very little reference are available so far Based on wind-blown dust events
experience(100~500㎍ /㎥ ), the level of conc. from the construction (maximum 200㎍ /㎥ ) may not be very critical.
Need further investigation
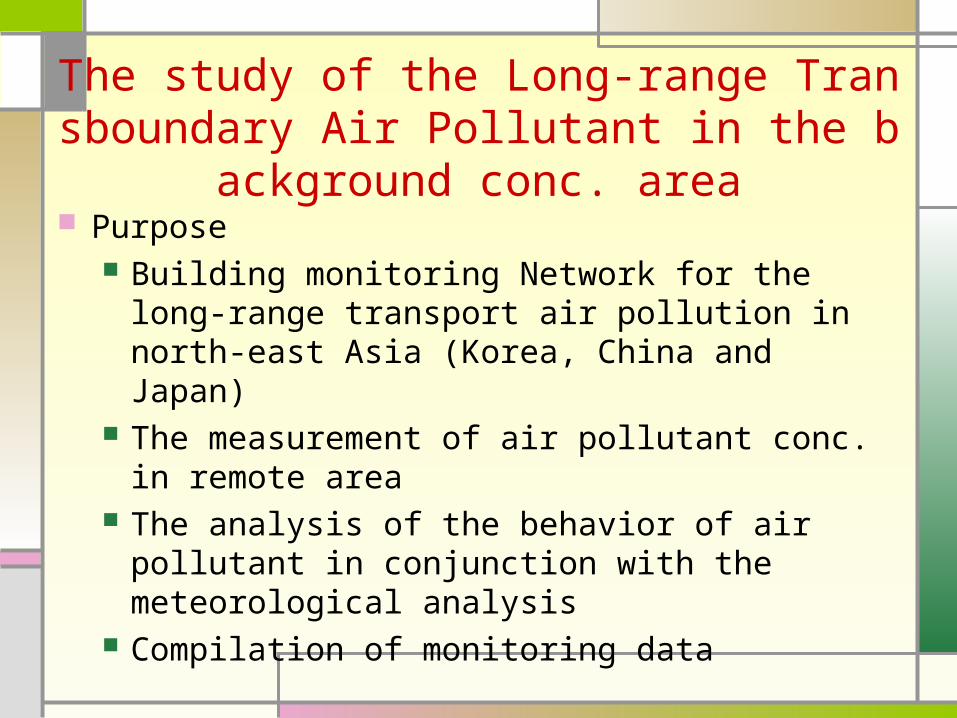
The study of the Long-range Transboundary Air Pollutant in the background conc. area
Purpose Building monitoring Network for the long-
range transport air pollution in north-east Asia (Korea, China and Japan)
The measurement of air pollutant conc. in remote area
The analysis of the behavior of air pollutant in conjunction with the meteorological analysis
Compilation of monitoring data

The Location of observation site
The Location of observation site 5 site (Ganghwa, Taean, Geoje, Goseong, Gosan)

History 1st project(1995~1999)
The study of the long-range transboundary air pollutant in north-east Asia & collaboration for preservation of Environment
1st year(1995) Determination of measurement method at surface station and ana
lysis. 2nd year(1996)
Continue measurement Add DMS meteorological analysis international research

3rd year(1997) Add measurement station(3 in Korea, 1 in China) Total 7 measurement station Add PM10 on measurement list Measurement DMS(at Gosan), MSA(at Ganghwa) & E
stimate emission amount Estimate incoming quantity of air pollutant
4th year intensively measurement in 3 period at 6 station Measurement Every 6 day Estimate dry deposition Estimate incoming quantity of air pollutant Comparison with other country’s data Enhancing data quality

2nd project(2000~2003) The study of the Long-range Transboundary Air Pollutant in t
he background conc. area 1st year(2000)
Continue analysis for 1st Project (for four years) Measurement of aerosol size distribution VOCs monitoring Measurement in background area
2nd year(2001) Enhancing cooperative network of remote monitoring for be
tter data quality in background area 3rd year(2002)
Back trajectory Analysis from PM2.5 mass conc. & ionic conc. of soluble property
Intensively measurement of PM2.5 (March, April, December)

MESUREMENT ITEMS Measurement Categories
PM10, PM2.5, aerosol size distribution, elemental properties, major gas species, VOCs, carbon species and metals
Each category have been measured for once a day Analysis Categories
Mass conc. (PM10, PM2.5. size distribution) Water-soluble ionic elements of PM10, PM2.5
Cl-, NO3-, SO42-, HCl, HNO3, NH3, Na+, NH4+, K+, Mg2+, Ca2+ Carbon analyze
OC, EC (Organic Carbon, Elemental Carbon) metals elements
Fe, Al, Ca, K, Na, Mg, S, Zn, Pb, Ti, Mn, Cu, V, Sr, Ni, Ba, Cd, Cr VOCs
VOCs were detected which based on POCP (Photochemical Ozone Creation Potential)
Measurement period Three times a year (During consequently 15days-April, 10days-May, 10days-no
vember) West wind is the prevaily wind direction for spring/fall

Characteristics Among Site(2002. March, April, Dec.)
Overall PM2.5 mass
ANOVA(p<0.05) : Group Ⅰ(KH,TA, GS), Group Ⅱ(KS, GJ)
0
10
20
30
40
50
60
Kanghwa Taean Gouje Kosung Gosan
Co
ncen
tra
tio
n (
㎍/ ㎥
)
Group 1Group ІІ

Define geographical sectors for back trajectory analysis

Back Trajectory Analysis Among 5 Sites(2002. March, April)
2002. 3. 5
2002. 3. 10
Sector Ⅰ Sector Ⅱ

2002. 4. 22
2002. 4. 27
Sector Ⅲ Sector Ⅳ

PM2.5 mass
PM2.5 mass
0
10
20
30
40
50
3.5 3.10 4.22 4.27
Co
nce
ntr
ati
on
( ㎍/ ㎥
)
Kanghwa Taean Gouje Kosung Gosan
Sector Ⅰ(3/5), Ⅱ(3/10) : highest PM2.5 mass conc., Except GJ
Sector Ⅲ (4/22) : lowest PM2.5 mass conc., From south sea
S І S ІІ S ІІІ S Ⅳ

Plan
Need for quantitative transport analysis LRT analysis using CTM is required
(ex. STEM) Mainly focus on aerosols (my interest) Gas phases modeling will be conducted
by one of my colleague. Initial step for STEM will be a tracer
mode for aerosol.
What I did in Iowa Learning “how to” run MM5 Learning “how to” import emission data Learning “how to” run STEM
What I will do in Seoul Install & Run MM5/STEM Building cluster system (maybe 5 node or
more)

Appreciation prof. Carmichael, prof. Sunwoo Dr. Tang, Ms. Tongboonchoo, Dr. Woo, Mr. Hwang, Mr. Jeremie moen, Ms. Frank and
thens Thank you