YONGE NORTH SUBWAY EXTENSION BENEFITS CASE
64
YONGE NORTH SUBWAY EXTENSION BENEFITS CASE May 2013
Transcript of YONGE NORTH SUBWAY EXTENSION BENEFITS CASE

YONGE NORTH SUBWAY EXTENSIONBENEFITS CASE
May 2013

Yonge North Subway Extension
Benefits Case Analysis Update
Final Report
May 2013
Prepared for: Prepared by:
Metrolinx
20 Bay Street
Suite 901
Toronto ON M5J 2W3
Steer Davies Gleave
1500-330 Bay Street
Toronto, ON M5H 2S8
+1 (647) 260 4860
www.steerdaviesgleave.com


Benefits Case Analysis Update
Contents
CONTENTS
EXECUTIVE SUMMARY ...................................................................................... I
1 INTRODUCTION ..................................................................................... 1
Context ................................................................................................ 1
Benefits Case Analysis & Project Development ................................................. 2
Yonge North Subway Extension Interim BCA (2009)............................................ 3
Report Structure ..................................................................................... 4
2 PROJECT RATIONALE .............................................................................. 5
Context and Need .................................................................................... 5
Project Objectives ................................................................................. 12
Project Overview ................................................................................... 12
Opportunities and Challenges .................................................................... 17
3 PROJECT OPTIONS ................................................................................ 23
Project Options ..................................................................................... 23
Base Case ............................................................................................ 23
Option 1: Subway extension to Richmond Hill Centre ....................................... 25
Option 2: Phased subway extension ............................................................ 27
Option 2A: Phased subway extension and increased GO frequencies .................... 28
Summary ............................................................................................. 29
4 PROJECT ASSESSMENT ........................................................................... 31
Introduction ......................................................................................... 31
Evaluation Framework ............................................................................ 31
Transportation User Account .................................................................... 32
Financial Account .................................................................................. 34
Environmental Impacts ............................................................................ 37
Economic Development Impacts................................................................. 39
Social Community Account ....................................................................... 47
Sensitivity Analysis ................................................................................. 49
Summary Results ................................................................................... 50

Benefits Case Analysis Update
Contents
FIGURES
Figure 1.1 Metrolinx project development process .................................. 2
Figure 2.1 The Yonge North Subway Extension ....................................... 6
Figure 2.2 York Region’s Planning Framework for the Yonge Extension Corridor
(Between Steeles and Richmond Hill) .................................. 10
Figure 2.3 North York Centre Secondary Plan Density Limits .................... 11
Figure 2.4 Existing Yonge north corridor Transit Network Diagram ............ 14
Figure 3.1 Yonge North Subway Extension .......................................... 26
Figure 4.1 2031 Southbound Ridership Profiles (AM Peak Hour) ................ 35
Figure 4.2 CAC Emission Savings in 2031 ............................................ 38
Figure 4.3 Property Market Impact Timing .......................................... 44
TABLES
Table 3.1 Option 1 Travel Times and Speeds ...................................... 27
Table 3.2 Option 2 Travel Times and Speeds ...................................... 28
Table 3.3 Summary of Yonge North Subway Extension BCA Options ........... 29
Table 4.1 Travel Time Benefits in YEAR 2031 ($m 2011) ........................ 32
Table 4.2 Incremental Transportation User Benefits (PV $m) .................. 34
Table 4.3 Total Capital Costs ($M 2011) ............................................ 36
Table 4.4 Annual Net Operating Costs in 2031 ($M 2011) ....................... 36
Table 4.5 Comparison of Benefits and Costs (PV $M)............................. 37
Table 4.7 Economic Impact during Construction .................................. 40
Table 4.8 Long Term Employment and Income Impacts ......................... 41
Table 4.9 Land Value Uplift factors ................................................. 45
Table 4.10 Potential Land Value Uplift ($M) ........................................ 46
Table 4.11 Economic Development Impacts (Direct and Indirect) .............. 47
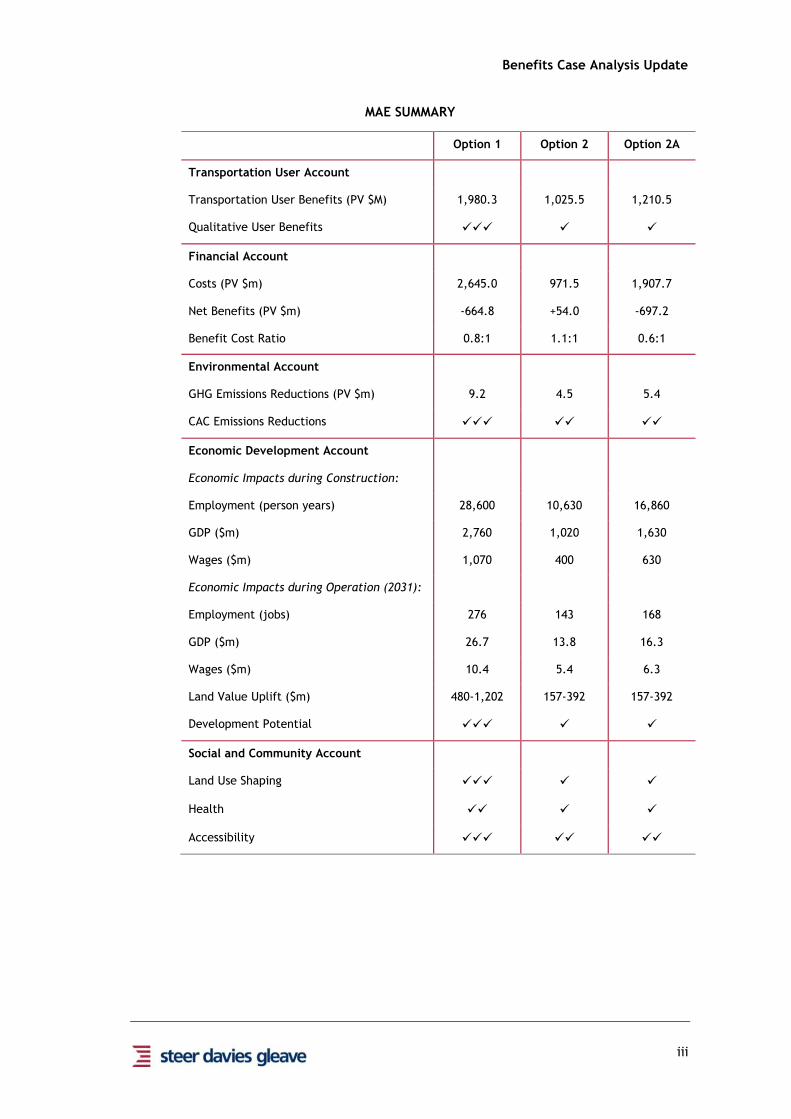
Table 4.12 MAE Summary ............................................................... 51
APPENDICES
A ASSUMPTIONS TABLE

Benefits Case Analysis Update
i
Executive Summary
The Benefits Case Analysis (BCA) update for the proposed Yonge Subway North
Extension was undertaken in 2011. Since then Metrolinx and York Region have
undertaken further planning studies to inform the BCA’s conclusions. The
findings from these have been incorporated into this report. The results of
the analysis are unchanged and remain based on the available data provided
in 2011.
1. In November 2008 the Metrolinx Board approved the Regional Transportation
Plan (RTP) entitled The Big Move, a 25-year plan for the implementation of the
Province's MoveOntario 2020 vision of 52 new rapid transit projects in the
Greater Toronto and Hamilton Area (GTHA) by 2020.
2. The proposed Yonge North Subway Extension is a top 15 priority transit project
in the GTHA. This report provides an update on the interim Benefits Case
Analysis (BCA) that was carried out for the project in June 2009.
3. Benefits Case Analysis entails the robust and consistent Multiple Account
Evaluation (MAE) of the relative environmental, economic and social impacts of
proposed projects, by considering their benefits and costs, and hence the trade-
offs, between a set of project options. This process is a key input to the
Metrolinx Project Prioritization Framework and assists decision-making for
unfunded rapid transit projects.
4. The project evaluated in this BCA is an extension of the Yonge subway line north
from Finch Station in Toronto across the municipal boundary to Richmond Hill
Centre in York Region.
5. The Yonge North Subway Extension is supported by a wealth of policy and
planning documents beyond The Big Move. Population and employment forecasts
suggest that York Region will be one of the fastest growing areas in the GTHA
and neighbours Toronto, which already has significant existing population and
employment that are also projected to grow. Both York Region and Toronto
have undertaken or are underway with a planning policy framework that
supports urban intensification along its major rapid transit centers and
corridors. These policy and planning studies support the significant increase in
ridership projected for the Yonge corridor.
6. Three proposed options for the Yonge North Subway Extension were evaluated
against the Base Case:
I The Base Case for this analysis is defined as the committed municipal bus
network, as well as, the funded transit infrastructure projects such as the
subway extension to Vaughan Metropolitan Centre and Yonge Subway capacity
improvements, Eglinton-Scarborough Crosstown LRT and Viva BRT expansion
I Option 1: Subway extension to Richmond Hill Centre – subway extension from
existing Finch subway station to Richmond Hill Centre (RHC) serving six new
stations at Cummer, Steeles, Clark, Royal Orchard, Langstaff and RHC.

Benefits Case Analysis Update
ii
I Option 2: Phased subway extension - initial subway extension from existing
Finch subway station to Steeles Avenue serving two new stations at Cummer
and Steeles.
I Option 2A: Phased subway extension and increased GO frequencies - initial
subway extension from existing Finch subway station to Steeles Avenue serving
two new stations at Cummer and Steeles. Increased GO service frequencies
between Richmond Hill GO station and Union.
7. A summary of the MAE analysis is shown below. Option 1 performs most strongly
for four of the accounts and is forecast to generate almost twice the level of
transportation user benefits, and approximately three times the estimated land
value impact of Option 2. On the fifth account, the significant capital cost of
Option 1 contributes to a lower Benefit Cost ratio than Option 2 and a negative
value for Net Benefits.
8. Phasing the construction could mitigate these costs by making the construction
more affordable and capturing a portion of the benefits. However Places to Grow
growth assumptions and associated transit demand on the corridor suggest that
the extension to Richmond Hill Centre provides a more long term solution to
accommodate all the forecast growth.
9. Ridership resulting from implementing the Yonge North Subway Extension may
challenge downstream capacity on the Yonge subway line. To address this concern
Metrolinx will be undertaking a regional network capacity analysis, in partnership
with York Region and the City of Toronto, to determine how to sequence
construction of the Yonge subway extension to Richmond Hill Centre (Option 1)
with the phased implementation of other network improvements such as
automatic train control, the Downtown Relief Line, Union Station and
Yonge/Bloor improvements.
10. In considering value for money through the traditional cost-benefit accounts,
Option 2 has a positive Net Benefit and a Benefit Cost Ratio exceeding 1:1.
However, from an economic and land value perspective, Option 2 amounts to less
than 35% of that of the full subway extension (Option 1) and half the long term
impact.
11. Option 2A is forecasted to generate greater benefits than Option 2, but the high
costs of increasing GO frequencies indicate that this option is the poorest return
on investment of the options.
Benefits Case Analysis Update
iii
MAE SUMMARY
Option 1 Option 2 Option 2A
Transportation User Account
Transportation User Benefits (PV $M) 1,980.3 1,025.5 1,210.5
Qualitative User Benefits
Financial Account
Costs (PV $m) 2,645.0 971.5 1,907.7
Net Benefits (PV $m) -664.8 +54.0 -697.2
Benefit Cost Ratio 0.8:1 1.1:1 0.6:1
Environmental Account
GHG Emissions Reductions (PV $m) 9.2 4.5 5.4
CAC Emissions Reductions
Economic Development Account
Economic Impacts during Construction:
Employment (person years) 28,600 10,630 16,860
GDP ($m) 2,760 1,020 1,630
Wages ($m) 1,070 400 630
Economic Impacts during Operation (2031):
Employment (jobs) 276 143 168
GDP ($m) 26.7 13.8 16.3
Wages ($m) 10.4 5.4 6.3
Land Value Uplift ($m) 480-1,202 157-392 157-392
Development Potential
Social and Community Account
Land Use Shaping
Health
Accessibility


Benefits Case Analysis Update
1
1 Introduction
Context
1.1 In 2006, the Government of Ontario created the Greater Toronto Transportation
Authority, renamed to Metrolinx in 2007. Since the creation of Metrolinx, the
organization has grown steadily. In May 2009, GO Transit, which delivers commuter
services, became Metrolinx’ first operating division. In 2010, the Union-Pearson
Airport Rail link became an operating division of Metrolinx along with PRESTO in
2011.
1.2 Metrolinx’ mandate is to improve the coordination and integration of the multi-
modal transportation network in the Greater Toronto and Hamilton Area (GTHA) to
achieve the objectives and vision set out in the Province’s Greater Golden
Horseshoe Growth Plan, known as ‘Places to Grow’.
1.3 In November 2008 the Metrolinx Board approved the Regional Transportation Plan
(RTP) entitled ‘The Big Move’, a 25-year plan for the implementation of the
Province’s MoveOntario 2020 vision of 52 new rapid transit projects in the GTHA by
2020. The RTP presented the new rapid transit proposals in four bundles. These
are:
I Top 15 priority projects;
I First 15 years;
I 16 to 25 years; and
I Projects for consideration beyond 25 years.
1.4 The Top 15 projects have completed, or are undergoing, Benefit Cases that assist
provincial decision-makers in determining project next steps and funding
decisions. For the balance of the unfunded projects, a Metrolinx Project
Prioritization Framework is under development, which will also be used to assist
decision-making. The Framework links to the Vision, Goals and Objectives set out
in ‘The Big Move’ and also incorporates the results from the Benefit Case Analyses
(BCAs).

Benefits Case Analysis Update
2
Benefits Case Analysis & Project Development
1.5 Benefits Case Analysis (BCA) entails the robust and consistent Multiple Account
Evaluation (MAE) of the relative environmental, economic and social impacts of
proposed rapid transit projects, by considering their benefits and costs, and hence
the trade-offs, between a set of project options. These options may include
variations in alignment, technology, performance, stations and/or phasing of the
project.
1.6 The results are presented in a clear and consistent way to assist decision-makers in
selecting a preferred option in terms of most appropriate project scope and
implementation phasing. In doing so, provides direction for the further
development of the project.
1.7 Following the determination of a preferred project option, a planning, design and
engineering (PDE) program takes the project to the next stage of development.
The process is intended to reduce delivery risk by refining the project scope.
Figure 1.1 shows an overview of the Metrolinx project development process.
FIGURE 1.1 METROLINX PROJECT DEVELOPMENT PROCESS
Source: Metrolinx

Benefits Case Analysis Update
3
Yonge North Subway Extension Interim BCA (2009)
1.8 The proposed Yonge North Subway Extension is identified as a top 15 priority
project and one of the currently prioritized transit projects in the GTHA. In
collaboration with the City of Toronto and York Region, Metrolinx developed an
interim high level project appraisal for the scheme. This interim BCA was
completed and released in June 2009.
1.9 The Yonge North Subway Extension interim BCA compared three options for the
Yonge Street corridor as follows:
I Subway extension from Finch to Richmond Hill with six stations (Cummer,
Steeles, Clark, Royal Orchard, Langstaff and Richmond Hill Centre);
I Subway extension from Finch to Richmond Hill with five stations (Royal Orchard
removed); and
I Bus Rapid Transit (BRT) operating in mixed traffic between Finch and Richmond
Hill Centre with Richmond Hill GO Line service improvements.
1.10 In summary, the results showed little difference between the two subway options
with Benefit Cost Ratios of 0.7:1. Both options exhibited considerable positive
economic development impacts and strong social community benefits.
1.11 The analysis of the third option suggested that the BRT would experience
substantial crowding in the peak periods and therefore would not deliver the same
level of transit user benefits as the subway options. In addition, its contribution to
the economic development, social community and environmental accounts is less
than with the subway options.
1.12 Following review of the interim BCA by the Metrolinx Board of Directors, it was
requested that additional analysis to more comprehensively scope the project
should be undertaken prior to a project scope recommendation. The additional
analysis was to consider:
I Possible adjustments in project scope, timing or phasing;
I Consideration of the extent to which improved service levels on the parallel GO
Richmond Hill rail corridor off-loads some of the demand on the Yonge Street
subway; and
I The cost impacts of the various options on the subway yards strategy, Yonge-
Bloor subway station improvements, and a future Downtown Relief Line to
bypass the Yonge-Bloor congestion pinch point.
1.13 This report provides an update on the interim BCA, informed by the findings of this
additional analysis. The analysis documented in this report was undertaken in
2011. Since then Metrolinx and York Region have undertaken further planning
studies to inform the BCA’s conclusions. The results of this analysis are unchanged
and remain based on the available data provided in 2011.
Benefits Case Analysis Update
4
Report Structure
1.14 This report presents the revised BCA for the proposed Yonge North Subway
Extension. The remainder of the report is structured as follows:
I Chapter 2 presents the Project Rationale. This section sets out the project
context and need, as well as the project objectives, project overview and
opportunities and challenges;
I Chapter 3 describes the Project Options that are evaluated; and
I Chapter 4 sets out the Project Assessment, presenting the assessment
methodology, analysis and summary results.
Benefits Case Analysis Update
5
2 Project Rationale
Context and Need
The Yonge subway line acts as the spine of Toronto's transit system, with the 2.1
highest volume of ridership of all transit facilities in the Greater Toronto and
Hamilton Area (GTHA) and significant population growth forecast along the length
of corridor. The northern terminal station at Finch Avenue is a significant regional
transportation facility, providing access to the Toronto subway network for
Toronto residents and residents of York Region.
This project proposes an extension of the Yonge Subway line north from Finch 2.2
Station across the municipal boundary to Richmond Hill Centre in York Region. A
context map of this area is shown in Figure 2.1.

Benefits Case Analysis Update
6
FIGURE 2.1 THE YONGE NORTH SUBWAY EXTENSION
Source: Steer Davies Gleave

Benefits Case Analysis Update
7
Regional Policy
The Yonge North Subway Extension is supported by a number of regional policies - 2.3
the most relevant and more recent of which are outlined below.
Places to Grow: Growth Plan for the Greater Golden Horseshoe
The Growth Plan under the Places to Grow Act is a framework for implementing 2.4
the Government of Ontario’s vision for better managing growth in this region. The
plan identifies the Yonge North Subway Extension as one of the major candidates
for improved high-order transit. It will provide a link to the two Urban Growth
Centres (UGC), North York Centre and the Richmond Hill-Langstaff UGC, located
near the start and end of the proposed extension.
The level of success achieved by the Yonge North Subway Extension will be 2.5
significantly enhanced by the degree of realization of the land use policies
outlined in the Growth Plan. Achievement of the proposed high-density and mixed-
use development in the Yonge Corridor would deliver the required transit demand
to support higher-order transit. Conversely, given the mutual relationship between
land use and transportation, the Growth Plan development objectives themselves
will be supported by the presence of an effective transportation system, including
the Yonge North Subway Extension.
The Big Move: Transforming Transportation in the Greater Toronto and Hamilton
Area
Building on the Growth Plan and the Greenbelt Act (2006), Metrolinx and the RTP 2.6
entitled ‘The Big Move’ were created to help achieve provincial planning
objectives by building a comprehensive transportation network to help relieve
congestion and connect communities throughout the GTHA.
As mentioned in Chapter 1, the RTP is a 25-year plan for the implementation of 2.7
the Province’s MoveOntario 2020 vision. ‘The Big Move’ recommends the
construction of over 1,200 km of rapid transit.
The Yonge North Subway Extension is identified as a top 15 transit priority action 2.8
for implementation. Other top 15 priority projects relevant to this corridor are the
Viva BRT along Highway 7 and Yonge Street as well as the capacity improvements
on the existing Yonge Subway line.
Construction of Viva BRT is already underway along the Yonge Street and Highway 2.9
7 corridors. The capacity improvements along the existing Yonge Subway line are
also underway with the procurement of new subway trains and the installation of
Automatic Train Operation (ATO). In addition, the station congestion issue at
Yonge-Bloor is being addressed with short term measures of improvement having
been identified.
Directing growth and development to intensification corridors is an essential 2.10
element of the province’s Growth Plan for the Greater Golden Horseshoe, as well
as municipal Official Plans. The Big Move has identified several mobility hubs1
1 Mobility hubs consist of major transit stations and the surrounding area. They are places of connectivity where
different modes of transportation – from walking to biking to riding transit – come together seamlessly and where
there is an intensive concentration of working, living, shopping and/or playing.
Benefits Case Analysis Update
8
along the Yonge North corridor. The extension of the subway will provide a direct
link between the Finch, Steeles, and the Richmond Hill Centre mobility hubs.
York Region’s Transportation Master Plan
The Regional Municipality of York recognized the growing problem of traffic 2.11
congestion in York Region and produced their Vision 2026 strategic plan
articulating a multi-pronged regional growth management strategy that will direct
and time new development. The Transportation Master Plan (TMP) is a core
element of Vision 2026 and guides the proposed transit expansion in the immediate
and long-term future.
The TMP is based on a transportation vision that foresees an integrated highway 2.12
and public transit network that will support York’s growth to 2031. It complements
all other regional and provincial planning initiatives and recognizes that
transportation has an impact on housing, job creation, human services and the
shape of York’s municipalities. The emphasis of the plan is to support the four
designated Regional Centres, of which Richmond Hill is one, located along the
Yonge Subway Extension corridor and connected to Highway 7.
Yonge Street between Highway 7 and Finch subway station was identified for 2.13
immediate focus in the first five years of the Action Plan. Consequently, York
Region initiated the Yonge Subway Extension Study in June 2007.
The policies outlined above emphasize the important relationship between transit 2.14
and growth and development. There is a clear consensus that transit is seen as
necessary to support growth and vice versa. The north Yonge region is an area ear-
marked for substantial growth by the various planning bodies and as a result
transit improvements have been identified in this area with the Yonge North
Subway Extension being the most significant.
Future Growth and its Implications
The Yonge North Subway Extension crosses the municipal boundary between City 2.15
of Toronto and York Region just north of Steeles Avenue, between Finch Avenue
and Richmond Hill Centre.
Over the last decade, York Region has experienced significant population and 2.16
employment growth. Between 2001 and 2006 York’s population increased by 22.8%
to 932,000 residents2. By mid-2011, this had grown to 1,070,000 residents, making
it the third largest census division in Ontario3. As a result of this rapid growth, land
use patterns have shifted from predominantly rural and agricultural to urban;
particularly in the southern and central portions of the region along the Highway 7
and Yonge Street corridors.
2 Source: Canada 2006 Census. Statistics Canada
3 Source: Ontario census divisions – Annual population estimates at July 1. Statistics Canada

Benefits Case Analysis Update
9
The regional population is forecasted to double over 30 years, from 759,000 people 2.17
in 2001 to over 1.5 million in 2031. This is coupled with a doubling in employment
from 386,000 to 780,000 jobs in the same 30 year period4.This growth is
anticipated regardless of the implementation of planned transit developments in
York Region.
Along with the growth that has occurred in York Region, travel patterns between 2.18
York Region and Toronto are becoming more balanced. The morning peak period
traffic volume crossing the Steeles Avenue boundary has seen changes with
growth. While 58% of traffic is in the southbound direction, 42% goes northbound5.
The Yonge Street corridor traffic pattern at a 60/40 split reflects the overall
boundary pattern.
At the corridor level, on the north side of the municipal boundary, York Region, in 2.19
conjunction with its local level municipalities, has put in place a planning
framework for Yonge Street as a designated Regional Corridor, which supports high
growth based on high capacity transit infrastructure.
As illustrated in Figure 2.2, intensification and transit supportive policies have 2.20
been developed to encourage optimum utilization of the Yonge Street corridor.
Studies such as the Centre-Wide Transportation Study for the Richmond Hill-
Langstaff UGC have made detailed recommendations on the phasing of
development relative to transportation infrastructure including the Yonge North
Subway Extension.
4 Source: Yonge Subway Extension – Demand Forecasting Report. January 2011
5 Source: York Region

Benefits Case Analysis Update
10
FIGURE 2.2 YORK REGION’S PLANNING FRAMEWORK FOR THE YONGE
EXTENSION CORRIDOR (BETWEEN STEELES AND RICHMOND HILL)
Source: Yonge Subway Extension – Demand Forecasting Report, January 2011
Benefits Case Analysis Update
11
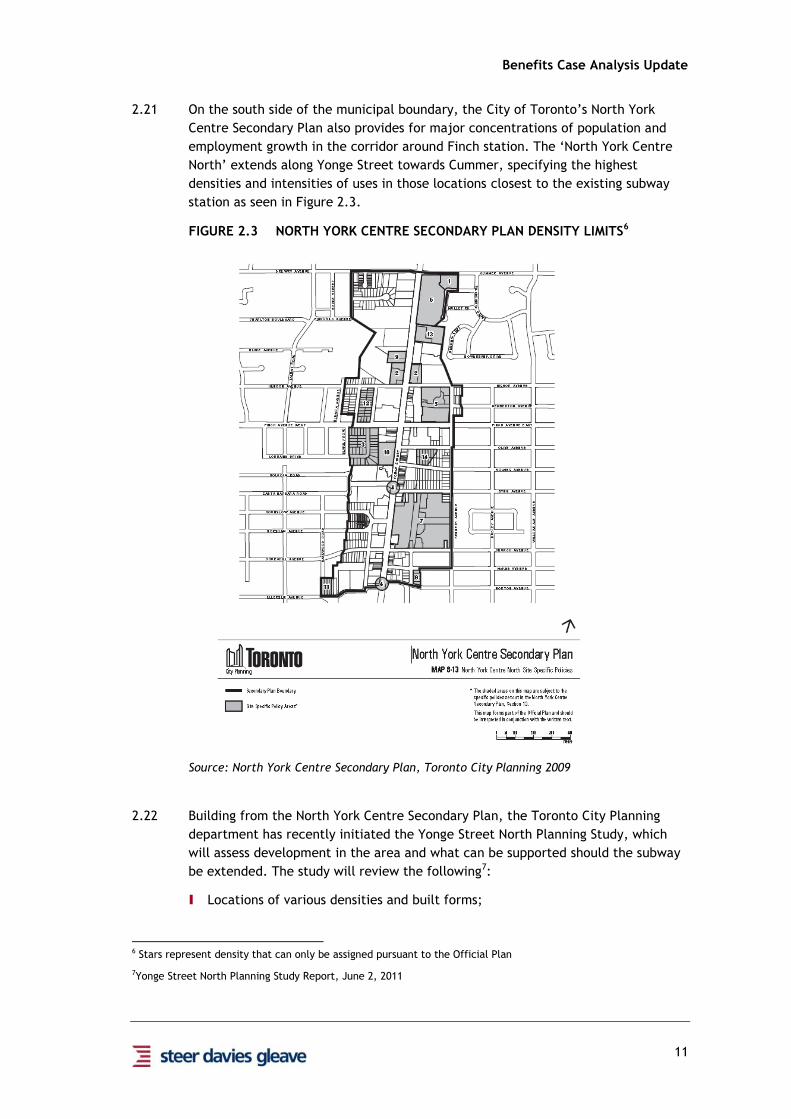
On the south side of the municipal boundary, the City of Toronto’s North York 2.21
Centre Secondary Plan also provides for major concentrations of population and
employment growth in the corridor around Finch station. The ‘North York Centre
North’ extends along Yonge Street towards Cummer, specifying the highest
densities and intensities of uses in those locations closest to the existing subway
station as seen in Figure 2.3.
FIGURE 2.3 NORTH YORK CENTRE SECONDARY PLAN DENSITY LIMITS6
Source: North York Centre Secondary Plan, Toronto City Planning 2009
Building from the North York Centre Secondary Plan, the Toronto City Planning 2.22
department has recently initiated the Yonge Street North Planning Study, which
will assess development in the area and what can be supported should the subway
be extended. The study will review the following7:
I Locations of various densities and built forms;
6 Stars represent density that can only be assigned pursuant to the Official Plan
7Yonge Street North Planning Study Report, June 2, 2011

Benefits Case Analysis Update
12
I Level of development prior to and after a Yonge subway extension;
I Transportation and infrastructure improvements;
I Pedestrian amenities and streetscape;
I Community infrastructure, parks and open space improvements; and
I Implementation strategies.
The study will be conducted in three phases, from background research to 2.23
preparation and modelling land use concepts. Consultation meetings and / or
workshops will be held with the local community throughout each phase.
Project Objectives
The overarching project objective recognizes the policy rationale for investment in 2.24
the Yonge Street corridor supporting the growth and intensification planned along
the corridor both in the City of Toronto and York Region, while ensuring the best
return for taxpayer investment. It is to:
Deliver high-order transit to relieve congestion and support proposed land use
intensification in the Yonge Street corridor, demonstrating value for money.
As identified in the Interim BCA, both the provincial Growth Plan and York Region’s 2.25
Official Plan promote more efficient, liveable, mixed-use communities integrated
with higher-order transit services and improved regional connectivity. In relation
to transit investment, specific strategies include:
I Provide convenient rapid transit access to urban growth centres;
I Improve inter-regional transit connectivity;
I Increase people-moving capacity along key transportation corridors;
I Increase transit choices for inter-regional travel;
I Improve transit rider safety and comfort; and
I Optimize use of existing transit facilities, services and corridors.
An extension of the subway along Yonge Street north of Finch would support these 2.26
goals by improving connectivity and access between downtown Toronto and York
Region. In addition, transit service feeder route improvements would accompany a
subway extension. Together these would support current land use planning
objectives in both Toronto and York Region to increase densities and improve the
urban experience for those living and working along the corridor.
Project Overview
The Yonge Street Corridor
Yonge Street is a major arterial route connecting the shores of Lake Ontario in 2.27
Toronto to Lake Simcoe, a gateway to the Upper Great Lakes. It lays claim to being
the longest street in the world at 1,896 kilometres and its construction in the
1790s is designated as an Event of National Historic Significance for Canada.

Benefits Case Analysis Update
13
Yonge Street is home or close to many attractions in Toronto running parallel to 2.28
Bay Street (centre of the business district) and University Avenue, home of the
Ontario Legislature. Yonge Street is therefore a popular and commercial main
thoroughfare. It has been referred to as ‘Main Street Ontario’ and is also the site
of Canada's first subway line.
Heading northwards, beyond the current subway line, between Finch Avenue and 2.29
the Richmond Hill Centre the corridor is characterized by a traditional mix of
older, two story main street commercial and residential development, punctuated
with car dealerships and a large shopping mall. Evidenced by planning
applications, large portions of these older developments have been purchased and
consolidated for redevelopment. Extensive planning policy will guide the
redevelopment of the Yonge corridor, particularly around stations, should the
subway line be extended. Some of this development is underway, such as World on
Yonge, which has laid the foundation for the powerful visual and economic
transformation of this corridor from traditional one to two story main street uses
to high density office and residential buildings, reaching densities of 2.5 to 5.0
times coverage. The Richmond Hill-Langstaff Urban Growth Centre, a major anchor
hub for the north central quadrant of the GTHA, is designated to have at least 200
residents and jobs per hectare and may exceed this level of density8.
The north Yonge Street corridor transit network is shown in Figure 2.4. Viva, GO 2.30
and TTC bus services operate along north Yonge Street between the Finch subway
station and Richmond Hill Centre and the surrounding area. A GO rail service also
operates to and from downtown, stopping at Langstaff and terminating at the
Richmond Hill GO station, approximately nine kilometres north of Richmond Hill
Centre. The existing and future transit services are outlined and discussed later in
this chapter.
8 Source: York Region
Benefits Case Analysis Update
14
FIGURE 2.4 EXISTING YONGE NORTH CORRIDOR TRANSIT NETWORK DIAGRAM
Source: TTC System Map
Project Development Progress
York Region initiated the Yonge Subway Extension Study in June 2007. The City of 2.31
Toronto participated in the early stages of the process as an observer and later in
the study process became an active co-proponent of the project. Alignment
alternatives and potential station locations were generated and assessed.
The study team filed the Environmental Assessment (EA) under the Transit Project 2.32
Assessment Process (TPAP) and it was approved unconditionally on April 6, 2009.

Benefits Case Analysis Update
15
While the City of Toronto supports the implementation of the Yonge North Subway 2.33
Extension project in general, on January 28, 2009 City Council passed a resolution
that attaches conditions that must be met before the City is prepared to fully
support the project. These conditions are as follows:
I The Spadina Extension and the Automatic Train Operation (ATO) system on the
YUS line must be in place prior to opening of the Yonge North Subway
Extension;
I The costs of addressing potential capacity constraints at the Bloor-Yonge
Station and North York Service Road arising from the proposed Yonge North
Subway Extension are to be included as project costs; and
I Metrolinx be requested to prioritize the Downtown Relief Line within its 15-year
plan, noting that Transit City is the first priority for the TTC and the City of
Toronto.
Further to the work completed as part of the EA and the interim BCA, TTC and 2.34
York Region have done additional concept design and costing work on the subway
extension from Finch to Richmond Hill Centre. This work addresses the storage
requirements, station design and refines the order of magnitude estimates. This
concept design and costing work was used to inform this BCA update.
Transit Considerations
Current & Forecasted Demand
Currently, the Yonge Street corridor between Finch Avenue and Richmond Hill 2.35
Centre has high transit ridership, which is expected to increase over time as York
Region experiences growth and travel volumes to downtown increase. In 2006,
demand on all transit modes from York Region to downtown Toronto was 20,100
trips during the AM peak period. 55% of these trips were carried by GO services and
the remainder by TTC.
The City of Toronto and TTC in conjunction with York Region produced demand 2.36
forecasts, reported in the Yonge Subway Extension Demand Forecasting Report in
January 2011. These estimate that in 2031 over 20,000 people will board the
subway in the morning peak hour from the extended subway section and travel
southbound9. The forecasts are intended to inform preliminary designs for the
stations on the subway extension.
In addition to the January 2011 demand forecasts, a number of ridership estimates 2.37
for the corridor have been produced as part of various studies, such as the TTC’s
Downtown Rapid Transit Expansion Study further discussed in the Opportunities
and Challenges section, assessing different network perspectives relating to the
Yonge Street corridor.
9 Includes initial and transfer boarders and excludes additional boardings at the existing Finch Station

Benefits Case Analysis Update
16
While the specific modelling results from the various studies10 conducted along the 2.38
corridor vary, they all suggest substantial ridership growth in the corridor from
2006 to 2031, potentially by 70% to 90%.
Network Routing
The Yonge Street corridor is currently served by several bus routes, including Viva 2.39
services that carry passengers from York Region across the municipal boundary into
Toronto, to a bus terminal adjacent to Finch subway station. Despite the success
of York Region’s first phase of the Viva program, growing traffic congestion along
the Yonge Street corridor, particularly between Finch Avenue and Steeles Avenue
is expected to impact TTC’s and Viva’s ability to reliably maintain their current
levels of service.
As part of the January 2011 Yonge Subway Extension Demand Forecasting Report, a 2.40
number of network changes upon implementation of the Yonge subway extension
were assumed. These changes are to complement and feed the subway extension.
In the case of TTC routes, several bus routes would be extended to, or terminate 2.41
at, Steeles Station. The Extension would also interface with GO bus services at
Richmond Hill and the York Region Transit (YRT) / Viva bus network at all stations.
These network changes were used to inform the local network routing for the
Option investigated by this BCA update.
The demand forecasting work undertaken by the City of Toronto and TTC also 2.42
assumed the implementation of the Transit City LRT Network Plan, which consists
of:
I Spadina Subway Extension to the Vaughan Metropolitan Centre;
I Transit City LRT lines (Etobicoke-Finch, Sheppard East, Eglinton Crosstown,
Jane (to Steeles West Station), Don Mills (to Highway 7), Scarborough-Malvern
and Waterfront West);
I Scarborough RT extension to Malvern Town Centre; and
I Feeder bus updates associated with Transit City.
On June 29, 2012, the Province of Ontario approved the Toronto City Council’s 2.43
transit plan for the Eglinton-Scarborough Crosstown, Scarborough RT replacement,
Finch West, and Sheppard East LRT lines. Currently it is assumed that the
Eglinton-Scarborough Crosstown LRT will extend from Black Creek Drive in the
west to Kennedy Station in the east at grade with an 11km underground section in
the middle section11 (it had previously been assumed for the purposes of analysis
that it would be fully grade separated.). The Metrolinx rapid transit network study
will assess how this project will interface with the Yonge North corridor.
10Yonge North Subway Extension interim BCA (June 2009), Yonge Subway Extension - Demand Forecasting Report
(January 2011), Downtown Rapid Transit Expansion Study – Problem Statement (March 2011)
11 http://www.thecrosstown.ca/

Benefits Case Analysis Update
17
Opportunities and Challenges
Land Use Intensification
As previously mentioned, York Region is expected to experience significant 2.44
population and employment growth in the future. In addition to anticipated
growth, there are also land use proposals that are contingent on the subway
extension being built. These proposals will only be realised if the significant
investment in transit, particularly the subway extension, is made. The City of
Toronto is also currently undertaking a Yonge Street North Planning Study to
address how best to manage growth in the area and focus growth closest to the
planned subway stations.
This reflects the interdependency between transit investment and land use 2.45
development and is an opportunity for urban design that is transit oriented. The
challenge of managing the growth pressures also exists. If anticipated growth
occurs, transit investment will be necessary to provide sufficient capacity to
accommodate demand. The level of transit service will influence the location of
land use development and extent of growth in localized areas.
Yonge Subway Capacity
In the context of the Yonge North Subway Extension, its network impact needs to 2.46
be part of the consideration. The Yonge Subway line is already operating over
capacity south of Bloor during the morning peak period12. Between Bloor and
Wellesley stations, the morning peak demand is over 28,000 in the southbound
direction – exceeding its capacity by 2,000 passengers. Other links also operate
close to capacity during peak times. With the anticipated population growth in
both Toronto and York Region, and associated forecasted increase in transit
demand, the current capacity constraint experienced on the Yonge line in the
southern section is expected to worsen and is a major challenge for the subway
network and for the Yonge North Subway Extension. Additional projects underway,
including the Eglinton-Scarborough Crosstown LRT, will also contribute to ridership
growth on the Yonge line and more detailed network analysis is underway to
understand the interactions between all of these projects.
The ability to improve capacity on the line has in the past been limited by the 2.47
current train control system, which can only handle the turn-around of 25 trains
per hour. As part of the Metrolinx Quick Wins package of rapid transit initiatives in
2008, the Yonge subway line capacity improvements were funded in order to
quickly achieve customer and system improvements. The Quick Wins investment of
$293 million provided funding to the TTC for the installation of Automatic Train
Operation (ATO) and a one-third funding contribution towards the acquisition of
higher-capacity subway trains – ‘Rocket’ trains.
ATO includes a new signalling system that will enable a reduction in the minimum 2.48
headway between trains. This allows a higher service frequency than the previous
system, with a maximum number of 34.3 trains per hour13. The ATO is expected to
12TTC's Downtown Rapid Transit Expansion Study Problem Statement. March 2011
13Maximum Line Capacity Study for the YUS Line in ATC Operation. Parsons Transportation Group & TTC. March
2009
Benefits Case Analysis Update
18
be fully installed by early 2018. The Rocket trains, providing a 10% increase in
train capacity, and the ATO together will deliver an improvement in planning
capacity from 26,000 to 38,000 passengers per hour on the line.
Further to line capacity challenges, the subway system also experiences capacity 2.49
pinch points at stations, notably Bloor-Yonge and St George, where passengers can
interchange between the Yonge-Union-Spadina (YUS) line and the Bloor-Danforth
(BD) line.
Even with the existing signal system or the new ATO, the key bottleneck for Yonge 2.50
Subway capacity is the current dwell time for trains in Bloor Station14. In order to
operate a higher frequency through Bloor-Yonge Station with ATO it will be
necessary to significantly reduce the vehicle dwell time that is caused by the large
volume of passengers boarding and alighting.
To address this constraint, the TTC completed a Capacity Improvements Study for 2.51
Yonge-Bloor in September 2010; evaluating a number of scenarios using pedestrian
flow analysis and phasing options. The analysis focuses on platform dwell times
that will be achievable in future conditions. Recommendations have gone no
further than interim solutions, such as passenger communications, stairwell and
door management. Although the results of these methods are effective in the
short-term, additional capacity improvements may be required.
However, with the implementation of the Eglinton-Scarborough Crosstown, the 2.52
rapid transit network will have new interchange stations that will provide
alternatives to Bloor-Yonge station. This will assist in dispersing the high volume of
passengers using this station and provides the opportunity to defer the need for
major capital investment in expanding the Bloor-Yonge station capacity. While the
Yonge-Bloor capacity constraint is potentially resolved, a new constraint is also
created at Yonge-Eglinton station, which will need to be considered as the
Eglinton-Scarborough Crosstown is designed and constructed.
Related to these capacity constraints, the roll-out of ATO and Rocket Trains will 2.53
also place additional strain on subway train storage and maintenance facilities.
TTC anticipates that there will be insufficient capacity at the existing sites by
2030.
To assess this maintenance storage facility constraint, the TTC has undertaken a 2.54
Subway Rail Yards Needs Study to examine options to accommodate future demand
arising from ridership growth, ATO and Rocket Train implementation, the Yonge
North Subway Extension, and at the time the Transit City initiatives.
The Subway Rail Yards Needs Study (SRYNS) concludes that there will be a storage 2.55
shortfall of up to 170 vehicles at the Wilson/Davisville Yards in 2030 and
recommends that Wilson Yard is expanded as a primary site for the YUS fleet, with
storage/cleaning of trains at Davisville Yard. York Region and the TTC are jointly
proceeding with an environmental assessment through the Transit Project
Assessment Process to examine the potential for train storage to be
14Maximum Line Capacity Study for the YUS Line in ATC Operation. Parsons Transportation Group & TTC. March
2009

Benefits Case Analysis Update
19
accommodated at the north end of the Yonge line, underground at Richmond Hill
Centre.
The ‘Quick Wins’ of ATO and Rocket Trains, as well as passenger flow management 2.56
at Yonge-Bloor station and SRYNS all address near term capacity issues on the
Yonge subway. While there exists opportunity for resolving these capacity
challenges in the near term, from a long term perspective, as demand continues to
increase and the rapid transit network expands, these challenges will need to be
monitored and reassessed.
Acknowledging the aforementioned challenges, the Downtown Rapid Transit 2.57
Expansion Study (DRTES) looks at capacity deficiencies in the longer term. The
Study examines future travel trends on transit in the GTA and assesses the
alternative strategies for long term capacity relief, including:
I Construction of a new subway line (commonly referred to as the Downtown
Relief Line (DRL)), which would divert riders on the Yonge line travelling south
of Bloor to reduce crowding and allow for future growth;
I Improvements in streetcar services to enhance shorter-distance transit
accessibility in the downtown;
I Fare, service and other policy initiatives to increase downtown transit ridership
that may be appropriate; and
I Construction of additional GO Rail capacity specifically to offload the Yonge
subway by:
Diverting Toronto and York Region residents currently using the Yonge
subway to Barrie, Richmond Hill and Stouffville GO; and
Diverting Toronto residents currently using the Bloor-Danforth line to GO
Lakeshore East and West.
The impact of the Yonge North Subway Extension on other transit services is also 2.58
assessed as part of the DRTES, as well as the associated impact of the DRL on the
network conditions with the Eglinton-Scarborough Crosstown LRT in place. The
opportunities for offloading the demand along the Yonge line warrants further
regional network planning analysis and completion of sufficient analysis of the DRL
BCA metrics in collaboration with the TTC, YRRTC, and Metrolinx. This work will
inform implementation considerations for both the DRL and the Yonge North
Subway Extension.
Regional Transit Connectivity
As already described, the Yonge North Subway Extension will expand the existing 2.59
transit network by providing a cross-municipal boundary subway link between
Richmond Hill Centre and Finch station with a complementary local bus network
feeding the subway. The line will also connect with the GO Richmond Hill line at
Richmond Hill Centre where the GO Langstaff station is located. The GO Richmond
Hill line also provides north-south transit service that mainly targets commuters to
the downtown core of Toronto.

Benefits Case Analysis Update
20
Other network improvements relevant to the Yonge north corridor include the 2.60
work undertaken to study the electrification of the GO Transit rail network. In
January 2010, Metrolinx initiated this electrification network study as a future
alternative to diesel trains that are currently in service. Although some lines
proved beneficial to electrify, the Richmond Hill line was not part of this initial
bundle.
Prior to the Electrification Study, in June 2010, Metrolinx reported BCAs for GO 2.61
Rail improvements to address short-term capacity issues. The Richmond Hill line
was a part of this assessment that proposed an extension to the existing GO line
north from Richmond Hill to Bloomington and increased service to all-day, 2-way
service from the current four inbound and five outbound in the morning and
afternoon peak periods, respectively.
The service improvements would provide service every 20 minutes in the peak 2.62
period inbound to Union station and services every half hour in the outbound
direction during the peak period and bi-directional during the off-peak periods. In
2031, peak period service would improve to 10 minute headways.
The results of the GO Richmond Hill BCA show positive net benefits when 2.63
compared to the life-cycle costs of the project, with additional environmental,
social and other economic benefits. When assessed alongside the Yonge North
Subway Extension, the benefit is reduced by 15%, but still demonstrates a positive
net benefit for the GO Richmond Hill line.
As a parallel route, the GO Richmond Hill line is a potential option for providing 2.64
some off-load transit capacity for the Yonge corridor north of Steeles. At this time
however, with the current fare structure, the GO service may not divert a
significant number of riders from the subway.
Further to GO improvements, there are also plans to expand the rapid transit 2.65
network and improve connectivity within York Region. The VivaNext program will
implement rapidways on major regional routes, including Highway 7 through
Richmond Hill. The plans intend that Richmond Hill becomes an anchor transit hub
that acts as a terminus for the Yonge subway extension and enables connections
with Viva, GO transit, YRT and other transit systems.
VivaNext is currently working on two rapidway corridors in York region. In March 2.66
2011, the first rapidway section and new rapid transit station opened in Markham
and a further section from Yonge to Warden in Markham is due for completion in
2014. The remaining Highway 7 sections are set to be constructed and in service as
they are completed.
Running perpendicular to Yonge Street and through the Richmond Hill intersection 2.67
is Highway 407. Identified as part of the 25-year Big Move plan, the 407 transitway
would support existing GO express services operating in the corridor and enhance
connectivity with the three dedicated regional centres, namely Vaughan, Markham
and Richmond Hill and to the existing, primarily radial transportation network.
Improving connectivity along Highway 407 and the expansion of Viva would work in 2.68
complement to the Yonge North Subway Extension and promote the use of
Richmond Hill as a mobility hub.

Benefits Case Analysis Update
21
In addition to the infrastructure and service proposals described above, transit 2.69
integration throughout the GTHA is being supported by the introduction of PRESTO.
PRESTO is an electronic pay card system that is currently being rolled-out
throughout the GTHA. Since summer 2011, riders are able to use PRESTO on most
transit services, including GO transit, select TTC services and YRT. It is anticipated
that PRESTO will encourage greater transit use in York Region and Toronto.
Fiscal Context
The Province of Ontario has dedicated $16B towards delivering top priority 2.70
projects in the Big Move. The Province’s contribution is currently fixed with no
additional funds for capital expansion. Metrolinx is working on an Investment
Strategy for bringing predictable and sustainable transit funding to the GTHA.
With many competing projects that are requesting funding assistance, an
infrastructure project’s value for money is important for justifying the continued
support of a project’s development in order to bring it to a maximum state of
implementation readiness.

Benefits Case Analysis Update
23
3 Project Options
Project Options
Three proposed options for extending the Yonge subway north towards Richmond 3.1
Hill Centre have been developed for the purposes of this evaluation. They have
been defined in collaboration with Metrolinx, York Region and TTC. A Base Case,
against which the two options are assessed, has also been developed.
In summary, the Base Case and project options are: 3.2
I Base Case: Transit network investment – subway extension to Vaughan
Metropolitan Centre and network capacity investment, Eglinton-Scarborough
Crosstown LRT and Viva BRT.
I Option 1: Subway extension to Richmond Hill Centre – subway extension from
existing Finch subway station to Richmond Hill Centre (RHC) serving six new
stations at Cummer, Steeles, Clark, Royal Orchard, Langstaff and RHC.
I Option 2: Phased subway extension - initial subway extension from existing
Finch subway station to Steeles Avenue serving two new stations at Cummer
and Steeles.
I Option 2A: Phased subway extension and increased GO frequencies - initial
subway extension from existing Finch subway station to Steeles Avenue serving
two new stations at Cummer and Steeles. Increased GO service frequencies
between Richmond Hill GO station and Union.
Options 2 and 2A were developed and analysed as a way of considering the merits 3.3
of a phased implementation approach that could see partial construction and
services occur sooner.
The following sections set out the descriptions of the Base Case and Options in 3.4
more detail.
Base Case
Overview
The Base Case provides the benchmark against which the options are assessed. The 3.5
Base Case is intended to reflect the current transportation infrastructure and
services and incorporate investment proposals that are funded and anticipated to
take place in the next few years. Accompanying these transportation assumptions
are land use and population forecasts.
Background assumptions
The land use, employment and population forecasts used for the assessment are 3.6
consistent with those identified in ‘Places to Grow’ the Growth Plan for the
Greater Golden Horseshoe. This maintains consistency with the other Metrolinx
BCAs done for the Top 15 priority projects identified in The Big Move.

Benefits Case Analysis Update
24
Transit assumptions
The GTHA transit network assumptions are based on the existing services and the 3.7
implementation programs for funded projects. These are described in more detail
on the following page.
Subway
For the Base Case, the Yonge-University-Spadina (YUS) subway is expected to 3.8
encompass the following characteristics and investments:
I Spadina extension to Vaughan;
I ATO implementation across entire YUS line;
I Full roll-out of Rocket Trains on YUS line;
I Service frequency of 105 second headways;
I Short turn at Wilson Station;
I Rail Yard provision as required; and
I Yonge-Bloor station investment.
Capacity issues downstream on the Yonge line including at Yonge-Bloor station are 3.9
addressed qualitatively in the BCA. The scope of works and investment required,
with or without the subway extension, is not included in the quantified assessment
as they have not been fully determined to date. An indicative value for Yonge-
Bloor station work, as provided in TTC’s Capacity Improvement Study for Yonge
Bloor Station, is between $80m for the ‘Phasing 2 Design’ and $328m for the ‘Do
All Concept Design’. Additional costs associated with addressing network capacity
issues continue to be developed through the regional network analysis and DRL
project development.
GO services
The assumed GO rail services are: 3.10
I GO Richmond Hill with AM peak inbound service only, with the following
characteristics:
30 minute frequency; and
42 minute travel time from Richmond Hill Station to Union.
General network
Other network characteristics are as follows: 3.11
I Implementation of Eglinton-Scarborough Crosstown LRT and York Region Viva
BRT program;
I Current fare structure;
I Highway as now;
I Maintain existing bus network along Yonge corridor and allow for growth over
time to accommodate increased demand; and
I 3 minute headways for Viva Blue services on Yonge corridor.

Benefits Case Analysis Update
25
Option 1: Subway extension to Richmond Hill Centre
Overview
Option 1 is incremental to the Base Case. 3.12
The option is to extend the Yonge subway line from the existing Finch station, 3.13
serving six15 new stations with Richmond Hill Centre as the terminus. The layout is
shown by both the red and blue lines in Figure 3.1.
The rationale behind the station locations is described below: 3.14
I Cummer/Drewry - This station is located in the City of Toronto. The area
surrounding the station is currently well developed and has sufficient
population and ridership to support a subway station. Several local bus routes
converge in this area and would benefit from a connection to the subway.
I Steeles Avenue – A significant transit hub is envisioned at this location. The
location has strong redevelopment potential in the immediate vicinity on the
west side of Steeles, with excellent opportunities for Transit Oriented
Development.
I Clark Avenue – Several local bus routes converge at Clarke and would benefit
from connection to the subway. There is relatively strong development/
intensification potential in the area.
I Royal Orchard – Similarly to Clark Avenue this station has local bus routes
including Viva that converge, and would benefit from a connection to the
subway. There are some opportunities for densification, but any development
has to be done with consideration for heritage requirements.
I Langstaff - This station would be a significant commuter hub, working in
tandem with RHC as it is the only location suitable for a significant Park and
Ride (P&R) lot along the alignment. (Most of the users of the Finch P&R come
from the north and it is thought that those drivers would use a P&R at this
location and thereby shorten the trip by car.) There is also development being
planned for the Langstaff Lands in Markham, located in the northeast quadrant
of the station area.
I Richmond Hill Centre – The proposed new terminus station would be an Anchor
Hub and a significant regional multi-modal transit interchange with connections
to local buses, Viva buses, GO Transit, the subway and any future service, such
as the Express Rail and Highway 407 transit services.
15 At the time of this undertaking further decision on whether a 6 station extension or a 5 station extension had not
been made. The results from the interim BCA indicate that there is no material difference in the results should a 5
station subway be pursued

Benefits Case Analysis Update
26
FIGURE 3.1 YONGE NORTH SUBWAY EXTENSION
Source: Yonge Subway Extension Design – Demand Forecasting Report
Transit Assumptions
As Option 1 is incremental to the Base Case, the additional assumptions are with 3.15
regard to subway changes only. These changes are listed below:
I Extension of Yonge line from Finch to Richmond Hill;
I Six new stations at Cummer, Steeles, Clark, Royal Orchard, Langstaff and
Richmond Hill Centre;
I Park & Ride at Langstaff;
I Short turn at Finch Station;
I Service frequency of 105 second headways to Finch, 210 second headways
between Finch and RHC;
I Additional rolling stock;
I Required fleet storage capacity provided at RHC; and
I Revised bus network (as per Transit Network Assumptions in ‘Yonge Subway
Extension Design – Demand Forecasting Report’).
Benefits Case Analysis Update
27
Table 3.1 summarizes the characteristics of Option 1 by route section. 3.16
TABLE 3.1 OPTION 1 TRAVEL TIMES AND SPEEDS16
Route section Distance (km) Average Speed
(kph)
Travel Time
(min)
Finch to Cummer/Drewry 0.85 34 1.5
Cummer/Drewry to Steeles 1.2 34 2.1
Steeles to Clark 1.0 35 1.7
Clark to Royal Orchard 1.9 35 3.3
Royal Orchard to
Langstaff/Longbridge
0.9 34 1.6
Langstaff to Richmond Hill 1.1 35 1.9
TOTAL ROUTE 7 35 12
Option 2: Phased subway extension
Overview
Option 2 is incremental to the Base Case. 3.17
The option extends the Yonge subway line from the existing Finch station, serving 3.18
two new stations with Steeles Avenue as the terminus. This option is viewed as a
phased approach to implementation where the initial subway extension is
constructed and the remaining portion of the line deferred. The phase to Steeles
Avenue is shown by the red line in Figure 3.1.
Transit Assumptions
Option 2 requires changes to the bus transit network incremental to the Base Case, 3.19
as well as subway changes. These are listed below:
Subway
I Extension of Yonge subway line from Finch to Steeles Avenue;
I Two new stations at Cummer and Steeles;
I Short turn at Finch Station;
I Service frequency of 105 second headways to Finch, 210 second headways
between Finch and Steeles; and
I Additional rolling stock.
Bus Network
I Revised bus network (as per Transit Network Assumptions in ‘Yonge Subway
Extension Design – Demand Forecasting Report’ for Finch, Cummer and Steeles).
16 Values are indicative
Benefits Case Analysis Update
28
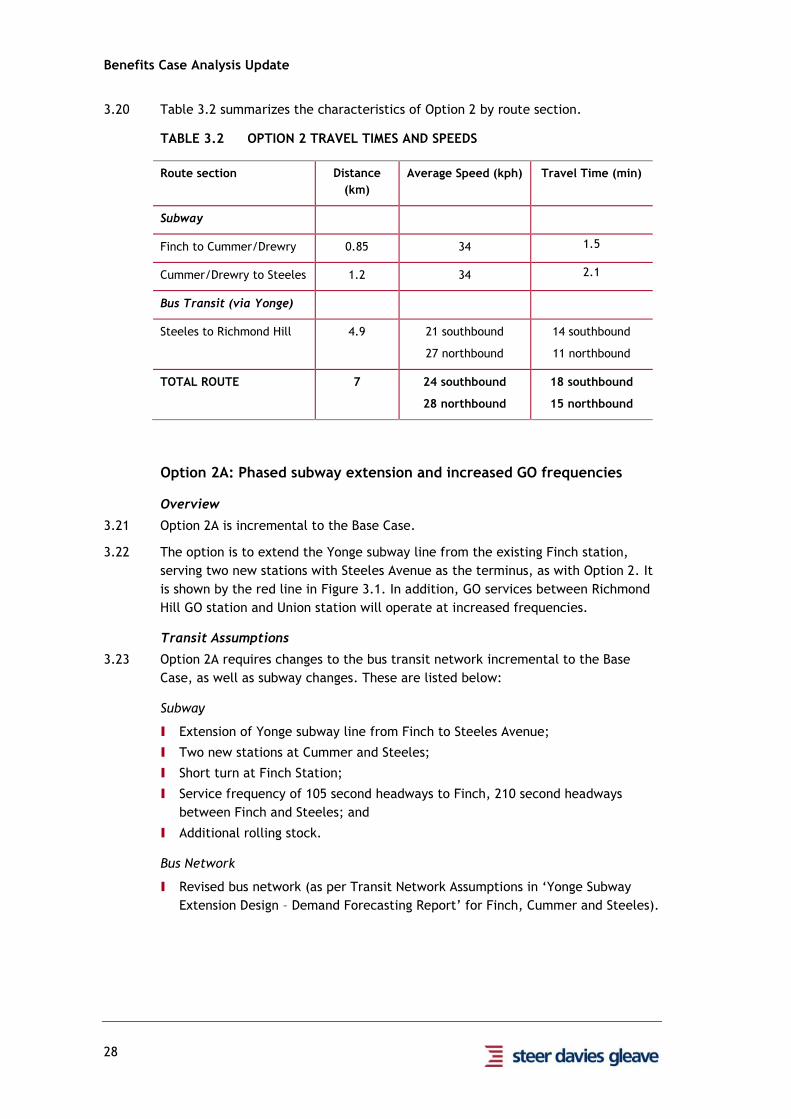
Table 3.2 summarizes the characteristics of Option 2 by route section. 3.20
TABLE 3.2 OPTION 2 TRAVEL TIMES AND SPEEDS
Route section Distance
(km)
Average Speed (kph) Travel Time (min)
Subway
Finch to Cummer/Drewry 0.85 34 1.5
Cummer/Drewry to Steeles 1.2 34 2.1
Bus Transit (via Yonge)
Steeles to Richmond Hill 4.9 21 southbound
27 northbound
14 southbound
11 northbound
TOTAL ROUTE 7 24 southbound
28 northbound
18 southbound
15 northbound
Option 2A: Phased subway extension and increased GO frequencies
Overview
Option 2A is incremental to the Base Case. 3.21
The option is to extend the Yonge subway line from the existing Finch station, 3.22
serving two new stations with Steeles Avenue as the terminus, as with Option 2. It
is shown by the red line in Figure 3.1. In addition, GO services between Richmond
Hill GO station and Union station will operate at increased frequencies.
Transit Assumptions
Option 2A requires changes to the bus transit network incremental to the Base 3.23
Case, as well as subway changes. These are listed below:
Subway
I Extension of Yonge subway line from Finch to Steeles Avenue;
I Two new stations at Cummer and Steeles;
I Short turn at Finch Station;
I Service frequency of 105 second headways to Finch, 210 second headways
between Finch and Steeles; and
I Additional rolling stock.
Bus Network
I Revised bus network (as per Transit Network Assumptions in ‘Yonge Subway
Extension Design – Demand Forecasting Report’ for Finch, Cummer and Steeles).

Benefits Case Analysis Update
29
GO Network
I GO services between Richmond Hill GO station and Union station will increase
in frequency from every 30 minutes to every 10 minutes during the AM peak
period.
The characteristics of Option 2A by route section are the same as Option 2 in Table 3.24
3.2.
Summary
The assessment options are summarized in Table 3.3, alongside the Base Case. 3.25
TABLE 3.3 SUMMARY OF YONGE NORTH SUBWAY EXTENSION BCA OPTIONS
Option Definition Headway
Travel
time
(mins)17
Subway Stations
Richmond
Hill GO Rail
Service
Base Case Transit
network
investment
105 sec 21 No additional 30 min
frequency
Inbound only
42 min
travel time
to Union
Station
1 Subway
extension
to
Richmond
Hill Centre
105 sec
to Finch
210 sec
Finch to
RHC
12 Cummer
Steeles
Clark
Royal Orchard
Langstaff
Richmond Hill Centre
30 min
frequency
Inbound only
42 min
travel time
to Union
Station
2 Subway
extension
to Steeles
Avenue
105 sec
to Finch
210 sec
Finch to
Steeles
15-18 Cummer
Steeles
30 min
frequency
Inbound only
42 min
travel time
to Union
Station
2A Subway
extension
to Steeles
Avenue and
increased
GO
frequencies
105 sec
to Finch
210 sec
Finch to
Steeles
15-18 Cummer
Steeles
10 min
frequency
Inbound only
42 min
travel time
to Union
Station
17 Richmond Hill Centre to Finch station

Benefits Case Analysis Update
31
4 Project Assessment
Introduction
This chapter outlines the Multiple Account Evaluation (MAE) approach used to 4.1
assess the three options described in Chapter 3 and presents the methods used to
assess each ‘account’. This chapter also provides the results of the analysis, both
in total and disaggregated by individual accounts.
Evaluation Framework
The comparative analysis uses a Multiple Account Evaluation (MAE) framework, 4.2
which is a project assessment methodology that systematically identifies and
analyses the broader impacts of each option being assessed. The framework
appraises the relative costs and benefits of a number of different evaluation
‘accounts’ and hence the trade-offs between the different options.
The accounts identified for the Yonge North Subway Extension project assessment 4.3
are:
I Transportation User Account;
I Financial Account;
I Environmental Account;
I Economic Account; and
I Socio-Community Account.
The options are assessed by comparing each of them to the Base Case, therefore 4.4
determining the incremental costs / benefits for each account. The analysis is
carried out for a 30 year operating period (2018 – 2047) and where appropriate,
the project impacts are quantified and monetized in order to allow a simple and
consistent comparison of the options. The assumptions used in these calculations
are set out in Appendix A.
The monetized costs and benefits for each account are used to determine the net 4.5
present benefit of each option, which allows a simple comparison between the
two. Qualitative assessments are also included to allow fully informed decision-
making.
The options defined in this report have been developed to a level of technical 4.6
detail sufficient to enable a comparative analysis for the purpose of selecting a
preferred option for further study. Project scope, costs and service plans would
need to be developed in more detail for funding and implementation.

Benefits Case Analysis Update
32
Transportation User Account
The Transportation User Account assesses the additional benefits to existing and 4.7
new transit users, as well as highway users, resulting from implementation of each
project option. The analysis quantifies savings to journey times and automobile
operating costs, as well as safety benefits. Other indicators, such as service quality
and crowding, are addressed qualitatively.
All quantifications and monetised values are incremental to the Base Case and are 4.8
in 2011 prices, unless otherwise stated.
Travel Time Savings
Incremental travel time savings were calculated using the Greater Golden 4.9
Horseshoe (GGH) Model, which is the regional forecasting tool used by Metrolinx
for projects throughout the GTHA.
Existing transit users are expected to experience a benefit to their generalized 4.10
travel time due to the enhanced service that the subway extension will provide. In
addition, users that switch from auto to transit for their trip will do so to benefit
from travel time savings as a result of their mode shift. This mode shift is expected
to reduce congestion on the road network, creating auto user travel time benefits.
Table 4.1 shows the monetized travel time savings for each option in 2031. 4.11
TABLE 4.1 TRAVEL TIME BENEFITS IN YEAR 2031 ($M 2011)
Option 1 Option 2 Option 2A
Transit Users
Existing Users 57.5 31.6 38.4
New Users 10.0 3.7 3.6
Auto Users 45.1 22.1 27.2
All Users 112.6 57.4 69.1
Totals may not sum due to rounding
The total Present Value (PV) of travel time savings over the 30 year period is 4.12
$1,226m for Option 1. Due to the shorter subway extension, the total transit
benefits under Option 2 are more than 50% lower, at $641m. The PV of travel time
savings for Option 2A is $757m. This exceeds Option 2 because the increase in GO
service frequencies provides travel savings for some GO users and alleviates
capacity constraints on the buses to Steeles, as a proportion of demand is diverted
to GO.
Automobile Operating Cost Savings
In addition to travel time benefits, auto users are expected to benefit from a 4.13
reduction in auto operating costs. This estimation is derived from the incremental
reduction in auto vehicle kilometres over the GTA highway network.
Over the 30 year appraisal period, this vehicle operating cost saving equates to 4.14
$689m for Option 1, $353m for Option 2 and $416m for Option 2A.
Benefits Case Analysis Update
33
The saving in auto costs for Option 2 is approximately 50% of that of Option 1, in 4.15
line with the highway travel time benefits. Both options have a positive effect on
highway congestion and related costs, although the full subway extension would
have a significantly greater impact. Greater demand diverted to GO results in auto
operating savings that are 18% higher for Option 2A than Option 2.
Additional savings could arise from some individuals deciding to reduce the number 4.16
of vehicles owned, because they feel that they could rely on the transit network.
In those cases the individuals would also save on car ownership costs. These have
not been captured quantitatively within this BCA.
Safety Benefits
With a reduction in auto vehicle kilometres, a saving in costs associated with 4.17
traffic collisions is assumed. These costs are largely related to human costs
through fatality or injury, and infrastructure repairs incurred by the City and / or
Region.
The PV of safety savings for the 30 year appraisal period is $65m for Option 1, 4.18
$32m for Option 2, and $38m for Option 2A.
Qualitative Transportation User Benefits
As well as travel time and other quantified savings, transit users will also benefit 4.19
from other factors, such as a higher quality service, better reliability and greater
convenience, as a result of the subway extension.
In comparison to the transit options in the Base Case, the subway has particular 4.20
benefits from being grade-separated, resulting in improved reliability. These
service benefits would be greater the further the subway is extended.
Crowding is another consideration. Crowding can cause passenger disbenefits and 4.21
contribute to reliability concerns with boarding and alighting at stations. Under all
options, the forecast ridership is near capacity on the subway closer to the
downtown core. Under Option 2 (and to a lesser extent Option 2A) increased
crowding on buses north of Steeles is expected to grow in the future and on the
basis of Places to Grow and other planning forecastswould need to be addressed by
implementing higher capacity transit, for example as provided by the full subway
extension to Richmond Hill Centre (Option 1).
Summary
The Transportation User Benefits of the Yonge North Extension Options 1, 2 and 2A 4.22
are summarised in Table 4.2.
Benefits Case Analysis Update
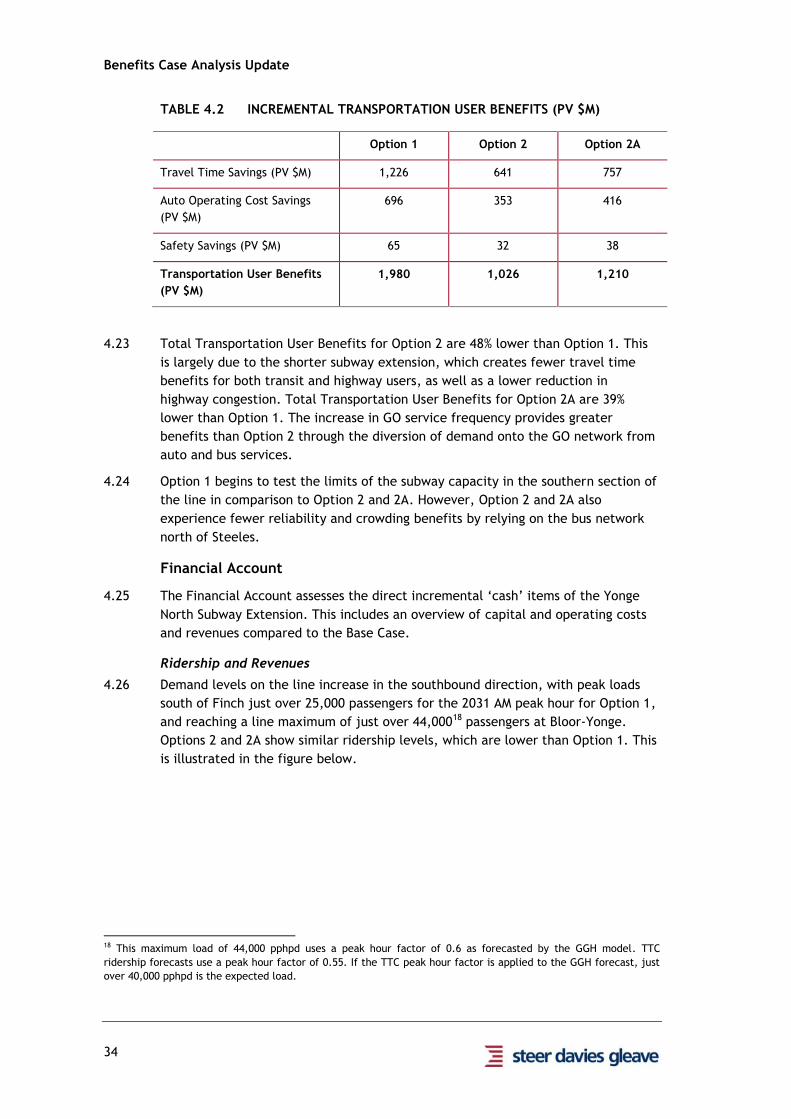
34
TABLE 4.2 INCREMENTAL TRANSPORTATION USER BENEFITS (PV $M)
Option 1 Option 2 Option 2A
Travel Time Savings (PV $M) 1,226 641 757
Auto Operating Cost Savings
(PV $M)
696 353 416
Safety Savings (PV $M) 65 32 38
Transportation User Benefits
(PV $M)
1,980 1,026 1,210
Total Transportation User Benefits for Option 2 are 48% lower than Option 1. This 4.23
is largely due to the shorter subway extension, which creates fewer travel time
benefits for both transit and highway users, as well as a lower reduction in
highway congestion. Total Transportation User Benefits for Option 2A are 39%
lower than Option 1. The increase in GO service frequency provides greater
benefits than Option 2 through the diversion of demand onto the GO network from
auto and bus services.
Option 1 begins to test the limits of the subway capacity in the southern section of 4.24
the line in comparison to Option 2 and 2A. However, Option 2 and 2A also
experience fewer reliability and crowding benefits by relying on the bus network
north of Steeles.
Financial Account
The Financial Account assesses the direct incremental ‘cash’ items of the Yonge 4.25
North Subway Extension. This includes an overview of capital and operating costs
and revenues compared to the Base Case.
Ridership and Revenues
Demand levels on the line increase in the southbound direction, with peak loads 4.26
south of Finch just over 25,000 passengers for the 2031 AM peak hour for Option 1,
and reaching a line maximum of just over 44,00018 passengers at Bloor-Yonge.
Options 2 and 2A show similar ridership levels, which are lower than Option 1. This
is illustrated in the figure below.
18 This maximum load of 44,000 pphpd uses a peak hour factor of 0.6 as forecasted by the GGH model. TTC
ridership forecasts use a peak hour factor of 0.55. If the TTC peak hour factor is applied to the GGH forecast, just
over 40,000 pphpd is the expected load.

Benefits Case Analysis Update
35
FIGURE 4.1 2031 SOUTHBOUND RIDERSHIP PROFILES (AM PEAK HOUR)
Demand levels forecast on the line are higher than the subway planning capacity 4.27
estimates (38,000 passengers per hour per direction at 18019 passengers per
subway car). However, it is acknowledged that maximum allowable capacity is
likely to be higher. Assuming 22020 passengers per subway car, the forecast level of
demand is below the allowable capacity for all options after ATO and Rocket train
roll out.
The majority of demand on the line will come from transit users who will transfer 4.28
from other services (bus or GO), but it is estimated that 1,909 new transit trips
(i.e. modal transfer from auto) will be generated in the AM peak period for Option
1. Option 2A has a reduced effect on modal transfer (1,584 additional transit trips)
while Option 2 will have the lowest effect at 1,168 trips.
In 2031, the incremental forecast annual revenue is $8.4m for Option 1, $3.4m for 4.29
Option 2 and $6.2m for Option 2A. Over the 30 year appraisal period this equates
to revenues of $94m for Option 1, $38m for Option 2 and $67m for Option 2A.
Capital and Operating Costs
Option 1 is estimated to cost $3.1B in capital costs, net of tax21 in 2011 dollars. 4.30
This includes $221m for 12 additional subway vehicles. Options 2 and 2A are
expected to cost $1.2B in capital (including $73.8m for four additional vehicles)
for the subway component. In addition, Option 2A22 will have additional GO capital
costs required to fund the increased frequency, including six additional GO trains
at $32m each.
The construction period is expected to take between three to four years. Total 4.31
capital costs for each Option are displayed in Table 4.3.
19 TTC uses 60% of the specified passenger loading standards to assess the maximum loading capacity for planning
purposes.
20 220 passengers per subway car is approximately 72% of the specified passenger loading standards
21 Capital cost of the project after the Ontario HST rebate has been applied.
22 Capital costs for the GO Richmond Hill infrastructure are from the GO Rail BCA.

Benefits Case Analysis Update
36
TABLE 4.3 TOTAL CAPITAL COSTS ($M 2011)
Option 1 Option 2 Option 2A
Subway construction 2,897 1,085 1,085
Subway vehicles 221 74 74
GO construction 0 0 470
GO vehicles 0 0 210
Total Capital Cost 3,118 1,159 1,839
Option 2A is also assumed to be subject to vehicle renewal costs amounting to 4.32
between $0.5m and $2.7m per annum for the GO Rail vehicles.
In terms of operating costs, the subway component of Option 1 is expected to cost 4.33
a gross total of $14.8m per annum, whereas Options 2 and 2A would cost $5.4m
per annum (in 2031). Option 2A will also have additional operating costs for
increased GO frequencies, amounting to a further $14.1m per annum in 2031.
All Options will be subject to bus operating cost savings as services operating north 4.34
of Steeles are adapted to feed the subway extension.
Table 4.4. shows the breakdown of the annual operating cost by mode. 4.35
TABLE 4.4 ANNUAL NET OPERATING COSTS IN 2031 ($M 2011)23
Option 1 Option 2 Option 2A
Subway 14.8 5.4 5.4
GO 0.0 0.0 14.1
Bus -5.4 -2.9 -2.9
Total Operating Costs24 9.3 2.5 16.6
The net operating cost per annum for Option 1 is $9.3m, for Option 2 is $2.4m and 4.36
for Option 2 A is $16.6m in 2031.
Option 2A is the most expensive option to operate, since 85% of the gross annual 4.37
operating cost accrues to increased GO operations. Subway termination at Steeles
under Option 2 costs just 26% of the full extension (Option 1) each year.
For Option 1 and Option 2A, the net annual operating cost exceeds the annual 4.38
revenue, resulting in a Revenue Cost ratios of 0.9:1 for Option 1 and 0.4:1 for
Option 2A. Option 2 has a Revenue Cost ratio of 1.4:1 making this option the most
attractive from an operating standpoint as the incremental revenue is estimated to
23 Negative numbers demonstrate net cost savings
24 Subject to rounding

Benefits Case Analysis Update
37
cover incremental operating cost. However, these conclusions do not take into
account transfer of revenue from bus services to the subway.
The gross operating cost in PV over the 30 year period is $106m for Option 1, $28m 4.39
for Option 2 and $180m for Option 2A.
Comparison of Traditional Benefits and Costs
A summary of the traditional net benefits and costs over the 30 year appraisal 4.40
period is provided in Table 4.5. Option 1 generates the highest level of
transportation user benefits. However, due to its incremental cost the option
results in a negative Net Benefit and a Benefit Cost Ratio of 0.8:1. Option 2 has a
positive Net Benefit, to the value of $54m, with a Benefit Cost Ratio of 1.1:1.
While Option 2A delivers a greater level of benefits, it achieves a negative Net
Benefit due to its greater costs.
The net benefit and Benefit Cost Ratio exclude environmental, economic and 4.41
socio-community considerations, which are described in the following sections.
The consideration of these other accounts in addition to the traditional Benefit to
Cost Ratio provides a complete look at all additional benefits generated by the
various project options.
TABLE 4.5 COMPARISON OF BENEFITS AND COSTS (PV $M)
Option 1 Option 2 Option 2A
Transportation User
Benefits
1,980 1,026 1,1210
Incremental Costs 2,645 972 1,908
Net Benefit -665 +54 -697
Benefit:Cost Ratio 0.8:1 1.1:1 0.6:1
Environmental Impacts
The Environmental Account examines the effect of the Yonge North Subway 4.42
Extension on Greenhouse Gas (GHG) emissions through reduced auto usage. The
Account also looks at the comparative effect on Criteria Air Contaminants (CACs)
of the Options. CACs affect air quality and cause smog and acid rain.
Greenhouse Gas Emissions
The evaluation of emissions is estimated based on the change in vehicle kilometres 4.43
travelled (VKT) by auto as forecast by the GGH model.
The Option 1 monetized CO2 savings in 2031 exceed those of Option 2 due to the 4.44
longer subway extension having greater effect on mode shift from auto to transit.
The CO2 savings of Option 2A are marginally greater than Option 2 due to greater
modal shift with the addition of more GO services in the AM peak. The PV of this
benefit is $9.2m for Option 1 ($0.0036 per $ invested), $4.5m for Option 2
($0.0048 per $ invested), and $5.4m for Option 2A ($0.0032 per $ invested).
Despite the lowest overall impact on GHGs, Option 2 has the greatest emission

Benefits Case Analysis Update
38
savings per dollar invested in the project. The results are summarized in Table 4.6
below.
TABLE 4.6 MONETIZED CO2 SAVINGS ($M)
Option 1 Option 2 Option 2A
CO2 Savings (in 2031 $M) 0.85 0.41 0.51
CO2 Savings (PV $M) 9.2 4.5 5.4
Monetized CO2 Savings per
dollar invested
0.0036 0.0048 0.0032
The effect of the change in transit kilometres has not been included in the 4.45
analysis, but is expected to be minor since the subway is electrically powered. The
GHG emissions associated with electricity-driven modes depends on the source of
energy generation.
Other Environmental Issues
The effect of each Option on CAC emissions is calculated using CAC rates derived 4.46
from the Urban Transportation Emissions Calculator (UTEC). Although rates vary
for different modes the incremental transit kilometres have not been included as
the subway emits zero CACs directly.
Through reduced auto use, Option 1 is expected to reduce Carbon Monoxide (CO) 4.47
emissions by 560,000 tonnes in 2031, Option 2 by 274,000 tonnes, and Option 2A by
337,000 tonnes. The remaining CAC savings are shown in Figure 4.2.
FIGURE 4.2 CAC EMISSION SAVINGS IN 2031
Source: Steer Davies Gleave
-
2,000
4,000
6,000
8,000
10,000
12,000
14,000
16,000
18,000
20,000
HN3/HC Nox PM PM10 PM 2.5 Sox VO
Emis
sio
ns
savi
ngs
(to
nn
es)
CAC
Option 1 Option 2 Option 2A
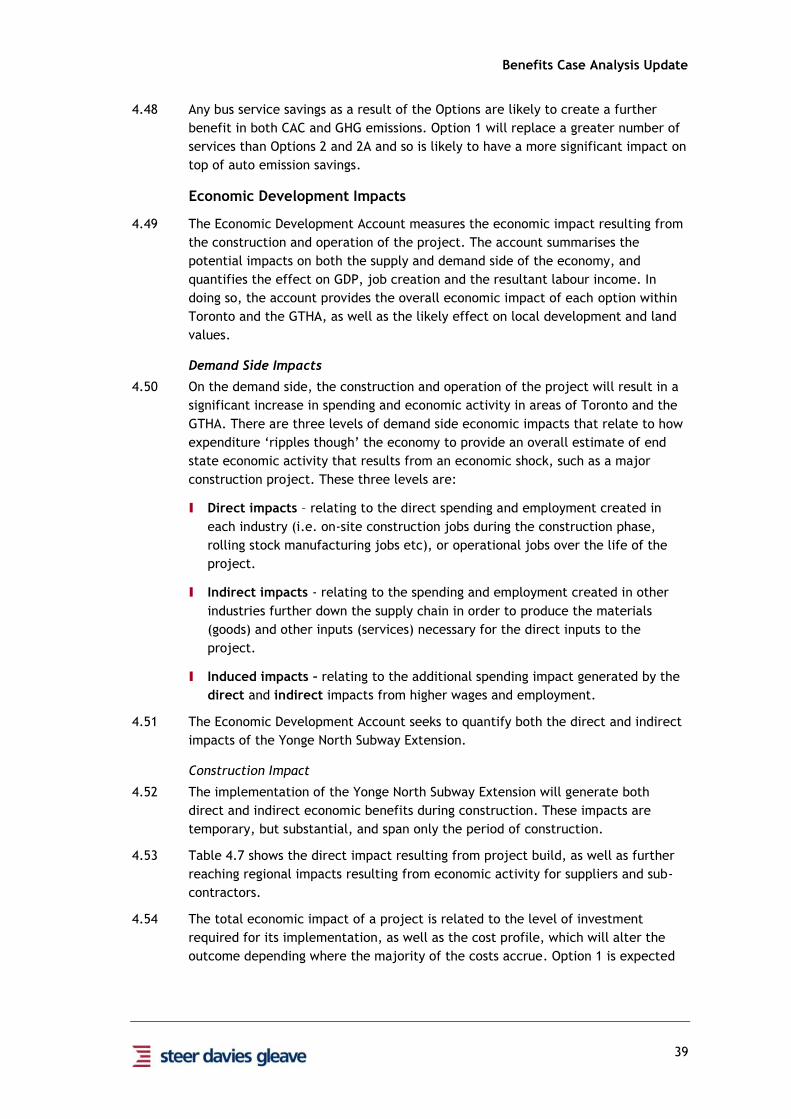
Benefits Case Analysis Update
39
Any bus service savings as a result of the Options are likely to create a further 4.48
benefit in both CAC and GHG emissions. Option 1 will replace a greater number of
services than Options 2 and 2A and so is likely to have a more significant impact on
top of auto emission savings.
Economic Development Impacts
The Economic Development Account measures the economic impact resulting from 4.49
the construction and operation of the project. The account summarises the
potential impacts on both the supply and demand side of the economy, and
quantifies the effect on GDP, job creation and the resultant labour income. In
doing so, the account provides the overall economic impact of each option within
Toronto and the GTHA, as well as the likely effect on local development and land
values.
Demand Side Impacts
On the demand side, the construction and operation of the project will result in a 4.50
significant increase in spending and economic activity in areas of Toronto and the
GTHA. There are three levels of demand side economic impacts that relate to how
expenditure ‘ripples though’ the economy to provide an overall estimate of end
state economic activity that results from an economic shock, such as a major
construction project. These three levels are:
I Direct impacts – relating to the direct spending and employment created in
each industry (i.e. on-site construction jobs during the construction phase,
rolling stock manufacturing jobs etc), or operational jobs over the life of the
project.
I Indirect impacts - relating to the spending and employment created in other
industries further down the supply chain in order to produce the materials
(goods) and other inputs (services) necessary for the direct inputs to the
project.
I Induced impacts – relating to the additional spending impact generated by the
direct and indirect impacts from higher wages and employment.
The Economic Development Account seeks to quantify both the direct and indirect 4.51
impacts of the Yonge North Subway Extension.
Construction Impact
The implementation of the Yonge North Subway Extension will generate both 4.52
direct and indirect economic benefits during construction. These impacts are
temporary, but substantial, and span only the period of construction.
Table 4.7 shows the direct impact resulting from project build, as well as further 4.53
reaching regional impacts resulting from economic activity for suppliers and sub-
contractors.
The total economic impact of a project is related to the level of investment 4.54
required for its implementation, as well as the cost profile, which will alter the
outcome depending where the majority of the costs accrue. Option 1 is expected
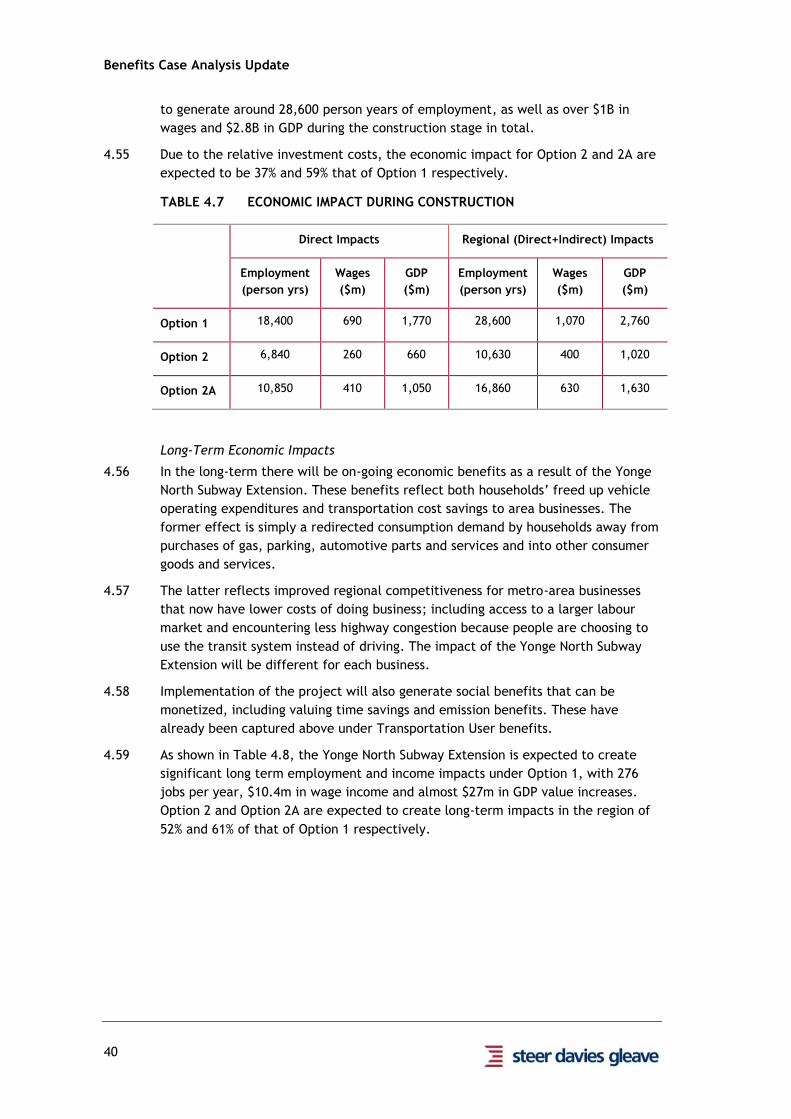
Benefits Case Analysis Update
40
to generate around 28,600 person years of employment, as well as over $1B in
wages and $2.8B in GDP during the construction stage in total.
Due to the relative investment costs, the economic impact for Option 2 and 2A are 4.55
expected to be 37% and 59% that of Option 1 respectively.
TABLE 4.7 ECONOMIC IMPACT DURING CONSTRUCTION
Direct Impacts Regional (Direct+Indirect) Impacts
Employment
(person yrs)
Wages
($m)
GDP
($m)
Employment
(person yrs)
Wages
($m)
GDP
($m)
Option 1 18,400 690 1,770 28,600 1,070 2,760
Option 2 6,840 260 660 10,630 400 1,020
Option 2A 10,850 410 1,050 16,860 630 1,630
Long-Term Economic Impacts
In the long-term there will be on-going economic benefits as a result of the Yonge 4.56
North Subway Extension. These benefits reflect both households’ freed up vehicle
operating expenditures and transportation cost savings to area businesses. The
former effect is simply a redirected consumption demand by households away from
purchases of gas, parking, automotive parts and services and into other consumer
goods and services.
The latter reflects improved regional competitiveness for metro-area businesses 4.57
that now have lower costs of doing business; including access to a larger labour
market and encountering less highway congestion because people are choosing to
use the transit system instead of driving. The impact of the Yonge North Subway
Extension will be different for each business.
Implementation of the project will also generate social benefits that can be 4.58
monetized, including valuing time savings and emission benefits. These have
already been captured above under Transportation User benefits.
As shown in Table 4.8, the Yonge North Subway Extension is expected to create 4.59
significant long term employment and income impacts under Option 1, with 276
jobs per year, $10.4m in wage income and almost $27m in GDP value increases.
Option 2 and Option 2A are expected to create long-term impacts in the region of
52% and 61% of that of Option 1 respectively.
Benefits Case Analysis Update
41
TABLE 4.8 LONG TERM EMPLOYMENT AND INCOME IMPACTS
Direct Annual Impacts in 2031 Direct and Indirect Annual Impacts
in 2031
Employment
(jobs)
Wages
($m)
GDP
($m)
Employment
(jobs)
Wages
($m)
GDP
($m)
Option 1 199 7.4 19.2 276 10.4 26.7
Option 2 103 3.9 9.9 143 5.4 13.8
Option 2A 122 4.5 11.7 168 6.3 16.3
The induced economic impacts of the options have not been quantified, but are 4.60
likely to uplift the overall economic impact. It would be expected that the induced
impact would be related to the level of the estimated direct and indirect impact,
thus Option 1 would deliver a higher induced impact than Options 2 and 2A during
construction and operation.
While this analysis assesses the likely economic impact of the options on the local 4.61
and regional scale, it approximates the incremental gain in economic benefits from
the project rather than those benefits arising from displacement from other areas.
This is dependent on the level of unemployment in the region and the number of
jobs that are gained rather than displaced. As such, the economic impact reported
in this chapter does not provide a complete assessment of value for money from
the national perspective, although the increased spending and employment will be
of significant benefit to the region.
Supply-side impacts
On the supply-side of the economy, the project could lead to significant 4.62
agglomeration impacts on business and labour productivity, increased labour
supply, and imperfect competition benefits, which will directly increase
employment, output and GDP throughout the region. These effects are known as
‘wider economic impacts’ and are typically estimated to generate productivity
benefits proportional to between 5% and 50% of ‘standard’ economic benefits.
Agglomeration
There is a significant body of evidence to show that businesses that operate in 4.63
denser economic environments tend to be more productive25. This effect is
apparent in the formation of business clusters, for example, which 'agglomerate' in
an area to take advantage of co-location benefits in business parks and incubator
units. Transportation is a critical factor in the determination of the effective
25 Department for Transport (UK). (2009). The Wider Impacts Sub-Objective TAG Unit 3.5.14.
Graham. (2006). Investigating the link between productivity and agglomeration. Retrieved from Department for
Transportation: http://www2.dft.gov.uk/pgr/economics/rdg/webia/webtheory/
Benefits Case Analysis Update
42
density of an area, and good transportation links can increase the productivity of
firms by expanding their access to a range of shared inputs and outputs, including
labour, suppliers and customers.
The location of the Yonge North Subway Extension, running directly to downtown, 4.64
means that it has the potential to significantly increase the economic density of
the city and deliver productivity benefits for the businesses that operate there.
Labour supply
By reducing the time and cost of commuting to work, transportation projects can 4.65
in effect increase the real wage of employees by reducing the fixed cost of
travelling to work. This can result in a significant increase in labour supply as, for
example, those at the margins of participation in the workforce decide to re-enter
employment as a result of the improved access to employment opportunities or
reduced access costs. This impact has numerous benefits for the individual and an
important tax impact for the city and provincial economies. Labour market
impacts are not always positive and transportation projects are typically shown to
generate labour supply impacts of between -2% to 22% of conventionally measured
benefits.
Whether the labour market impact is positive or negative depends on the amount 4.66
of benefit accruing to the transportation user, which is usually positive. However,
if the transportation project increases the cost of travel to the users without a
consummate fall in travel time, the generalized cost of travel will increase and
reduce the incentive to work. For example, a highway toll could create overall
congestion reduction benefits by reducing the number of users to those that are
willing to pay to drive on that highway. However, these benefits accrue mainly to
those users with a high value of time (business users) at the expense of low value
of time users (commuters and other purposes), who now experience higher travel
costs either through paying the toll or taking a less direct and/or slower route.
Labour supply impacts are highest for projects which deliver significant time 4.67
saving benefits to commuters, increasing the mobility of workers and potential
workers. In comparing the project options assessed for the Yonge North Subway
Extension, it is expected that the supply side impact would be greatest for the
Option that has the greatest travel time benefit – in this case, Option 1.
Imperfect Competition
Standard cost benefit analysis is based on assumptions of perfect competition 4.68
which are a simplification of the structure of the economy. It can be shown by
adopting a more realistic monopolistic competition model that there are additional
'imperfect competition' benefits related to the under-supply of goods in an
economy. This impact is directly related to the business cost saving impacts of a
transportation project and typically generates an uplift of around 3% on
conventionally measured benefits26.
26 Under perfect competition assumptions, businesses that benefit from travel time savings / costs are assumed to
increase their output to this level; however, under imperfect competition assumptions, it implies a monopolistic
power, which allows businesses to increase their output greater than the level of savings, thus creating a greater
benefit.

Benefits Case Analysis Update
43
Urban Development
There is significant evidence that high quality public transportation can generate a 4.69
positive impact on the urban development of a city or region. Transit projects can
promote regeneration in several ways, by improving accessibility, productivity,
access to labour and employment opportunities, boosting land values and
promoting sustainable land use patterns and development. These effects occur
through several processes:
I Increased Transport Accessibility – lowers the cost of travel and makes it
easier and cheaper to get to and from work, leisure and education destinations.
This increases the availability of labour for local businesses and expands the
available range of employment and leisure options for individuals. It can also
open up new areas of land for development and increase the attractiveness of
under-used land parcels.
I Increased Productivity – improving transport links reduces business costs and
directly boosts the productivity of firms. Transport can also reduce the
‘effective distance’ between businesses and individuals. Increasing productivity
through ‘agglomeration effects’, improving access to shared inputs and outputs,
generating denser labour markets and creating positive network effects.
I Improved Urban Fabric - new stations or stops can improve the level of
facilities and quality of urban realm at a location. This can in turn have a
positive impact on the environment and perceptions of an area, and can induce
further private sector investment in some cases.
I Increased Footfall – a new station or stop may generate an increase in levels of
pedestrian traffic. This enhances the value of a location as a retail or
commercial site by bringing more customers and increasing its profile.
I Improved City Image – transport hubs are often the first point of call for
visitors to city locations and major transport projects, particularly high quality
transit projects, can have an important impact on the image of a city,
encouraging new investment and migration.
Toronto's YUS subway line already exhibits much of the above discussion. High 4.70
density development around subway stations along Yonge Street has characterized
the area since the introduction of the subway in the 1950s. When comparing the
options assessed in this report, Option 1 has the highest potential for the described
benefits.
Impact on Land Values
As described above, transport projects affect land values through several 4.71
mechanisms that cause properties located near transit hubs to often enjoy a
significant price premium. This effect can be principally attributed to the lower
access costs of such locations, which enable large travel 'catchment' areas to make
such locations valuable for many different uses. Transport projects can also
increase the accessibility and availability of unused land, which can encourage
new development.
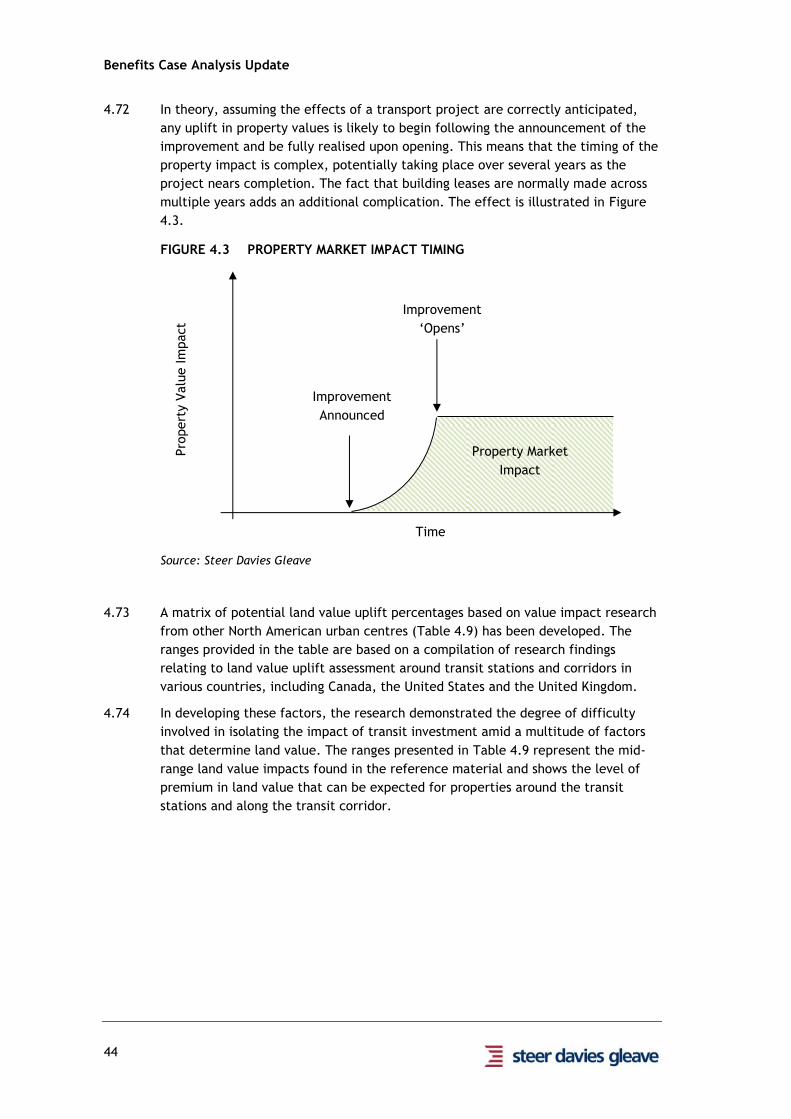
Benefits Case Analysis Update
44
In theory, assuming the effects of a transport project are correctly anticipated, 4.72
any uplift in property values is likely to begin following the announcement of the
improvement and be fully realised upon opening. This means that the timing of the
property impact is complex, potentially taking place over several years as the
project nears completion. The fact that building leases are normally made across
multiple years adds an additional complication. The effect is illustrated in Figure
4.3.
FIGURE 4.3 PROPERTY MARKET IMPACT TIMING
Source: Steer Davies Gleave
A matrix of potential land value uplift percentages based on value impact research 4.73
from other North American urban centres (Table 4.9) has been developed. The
ranges provided in the table are based on a compilation of research findings
relating to land value uplift assessment around transit stations and corridors in
various countries, including Canada, the United States and the United Kingdom.
In developing these factors, the research demonstrated the degree of difficulty 4.74
involved in isolating the impact of transit investment amid a multitude of factors
that determine land value. The ranges presented in Table 4.9 represent the mid-
range land value impacts found in the reference material and shows the level of
premium in land value that can be expected for properties around the transit
stations and along the transit corridor.
Pro
pert
y V
alu
e Im
pact
Improvement
‘Opens’
Improvement
Announced
Property Market
Impact
Time

Benefits Case Analysis Update
45
TABLE 4.9 LAND VALUE UPLIFT FACTORS
Source: Metropolitan Knowledge International
York Region has extensively researched the potential development in the corridor 4.75
for the Yonge North Subway Extension. This information on existing land use
patterns, alongside the land value uplift parameters set out by Metropolitan
Knowledge International, creates the basis on which this report forms the land
value analysis. The land value analysis is based on assumed land values (informed
by a small sample of current land values in the areas) and the distribution of land
uses by Official Plan (OP) designation in the area. OP designations approximate the
current land use patterns and are a generally good long-term indicator of the mix
and density of uses anticipated in the area.
As shown in Table 4.9, the Station Impact Area (SIA) for a subway station from a 4.76
land value perspective can extend outward to 800 metres or more. For the land
value uplift calculation, we have based the analysis on a 500 metre SIA in order to
be consistent with previous analysis. Even so, extending the analysis to an 800
metre radius would result in relatively little additional value uplift due to the
close proximity of the stations and overlapping SIAs. The exception to this is the
Thornhill area, where the distance between Clark and Royal Orchard stations is
approximately 1.9 kilometres. However, it is worth noting that while values might
increase in this area with an 800 metre SIA, heritage constraints on development
may limit redevelopment opportunities in the area.
Technology Bus BRT
LRT: at-
grade
LRT: grade
separated Subway GO Rail
Station impact Area (m) 100 400 500 600 800 800
Premium %
Low 1% 2% 10% 15% 20% 20%
High 2% 4% 25% 30% 50% 50%
Low 1% 2% 10% 15% 20% 20%
High 2% 4% 50% 50% 50% 50%
Low 1% 1% 10% 10% 7% 7%
High 2% 2% 50% 50% 15% 15%
Low 0 0 1% 1% 5% 5%
High 1% 2% 2% 2% 5% 5%
Technology Bus BRT
LRT: at-
grade
LRT: grade
separated Subway GO Rail
Right of way impact Area (m) 0 0 200 200 0 300
Premium %
Low 0 -5 -5
High -10 -15 -15
Low 0 0 0
High -10 -15 -10
Low 5 5 0
High 10 10 -10
Low 0 0 0
High 1 1 0
(1) (1) (2) (3)
Notes:
(2) no impact for underground subway since right of way impact area is underground.
(1) no impact for bus right of way impact areas, given that the short distance between bus stops creates
situation where station impact areas are almost adjoining each other.
(3) Ref Landis et al (1994) found negative externalities from being too near commuter rail (within 300 m)
Residential
Office
Retail
Industrial
Residential
Office
Retail
Industrial

Benefits Case Analysis Update
46
This analysis seeks to quantify the land value uplift that could be attributed 4.77
singularly to the introduction of transit in an area, rather than use transit as a
rationale to enable further development in a region. Further, the analysis
estimates the impact of the subway extension only.
Table 4.6 shows the potential land value uplift associated with each Option 4.78
compared to the Base Case and represents an estimate of the total overall
increase in property values assuming no change in land use designation.
TABLE 4.6 POTENTIAL LAND VALUE UPLIFT ($M)
Low High
Option 1 480 1,202
Option 2 157 392
Option 2A 157 392
Option 1 is expected to have a significantly greater uplift on properties due to the 4.79
larger number of additional subway stations. Option 2 and 2A are assumed to have
the same impact with relation to the subway extension.
Increase in development
Prior experience with the Sheppard Subway extension and the construction of the 4.80
Yonge-University lines shows that there is considerable potential in land
development resulting from transit investment. The assessment presented in this
report for the Yonge North Subway Extension is a high level appraisal and based on
experience from other jurisdictions. This appraisal does not separate the value
generated by the transit investment in the Yonge corridor from the value of
development that would have occurred elsewhere in the GTHA.
To further explore the land uplift capture (LUC) concept, York Region, in 4.81
collaboration with Metrolinx, is undertaking a more detailed assessment of the
corridor from this perspective. The scope of work is to assess the LUC potential of
the corridor as a result of the subway investment as well as approximate an
amount of LUC that could potentially be captured. The assessment will take into
account the property development proposals that will be unlocked as a result of
building the subway extension. The findings of the LUC assessment were not
available in time for incorporation into this report. However, the information,
when available, will be used to supplement decision-making on this account.
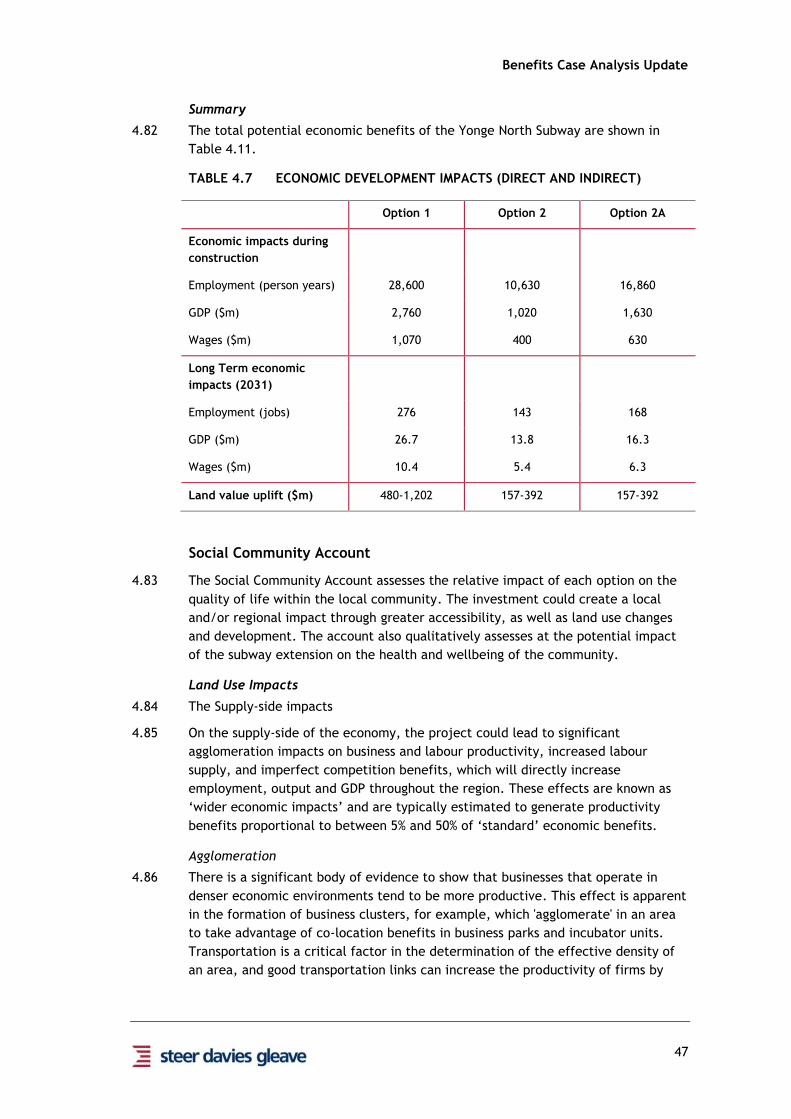
Benefits Case Analysis Update
47
Summary
The total potential economic benefits of the Yonge North Subway are shown in 4.82
Table 4.11.
TABLE 4.7 ECONOMIC DEVELOPMENT IMPACTS (DIRECT AND INDIRECT)
Option 1 Option 2 Option 2A
Economic impacts during
construction
Employment (person years) 28,600 10,630 16,860
GDP ($m) 2,760 1,020 1,630
Wages ($m) 1,070 400 630
Long Term economic
impacts (2031)
Employment (jobs) 276 143 168
GDP ($m) 26.7 13.8 16.3
Wages ($m) 10.4 5.4 6.3
Land value uplift ($m) 480-1,202 157-392 157-392
Social Community Account
The Social Community Account assesses the relative impact of each option on the 4.83
quality of life within the local community. The investment could create a local
and/or regional impact through greater accessibility, as well as land use changes
and development. The account also qualitatively assesses at the potential impact
of the subway extension on the health and wellbeing of the community.
Land Use Impacts
The Supply-side impacts 4.84
On the supply-side of the economy, the project could lead to significant 4.85
agglomeration impacts on business and labour productivity, increased labour
supply, and imperfect competition benefits, which will directly increase
employment, output and GDP throughout the region. These effects are known as
‘wider economic impacts’ and are typically estimated to generate productivity
benefits proportional to between 5% and 50% of ‘standard’ economic benefits.
Agglomeration
There is a significant body of evidence to show that businesses that operate in 4.86
denser economic environments tend to be more productive. This effect is apparent
in the formation of business clusters, for example, which 'agglomerate' in an area
to take advantage of co-location benefits in business parks and incubator units.
Transportation is a critical factor in the determination of the effective density of
an area, and good transportation links can increase the productivity of firms by
Benefits Case Analysis Update
48
expanding their access to a range of shared inputs and outputs, including labour,
suppliers and customers.
The location of the Yonge North Subway Extension, running directly to downtown, 4.87
means that it has the potential to significantly increase the economic density of
the city and deliver productivity benefits for the businesses that operate there.
Labour supply
By reducing the time and cost of commuting to work, transportation projects can 4.88
in effect increase the real wage of employees by reducing the fixed cost of
travelling to work. This can result in a significant increase in labour supply as, for
example, those at the margins of participation in the workforce decide to re-enter
employment as a result of the improved access to employment opportunities or
reduced access costs. This impact has numerous benefits for the individual and an
important tax impact for the city and provincial economies. Labour market
impacts are not always positive and transportation projects are typically shown to
generate labour supply impacts of between -2% to 22% of conventionally measured
benefits.
Whether the labour market impact is positive or negative depends on the amount 4.89
of benefit accruing to the transportation user, which is usually positive. However,
if the transportation project increases the cost of travel to the users without a
consummate fall in travel time, the generalized cost of travel will increase and
reduce the incentive to work. For example, a highway toll could create overall
congestion reduction benefits by reducing the number of users to those that are
willing to pay to drive on that highway. However, these benefits accrue mainly to
those users with a high value of time (business users) at the expense of low value
of time users (commuters and other purposes), who now experience higher travel
costs either through paying the toll or taking a less direct and/or slower route.
Labour supply impacts are highest for projects which deliver significant time 4.90
saving benefits to commuters, increasing the mobility of workers and potential
workers. In comparing the project options assessed for the Yonge North Subway
Extension, it is expected that the supply side impact would be greatest for the
Option that has the greatest travel time benefit – in this case, Option 1.
Imperfect Competition
Standard cost benefit analysis is based on assumptions of perfect competition 4.91
which are a simplification of the structure of the economy. It can be shown by
adopting a more realistic monopolistic competition model that there are additional
'imperfect competition' benefits related to the under-supply of goods in an
economy. This impact is directly related to the business cost saving impacts of a
transportation project and typically generates an uplift of around 3% on
conventionally measured benefits.
Urban Development Account demonstrates how all three options can impact land 4.92
development and intensification around the stations. The implementation of a
subway can also encourage more compact and walk-able neighbourhoods through
trying to optimise the number of developments that can easily access the station.
It is expected that the full subway extension (Option 1) would have an impact on a

Benefits Case Analysis Update
49
larger area, from being extended a further distance (i.e. Finch to Richmond Hill),
whereas the effect of Options 2 and 2A would be limited to south of Steeles
primarily.
The development potential along the corridor is also constrained by Built Heritage 4.93
Resources (BHR) and Cultural Heritage Landscapes (CHL) along Yonge Street. These
have been documented in a report published in January 2009, entitled Existing
Conditions: Built Heritage and Cultural Heritage Landscapes for the Yonge Subway
Extension Environmental Project. The report identifies 20 heritage sites that could
restrict densification along the full corridor. However, intensification on the land
parcels around these build heritage areas is planned. Overall, the potential impact
of all three options will only be realised if supported by municipal planning and
zoning guidelines.
Health
Transit is a mechanism for encouraging active transportation, particularly when 4.94
integrated with pedestrian/cycling facilities. A recent study calculated that taking
public transit in the US is associated with walking an additional average 8.3
minutes per day and could save individuals US$5,500 in obesity-related medical
costs27.
Transit demand is highest for Option 1, followed by Option 2A and then Option 2; 4.95
and the likely effect on physical health is potentially greater where demand for
transit is greatest.
As demonstrated in the Environmental Impacts section, there is likely to be a 4.96
benefit in emissions reduction under all Options. The health effects of poor air
quality are far reaching, affecting the body’s respiratory systems and
cardiovascular system. By reducing congestion and facilitating a modal shift to
transit, in particular subway, local air quality and associated health issues should
be improved.
Accessibility
The full subway extension would provide greater accessibility to downtown and 4.97
locations along the subway as it requires no interchange between modes from
Richmond Hill. In addition, Option 1 serves as a more accessible option for road
users, with the provision of a Park & Ride site at Langstaff.
Sensitivity Analysis
Future demand for transit will be highly dependent on changes in land use along 4.98
the corridor and vice versa. This is particularly likely for the Yonge North Subway
Extension due to numerous frameworks and studies depicting growth for York
Region. As such, sensitivity tests were carried out on Options 1 and 2, which use a
more aggressive land use scenario. The land use scenario tested as part of this
sensitivity analysis is consistent with the land use in DRTES in which there is a
greater proportion of future employment to downtown Toronto with more
population out in the rest of the GTHA region when compared to the current
Places to Grow assumptions.
27 Edwards, R.D. 2008. Public transit, obesity and medical costs: assessing the magnitudes

Benefits Case Analysis Update
50
The sensitivity results suggest a 7% increase in Option 1 transportation benefits 4.99
under this alternative land use assumption, and 15% increase for Option 2. With
higher employment forecasts focused on downtown Toronto, the degree of transit
use on the subway extension will be slightly greater, marginally improving the
value for money of each Option. However, based on the land use sensitivity, the
relative performance of the Options from a value for money perspective does not
change.
Summary Results
The results of the Multiple Account Evaluation are summarized in Table 4.12. 4.100
Option 1 performs most strongly for four of the accounts and is forecast to 4.101
generate almost twice the level of transportation user benefits, and approximately
three times the estimated land value impact of Option 2. On the fifth account, the
significant capital cost of Option 1 contributes to a lower Benefit Cost ratio than
Option 2 (0.8 versus 1.1) and a negative value for Net Benefits. Phasing the
construction could mitigate these costs by making the construction more
affordable and capturing a portion of the benefits. However Places to Grow growth
assumptions and associated transit demand on the corridor suggest that the
extension to Richmond Hill Centre provides a more long term solution to
accommodate all the forecast growth.
Option 2A is forecast to generate greater benefits than Option 2, but the high costs 4.102
of increasing GO frequencies indicate that this option is the poorest value for
money of the Options analysed.
For all options ridership resulting from implementing the Yonge North Subway 4.103
Extension may challenge downstream capacity on the Yonge subway line. To
address this concern Metrolinx is undertaking a regional network capacity analysis,
in partnership with York Region and the City of Toronto, to determine how to
sequence construction of the Yonge subway extension to Richmond Hill Centre
(Option 1) with the phased implementation of other network improvements such as
automatic train control, the Downtown Relief Line, Union Station and Yonge-Bloor
improvements.

Benefits Case Analysis Update
51
TABLE 4.8 MAE SUMMARY
Option 1 Option 2 Option 2A
Transportation User Account
Transportation User Benefits (PV $M) 1,980.3 1,025.5 1,210.5
Qualitative User Benefits
Financial Account
Costs (PV $m) 2,645.0 971.5 1,907.7
Net Benefits (PV $m) -664.8 +54.0 -697.2
Benefit Cost Ratio 0.8:1 1.1:1 0.6:1
Environmental Account
GHG Emissions Reductions (PV $m) 9.2 4.5 5.4
CAC Emissions Reductions
Economic Development Account
Economic Impacts during Construction:
Employment (person years) 28,600 10,630 16,860
GDP ($m) 2,760 1,020 1,630
Wages ($m) 1,070 400 630
Economic Impacts during Operation (2031):
Employment (jobs) 276 143 168
GDP ($m) 26.7 13.8 16.3
Wages ($m) 10.4 5.4 6.3
Land Value Uplift ($m) 480-1,202 157-392 157-392
Development Potential
Social and Community Account
Land Use Shaping
Health
Accessibility


Revised Benefits Case
AppendixA
APPENDIX
A
ASSUMPTIONS TABLE


Revised Benefits Case
P:\Projects\223\3\14\01\Outputs\Reports\Yonge North Subway Extension Benefits Case_May 2013 FINAL.docx
A1 ASSUMPTIONS TABLE
A1.1 The following table shows the assumptions that were applied to the Yonge North
Subway Extension economic appraisal.
Assumption Value Source
Opening Date 2018 Metrolinx
Price Base/Currency 2011 CAD
Benefits/Revenue Build-Up 2018: 60%
2019: 90%
2020: 100%
Metrolinx
Revenue Cap After year 2035 Metrolinx
Value of Time (per hour) Business: $38.45
Other: $11.83
Weighted Average: $14.24
GGH Model
Value of Time Growth 1.64% p.a. Metrolinx
Auto Cost Unit Rate $0.56/km (2011 prices) CAA
Safety Saving Unit Rate $0.07/km (2011 prices) Canadian Motor Vehicle
Collision Statistics
Greenhouse Gas Emission
Cost
$0.01/km (2011 prices) GGH and Transport and
Environment Canada
Real Growth Construction: 1.0% p.a.
Vehicles: 1.0% p.a.
Operations: 0.0% p.a.
Revenues: 0.0% p.a.
Auto Costs: 2.0% p.a.
Metrolinx
Annualisation Factors (AM
Peak period to Annual)
Transit: 1170
Highways: 3000
Metrolinx
Discount Rate 5% p.a. Metrolinx