
dealers.yeti.com · 2018-01-22 · YETI YETI YETI YETI . Created Date: 1/8/2018 9:42:23 AM
Thesis Proposal:
YETI: a graduallY Extensible Trace Interpreter
Mathew Zaleski
(for advisory committee meeting Jan 17/2007)
1

2

Contents
1 Introduction 7
1.1 Challenges of Efficient Interpretation . . . . . . . . . . . . . . .. . . . . . . . 8
1.2 Challenges of Evolving to a Mixed-Mode System . . . . . . . . . .. . . . . . 9
1.3 Overview of Our Solution . . . . . . . . . . . . . . . . . . . . . . . . . . .. . 11
1.4 Thesis Statement . . . . . . . . . . . . . . . . . . . . . . . . . . . . . . . . .13
1.5 Contribution . . . . . . . . . . . . . . . . . . . . . . . . . . . . . . . . . . . . 13
1.6 Outline of Thesis . . . . . . . . . . . . . . . . . . . . . . . . . . . . . . . . .14
2 Background and Related Work 15
2.1 Interpreter Dispatch . . . . . . . . . . . . . . . . . . . . . . . . . . . . .. . . 15
2.1.1 Switch Dispatch . . . . . . . . . . . . . . . . . . . . . . . . . . . . . 16
2.1.2 Direct Call Threading . . . . . . . . . . . . . . . . . . . . . . . . . . 18
2.1.3 Direct Threading . . . . . . . . . . . . . . . . . . . . . . . . . . . . . 18
2.1.4 The Context Problem . . . . . . . . . . . . . . . . . . . . . . . . . . . 21
2.1.5 Optimizing Dispatch . . . . . . . . . . . . . . . . . . . . . . . . . . . 22
2.2 Dynamic Hardware Branch Prediction . . . . . . . . . . . . . . . . . .. . . . 25
2.3 Traces . . . . . . . . . . . . . . . . . . . . . . . . . . . . . . . . . . . . . . . 26
2.3.1 HP Dynamo . . . . . . . . . . . . . . . . . . . . . . . . . . . . . . . . 26
2.3.2 Other Trace-oriented Systems . . . . . . . . . . . . . . . . . . . .. . 29
2.4 JIT Compilation . . . . . . . . . . . . . . . . . . . . . . . . . . . . . . . . . . 31
3

CONTENTS CONTENTS
3 Efficient Interpretation 35
3.1 Design and Implementation . . . . . . . . . . . . . . . . . . . . . . . . .. . . 35
3.1.1 Understanding Branches . . . . . . . . . . . . . . . . . . . . . . . . . 36
3.1.2 Handling Linear Dispatch . . . . . . . . . . . . . . . . . . . . . . . .36
3.1.3 Handling Virtual Branches . . . . . . . . . . . . . . . . . . . . . . . .39
3.1.4 Handling Virtual Call and Return . . . . . . . . . . . . . . . . . . . .42
4 Evaluation 47
4.1 Virtual Machines, Benchmarks and Platforms . . . . . . . . . . .. . . . . . . 47
4.1.1 OCaml . . . . . . . . . . . . . . . . . . . . . . . . . . . . . . . . . . 48
4.1.2 SableVM . . . . . . . . . . . . . . . . . . . . . . . . . . . . . . . . . 48
4.1.3 OCaml Benchmarks . . . . . . . . . . . . . . . . . . . . . . . . . . . 49
4.1.4 SableVM Benchmarks . . . . . . . . . . . . . . . . . . . . . . . . . . 50
4.1.5 Pentium IV Measurements . . . . . . . . . . . . . . . . . . . . . . . . 50
4.1.6 PowerPC Measurements . . . . . . . . . . . . . . . . . . . . . . . . . 50
4.2 Interpreting the data . . . . . . . . . . . . . . . . . . . . . . . . . . . . .. . . 51
4.2.1 Effect on Pipeline Branch Hazards . . . . . . . . . . . . . . . . . .. . 51
4.2.2 Performance . . . . . . . . . . . . . . . . . . . . . . . . . . . . . . . 54
4.3 Inlining . . . . . . . . . . . . . . . . . . . . . . . . . . . . . . . . . . . . . . 59
4.4 Limitations of Context Threading . . . . . . . . . . . . . . . . . . . .. . . . 60
4.5 Summary . . . . . . . . . . . . . . . . . . . . . . . . . . . . . . . . . . . . . 62
5 Design and Implementation of YETI 63
5.1 Instrumentation . . . . . . . . . . . . . . . . . . . . . . . . . . . . . . . . .. 64
5.2 Loading . . . . . . . . . . . . . . . . . . . . . . . . . . . . . . . . . . . . . . 65
5.3 Basic Block Detection . . . . . . . . . . . . . . . . . . . . . . . . . . . . . . 65
5.4 Trace Selection . . . . . . . . . . . . . . . . . . . . . . . . . . . . . . . . . .67
5.5 Trace Exit Runtime . . . . . . . . . . . . . . . . . . . . . . . . . . . . . . . . 68
4

CONTENTS
5.6 Generating code for traces . . . . . . . . . . . . . . . . . . . . . . . . .. . . 70
5.6.1 Trace Exits and Trace Exit Handlers . . . . . . . . . . . . . . . .. . . 70
5.6.2 Code Generation . . . . . . . . . . . . . . . . . . . . . . . . . . . . . 71
5.6.3 Trace Optimization . . . . . . . . . . . . . . . . . . . . . . . . . . . 74
5.7 Polymorphic bytecodes . . . . . . . . . . . . . . . . . . . . . . . . . . . .. . 75
5.8 Other implementation details . . . . . . . . . . . . . . . . . . . . . .. . . . . 76
5.9 Packaging and portability . . . . . . . . . . . . . . . . . . . . . . . . .. . . 76
6 Evaluation of Yeti 77
6.1 Effect of region shape on region dispatch count . . . . . . . .. . . . . . . . . 78
6.2 Effect of region shape on performance . . . . . . . . . . . . . . . .. . . . . . 81
6.2.1 JIT Compiled traces . . . . . . . . . . . . . . . . . . . . . . . . . . . 83
7 Conclusions and Future Work 87
8 Remaining Work 89
8.1 Compile Basic Blocks . . . . . . . . . . . . . . . . . . . . . . . . . . . . . . . 89
8.2 Instrument Compile Time . . . . . . . . . . . . . . . . . . . . . . . . . . . .. 90
8.3 Another Register Class . . . . . . . . . . . . . . . . . . . . . . . . . . . . . .90
8.4 Measure Dynamic Proportion of JIT Compiled Instructions. . . . . . . . . . . 90
Bibliography 91
5

CONTENTS
6

Chapter 1
Introduction
An interpreter is an attractive way to support an evolving computer language, making it easy to
test and refine new language features. The portability of an interpreter also allows a new lan-
guage to be widely deployed. Nevertheless, informal comparisons show that these interpreted
language implementations generally run much more slowly than compiled code. To get the
best of both worlds, today’s high-performance Java implementations run inmixed-mode, that
is, combining interpretation with dynamic just-in-time (JIT) compilation. Given the success of
this strategy for Java, why are many useful languages like Python, JavaScript, Tcl and Ruby
not implemented by mixed-mode systems?
We believe that two main factors block gradually enhancing an interpreter to become a
mixed-mode virtual machine. First, the way virtual instructions are packaged in modern in-
terpreters makes it hard to dispatch them from regions of generated code. Second, current JIT
compilers follow the legacy of static compilation and generate code only for methods. This
significantly increases the complexity of the JIT and its runtime.
Our interpreter is packaged so that its virtual instructionscanbe used from generated code.
Our JIT compiler generates code for dynamically discoveredtraces rather than methods. This
enables our system to grow into a mixed-mode run-time systemalong two dimensions. First,
our compiler can be extended gradually, adding support for virtual instructions one at a time.
7

1.1. CHALLENGES OF EFFICIENT INTERPRETATION
Second, our system can be incrementally extended to identify larger regions of the program.
We focus onvirtual machine interpretersin which source code is compiled to avirtual
programor bytecoderepresentation (i.e., a sequence ofvirtual instructionsand their operands).
Typically, virtual instructions are described as though provided by real hardware, but in fact
the virtual machine implements each with a block of code, called thevirtual instruction body,
or simply body. The interpreter executes the virtual program bydispatchingeach body in
sequence.
Our work has two main parts. First, we show that organizing the implementation of an
interpreter by packaging virtual instruction bodies as callable units is efficient. Second, we
demonstrate that a trace-based dynamic compiler has reasonable overhead and achieves good
speedup.
1.1 Challenges of Efficient Interpretation
Recently, Ertl and Gregg observed that the performance of otherwise efficientdirect-threaded
interpretation is limited by pipeline stalls and flushes dueto extremely poor indirect branch
prediction [18]. Modern pipelined architectures, such as the Pentium IV (P4) and the Pow-
erPC (PPC), must keep their pipelines full to perform well. Hardware branch predictors use
thenativePC to exploit the highly-biased branches found in typical (native code) CPU work-
loads [28, 30, 35]. Direct-threaded virtual machine (VM) interpreters, however, are not typical
workloads. Their branches’ targets are unbiased and therefore unpredictable [18, 19]. For an
interpreted program, it is thevirtual program counter (orvPC) that is correlated with control
flow. We therefore propose to organize the interpreter so that the native PC correlates with the
vPC, exposing virtual control flow to the hardware.
We introduce a technique based onsubroutine threading, once popular in early interpreters
for languages like Forth. To leverage return address stack prediction we implement each virtual
instruction body as a subroutine which ends in a nativereturn instruction [5]. Note, however,
RCSfile : intro.lyx, v Revision : 1.17 8

CHAPTER 1. INTRODUCTION
that these subroutines are not full-fledged functions in thesense of a higher-level programming
language such as C (no register save/restore, stack frame creation, etc.). When the instruc-
tions of a virtual program are loaded by the interpreter, we translate them to a sequence of
call instructions, one per virtual instruction, whose targets are these subroutines. Virtual in-
structions are then dispatched by executing this sequence of calls. The key to the effectiveness
of this simple approach is that at dispatch time, the native PC is perfectly correlated with the
virtual PC. Thus, for non-branching bytecodes, the return address stack in modern processors
reliably predicts the address of the next bytecode to execute. Because the next dynamic instruc-
tion is not generally the next static instruction in the virtual program, branches pose a greater
challenge, For these virtual instructions, we provide a limited form of specialized inlining, re-
placing indirect with relative branches, thus exposing virtual branches to the hardware’s branch
predictors.
1.2 Challenges of Evolving to a Mixed-Mode System
Current JIT compilers are method-oriented, that is, the JIT must generate code for entire meth-
ods at a time. This leads to two problems. First, if the construction of the JIT is approached in
isolation from an existing interpreter, the JIT project is a“big bang” development effort where
the code generation for dozens, if not hundreds, of virtual instructions is written and debugged
at the same time. Second, compiling whole methods compiles cold code as well as hot. This
complicates the generated code and its runtime.
The first issue can be dealt with by more closely integrating the JIT with the interpreter.
If the interpreter provides a callable routine to implementeach virtual instruction body, then,
when the JIT encounters a virtual instruction it does not fully support, it can simply gener-
ate a call to the body instead [48]. Hence, rather than a big bang, development can proceed
more gradually, in a sequence of stages, where JIT support for one or a few virtual instruc-
tions is added in each stage. Modern interpreters do not, however, typically provide callable
RCSfile : intro.lyx, v Revision : 1.17 9

1.2. CHALLENGES OF EVOLVING TO A MIXED-MODE SYSTEM
implementations of virtual instruction bodies.
The second issue, compiling cold code (i.e., code that has never executed), has more im-
plications than simply wasting compile time. Except at the very highest levels of optimization,
where analyzing cold code may prove useful facts about hot regions, there is little point com-
piling code that never runs. Moreover, cold code increases the complexity of dynamic compi-
lation. We give three examples. First, for late binding languages such as Java, cold code likely
contains references to program values which are not yet bound. If the cold code eventually
does run, the generated code and the runtime that supports itmust deal with the complexities
of late binding [52]. Second, certain dynamic optimizations are not possible without profiling
information. Foremost amongst these is the optimization ofvirtual function calls. Since there
is no profiling information for cold code the JIT may have to generate relatively slow con-
servative code. Third, as execution proceeds, cold regionsin compiled methods may become
hot. The conservative assumptions made during the initial compilation may now be a drag on
performance. The straightforward-sounding approach of recompiling these methods is com-
plicated by problems such as what to do about threads that arestill executing in the method or
which must return to the method in the future.
These considerations suggest that the architecture of agradually extensible mixed-mode
virtual machine should have three important properties. First, virtual bodies should be callable
routines. Second, the unit of compilation must be dynamically determined and of flexible
shape, so as to capture hot regions while avoiding cold. Third, as new regions of hot code
reveal themselves, a way is needed of gracefully compiling and linking it on to previously
compiled hot code.
Currently, languages like Java, OCaml, and Tcl deploy relatively high performance inter-
preters based on thedirect threadingvirtual instruction dispatch technique [4, 17]. Unfor-
tunately, there is no straightforward and efficient way for direct threaded virtual instruction
bodies to interoperate with generated code. The problem is caused by the nature of threaded
dispatch, namely that once dispatched a direct threaded body branches to its successor, out
RCSfile : intro.lyx, v Revision : 1.17 10

CHAPTER 1. INTRODUCTION
of the control of any generated code that may have dispatchedit. Thus, the legacy of direct
threading, originally adopted for performance reasons, has led to a situation where the instruc-
tion bodies cannot be reused from generated code. Ironically, on modern hardware, direct
threading is no longer particularly efficient because of itspoor branch prediction behavior. In
contrast, our implementation (Chapter 3) and evaluation (Chapter 4) of subroutine threading
has shown that direct threaded bodies repackaged as callable routines can be dispatched very
efficiently.
1.3 Overview of Our Solution
Our aim is to design an infrastructure that supports dynamiccompilation units of varying
shapes. Just as a virtual instruction body implements a virtual instruction, anexecution unit
implements a region of the virtual program. Possible execution units include single virtual
instructions, basic blocks, methods, partial methods, inlined method nests, and traces (i.e.,
frequently-executed paths through the virtual program). The key idea is to package every ex-
ecution unit as callable, regardless of the size or shape of the region of the virtual program
that it implements. The interpreter can then execute the virtual program by dispatching each
execution unit in sequence.
Execution units corresponding to longer sequences of virtual instructions will run faster
than those compiled from short ones because fewer dispatches are required. In addition, larger
execution units should offer more opportunities for optimization. However, larger execution
units are more complicated and so we expect them to require more development effort to detect
and compile than short ones. This suggests that the performance of a mixed-mode VM can be
gradually extended by incrementally increasing the scope of execution units it identifies and
compiles. Ultimately, the peak performance of the system should be at least as high as current
method-based JIT compilers since, with enough engineeringeffort, execution units of inlined
method nests could be supported.
RCSfile : intro.lyx, v Revision : 1.17 11

1.3. OVERVIEW OF OUR SOLUTION
The practicality of our scheme depends on the efficiency of subroutine dispatch so the
first phase of our research was to retrofit a Java virtual machine, andocamlrun, an Ocaml
interpreter [9], to a new hybrid dispatch technique we callcontext threading. We evaluated
context threading on PowerPC and Pentium 4 platforms by comparing branch predictor and
run time performance of common benchmarks to unmodified, direct threaded versions of the
virtual machines.
In the second phase of this research we gradually extended JamVM, a cleanly implemented
and relatively high performance Java interpreter [33] to create our prototype, Yeti, (graduallY
Extensible Trace Interpreter). We built Yeti in five phases:First, we repackaged all virtual
instruction bodies as callable. Our initial implementation executed only single virtual instruc-
tions which were dispatched from a simple dispatch loop. Second, we identified basic blocks,
or sequences of virtual instructions. Third, we extended our system to identify and dispatch
traces, or sequences of basic blocks. Traces are significantly morecomplex execution units
than basic blocks because they must accommodate virtual branch instructions. Fourth, we ex-
tended the trace system to link traces together. In the fifth and final stage, we implemented a
naive, non-optimizing compiler to compile the traces. Our compiler currently generates Pow-
erPC code for about 50 virtual instructions.
We chose traces because they have several attractive properties: (i) they can extend across
the invocation and return of methods, and thus have an inter-procedural view of the program,
(ii) they contain only hot code, (iii) they are relatively simple to compile as they aresingle-entry
multiple-exitregions of code, and (iv), as new hot paths reveal themselvesit is straightforward
to generate new traces and link them onto existing ones.
These properties make traces an ideal execution unit for an entry level mixed-mode system
like Yeti is today. However, new shapes of execution units assembled from linked traces may
turn out to have all the advantages of inlined method nests but also side-step the overhead of
generating code for cold regions within the methods.
RCSfile : intro.lyx, v Revision : 1.17 12

CHAPTER 1. INTRODUCTION
1.4 Thesis Statement
The implementation of a new programming language should make the exploration of new
features easy, yet at the same time be extensible to a high performance mixed-mode system
as the language matures. To achieve this, an interpreter should be organized around callable
virtual instruction bodies for efficient dispatch and the ability to call bodies from generated
code. By dispatching regions of the virtual program, initially the callable bodies, from an
instrumented dispatch loop the interpreter can be gradually extended to be a trace-oriented
mixed-mode system. This structure enables extensibility in two dimension. First, callable
bodies can be dispatched from generated code, so the compiler can be extended one virtual
instruction at a time. Second, the instrumented dispatch loop makes it simple to identify, then
dispatch, larger and more complex execution units.
1.5 Contribution
The contributions of this thesis are twofold:
1. We show that packaging virtual instruction bodies as callable routines is desirable on
modern processors because the additional cost of call and return is more than made up for
by improvements in branch prediction. We show that subroutine threading significantly
outperforms direct threading, for Java and Ocaml on Pentiumand PowerPC. We show
how with a few extensions a context threaded interpreter canperform as well as or better
than a selective inlining interpreter, previously the state of the art.
2. We propose an architecture for, and describe our implementation of, a trace-oriented
mixed-mode system that allows a subroutine threaded interpreter to be gradually en-
hanced to identify and compile larger execution units and thus obtain better performance.
By adopting our architecture the implementors of new or existing languages can more
easily enhance their systems to run mixed mode and hence balance development costs
RCSfile : intro.lyx, v Revision : 1.17 13

1.6. OUTLINE OF THESIS
against performance benefits.
1.6 Outline of Thesis
We describe an architecture for a virtual machine interpreter that facilitates the gradual exten-
sion to a trace-based mixed-mode JIT compiler. We demonstrate the feasibility of this approach
in a prototype, Yeti, and show that performance can be gradually improved as larger program
regions are identified and compiled.
In Chapter 2 we present background and related work on interpreters and JIT compilers. In
Chapter 3 we describe the design and implementation of context threading. Chapter4 describes
how we evaluated context threading. The design and implementation of Yeti is described in
Chapter 5. We evaluate the benefits of this approach in Chapter 6. Finally, we discuss possible
avenues for future work and conclusions in Chapter 7.
RCSfile : intro.lyx, v Revision : 1.17 14

Chapter 2
Background and Related Work
To motivate the design choices we made in our system, we first review existing interpreter
dispatch and JIT compilation strategies. We note that portability is an important property of
interpreters, particularly for a new language implementation. Thus, it should be possible to
build the source code base of the interpreter on a large number of platforms. On the other hand,
dynamic compilers are intrinsically non-portable software, since they must generate platform-
specific code. Some non-portable functionality may therefore be required by an interpreter to
help it to integrate conveniently with the JIT. As we review various interpreter techniques, we
comment on both their portability and suitability for gradual JIT development.
2.1 Interpreter Dispatch
An interpreter must load a virtual program before starting to execute it. Whereas the compact-
ness of the storage format of a virtual program may be important, the loaded representation has
likely been designed for good execution performance. As we shall see, the representation of the
loaded virtual program goes hand in hand with the dispatch mechanism used by the interpreter.
In the next few sections we will describe several dispatch techniques. Typically we will give
a small C language example that illustrates the way the interpreter is structured and a diagram
showing how the internal representation is arranged. The examples may give the impression
15

2.1. INTERPRETER DISPATCH
that all interpreters are always hand written C programs. Precisely because so many dispatch
mechanisms exist, some researchers argue that the interpreter portion of a virtual machine
should be generated from some more generic representation [20, 48].
2.1.1 Switch Dispatch
Perhaps the simplest combination of loaded representationand dispatch mechanism, switch
dispatch, is illustrated by Figure 2.1. The figure introduces a running example we will use
several times, so we will briefly describe it here. First, a Java compiler creates a class file
describing part of a virtual program in a standardized format. In our example we show just
one Java expression{c=a+b} which adds the values of two Java local variables and stores
the result in a third.Javac, a Java compiler, has translated this to the sequence of virtual
instructions shown in the middle box on the left. The actual semantics of the virtual instructions
are not important to our example other than to note that none are virtual branch instructions.
Before our example can be run by the interpreter it must beloaded, or converted into a
representation that can be executed. The loaded representation appears on the bottom left.
There are two main things that happen during loading. First,the virtual opcode of each virtual
instruction is translated into a form best suited for the dispatch technique in use. For example,
in this case each virtual opcode is loaded as a token corresponding to the operation it carries out.
Second, the arguments of the virtual instructions must be loaded. In the figure the arguments,
for those virtual instructions that take them, are loaded following the token representing the
virtual opcode.
Figure 2.1 illustrates the situation just before the our example expression is run. Note the
virtual program counter, thevPC, points to the word in the loaded representation corresponding
to the leadingiload. The correspondingcase in the switch statement does the actual
work. All execution time other than that spent executing thebodies is dispatch overhead.
Switch dispatch can be implemented in ANSI standard C and so it is very portable and
very commonly used (e.g. in the JavaScript and Python interpreters). It is also slow due to the
RCSfile : background − related.lyx, v Revision : 1.23 16

CHAPTER 2. BACKGROUND AND RELATED WORK
Java
source
Java
Bytecode
{ c=a+b+1;}
vPC
loaded
representation
of virtual
program
iload
a
iload
b
iconst
1
iadd
iadd
istore
c
interp(){ int *vPC;
while(1){
switch(*vPC++){
case ILOAD: //push var.. break;
case ICONST: //push constant break;
case IADD: //add 2 slots break;
case ISTORE: //pop,store break;
}
}
}
iload aiload biconst 1iaddiaddistore c
Figure 2.1: A switch interpreter loads each virtual instruction as a virtual opcode, or token,
corresponding to the case of the switch statement that implements it.
RCSfile : background − related.lyx, v Revision : 1.23 17

2.1. INTERPRETER DISPATCH
overhead of the dispatch loop and the switch.
2.1.2 Direct Call Threading
Another highly portable way to organize an interpreter is towrite each virtual instruction as
a function and dispatch the function corresponding to each virtual instruction via a function
pointer from a dispatch loop. A variation of this technique called direct call threading is de-
scribed by Ertl [17]. This is illustrated by Figure 2.2. For historical reasons the name “direct”
is given to interpreters which store the address of the virtual instruction bodies in the loaded
representation. Presumably this is because they avoid the need for any mapping table. How-
ever, the name can be confusing since the machine instruction generated by the compiler to
implement the function pointer is anindirect call. In the figure thevPC is a static variable
which means theinterp function as shown is not re-entrant. This example is meant togive
the flavor of call threading not be a realistic program.
In Chapter 5 we will show that direct call threading can perform about the same as switch
threading. Next we will describe direct threading, perhapsthe most well known “high perfor-
mance” dispatch technique.
2.1.3 Direct Threading
As shown on the left of Figure 2.3, a virtual program is loadedinto a direct-threaded interpreter
by constructing alist of addresses, one for each virtual instruction in the program, pointing to
the entry of the body for that instruction. We refer to this list as theDirect Threading Table, or
DTT, and refer to locations in the DTT asslots. Virtual instruction operands are also stored in
the DTT, immediately after the address of the correspondingbody. The interpreter maintains a
virtual program counter, orvPC, which points to a slot in the DTT, to identify the next virtual
instruction to be executed and to allow bodies to locate their operands.
Interpretation begins by initializing thevPC to the first slot in the DTT, and then jumping
RCSfile : background − related.lyx, v Revision : 1.23 18

CHAPTER 2. BACKGROUND AND RELATED WORK
vPC
iload
a
iload
b
iconst
1
iadd
iadd
istore
c
DTT void iload(){ // push var vPC++; } void iconst(){// push constant vPC++; } void iadd(){ //pop,pop,add,push vPC++; } void istore(){ //pop,store... } vPC = &dtt[0]; interp(){ while(1){ (*vPC)(); //dispatch loop } }
loaded data
Figure 2.2: A direct call threaded interpreter packages each virtual instruction body as a func-
tion. The shaded box highlights the dispatch loop showing how instructions are called through
a function pointer. Direct call threading requires the loaded representation of the program to
indicate theaddressof the function implementing each virtual instruction.
RCSfile : background − related.lyx, v Revision : 1.23 19
2.1. INTERPRETER DISPATCH
vPC
iload aiload biconst 1iaddiaddistore c
{ c=a+b+1;} &&iload
a&&iloadb&&iconst1&&iadd&&iadd&&istorec
DTTinterp(){ iload: //push var.. goto *vPC++;
iconst: //push constant goto *vPC++;
iadd://add 2 slots
istore://pop,store }
Java source
Java Bytecode
Bytecode Loader
JavacCompiler
Virtual Instruction Bodies
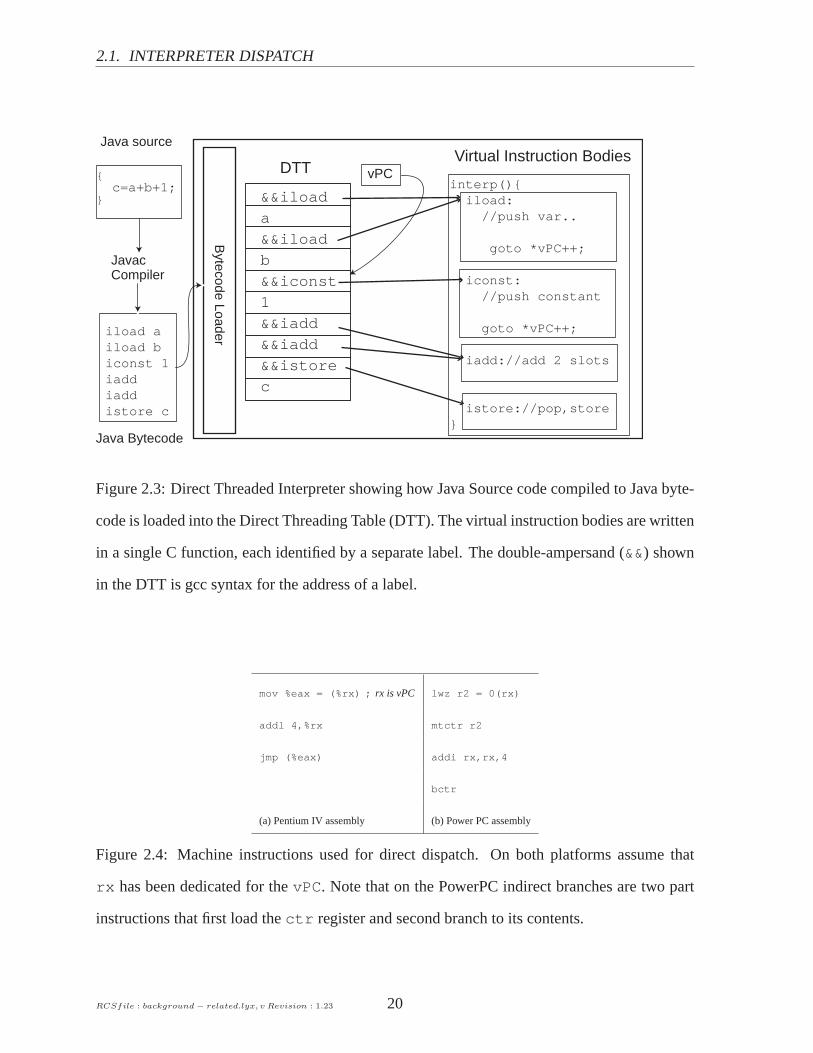
Figure 2.3: Direct Threaded Interpreter showing how Java Source code compiled to Java byte-
code is loaded into the Direct Threading Table (DTT). The virtual instruction bodies are written
in a single C function, each identified by a separate label. The double-ampersand (&&) shown
in the DTT is gcc syntax for the address of a label.
mov %eax = (%rx) ; rx is vPC lwz r2 = 0(rx)
addl 4,%rx mtctr r2
jmp (%eax) addi rx,rx,4
bctr
(a) Pentium IV assembly (b) Power PC assembly
Figure 2.4: Machine instructions used for direct dispatch.On both platforms assume that
rx has been dedicated for thevPC. Note that on the PowerPC indirect branches are two part
instructions that first load thectr register and second branch to its contents.
RCSfile : background − related.lyx, v Revision : 1.23 20

CHAPTER 2. BACKGROUND AND RELATED WORK
to the address stored there. Each body then ends by transferring control to the next instruction,
shown in Figure 2.3 asgoto *vPC++. In C, bodies are identified by alabel. Common C
language extensions permit the address of this label to be taken, which is used when initializing
the DTT. The computed goto used to transfer control between instructions is also a common
extension, making direct threading very portable.
This requires fewer instructions and is faster than switch dispatch. Assembler for the dis-
patch sequence is shown in Figure 2.4. When executing the indirect branch in Figure 2.4(a) the
Pentium IV will speculatively dispatch instructions usinga predicted target address. The Pow-
erPC uses a different strategy for indirect branches, as shown in Figure 2.4(b). First the target
address is loaded into a register, and then a branch is executed to this register address. Rather
than speculate, the PowerPC stalls until the target addressis known, although other instructions
may be scheduled between the load and the branch to reduce or eliminate these stalls.
2.1.4 The Context Problem
Stalling and incorrect speculation are serious pipeline hazards. To perform at full speed, mod-
ern CPU’s need to keep their pipelines full by correctly predicting branch targets. Indirect
branch predictors assume that the branch destination is highly correlated with the address of
the indirect branch instruction itself. As observed by Ertl[18, 19], this assumption is usually
wrong for direct threaded interpreter workloads. In a direct-threaded implementation, there is
only oneindirect jump instruction per virtual opcode implemented.For example, in the frag-
ment of virtual code illustrated in Figure 2.3, there are twoinstances ofiload followed by
iconst. The indirect dispatch branch at the end of theiload body will execute twice. The
first time, in the context of the first instance ofiload, it will branch back to the head of
the theiload body whereas in the context of the secondiload it will branch toiconst.
To the hardware the destination of the dispatch is unpredictable because its destination is not
correlated with the hardwarepc. Instead, its destination is correlated tovPC. We refer to this
lack of correlation between the hardwarepc andvPC as thecontext problem.
RCSfile : background − related.lyx, v Revision : 1.23 21

2.1. INTERPRETER DISPATCH
2.1.5 Optimizing Dispatch
Much of the work on interpreters has focused on the dispatch problem. Kogge [32] remains a
definitive description of many threaded code dispatch techniques. These can be divided into
two broad classes: those which refine the dispatch itself, and those which alter the bodies so
that there are more efficient or simply fewer dispatches. Switch dispatch and direct threading
belong to the first class, as does subroutine threading, discussed next. Later, we will discuss su-
perinstructions and replication, which are in the second class. We are particularly interested in
subroutine threading and replication because they both provide context to the branch prediction
hardware.
Some Forth interpreters use subroutine-threaded dispatch. Here, a loaded virtual program
is not represented as a list of body addresses, but instead asa sequence of nativecalls to
the bodies, which are then constructed to end with nativereturns. Curley [12, 11] describes
a subroutine-threaded Forth for the 68000 CPU. He improves the resulting code by inlining
small opcode bodies, and converts virtual branch opcodes tosingle native branch instructions.
He credits Charles Moore, the inventor of Forth, with discovering these ideas much earlier.
Outside of Forth, there is little thorough literature on subroutine threading. In particular, few
authors address the problem of where to store virtual instruction operands. In Section 3.1.2,
we document how operands are handled in our implementation of subroutine threading.
The choice of optimal dispatch technique depends on the hardware platform, because dis-
patch is highly dependent on micro-architectural features. On earlier hardware,call andreturn
were both expensive and hence subroutine threading required two costly branches, versus one
in the case of direct threading. Rodriguez [43] presents the trade offs for various dispatch types
on several 8 and 16-bit CPUs. For example, he finds direct threading is faster than subroutine
threading on a 6809 CPU, because thejsr andret instruction require extra cycles to push
and pop the return address stack. On the other hand, Curley found subroutine threading faster
on the 68000 [11]. On modern hardware the cost of thecall and return is much lower, due
to return branch prediction hardware, while the cost of direct threading has increased due to
RCSfile : background − related.lyx, v Revision : 1.23 22

CHAPTER 2. BACKGROUND AND RELATED WORK
misprediction. In Chapter 4 we demonstrate this effect on several modern CPUs.
Superinstructionsreduce the number of dispatches. Consider the code to add a constant
integer to a variable. This may require loading the variableonto the stack, loading the con-
stant, adding, and storing back to the variable. VM designers can instead extend the virtual
instruction set with a single superinstruction that performs the work of all four instructions.
This technique is limited, however, because the virtual instruction encoding (often one byte
per opcode) may allow only a limited number of instructions,and the number of desirable
superinstructions grows exponentially in the number of subsumed atomic instructions. Fur-
thermore, the optimal superinstruction set may change based on the workload. One approach
uses profile-feedback to select and create the superinstructions statically (when the interpreter
is compiled [20]).
Piumarta [40] presentsselective inlining. It constructs superinstructions when the virtual
program is loaded. They are created in a relatively portableway, bymemcpy’ing the native
code in the bodies, again using GNU C labels-as-values. Thistechnique was first documented
earlier [45], but Piumarta’s independent discovery inspired many other projects to exploit se-
lective inlining. Like us, he applied his optimization to OCaml, and reports significant speedup
on several micro benchmarks. As we discuss in Section 4.3, our technique is separate from,
but supports and indeed facilitates, inlining optimizations.
Languages, like Java, that require run-time binding complicate the implementation of se-
lective inlining significantly because at load time little is known about the arguments of many
virtual instructions. When a Java method is first loaded some arguments are left unresolved.
For instance, the argument of aninvokevirtual instruction will initially point to a string
naming the callee. The first time the virtual instruction executes the argument will be re-written
to point to a descriptor of the now resolved callee. At the same time, the virtual opcode is
rewritten so that subsequently a “quick” form of the virtualinstruction body executes. In Java,
if resolution fails, the instruction throws an exception. The process of rewriting the arguments
and especially the need to point to a new virtual instructionbody, complicates superinstruction
RCSfile : background − related.lyx, v Revision : 1.23 23
2.1. INTERPRETER DISPATCH
formation. Gagnon describes a technique that deals with this additional complexity which he
implemented in SableVM [23].
Only certain classes of opcode bodies can be relocated usingmemcpy alone—the body
must contain no pc-relative instructions (typically this excludes C function calls). Selective
inlining requires that the superinstruction starts at a virtual basic block, and ends at or before
the end of the block. Ertl’sdynamic superinstructions[19] also usememcpy, but are applied
to effect a simple native compilation by inlining bodies fornearly every virtual instruction.
Ertl shows how to avoid the virtual basic block constraints,so dispatch to interpreter code is
only required for virtual branches and unrelocatable bodies. Vitale and Abdelrahman describe
a technique called catenation, which patches Sparc native code so that all implementations can
be moved, specializes operands, and converts virtual branches to native, thereby eliminating
the virtual program counter [55].
Replication— creating multiple copies of the opcode body—decreases thenumber of con-
texts in which it is executed, and hence increases the chances of successfully predicting the
successor [19]. Replication implemented by inlining opcodebodies reduces the number of
dispatches, and therefore, the average dispatch overhead [40]. In the extreme, one could cre-
ate a copy for each instruction, eliminating mispredictionentirely. This technique results in
significant code growth, which may [55] or may not [19] cause cache misses.
In summary, misprediction of the indirect branches used by adirect threaded interpreter
to dispatch virtual instructions limits its performance onmodern CPUs because of the context
problem. We have described several recent dispatch optimization techniques. Some of the
techniques improve performance of each dispatch by reducing the number of contexts in which
a body is executed. Others reduce the number of dispatches, possibly to zero.
RCSfile : background − related.lyx, v Revision : 1.23 24

CHAPTER 2. BACKGROUND AND RELATED WORK
2.2 Dynamic Hardware Branch Prediction
In Section 3.1 we will describe dispatch optimizations thatare effective because they better use
the dynamic hardware branch predictor resources present onmodern processors. As discussed
in Section 2.1.4, a direct threaded interpreter presents anunusual workload which confounds
indirect branch predictors. The primary mechanism used to predict indirect branches on mod-
ern computers is thebranch target buffer(BTB). The BTB is a memory that associates the des-
tination of a branch with its address [26]. The Pentium IV implements a 4K entry BTB [28].
(There is no mention of a BTB in the PowerPC 970 programmers manual [30].) Direct thread-
ing confounds the BTB because all instances of a given virtualinstruction compete for the same
BTB slot. The performance impact of this can be hard to predict. For instance, if a tight loop
of the virtual program happens to contain a sequence of unique virtual instructions then the
BTB may successfully predict each one. On the other hand, if the sequence contains duplicate
virtual instructions, like the pair ofiload instructions in Figure 2.3, the BTB may mispredict
all of them.
Another kind of dynamic branch predictor is used for conditional branch instructions. Con-
ditional branches are relative, or direct, branches so there are only two possible destinations.
The challenge lies in predicting whether the branch will be taken or fall through. For this pur-
pose modern processors implement abranch history table. The PowerPC 7410, as an example,
deploys a 2048 entry 2 bit branch history table [35]. Direct threading also confounds the branch
history table as all the instances of each conditional branch virtual instruction compete for the
same branch history table entry. This will be discussed in more detail in Section 3.1.3.
Return instructions can be predicted perfectly using a stackof addresses pushed by call
instructions. The Pentium IV has a 16 entryreturn address stack[28] whereas the PPC970
uses a similar structure called thelink stack[30].
RCSfile : background − related.lyx, v Revision : 1.23 25
2.3. TRACES
2.3 Traces
We usetrace to describe an interprocedural path through a program. The term has been used
in several different contexts. The application of the term that doesnot concern our work and
yet is potentially confusing is by the Multiflow compiler [34, 21] which performs instruction
scheduling on traces of instructions.
The Pentium 4 processor refers to its level 1 instruction cache as an “Execution Trace
Cache” [28]. The concept of storing traces in a hardware instruction cache to maximize use
of instruction fetch bandwidth is discussed by Rotenberg andBennett in [46]. Optimization
techniques such as the “Software Trace Cache” reorder code toachieve a similar result [42].
2.3.1 HP Dynamo
HP Dynamo [2, 16, 1] is a system for trace-based runtime optimization of statically optimized
binary code. Dynamo initially interprets a binary executable program, detecting interprocedu-
ral paths, ortraces, through the program as it runs. These traces are then optimized and loaded
into atrace cache. Subsequently, when the interpreter encounters a program location for which
a trace exists, it is dispatched from the trace cache. If execution diverges from the path taken
when the trace was generated then atrace exitoccurs, execution leaves the trace cache and
interpretation resumes. If the program follows the same path repeatedly, it will be faster to ex-
ecute code generated for the trace rather than the original code. Dynamo successfully reduced
the execution time of many important benchmarks on HP computers of it day.
Dynamo uses a simple heuristic, called Next Executing Tail (NET), to identify traces. NET
starts generating a trace from the destination of a hot reverse branch, since this location is likely
to be the head of a loop, and hence a hot region of the program islikely to follow. If a given
trace exit becomes hot, a new trace is generated starting from its destination.
Software trace caches are efficient structures for dynamic optimization. Bruening and
Duesterwald [6] compare execution time coverage and code size for three dynamic optimiza-
RCSfile : background − related.lyx, v Revision : 1.23 26

CHAPTER 2. BACKGROUND AND RELATED WORK
c1a
c1b
callsite1 library code
call glue
return gluelibrary code
call guard
return guard
c1a
c1b
trace1
(a)
(b)
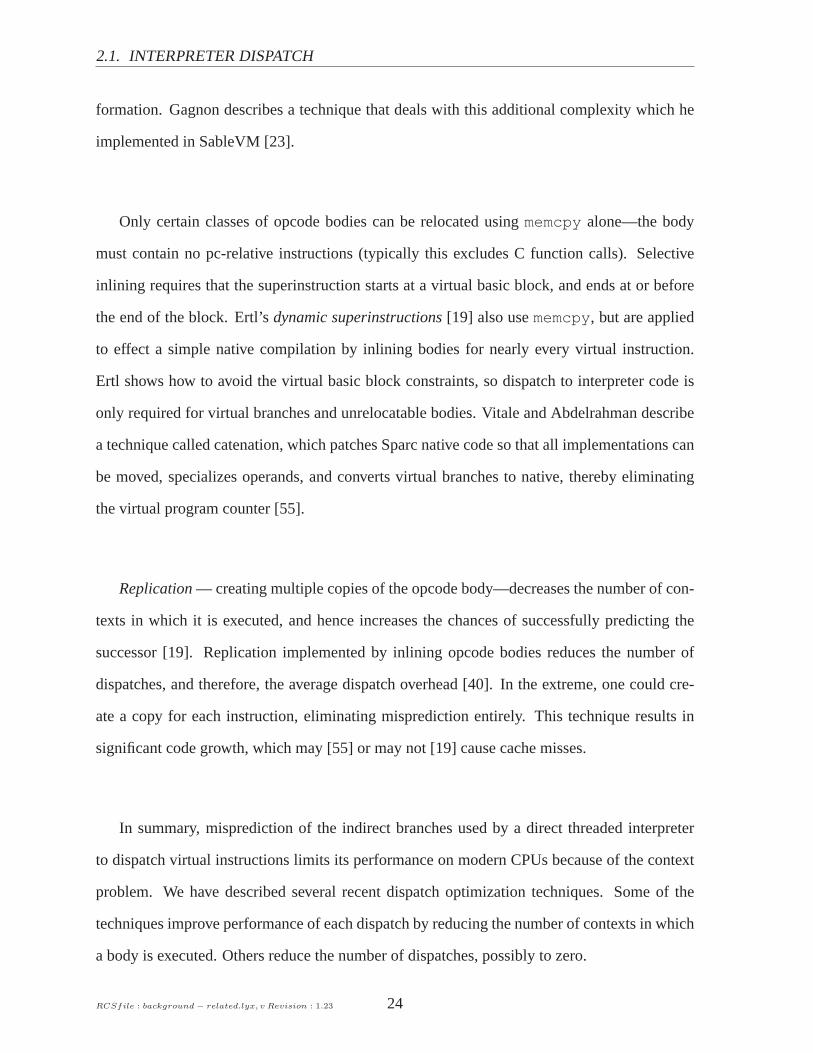
Figure 2.5: A simple dynamically loaded callee (a) requiresan indirect branch whereas trace
code (b) guards with conditional branches.
tion units: method bodies, loop bodies, and traces. They show that method bodies require
significantly more code size to capture an equivalent amountof execution time than either
traces or loop bodies. This result, together with the properties outlined in Section 1.3, suggest
that traces are a desirable execution unit for our gradually-extensible interpreter.
As part of trace generation Dynamo reverses the sense of conditional branches so the path
along the trace sees onlynot takenconditional branches. This is significant because, subse-
quently, when the trace is dispatched, all the frequently executed conditional branches are not
taken, which is the sense that many static CPU branch prediction schemes [57] assume will
be taken for forward branches. On HP hardware of the day this may have led to better use of
the skimpy, by today’s standards, branch prediction resources available. In addition to better
branch prediction, the traces should promote better use of the instruction cache prefetch band-
width. Since we expect that fewer conditional branches are being taken by the traces, we should
also expect that the portions of instruction cache lines following the conditional branches will
be used more effectively. The Dynamo team did not report micro-architectural data to explain
exactly why Dynamo obtained the speed-ups it did.
RCSfile : background − related.lyx, v Revision : 1.23 27

2.3. TRACES
Calls and Returns
Over an above making better use of the micro-architecture Dynamo can perform optimistic
dynamic optimizations. A good example is its treatment of external calls and returns to shared
library routines. The Hewlett-Packard PA-8000, in the spirit of its RISC architecture, does
not offer complex call and return instructions. A callsite to a shared routine first branches to
a small chunk of glue code written by the static linker. The glue code loads the destination
of the shared code from a data location that was mapped by the static linker and initialized
by the dynamic loader. An indirect branch then transfers control to that location. When glue
code is encountered during trace generation it is optimizedin a similar spirit to conditional
branches but also with the flavor of inlining. Figure 2.5 (a) illustrates the original extern call
and (b) shows how it is trace generated. The indirect branch is replaced by a conditional
trace exit. The call guard in the figure is in fact a conditional branch comparing the target of
the indirect branch to the original destination observed during trace generation [59]. That is,
instead of using the destination loaded by the loader glue code as input to an indirect branch,
Dynamo uses it to check that the trace contains the right copyof the destination. As before, the
conditional branch is arranged so that it is not taken when control remains in the trace. Hence
the technique straightens the glue code and replaces an expensive, taken, indirect branch with
a cheaper, not-taken conditional branch, as well as inlinesthe callee code. Returns are handled
essentially the same way. If the destination of the shared code were to be changed by some
action of the dynamic loader, the guard code would detect that this does not correspond to the
code that was earlier inlined into the trace, and the trace would exit.
The callsite of a C++ virtual function or a regular C function pointer will also start out as an
indirect call and be trace generated in a similar way. If a C++ virtual function callsite turns out
to be effectively polymorphic, then the destination encountered during trace generation will be
inlined into the initial trace. As overrides of the virtual method are encountered, the trace exit
guarding the inlined code will fail. Eventually one of them will become hot, and a new trace
will be generated from its entry point. Each time this occurs, Dynamo inserts the address of
RCSfile : background − related.lyx, v Revision : 1.23 28

CHAPTER 2. BACKGROUND AND RELATED WORK
the new trace into a hash table specific to the callsite keyed by the address in the originating
code. Then, when a trace exit occurs resulting from an indirect branch, Dynamo can find the
destination trace by looking up the originating destination in the hash table.
This technique provides a simple mechanism for dynamic optimizers to generate specula-
tive optimizations. In the examples we have just described code generated in the trace specu-
lates that the destination of a shared library call remains constant. However, the technique is
general and could be used for various speculations. In Sections 5.6.3 and 5.7 we will discuss
variations of the technique for virtual method invocation and optimizing polymorphic virtual
instructions.
Cache Management
Caches, in general, hold recently used items, which means that that older, unused items are
at some point removed or replaced. The management of a high-performance trace cache can
be very complex [25]. Given that Dynamo can always fall back on interpretation it has a very
simple option. When its trace cache becomes full, Dynamo flushes the entire cache and starts
afresh. Dynamo calls this approachreactive flushing. The hope is that some of the (older)
fragments are no longer part of the current working set of theprogram and so if all fragments
are discarded the actual working set will fit into the cache. Though Dynamo deployed the
technique to manage trace cache space (according to the technical report [1], the overhead of
normal cache management becomes much higher if garbage collection or some other adaptive
mechanism is used) it might also be an interesting way of repairing speculative optimizations
that turned out to be incorrect or perform poorly.
2.3.2 Other Trace-oriented Systems
Significant trace-oriented binary optimization systems include Microsoft’s Mojo [10], Trans-
meta’s CMS [14] and many others.
RCSfile : background − related.lyx, v Revision : 1.23 29

2.3. TRACES
DynamoRIO
Bruening describes a new version of Dynamo which runs on the Intel x86 architecture. The
current focus of this work is to provide an efficient environment to instrument real world pro-
grams for various purposes such as improve the security of legacy applications [8, 7].
One interesting application of DynamoRIO was by Sullivan et al [51]. They ran their
own tiny interpreter on top of DynamoRIO in the hope that it would be able to dynamically
optimize away a significant proportion of interpretation overhead. They did not initially see
the results they were hoping for because the indirect dispatch branches confounded Dynamo’s
trace selection. They responded by creating a small interface by which the interpreter could
programatically give DynamoRIO hints about the relationship between the virtual pc and the
hardware pc. This was essentially their way around what we have described as the context
problem (Section 2.1.4). Whereas interpretation slowed down by almost two using regular
DynamoRIO after they had inserted calls to the hint API they saw speedups of about 20% on
a set of small benchmarks. Baron [3] reports similar performance results running a similarly
modified Kaffe JVM [58].
Hotpath
Gal, Probst and Franz describe the Hotpath project. Hotpathalso extends JamVM (one of
the interpreters we use for our experiments) to be a trace oriented mixed-mode system [24].
Their profiling system, similar to those used by many method based JIT compilers, is loosely
coupled with the interpreter. They focus on traces startingat loop headers and do not compile
traces not in loops. Thus, they do not attempt trace linking as described by Dynamo, but rather
“merge” traces that originate from side exits leading back to loop headers. This technique
allows Hotpath to compile loop nests. They describe an interesting way of modeling traces
using Single Static Assignment (SSA) [13] that exploits theconstrained flow of control present
in traces. This both simplifies their construction of SSA andallows very efficient optimization.
Their experimental results show excellent speedup, withina factor of two of Sun’s HotSpot,
RCSfile : background − related.lyx, v Revision : 1.23 30
CHAPTER 2. BACKGROUND AND RELATED WORK
for scientific style loop nests like those in benchmarks likeLU, SOR and Linpack, and more
modest speedup, around a factor of two over interpretation,for FFT. No results are given for
tests in the SPECjvm98 suite, perhaps because their system does not yet support “trace merging
across (inlined) method invocations” [24] pp. 151. The optimization techniques they describe
seem complimentary to the overall architecture we propose in Chapter 5.
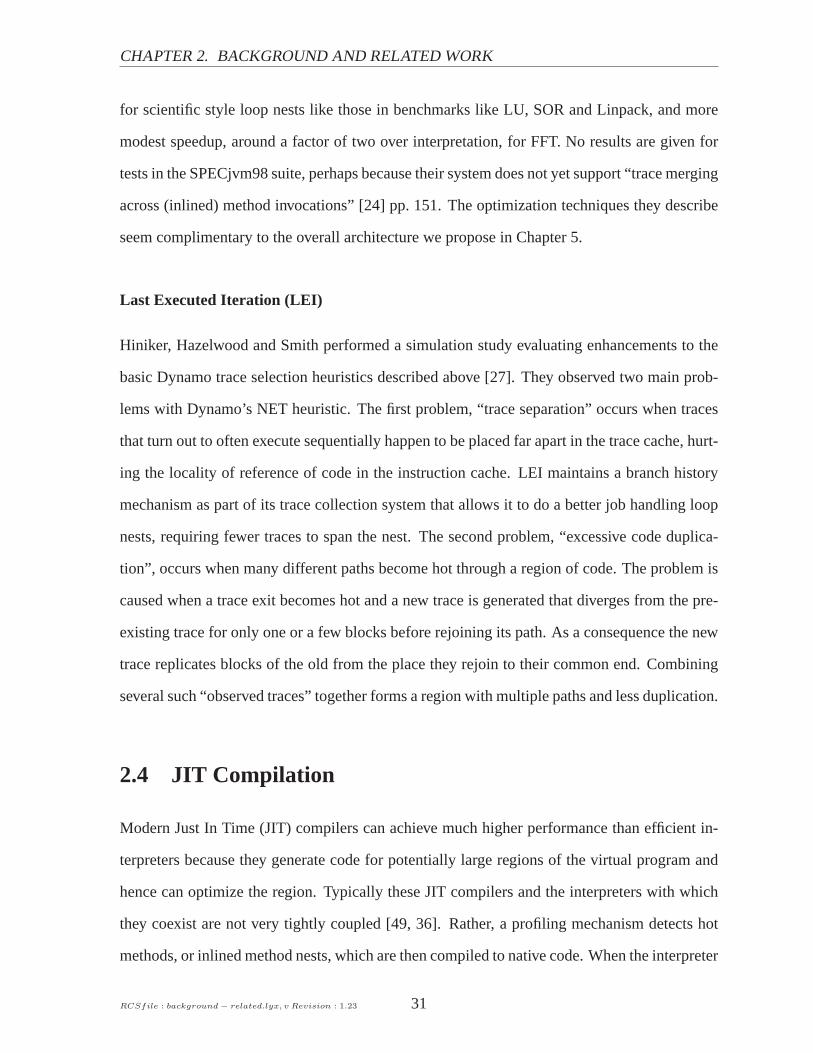
Last Executed Iteration (LEI)
Hiniker, Hazelwood and Smith performed a simulation study evaluating enhancements to the
basic Dynamo trace selection heuristics described above [27]. They observed two main prob-
lems with Dynamo’s NET heuristic. The first problem, “trace separation” occurs when traces
that turn out to often execute sequentially happen to be placed far apart in the trace cache, hurt-
ing the locality of reference of code in the instruction cache. LEI maintains a branch history
mechanism as part of its trace collection system that allowsit to do a better job handling loop
nests, requiring fewer traces to span the nest. The second problem, “excessive code duplica-
tion”, occurs when many different paths become hot through aregion of code. The problem is
caused when a trace exit becomes hot and a new trace is generated that diverges from the pre-
existing trace for only one or a few blocks before rejoining its path. As a consequence the new
trace replicates blocks of the old from the place they rejointo their common end. Combining
several such “observed traces” together forms a region withmultiple paths and less duplication.
2.4 JIT Compilation
Modern Just In Time (JIT) compilers can achieve much higher performance than efficient in-
terpreters because they generate code for potentially large regions of the virtual program and
hence can optimize the region. Typically these JIT compilers and the interpreters with which
they coexist are not very tightly coupled [49, 36]. Rather, a profiling mechanism detects hot
methods, or inlined method nests, which are then compiled tonative code. When the interpreter
RCSfile : background − related.lyx, v Revision : 1.23 31

2.4. JIT COMPILATION
next attempts to invoke a method which has been compiled, thenative code is dispatched in-
stead. Although JIT compilation of entire methods has been proven in practice, it nevertheless
has a few limitations. First, some of the code in a compiled method may be cold and will never
be executed. Compiling this code can have only indirect benefits, such as proving facts about
the portions of the method thatare hot. Second, some of the code in a method may not have
executed yet when the method is first compiled, even though itwill become hot later. In this
case the JIT compiler has no profiling data to work with when itcompiles the cold code and
hence cannot optimize as effectively.
Another challenge raised by cold code is caused by late binding. Java, as well as many
other modern languages binds many external references late. In an interpreter this can be
relatively simply handled by rewriting unresolved arguments in the DTT with the resolved
version after the instruction has run the first time. In native code the equivalent process requires
code rewriting. This, in turn adds significant complexity because multiple threads may be
racing to rewrite the instruction [52].
JIT compilers perform many of the same optimizations performed by static compilers, in-
cluding method inlining and data flow analysis, both of whichcan be hindered by methods that
contain large amounts of cold code, as observed by Suganuma et al. [50]. To deal with the prob-
lem, they modify a method-based JIT to allow selected regions within a method to be inlined,
and rely onon stack replacement[29] and recompilation to recover if a non-inlined part of a
method is executed. Although avoiding cold code reduced compilation overhead significantly,
only modest overall performance gains were realized.
A JIT compiler can also perform optimizations that require information obtained from a
running program. A classic example addresses virtual method invocation, which is expensive
at least in part because the destination depends on a data dependency, namely the class of the
invoked-upon object. Polymorphic method invocation has been heavily studied and it is well
known that in most programs most polymorphic callsites areeffectively monomorphic, which
means that at run time the invoked-upon object always turns out to have the same type, and
RCSfile : background − related.lyx, v Revision : 1.23 32

CHAPTER 2. BACKGROUND AND RELATED WORK
hence the same callee is invoked all or most of the time [15]. Self [53] pioneered the dynamic
optimization of virtual dispatch, an optimization that hasgreat impact on the performance of
Java programs today. With profile information, a JIT compiler can transform a virtual method
dispatch to a relatively cheap check of the class of the invoked-upon object followed by the
inlined code of the callee. If the callsite continues to be monomorphic the check succeeds
and the inlined code executes. If, on the other hand, the check fails, a relatively slow virtual
dispatch must take place. Hölzle [29] describes how a polymorphic inline cache (PIC) can deal
with an effectively polymorphic callsite which has a few hotdestinations.
A problem faced by all profile-driven dynamic compilers, butespecially by those that com-
pile code code, is that assumptions made when code is compiled may turn out to be wrong
leading to incorrect code or code that performs less well than if had been compiled under dif-
ferent assumptions. For instance, Pechtchanski and Sarkardescribe a speculative scheme by
which their compiler assumes that a method for which there isonly one loaded definition will
never be overridden. Later, if the loader loads a class that defines another definition of the
method the original code is incorrect and must not be run again. In this case the entire en-
closing method (or inlined method nest) must be recompiled under more realistic assumptions
and the original compilation discarded [37]. Similar recompilation events are caused when the
original code is not wrong but slower than it could be.
The infrastructure to replace a method is called On Stack Replacement (OSR) and is a
fundamental requirement of speculative optimizations in method-oriented dynamic compilers.
Fink and Qian [22] show how to restrict method-based optimization so that OSR is always
possible. The key issue is that values that may be dead code under traditional optimization
schemes must be kept alive in order a less aggressively optimized replacement method to com-
plete calculations started by the invalidated code.
RCSfile : background − related.lyx, v Revision : 1.23 33

2.4. JIT COMPILATION
RCSfile : background − related.lyx, v Revision : 1.23 34

Chapter 3
Efficient Interpretation
Our goal is to design and build a virtual machine that can be gradually extended from interpre-
tation to mixed-mode execution. At the beginning of their lifetime we expect most languages
to rely on pure interpretation and so its performance is important.
3.1 Design and Implementation
Direct-threaded interpreters are known to have very poor branch prediction properties, how-
ever, they are also known to have a small cache footprint (forsmall to medium sized opcode
bodies) [44]. Since both branches and cache misses are majorpipeline hazards, we would like
to retain the good cache behavior of direct-threaded interpreters while improving the branch
behavior. The preceding chapter describes various techniques for improving branch prediction
by replicating entire bodies. The effect of these techniques is to trade instruction cache size for
better branch prediction. We believe it is best to avoid growing code if possible. We introduce
a new technique which minimally affects code size and produces dramatically fewer branch
mispredictions than either direct threading or direct threading with inlining.
35
3.1. DESIGN AND IMPLEMENTATION
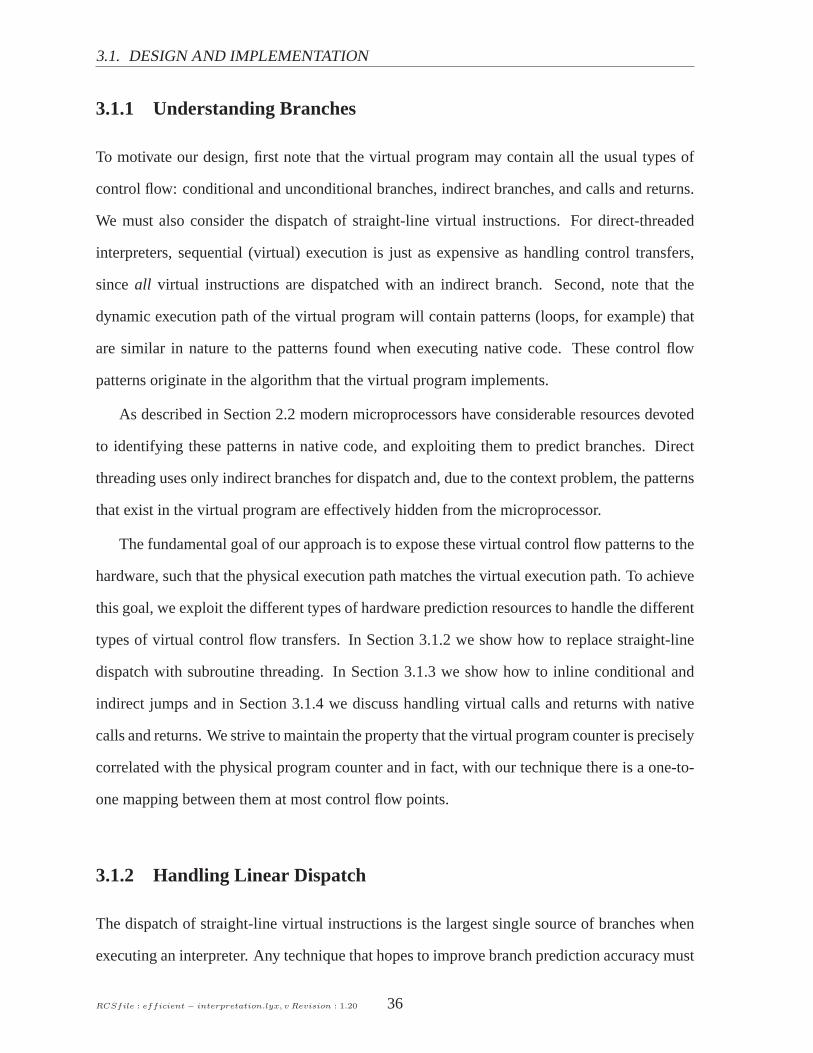
3.1.1 Understanding Branches
To motivate our design, first note that the virtual program may contain all the usual types of
control flow: conditional and unconditional branches, indirect branches, and calls and returns.
We must also consider the dispatch of straight-line virtualinstructions. For direct-threaded
interpreters, sequential (virtual) execution is just as expensive as handling control transfers,
sinceall virtual instructions are dispatched with an indirect branch. Second, note that the
dynamic execution path of the virtual program will contain patterns (loops, for example) that
are similar in nature to the patterns found when executing native code. These control flow
patterns originate in the algorithm that the virtual program implements.
As described in Section 2.2 modern microprocessors have considerable resources devoted
to identifying these patterns in native code, and exploiting them to predict branches. Direct
threading uses only indirect branches for dispatch and, dueto the context problem, the patterns
that exist in the virtual program are effectively hidden from the microprocessor.
The fundamental goal of our approach is to expose these virtual control flow patterns to the
hardware, such that the physical execution path matches thevirtual execution path. To achieve
this goal, we exploit the different types of hardware prediction resources to handle the different
types of virtual control flow transfers. In Section 3.1.2 we show how to replace straight-line
dispatch with subroutine threading. In Section 3.1.3 we show how to inline conditional and
indirect jumps and in Section 3.1.4 we discuss handling virtual calls and returns with native
calls and returns. We strive to maintain the property that the virtual program counter is precisely
correlated with the physical program counter and in fact, with our technique there is a one-to-
one mapping between them at most control flow points.
3.1.2 Handling Linear Dispatch
The dispatch of straight-line virtual instructions is the largest single source of branches when
executing an interpreter. Any technique that hopes to improve branch prediction accuracy must
RCSfile : efficient − interpretation.lyx, v Revision : 1.20 36

CHAPTER 3. EFFICIENT INTERPRETATION
vPC1: &ctt[0]
a
3: &ctt[1]
b
5: &ctt[2]
1
7: &ctt[3]
8: &ctt[4]
9: &ctt[5]
c
call iload
call iload
call iconst
call iadd
call iadd
call istore
DTT
CTTinterp(){ void iload(){ //push var.. vPC++; }
void iconst(){ //push constant vPC++; }
void iadd(){ //add 2 slots} void istore(){ //pop, store var}
Virtual Instruction Bodies
loaded data generated code
Figure 3.1: Subroutine Threaded Interpreter showing how the CTT contains one generated di-
rect call instruction for each virtual instruction and how the first entry in the DTT corresponding
to each virtual instruction points to generated code to dispatch it.
interp(){
iload: //push var.. asm volatile("ret"); goto *vPC++;
iconst: //push constant
asm volatile("ret"); goto *vPC++;
}
Virtual Instruction Bodies
Figure 3.2: Direct threaded bodies retrofitted as callable routines by inserting inline assembler
ret on Pentium.
RCSfile : efficient − interpretation.lyx, v Revision : 1.20 37

3.1. DESIGN AND IMPLEMENTATION
address straight-line dispatch. An obvious solution is inlining, as it eliminates the dispatch
entirely for straight-line sequences of virtual instructions. The increase in code size caused
by aggressive inlining, however, has the potential to overwhelm the benefits with the cost of
increased instruction cache misses [55].
Rather than eliminate dispatch, we propose an alternative organization for the interpreter
in which native call and return instructions are used. Conceptually, this approach is elegant
because subroutines are a natural unit of abstraction to express the implementations of virtual
instructions.
Figure 3.1 illustrates our implementation of subroutine threading, using the same example
program as Figure 2.3. In this case, we show the state of the virtual machineafter the first
virtual instruction has been executed. We add a new structure to the interpreter architecture,
called theContext Threading Table(CTT), which contains a sequence of nativecall instruc-
tions. Each nativecall dispatches the body for its virtual instruction. We use the termContext
Threading, because the hardware address of each call instruction in the CTT provides execution
context to the hardware, most importantly, to the branch predictors.
Although Figure 3.1 shows each body as a nested function, in fact we simulate this by
ending each non-branching opcode body with a nativereturn instruction as shown in Figure 3.2.
The Direct Threading Table (DTT) is still necessary to storeimmediate virtual operands, and
to correctly resolve virtual control transfer instructions. In direct threading, entries in the DTT
point to opcode bodies, whereas in subroutine threading they refer to call sites in the CTT.
It seems counterintuitive to improve dispatch performanceby calling each body. It is not
obvious whether a call to a constant target is more or less expensive to execute than an indirect
jump, but that is not the issue. Modern microprocessors contain specialized hardware to im-
prove the performance ofcall andreturn— specifically, a return address stack that predicts the
destination of the return to be the instruction following the corresponding call. Although the
cost of subroutine threading is two control transfers, versus one for direct threading, this cost
is outweighed by the benefit of eliminating a large source of unpredictable branches.
RCSfile : efficient − interpretation.lyx, v Revision : 1.20 38

CHAPTER 3. EFFICIENT INTERPRETATION
3.1.3 Handling Virtual Branches
Subroutine threading handles the branches that are inducedby the dispatch of straight-line
virtual instructions, however, the actual control flow of the virtual program is still hidden from
the hardware. That is, bodies of opcodes that affect the virtual control flow still have no context.
There are two problems, one relating to shared indirect branch prediction resources, and one
relating to a lack of history context for conditional branchprediction resources.
Figure 3.3 introduces another Java example, this time including a virtual branch. Consider
the implementation ofifeq, marked (a) in the figure. Even for this simple virtual branch,
prediction is problematic, becauseall instances ofifeq instructions in the virtual program
share a single indirect branch instruction (and hence have asingle prediction context). A
simple solution is to generate replicas of the indirect branch instruction in the CTT immediately
following the call to the branching opcode body. Branching opcode bodies now end with native
return, which transfers control to the replicated indirectbranch in the CTT. As a consequence,
each virtual branch instruction now has its own hardware context. We refer to this technique
asbranch replication. Figure 3.4 illustrates how branch replication works.
Branch replication is attractive because it is simple and produces the desired context with
a minimum of replicated instructions. However, it has a number of drawbacks. First, for
branching opcodes, we execute three hardware control transfers (a call to the body, a return,
and the actual branch), which is an unnecessary overhead. Second, we still use the overly
general indirect branch instruction, even in cases likegoto where we would prefer a simpler
direct native branch. Third, by only replicating the dispatch part of the virtual instruction,
we do not take full advantage of the conditional branch predictor resources provided by the
hardware. Due to these limitations, we only use branch replication for indirect virtual branches
and exceptions1.
For all other branches we fully inline the bodies of virtual branch instructions into the CTT.
1Ocaml defines explicit exception virtual instructions
RCSfile : efficient − interpretation.lyx, v Revision : 1.20 39

3.1. DESIGN AND IMPLEMENTATION
(a)
boolean isOne(int); Code: 0: iload_1 1: ifeq 6 4: iconst_1 5: ireturn 6: iconst_0 7: ireturn
{ boolean isOne(int p1){ if ( p1!=0 ){ return true; }else{ return false; }}
Java source
Java Bytecode
call iload_1
call ifeq
call iconst_1
call ireturn
call iconst_0
call ireturn
CTT
interp(){ iload_1: //push local 1 vPC++; asm ("ret")
ifeq: if ( *sp ) vPC = *vPC; else vPC++; goto *vPC++;
iconst_1: //push 1iconst_0 //push 0
ireturn: //vPC = return goto *vPC;
}
virtual instruction bodiesgenerated code
vPC
0: &ctt[0]
1: &ctt[1]
6
3: &ctt[2]
4: &ctt[3]
5: &ctt[4]
6: &ctt[5]
DTT
loaded data
Figure 3.3: Subroutine Threading does not not address branch instructions. Unlike straight
line virtual instructions virtual branch bodies end with anindirect branch destination (just like
direct threading).
RCSfile : efficient − interpretation.lyx, v Revision : 1.20 40

CHAPTER 3. EFFICIENT INTERPRETATION
(a)
(b)
CTT
interp(){ iload_1: //push local 1 vPC++; asm ("ret")
ifeq: if ( *sp ) vPC = *vPC; else vPC++; asm ("ret")
iconst_1: //push 1iconst_0 //push 0
ireturn: //vPC = return asm("ret");
}
generated code
vPC
&ctt[0]
&ctt[1]
6
&ctt[2]
&ctt[3]
&ctt[4]
&ctt[5]
DTT
loaded data virtual instruction bodies
call iload_1
call ifeq
jmp (%vPC)
call iconst_1
call ireturn
jmp (%vPC)
call iconst_0
call ireturn
jmp (%vPC)
Figure 3.4: Context threading with branch replication illustrating the “replicated” indirect
branch in the CTT. The fact that the indirect branch corresponds to only one virtual instruction
gives it better prediction context. The heavy arrow from (a)to (b) is followed when the virtual
branch is taken.
RCSfile : efficient − interpretation.lyx, v Revision : 1.20 41

3.1. DESIGN AND IMPLEMENTATION
We refer to this asbranch inlining. In the process of inlining, we convert indirect branches
into direct branches, where possible. On the Pentium this reduces pressure on the branch taken
buffer, or BTB, since it instead exploits the conditional branch predictors. The virtual condi-
tional branches now appear as real conditional branches to the hardware. The primary cost of
branch inlining is increased code size, but this is modest because virtual branch instructions are
simple and have small bodies. For instance, on the Pentium IV, most branch instructions can
be inlined with no more than 10 words of additional space. Figure 3.5 shows an example of
inlining theifeq branch instruction. The machine code, shaded in the figure, implements the
same if-then-else logic as the original direct threaded virtual instruction body. In the figure we
assume key interpreter variables like the virtual PC and expression stack pointer exist in dedi-
cated registers. This is the technique used in Ocaml on both the Pentium 4 and the PowerPC,
and SableVM on the PowerPC, but not for SableVM on the Pentium,where they are stored in
stack slots instead. We use Intel instructions in the figure but similar code must be generated on
the PowerPC. The generated code no longer uses an indirect branch and the inlined conditional
branch instruction (jne, marked (a) in the figure) is fully exposed to the Pentium’s conditional
branch prediction hardware.
An obvious challenge with branch inlining is that the generated code is not portable and
assumes detailed knowledge of the virtual bodies it must interoperate with. For instance, in
Figure 3.5 the generated code must know that the Pentium’s%esi register has been dedicated
to thevPC.
3.1.4 Handling Virtual Call and Return
The only significant source of control transfers that remainin the virtual program are virtual
calls and returns. For successful branch prediction, the real problem is not the virtual call, but
rather the virtual return, because one virtual return may goback to multiple call sites. As noted
previously, the hardware already has an elegant solution tothis problem for native code in the
form of the return address stack. We need only to deploy this resource to predict virtual returns.
RCSfile : efficient − interpretation.lyx, v Revision : 1.20 42

CHAPTER 3. EFFICIENT INTERPRETATION
(a)
(b)
CTT
generated code
vPC
&ctt[0]
&ctt[1]
6
&ctt[2]
&ctt[3]
&ctt[4]
&ctt[5]
DTT
loaded data
interp(){ iload_1: //push local 1 vPC++; asm ("ret")
iconst_1:
iconst_0
ireturn: //vPC = return asm("ret");
}
virtual instruction bodies
call iconst_1
call ireturn
goto *vPC
call iconst_0
call ireturn
goto *vPC
call iload_1subl $4, %edi
movl (%edi), %eax
cmpl $0, %eax
jne nt
movl (%esi), %esi
jmp cttdest
nt: addl $4, %esi
Figure 3.5: Context Threaded VM Interpreter: Branch Inliningon Pentium. The generated
code (shaded) assumes thevPC is in register%esi and the Java expression stack pointer is in
register%edi. The dashed arrow (a) illustrates the inlined conditional branch instruction, now
fully exposed to the branch prediction hardware, and the heavy arrow (b) illustrates a direct
branch implementing the taken path.
We describe our solution with reference to Figure 3.6. The virtual call body should effect
a transfer of control to the start of the callee. We begin at a virtual call instruction (see label
“(a)” in the figure). The virtual call body simply sets thevPC to the entry point of the callee
and executes a nativereturn to the next CTT location. Similar to branch replication, we insert
a new nativecall indirect instruction following “(a)” in the CTT to transfer control tothe
start of the callee (solid arrow from “(a)” to “(b)” in the figure). The call indirect causes the
next location in the CTT to be pushed onto the hardware’s return address stack. The first
instruction of the callee is then dispatched. At the end of the callee, we modify the virtual
return instruction as follows. In the CTT, we emit a native directbranchto dispatch the body
of the virtual return (before label “(b)”.) Unlike using a native call for this dispatch, the direct
RCSfile : efficient − interpretation.lyx, v Revision : 1.20 43

3.1. DESIGN AND IMPLEMENTATION
call invokestatic
call (*vPC)
jmp return
ret
CTT
interp(){ invokestatic: //build frame vPC = *vPC; asm ("ret")
return: //pop frame vPC = return asm( "ret");
}
virtual instruction bodiesgenerated code
vPC
&ctt[0]
&ctt[callee]
DTT
loaded data
(a)
(b)
caller
callee
Figure 3.6: Context Threading Apply-Return Inlining on Pentium. The generated codecalls
invokestatic but jumps(instruction at (b) is ajmp) to the return .
branch avoids perturbing the return address stack. We modify the body of the virtual return
to end with a nativereturn instruction, which now transfers control all the way back tothe
instruction following the original virtual call (dotted arrow from “(b)” to “(a)”.) We refer to
this technique asapply/return inlining2.
With this final step, we have a complete technique that alignsall virtual program control
flow with the corresponding native flow. There are however, some practical challenges to
implementing our design for apply/return inlining. First,one must take care to match the
hardware stack against the virtual program stack. For instance, in OCaml, exceptions unwind
the virtual machine stack; the hardware stack must be unwound in a corresponding manner.
Second, some run-time environments are extremely sensitive to hardware stack manipulations,
since they use or modify the machine stack pointer for their own purposes (such as handling
signals). In such cases, it is possible to create a separate stack structure and swap between the
two at virtual call and return points. This approach would introduce significant overhead, and
2“apply” is the name of the (generalized) function call opcode in OCaml where we first implemented thetechnique.
RCSfile : efficient − interpretation.lyx, v Revision : 1.20 44

CHAPTER 3. EFFICIENT INTERPRETATION
is only justified if apply/return inlining provides a substantial performance benefit.
Having described our design and its general implementation, we now evaluate its effective-
ness on real interpreters.
RCSfile : efficient − interpretation.lyx, v Revision : 1.20 45

3.1. DESIGN AND IMPLEMENTATION
RCSfile : efficient − interpretation.lyx, v Revision : 1.20 46
Chapter 4
Evaluation
In this section, we evaluate the performance of context threading and compare it to direct
threading and direct-threaded selective inlining. Contextthreading combines subroutine thread-
ing, branch inlining and apply/return inlining. We evaluate the contribution of each of these
techniques to the overall impact of context threading usingtwo virtual machines and three
microprocessor architectures. We begin by describing our experimental setup in Section 4.1.
We then investigate how effectively our techniques addresspipeline branch hazards in Sec-
tion 4.2.1, and the overall effect on execution time in Section 4.2.2. Finally, Section 4.3
demonstrates that context threading is complementary to inlining resulting in a portable, rel-
atively simple, technique that provides performance comparable to or better than SableVM’s
implementation of selective inlining.
4.1 Virtual Machines, Benchmarks and Platforms
We evaluated our techniques by modifying interpreters for Java and Ocaml to run on Pentium
IV, PowerPC 7410 and PPC970.
47

4.1. VIRTUAL MACHINES, BENCHMARKS AND PLATFORMS
Table 4.1: Description of OCaml benchmarks
Pentium IV PowerPC 7410 PPC970 Lines
Branch Branch Elapsed of
Time Mispredicts Time Stalls Time Source
Benchmark Description (TSC*108) (MPT*106) (Cycles*108) (Cycles*106) (sec) Code
boyer Boyer theorem prover 3.34 7.21 1.8 43.9 0.18 903
fft Fast Fourier transform 31.9 52.0 18.1 506 1.43 187
fib Fibonacci by recursion 2.12 3.03 2.0 64.7 0.19 23
genlex A lexer generator 1.90 3.62 1.6 27.1 0.11 2682
kb A knowledge base program 17.9 42.9 9.5 283 0.96 611
nucleic nucleic acid’s structure 14.3 19.9 95.2 2660 6.24 3231
quicksort Quicksort 9.94 20.1 7.2 264 0.70 91
sieve Sieve of Eratosthenes 3.04 1.90 2.7 39.0 0.16 55
soli A classic peg game 7.00 16.2 4.0 158 0.47 110
takc Takeuchi function (curried) 4.25 7.66 3.3 114 0.33 22
taku Takeuchi function (tuplified) 7.24 15.7 5.1 183 0.52 21
4.1.1 OCaml
We chose OCaml as representative of a class of efficient, stack-based interpreters that use
direct-threaded dispatch. The bytecode bodies of the interpreter are very efficient, and have
been hand-tuned, including register allocation. The implementation of the OCaml interpreter
is clean and easy to modify.
4.1.2 SableVM
SableVM is a Java Virtual Machine built for quick interpretation, implementing lazy method
loading and a novel bi-directional virtual function lookuptable. Hardware signals are used
to handle exceptions. Most importantly for our purposes, SableVM already implements mul-
tiple dispatch mechanisms, including switch, direct threading, and selective inlining (which
SableVM callsinline threading) [23]. The support for multiple dispatch mechanisms makes it
easy to add context threading, and allows us to compare it against a selective inlining imple-
mentation, which we believe is a more complicated technique.
RCSfile : efficient − interpretation.lyx, v Revision : 1.20 48

CHAPTER 4. EVALUATION
Table 4.2: Description of SpecJVM benchmarks
Pentium IV PowerPC 7410 PPC970
Branch Branch Elapsed
Time Mispredicts Time Stalls Time
Benchmark Description (TSC*1011) (MPT*109) (Cycles*1010) (Cycles*108) (sec)
compress Modified Lempel-Ziv compression 4.48 7.13 17.0 493 127.7
db performs multiple database functions 1.96 2.05 7.5 240 65.1
jack A Java parser generator 0.71 0.65 2.7 67 18.9
javac the Java compiler from the JDK 1.0.2 1.59 1.43 6.1 160 44.7
jess Java Expert Shell System 1.04 1.12 4.2 110 29.8
mpegaudio decompresses MPEG Layer-3 audio files 3.72 5.70 14.0 460 106.0
mtrt two thread variant of raytrace 1.06 1.04 5.3 120 26.8
raytrace a raytracer rendering 1.00 1.03 5.2 120 31.2
scimark performs FFT SOR and LU, ’large’ 4.40 6.32 18.0 690 118.1
soot java bytecode to bytecode optimizer 1.09 1.05 2.7 71 35.5
4.1.3 OCaml Benchmarks
The benchmarks in Table 4.1 constitute the complete standard OCaml benchmark suite1. Boyer,
kb, quicksort andsieve are mostly integer processing, whilenucleic andfft are
mostly floating point benchmarks.Soli is an exhaustive search algorithm that solves a soli-
taire peg game.Fib, taku, andtakc are tiny, highly-recursive programs which calculate
integer values. These three benchmarks are unusual becausethey contain very few distinct
virtual instructions, and often contain only one instance of each. These features have two
important consequences. First, the indirect branch in direct-threaded dispatch is relatively pre-
dictable. Second, even minor changes can have dramatic effects (both positive and negative)
because so few instructions contribute to the behavior.
1ftp://ftp.inria.fr/INRIA/Projects/cristal/Xavier.Leroy/benchmarks/objcaml.tar.gz
RCSfile : efficient − interpretation.lyx, v Revision : 1.20 49

4.1. VIRTUAL MACHINES, BENCHMARKS AND PLATFORMS
4.1.4 SableVM Benchmarks
SableVM experiments were run on the complete SPECjvm98 [47] suite (compress, db,
mpegaudio, raytrace, mtrt, jack, jess andjavac), one large object oriented appli-
cation (soot [54]) and one scientific application (scimark [41]). Table 4.2 summarizes the
key characteristics of these benchmarks.
4.1.5 Pentium IV Measurements
The Pentium IV (P4) processor aggressively dispatches instructions based on branch predic-
tions. As discussed in Section 2.1.4, the taken indirect branches used for direct-threaded dis-
patch are often mispredicted due to the lack of context. Ideally, we would measure the mispre-
dict penalty for these branches to see their effect on execution time, but the P4 does not have a
counter for this purpose. Instead, we count the number ofmispredicted taken branches(MPT)
to show how effectively context threading improves branch prediction. We measure time on the
P4 with the cycle-accuratetime stamp counter(TSC) register. We count both MPT and TSC
events using our own Linux kernel module, which collects complete data for the multithreaded
Java benchmarks2.
4.1.6 PowerPC Measurements
We need to characterize the cost of branches differently on the PowerPC than on the P4, as these
processors do not typically speculate on indirect branches. Instead, split branches are used (as
shown in Figure 2.4(b)) and the PPC stalls in the branch unit until the branch destination is
known. Hence, we would like to count the number of cycles stalled due to link and count
register dependencies. Fortunately, the older PPC7410 CPU has a counter (counter 15, “stall
on LR/CTR dependency”) that provides exactly this information [35]. On the PPC7410, we
2MPT events are counted with performance counter 8 by settingthe P4 CCCR to 0x0003b000 and the ESCRto value 0xc001004 [31]
RCSfile : efficient − interpretation.lyx, v Revision : 1.20 50

CHAPTER 4. EVALUATION
also use the hardware counters to obtain overall execution times in terms of clock cycles. We
expect that the branch stall penalty should be larger on moredeeply-pipelined CPUs like the
PPC970, however, we cannot directly count these stall cycleson this processor. Instead, we
report only elapsed execution time for the PPC970.
4.2 Interpreting the data
In presenting our results, we normalize all experiments to the direct threading case, since it
is the baseline state-of-the art dispatch technique. We give the absolute execution times and
branching characteristics for each benchmark and platformusing direct threading in Tables 4.1
and 4.2. Bar graphs in the following sections show the contributions of each component of
our technique: subroutine threading only (labeled SUB); subroutine threading plus branch
inlining and branch replication for exceptions and indirect branches (labeled BRANCH); and
our complete context threading implementation which includes apply/return inlining (labeled
CONTEXT. We include bars for selective inlining in SableVM (labeledSELECT) and our own
simple inlining technique (labeledTINY) to facilitate comparisons, although inlining results
are not discussed until Section 4.3. We do not show a bar for direct threading because it would
have height 1.0, by definition.
4.2.1 Effect on Pipeline Branch Hazards
Context threading was designed to align virtual program state with physical machine state to
improve branch prediction and reduce pipeline branch hazards. We begin our evaluation by
examining how well we have met this goal.
Figure 4.1 reports the extent to which context threading reduces pipeline branch hazards
for the OCaml benchmarks, while Figure 4.2 reports these results for the Java benchmarks
on SableVM. On the left of each Figure, the graphs labeled (a)present the results on the P4,
where we count mispredicted taken branches (MPT). On the right, graphs labeled (b) present
RCSfile : efficient − interpretation.lyx, v Revision : 1.20 51

4.2.IN
TE
RP
RE
TIN
GT
HE
DATA
boyer
fft
fib
genlex
kb
nucleic
quicksort
sieve
soli
takc
taku
geoMean
0.0
0.2
0.4
0.6
0.8
1.0
MPT relative to Direct
Ocam
l ben
chm
ark
SU
BB
RA
NC
HC
ON
TE
XT
TIN
Y
(a)P
entium4
boyer
fft
fib
genlex
kb
nucleic
quicksort
sieve
soli
takc
taku
geoMean
0.0
0.2
0.4
0.6
0.8
1.0
LR/CTR stall cycles Relative to Direct
OC
aml b
ench
mark
SU
BB
RA
NC
HC
ON
TE
XT
TIN
Y
(b)P
PC
7410
Figure
4.1:O
camlP
ipelineH
azardsR
elativeto
DirectT
hreading
RC
Sf
ile:
ef
fic
ien
t−
interpreta
tio
n.ly
x,v
Revis
ion
:1.20
52

CHAPTER 4. EVALUATION
com
pres
s
db jack
java
c
jess
mpe
g
mtr
t
ray
scim
ark
soot
geoM
ean
0.0
0.2
0.4
0.6
0.8
1.0M
PT
rel
ativ
e to
Dir
ect
Java benchmark
SELECTSUBBRANCHCONTEXTTINY
(a) Pentium 4
com
pres
s
db
jack
java
c
jess
mpe
g
mtr
t
rayt
race
scim
ark
soot
geoM
ean
0.0
0.2
0.4
0.6
0.8
1.0
LR
/CT
R s
tall
cycl
es R
elat
ive
to D
irec
t
Java benchmark
SELECTSUBBRANCHCONTEXTTINY
(b) PPC7410
Figure 4.2:Java Pipeline Hazards Relative to Direct Threading
RCSfile : efficient − interpretation.lyx, v Revision : 1.20 53
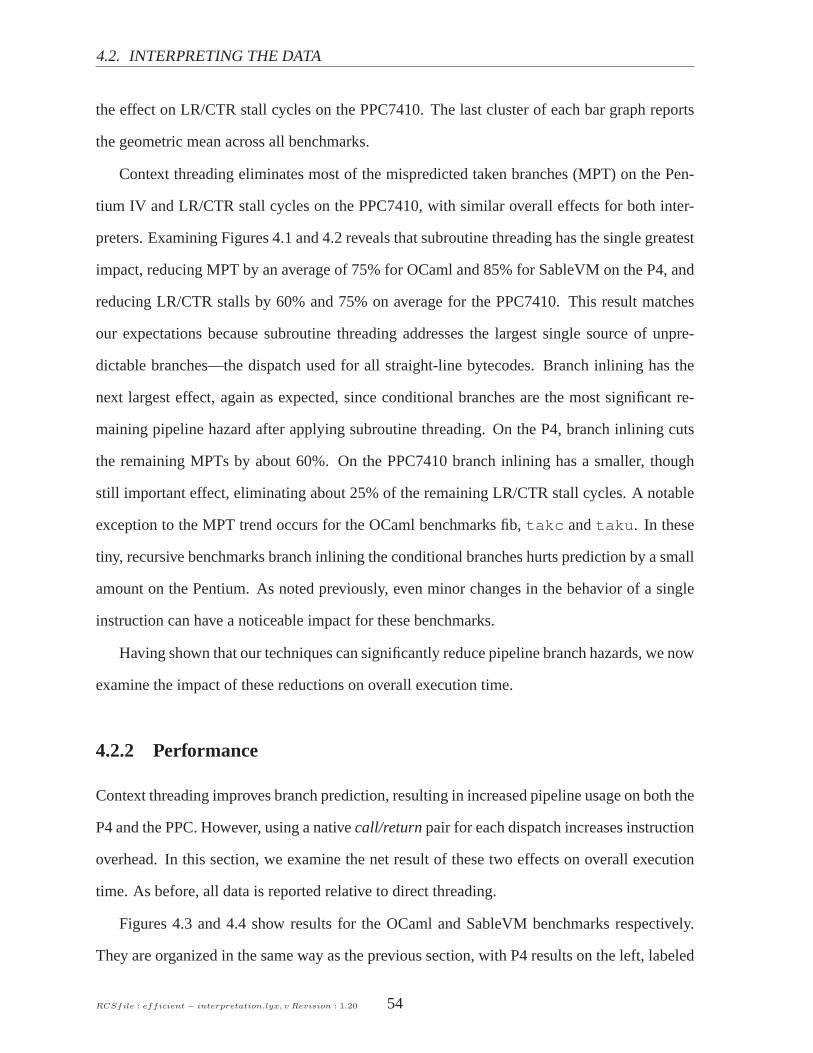
4.2. INTERPRETING THE DATA
the effect on LR/CTR stall cycles on the PPC7410. The last cluster of each bar graph reports
the geometric mean across all benchmarks.
Context threading eliminates most of the mispredicted takenbranches (MPT) on the Pen-
tium IV and LR/CTR stall cycles on the PPC7410, with similar overall effects for both inter-
preters. Examining Figures 4.1 and 4.2 reveals that subroutine threading has the single greatest
impact, reducing MPT by an average of 75% for OCaml and 85% for SableVM on the P4, and
reducing LR/CTR stalls by 60% and 75% on average for the PPC7410.This result matches
our expectations because subroutine threading addresses the largest single source of unpre-
dictable branches—the dispatch used for all straight-linebytecodes. Branch inlining has the
next largest effect, again as expected, since conditional branches are the most significant re-
maining pipeline hazard after applying subroutine threading. On the P4, branch inlining cuts
the remaining MPTs by about 60%. On the PPC7410 branch inlining has a smaller, though
still important effect, eliminating about 25% of the remaining LR/CTR stall cycles. A notable
exception to the MPT trend occurs for the OCaml benchmarks fib,takc andtaku. In these
tiny, recursive benchmarks branch inlining the conditional branches hurts prediction by a small
amount on the Pentium. As noted previously, even minor changes in the behavior of a single
instruction can have a noticeable impact for these benchmarks.
Having shown that our techniques can significantly reduce pipeline branch hazards, we now
examine the impact of these reductions on overall executiontime.
4.2.2 Performance
Context threading improves branch prediction, resulting inincreased pipeline usage on both the
P4 and the PPC. However, using a nativecall/returnpair for each dispatch increases instruction
overhead. In this section, we examine the net result of thesetwo effects on overall execution
time. As before, all data is reported relative to direct threading.
Figures 4.3 and 4.4 show results for the OCaml and SableVM benchmarks respectively.
They are organized in the same way as the previous section, with P4 results on the left, labeled
RCSfile : efficient − interpretation.lyx, v Revision : 1.20 54
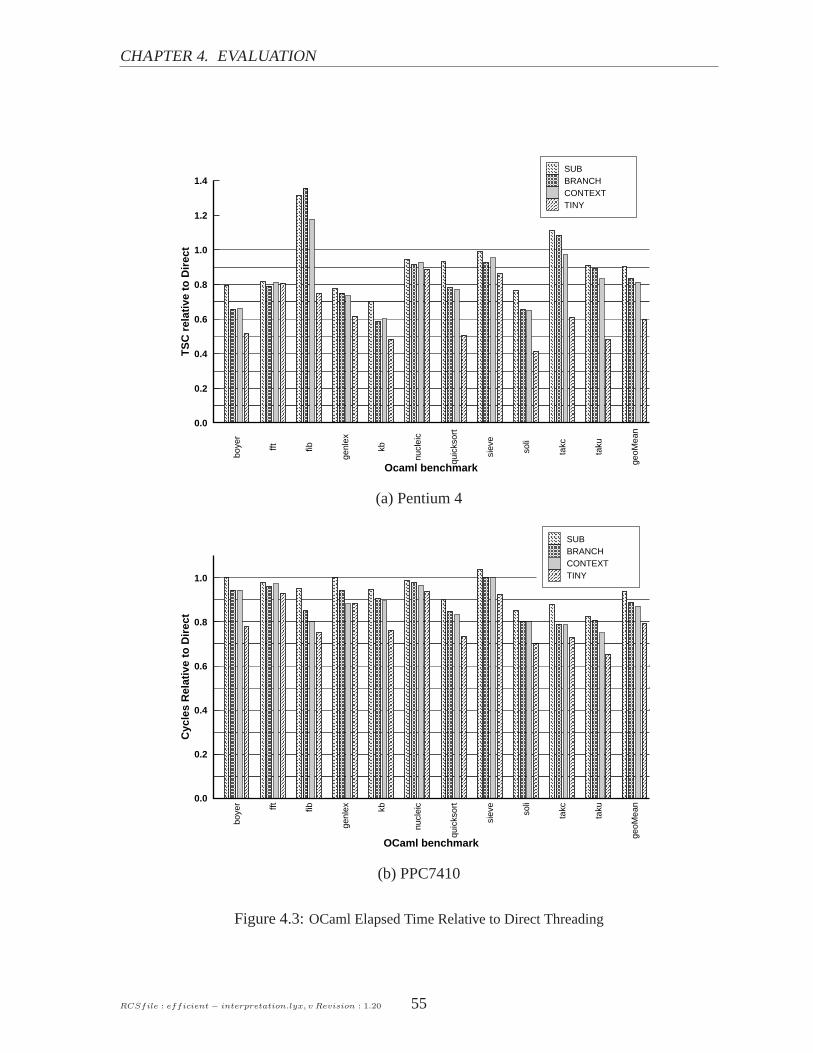
CHAPTER 4. EVALUATION
boye
r
fft fib
genl
ex
kb
nucl
eic
quic
ksor
t
siev
e
soli
takc
taku
geoM
ean
0.0
0.2
0.4
0.6
0.8
1.0
1.2
1.4T
SC
rel
ativ
e to
Dir
ect
Ocaml benchmark
SUBBRANCHCONTEXTTINY
(a) Pentium 4
boye
r fft fib
genl
ex kb
nucl
eic
quic
ksor
t
siev
e
soli
takc
taku
geoM
ean
0.0
0.2
0.4
0.6
0.8
1.0
Cyc
les
Rel
ativ
e to
Dir
ect
OCaml benchmark
SUBBRANCHCONTEXTTINY
(b) PPC7410
Figure 4.3:OCaml Elapsed Time Relative to Direct Threading
RCSfile : efficient − interpretation.lyx, v Revision : 1.20 55

4.2. INTERPRETING THE DATA
com
pres
s
db
jack
java
c
jess
mpe
g
mtr
t
ray
scim
ark
soot
geoM
ean
0.0
0.2
0.4
0.6
0.8
1.0
TS
C R
elat
ive
to D
irec
t
Java benchmark
SELECTSUBBRANCHCONTEXTTINY
(a) Pentium IV
com
pres
s
db
jack
java
c
jess
mpe
g
mtr
t
rayt
race
scim
ark
soot
geoM
ean
0.0
0.2
0.4
0.6
0.8
1.0
Cyc
les
Rel
ativ
e to
Dir
ect
Java benchmark
SELECTSUBBRANCHCONTEXTTINY
(b) PPC 7410
Figure 4.4: SableVM Elapsed Time Relative to Direct Threading
RCSfile : efficient − interpretation.lyx, v Revision : 1.20 56

CHAPTER 4. EVALUATION
boye
r
fft fib
genl
ex
kb
nucl
eic
quic
ksor
t
siev
e
soli
takc
taku
geoM
ean
0.0
0.2
0.4
0.6
0.8
1.0E
lap
sed
Tim
e R
elat
ive
to D
irec
t
Ocaml benchmark
SUBBRANCHCONTEXTTINY
(a) OCaml PPC970 elapsed (real) seconds
com
pres
s
db jack
java
c
jess
mpe
g
mtr
t
ray
scim
ark
soot
geoM
ean
0.0
0.2
0.4
0.6
0.8
1.0
Ela
pse
d T
ime
Rel
ativ
e to
Dir
ect
Java benchmark
SELECTSUBBRANCHCONTEXTTINY
(b) SableVM PPC970 elapsed (real) seconds
Figure 4.5:PPC970 Elapsed Time Relative to Direct Threading
RCSfile : efficient − interpretation.lyx, v Revision : 1.20 57
4.2. INTERPRETING THE DATA
(a), and PPC7410 results on the right, labeled (b). Figure 4.5reports the performance of OCaml
and SableVM on the PPC970 CPU. The geometric means (rightmost cluster) in Figures 4.3,
4.4 and 4.5 show that context threading significantly outperforms direct threading on both
virtual machines and on all three architectures. The geometric mean execution time of the
Ocaml VM is about 19% lower for context threading than directthreading on P4, 9% lower
on PPC7410, and 39% lower on the PPC970. For SableVM, context threading, compared with
direct threading, runs about 17% faster on the PPC7410 and 26%faster on both the P4 and
PPC970. Although we cannot measure the cost of LR/CTR stalls on the PPC970, the greater
reductions in execution time are consistent with its more deeply-pipelined design (23 stages
vs. 7 for the PPC7410).
Across interpreters and architectures, the effect of our techniques is clear. Subroutine
threading has the single largest impact on elapsed time. Branch inlining has the next largest
impact eliminating an additional 3–7% of the elapsed time. In general, the reductions in exe-
cution time track the reductions in branch hazards seen in Figures 4.1 and 4.2. The instruction
overheads of our dispatch technique are most evident in the OCaml benchmarksfib andtakc
on the P4 where the benefits of improved branch prediction (relative to direct threading) are
minor. In these cases, the opcode bodies are very small and the extra instructions executed for
dispatch are the dominant factor.
The effect of apply/return inlining on execution time is minimal overall, changing the ge-
ometric mean by only±1% with no discernible pattern. Given the limited performance ben-
efit and added complexity, a general implementation of apply/return inlining does not seem
worthwhile. Ideally, one would like to detect heavy recursion automatically, and only perform
apply/return inlining when needed. We conclude that, for general usage, subroutine threading
plus branch inlining provides the best trade-off.
We now demonstrate that context-threaded dispatch is complementary to inlining tech-
niques.
RCSfile : efficient − interpretation.lyx, v Revision : 1.20 58

CHAPTER 4. EVALUATION
4.3 Inlining
Inlining techniques address the context problem by replicating bytecode bodies and removing
dispatch code. This reduces both instructions executed as well as pipeline hazards. In this sec-
tion we show that, although both selective inlining and our context threading technique reduce
pipeline hazards, context threading is slower because of instruction overhead. We address this
issue by comparing our owntiny inlining technique with selective inlining.
In Figures 4.2, 4.4 and 4.5(a) the bar labeled SELECT shows ourmeasurements of Gagnon’s
selective inlining implementation for SableVM [23]. From these Figures, we see that selective
inlining reduces both MPT and LR/CTR stalls significantly as compared to direct threading,
but it is not as effective in this regard as subroutine threading alone. The larger reductions in
pipeline hazards for context threading, however, do not necessarily translate into better per-
formance over selective inlining. Figure 4.4(a) illustrates that SableVM’s selective inlining
beats context threading on the P4 by roughly 5%, whereas on the PPC7410 and the PPC970,
both techniques have roughly the same effect on execution time, as shown in Figure 4.4(b)
and Figure 4.5(a), respectively. These results show that reducing pipeline hazards caused by
dispatch is not sufficient to match the performance of selective inlining. By eliminating some
dispatch code, selective inlining can do the same real work with fewer instructions than context
threading.
Context threading is only a dispatch technique, and can be easily combined with inlin-
ing strategies. To investigate the impact of dispatch instruction overhead and to demonstrate
that context threading is complementary to inlining, we implementedTiny Inlining, a simple
heuristic that inlines all bodies with a length less than four times the length of our dispatch
code. This eliminates the dispatch overhead surrounding the smallest bodies and, as calls in
the CTT are replaced with comparably-sized bodies, tiny inlining ensures that the total code
growth is minimal. In fact, the smallest inlined OCaml bodieson P4 weresmaller than the
length of a relative call instruction. Table 4.3 summarizesthe effect of tiny inlining. On the
P4, we come within 1% of SableVM’s sophisticated selective inlining implementation. On
RCSfile : efficient − interpretation.lyx, v Revision : 1.20 59

4.4. LIMITATIONS OF CONTEXT THREADING
Table 4.3: Detailed comparison of selective inlining vs thecombination of context+tiny
(SableVM). Numbers are performance relative to direct threading for SableVM.△S − C is
the the difference between selective inlining and context threading.△S − T is the difference
between selective inlining and the combination of context threading and tiny inlining.
Context Selective Tiny ∆ ∆
Arch (C) (S) (T) (S-C) (S-T)
P4 0.762 0.721 0.731 -0.041 -0.010
PPC7410 0.863 0.914 0.839 0.051 0.075
PPC970 0.753 0.739 0.691 -0.014 0.048
PowerPC, we outperform SableVM by 7.8% for the PPC7410 and 4.8%for the PPC970.
The primary costs of direct-threaded interpretation are pipeline branch hazards, caused by
the context problem. Context threading solves this problem by correctly deploying branch
prediction resources, and as a result, outperforms direct threading by a wide margin. Once the
pipelines are full, the secondary cost of executing dispatch instructions is significant. A suitable
technique for addressing this overhead is inlining, and we have shown that context threading
is compatible with inlining using the “tiny” heuristic. Even with this simple approach, context
threading achieves performance equivalent to, or better than, selective inlining.
4.4 Limitations of Context Threading
The techniques described in this chapter address dispatch and hence have should have more ef-
fect on virtual machines that do more dispatch. A key design decision for any virtual machine
is the specific choice of virtual instructions. A design may choose many lightweight virtual
instructions or fewer heavyweight ones. Figure 4.6 shows how a Tcl interpreter typically ex-
ecutes an order of magnitude more cycles per dispatched virtual instruction than does Ocaml.
Another perspective is that Ocaml executes more dispatch because its work is carved up into
RCSfile : efficient − interpretation.lyx, v Revision : 1.20 60
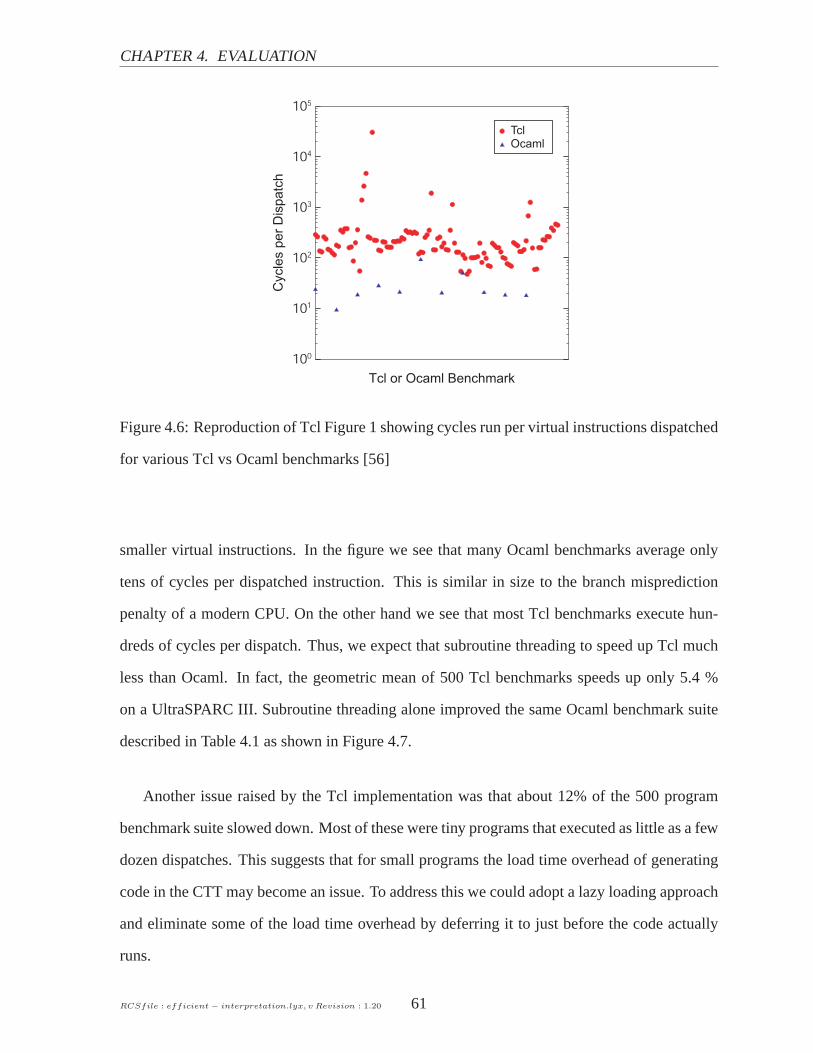
CHAPTER 4. EVALUATION
100
101
102
103
104
105
Tcl or Ocaml Benchmark
Cycle
s p
er
Dis
patc
h
TclOcaml
Figure 4.6: Reproduction of Tcl Figure 1 showing cycles run per virtual instructions dispatched
for various Tcl vs Ocaml benchmarks [56]
smaller virtual instructions. In the figure we see that many Ocaml benchmarks average only
tens of cycles per dispatched instruction. This is similar in size to the branch misprediction
penalty of a modern CPU. On the other hand we see that most Tcl benchmarks execute hun-
dreds of cycles per dispatch. Thus, we expect that subroutine threading to speed up Tcl much
less than Ocaml. In fact, the geometric mean of 500 Tcl benchmarks speeds up only 5.4 %
on a UltraSPARC III. Subroutine threading alone improved thesame Ocaml benchmark suite
described in Table 4.1 as shown in Figure 4.7.
Another issue raised by the Tcl implementation was that about 12% of the 500 program
benchmark suite slowed down. Most of these were tiny programs that executed as little as a few
dozen dispatches. This suggests that for small programs theload time overhead of generating
code in the CTT may become an issue. To address this we could adopt a lazy loading approach
and eliminate some of the load time overhead by deferring it to just before the code actually
runs.
RCSfile : efficient − interpretation.lyx, v Revision : 1.20 61

4.5. SUMMARY
boye
r fft fib
genl
ex kb
nucl
eic
quic
ksor
t
siev
e
soli
takc
taku
OCaml Subroutine Threading performance (relative to Direct)
0.0
0.2
0.4
0.6
0.8
1.0
Ela
pse
d t
ime
(rel
ativ
e to
Dir
ect)
Benchmark
Figure 4.7: Performance of subroutine threading for Ocaml on UltraSPARC III.
4.5 Summary
We have established that calling virtual instruction bodies can be very efficient and also that
generating inlined code for virtual branches is a powerful way to avoid costly branch mispre-
dictions. In the next chapter we will describe how callable virtual instructions play a central
role in the design of a gradually extensible mixed mode virtual machine.
Slowdowns we observed in the Tcl implementation suggest that a more lazy approach to
loading should be explored so that code is not generated for any region of a virtual program
until it has run at least once.
RCSfile : efficient − interpretation.lyx, v Revision : 1.20 62

Chapter 5
Design and Implementation of YETI
Early on we realized that organizing virtual bodies as lightweight routines would make it pos-
sible to call them from generated code and that this has potential to simplify bringing up a JIT.
At the same time, we realized that we could expand our use of the DTT to dispatch execution
units of any size, including basic blocks and traces, and that this would allow us to gradually
extend our system to more ambitious execution units. We knewthat it was necessary to in-
terpose instrumentation between the virtual instructionsbut we could not see a simple way of
doing it. We went ahead regardless and built an instrumentation infrastructure centered around
code generation. The general idea was to initially generatetrampolines, which we called inter-
posers, that would call instrumentation before and after the dispatch of each virtual instruction.
The infrastructure was very efficient (probably more efficient than the system we will describe
in this chapter) but quite difficult to debug. We extended oursystem until it could identify
basic blocks and traces [60]. Its main drawback was that a lotof work was required to build
a profiling system that ran no faster than direct threading. This, we felt, was not “gradual”
enough. Fortunately, a better idea came to mind.
Instead of loading the program as described for context threading, Yeti runs a program by
initially dispatching single virtual instruction bodies from an instrumented dispatch loop rem-
iniscent of direct call threading. Instrumentation added to the dispatch loop detects execution
63
5.1. INSTRUMENTATION
units, initially basic blocks, then traces, then linked traces. As execution units are generated
their address is installed into the DTT. Consequently the system speeds up as more time is
spent in execution units and less time on dispatch.
5.1 Instrumentation
In Yeti, as in subroutine threading, thevPC points into the DTT where each virtual instruction
is represented as one or more contiguous slots. The loaded representation of the program has
been elaborated significantly – now the first DTT slot of each instruction points to an instance
of a dispatcherstructure. The dispatcher structure contains four key fields. The execution unit
to be dispatched (initially a virtual instruction body, hence the name) is stored in thebodyfield.
Thepreworkerandpostworkerfields store the addresses of the instrumentation routines to be
called before and after the dispatch of the execution unit. Finally, the dispatcher has apayload
field, which is a chunk of profiling or other data that the instrumentation needs to associate with
an execution unit. Payload structures are used to describe virtual instructions, basic blocks, or
traces.
Despite being slow, a dispatch loop is very attractive because it makes it easy to instrument
the execution of a virtual program. Figure 5.1 shows how instrumentation can be interposed
before and after the dispatch of each virtual instruction. The figure illustrates a generic form
of dispatch loop (the shaded rectangle in the lower right) where the actual instrumentation
routines to be called are implemented as function pointers accessible via thevPC. In addition
we pass a payload to each instrumentation call. The disadvantage of this approach is that the
dispatch of the instrumentation is burdened by the overheadof a call through a function pointer.
This is not a problem because Yeti actually deploys several specialized dispatch loops and the
generic version illustrated in Figure 5.1 only executes a small proportion of the time.
Our strategy for identifying regions of a virtual program requires every thread to execute
in one of several execution “modes”. For instance, when generating a trace, a thread will be in
RCSfile : implementation − yeti.lyx, v Revision : 1.13 64

CHAPTER 5. DESIGN AND IMPLEMENTATION OF YETI
trace generation mode. Each thread has associated with it athread context structure(tcs) which
includes various mode bits as well as thehistory list, which is used to accumulate regions of
the virtual program.
5.2 Loading
When a method is first loaded we don’t know which parts of it willbe executed. As each
instruction is loaded it is initialized to a shared dispatcher structure. There is one shared dis-
patcher for each kind of virtual instruction. One instance is shared for alliload instructions,
another instance for alliadd instructions, and so on. Thus, minimal work is done at load time
for instructions that never run. On the other hand, a shared dispatcher cannot be used to profile
instructions that do execute. Hence, the shared dispatcheris replaced by a new, non-shared,
instance of ablock discovery dispatcherwhen the postworker of the shared dispatcher runs for
the first time. The job of the block discovery dispatcher is toidentify new basic blocks.
5.3 Basic Block Detection
When the preworker of a block discovery dispatcher executes for the first time, and the thread is
not currently recording a region, the program is about to enter abasic block that has never run
before. When this occurs we switch the thread intoblock recording modeby setting a bit in the
thread context structure. Figure 5.1 illustrates the discovery of the basic block of our running
example. The postworker called following the execution of each instruction has appended the
instruction’s payload to the thread’s history list. When a branch instruction is encountered by
a thread in block recording mode, the end of the current basicblock has been reached, so the
history list is used to generate an execution unit for the basic block. Figure 5.2 illustrates the
situation just after the collection of the basic block has finished. The dispatcher at the entry
point of the basic block has been replaced by a newbasic block dispatcherwith a new payload
RCSfile : implementation − yeti.lyx, v Revision : 1.13 65

5.3. BASIC BLOCK DETECTION
a
b
1
c
DTT
iloaddtt
iload
iconst
iadd
iadd
istore
mode bb_record
thread context struct
history list
block discovery dispatcher
payload
interp(){ Instruction *vPC; iload: //push var vPC++; asm volatile("ret"); iconst: iadd: istore:
t_thread_context tcs;
vPC = &dtt[0]; while(1){ //dispatch loop d = vPC->dipatcher; pay = d->payload; (*d->pre)(vPC,pay,&tcs); (*d->body)(); (*d->post)(vPC,pay,&tcs); } }goto
bodypayloadprepost
bodypayloadprepost
bodypayloadprepost
bodypayloadprepost
bodypayloadprepost
bodypayloadprepost
bodypayloadprepost
Figure 5.1: Shows a region of the DTT during block recording mode. The body of each block
discovery dispatcher points to the corresponding virtual instruction body (Only the body for the
first iload is shown). The dispatcher’s payload field points to instances of instruction payload.
The thread context struct is shown as tcs.
RCSfile : implementation − yeti.lyx, v Revision : 1.13 66

CHAPTER 5. DESIGN AND IMPLEMENTATION OF YETI
a
b
1
c
DTTiload
iload
iconst
iadd
iadd
istore
bb_payload
goto
call iload
call iload
call iconst
call iadd
call iadd
call istore
call goto
return
generated codebodypayloadprepost
bodypayloadprepost
bodypayloadprepost
bodypayloadprepost
bodypayloadprepost
basic block dispatcher
Figure 5.2: Shows a region of the DTT just after block recording mode has finished.
created from the history list. The body field of the basic block dispatcher points to a subroutine
threading style execution unit that has been generated for the basic block. The job of the basic
block dispatcher will be to search for traces.
5.4 Trace Selection
The postworker of a basic block dispatcher is called after the last virtual instruction of the block
has been dispatched. Since basic blocks end with branches, after executing the last instruction
thevPC points to one of the successors of the basic block. If thevPC of the destination is
lessthan thevPC of the virtual branch instruction, this is a reverse branch –a likely candidate
for the latch of a loop. According to the heuristics developed by Dynamo (see Section 2.3),
hot reverse branches are good places to start the search for hot code. Accordingly, when our
system detects a reverse branch that has executed 100 times it enterstrace recording mode. In
trace recording mode, much like in basic block recording mode, the postworker adds each basic
block to a history list. The situation is very similar to thatillustrated in Figure 5.1, except the
history list describes basic blocks. Our system, like Dynamo, ends a trace (i) when it reaches
a reverse branch, (ii) when it finds a cycle, or (iii) when it contains too many (currently 100)
RCSfile : implementation − yeti.lyx, v Revision : 1.13 67

5.5. TRACE EXIT RUNTIME
basic blocks. When trace generation ends, a newtrace dispatcheris created and installed. This
is quite similar to Figure 5.2 except that a trace dispatcheris installed and the generated code
is complicated by the need to support trace exits. The payload of a trace dispatcher includes a
table oftrace exit descriptors, one for each basic block in the trace. Although code could be
generated for the trace at this point, we postpone code generation until the trace has run a few
times, currently five, in trace training mode. Trace training mode uses a specialized dispatch
loop that calls instrumentation before and after dispatching each virtual instruction in the trace.
In principle, almost any detail of the virtual machine’s state could be recorded. Currently, we
record the class of every Java object upon which a virtual method is invoked. When training is
complete, code is generated for the trace as illustrated by Figure 5.3. Before we discuss code
generation, we need to describe the runtime of the trace system and especially the operation of
trace exits.
5.5 Trace Exit Runtime
The runtime of traces is complicated by the need to support trace exits, which occur when
execution diverges from the path collected during trace generation, in other words, when the
destination of a virtual branch instruction in the trace is different than during trace generation.
Generated guard code in the trace detects the divergence andbranches to atrace exit handler.
Generated code in the trace exit handler records which traceexit has occurred in the thread’s
context structure and then returns to the dispatch loop, which immediately calls the postworker
corresponding to the trace. The postworker determines which trace exit occurred by examining
the thread context structure. Conceptually, the postworkerhas only a few things it can do:
1. If the trace exit is still cold, increment the counter in the corresponding trace exit de-
scriptor.
2. Notice that the counter has crossed the hot threshold and arrange to generate a new trace.
RCSfile : implementation − yeti.lyx, v Revision : 1.13 68

CHAPTER 5. DESIGN AND IMPLEMENTATION OF YETI
3. Notice that a trace already exists at the destination and link the trace exit handler to the
new trace.
Regular conditional branches, like Java’sif_icmp, are quite simple. The branch has only two
destinations, one on the trace and the other off. When the trace exit becomes hot a new trace
is generated starting with the off-trace destination. Then, the next time the trace exit occurs,
the postworker links the trace exit handler to the new trace by rewriting the tail of the trace
exit handler to jump directly to the destination trace instead of returning to the dispatch loop.
Subsequently execution stays in the trace cache for both paths of the program.
Multiple destination branches, like method invocation andreturn, are more complex. When
a trace exit originating from a multi-way branch occurs we are faced with two additional
challenges. First, profiling multiple destinations is moreexpensive than just maintaining one
counter. Second, when one or more of the possible destinations are also traces, the trace exit
handler needs some mechanism to jump to the right one.
The first challenge we essentially punt on. We use a simple counter and trace generate
all destinations of a hot trace exit that arise. The danger of this strategy is that we could
trace generate superfluous cold destinations and waste trace generation time and trace cache
memory.
The second challenge concerns the efficient selection of a destination trace to which to
link, and the mechanics used to branch there. To choose a destination, we follow the heuristic
developed by Dynamo for regular branches – that is, we link todestinations in the order they
are encountered. At link time, we rewrite the code in the trace exit handler with code that
checks the value of thevPC. If it equals thevPC of a linked trace, we branch directly to that
trace, otherwise we return to the dispatch loop. Because we know the specific values thevPC
could have, we can hard-wire the comparand in the generated code. In fact, we can generate
a sequence of compares checking for two or more destinations. Eventually, a sufficiently long
cascade would perform no better than a trip around the dispatch loop. Currently we limit
ourselves to two linked destinations per trace exit. This mechanism is similar to a PIC, used to
RCSfile : implementation − yeti.lyx, v Revision : 1.13 69

5.6. GENERATING CODE FOR TRACES
DTT
trace dispatcher
trace
payload
bb0
bb1
traceexit0
texithandler0
traceexit1
texithandler1
generated code for trace
generated code for straight lineportion of bb1
generated code for straight lineportion of bb0
generated code for trace exit
generated code for trace exit
handlers
Figure 5.3: Schematic of a trace
dispatch polymorphic methods, as discussed in Section 2.4.
5.6 Generating code for traces
Generating a trace is made up of two main tasks, generating a trace exit handler for each
trace exit and generating the main body of the trace. Trace generation starts with the list of
basic blocks that were selected. We will use these to access the virtual instructions making up
the trace. After a few training runs we have also have fine-grained profiling information on
the precise values that occur during the execution of the trace. These values will be used to
devirtualize selected virtual method invocations.
5.6.1 Trace Exits and Trace Exit Handlers
The virtual branch instruction ending each block is compiled into a trace exit. We follow two
different strategies for trace exits. The first case, regular conditional branch virtual instruc-
tions, are compiled by our JIT into code that performs a compare followed by a conditional
branch. PowerPC code for this case appears in Figure 5.4. Thesense of the conditional branch
RCSfile : implementation − yeti.lyx, v Revision : 1.13 70
CHAPTER 5. DESIGN AND IMPLEMENTATION OF YETI
is adjusted so that the branch is always not-taken for the on-trace path. More complex virtual
branch instructions, and especially those with multiple destinations, are handled differently.
Instead of generating inlined code for the branch we generate a call to the virtual branch body
instead. This will have the side effect of setting thevPC to the destination of the branch. Since
only one destination can be on-trace, and since we know the exactvPC value corresponding
to it, we then generate a compare immediate of thevPC to the hardwired constant value of
the on-trace destination. Following the compare we generate a conditional branch to the corre-
sponding trace exit handler. The result is that execution leaves the trace if thevPC set by the
dispatched body was different from thevPC observed during trace generation. Polymorphic
method dispatch is handled this way if it cannot be optimizedas described in Section 5.6.3.
Trace exit handlers have three further roles not mentioned so far. First, since traces may
contain compiled code, it may be necessary to flush values held in registers back to the Java
expression stack before returning to regular interpretation. Code is generated to do this in each
trace exit handler. Second, some interpreter state may haveto be updated. For instance, in
Figure 5.4, the trace exit handler adjusts thevPC. Third, trace linking is achieved by overwrit-
ing code in a trace exit handler. (This is the only situation in which we rewrite code.) To link
traces, the tail of the trace exit handler is rewritten to branch to the destination trace rather than
return to the dispatch loop.
5.6.2 Code Generation
The body of a trace is made up of straight-line sections of code, corresponding to the body of
each basic block, interspersed with trace exits generated from the virtual branches ending each
basic block. The JIT therefore has three types of information to start with. First, there is a list
of virtual instructions making up each basic block in the trace. Enough information is cached
in the trace payload to determine the virtual opcode and virtual address of each instruction in
the trace. Second, there is a trace exit corresponding to thebranch ending each basic block.
The trace exit stores information like thevPC of the off-trace destination of the trace. Third,
RCSfile : implementation − yeti.lyx, v Revision : 1.13 71

5.6. GENERATING CODE FOR TRACES
...OPC_ILOAD_3xOPC_ILOAD_2yOPC_IF_ICMPGE +121
...lwz r3,12(r27)
lwz r4,8(r27)
cmpw r3,r4 bge teh0
teh0:addi r26,r26,112 li r0,0 stw r0,916(r30) lis r0,1090 ori r0,r0,11488 stw r0,912(r30) b 0x10cf0
trace exit JIT compiled from if_icmpge
trace exithandler JIT compiled fortrace exit
JIT compiled from iloads
if this trace exit becomes hot, trace linking overwrites this instruction with branch to destination trace
unlinked trace branches back to dispatch loop
teh stores trace exit number (0) and hardwired address of trace payload into thread context struct
vPC adjusted upon leaving JIT compiled region
DTT
Figure 5.4: PowerPC code for a trace exit and trace exit handler. The generated code assumes
that thevPC has been assignedr26, base of the local variablesr27 and the Java method frame
pointerr30.
there may be profiling information that was cached when the trace ran in training mode.
At this phase of our research we have not invested any effort in generating optimized code
for the straight-line portions of a trace. Instead, we implemented a simple one pass JIT com-
piler. The goals of our JIT are modest. First, it should perform a similar function as branch
inlining (Section 3.1.3) to ensure that code generated for trace exits exposes the conditional
branch logic of the virtual program to the underlying hardware conditional branch predictors.
Second, it should reduce the redundant memory traffic back and forth to the interpreter’s ex-
pression stack by holding temporary results in registers when possible. Third, it should support
a few simple speculative optimizations.
Our JIT does not build any internal representation of a traceother that what is described
in Section 5.4. Instead, it performs a single pass through each trace allocating registers and
generating code. Register allocation is very simple. As we examine each virtual instruction
we maintain ashadow stackwhich associates registers, temporary values and expression stack
RCSfile : implementation − yeti.lyx, v Revision : 1.13 72

CHAPTER 5. DESIGN AND IMPLEMENTATION OF YETI
slots. Whenever a virtual instruction needs to pop an input wefirst check if there already is a
register for that value in the corresponding shadow stack slot. If there is we use the register
instead of generating any code to pop the stack. Similarly, when a virtual instruction would
push a new value onto the expression stack we assign a new register to the value and push
this on the shadow stack but forgo generating any code to pushthe value. Thus, every value
assigned to a register always has ahome locationon the expression stack. If we run out of
registers we simply spill the register whose home location is deepest on the shadow stack as all
the shallower values will be needed sooner [39].
Since traces contain no control merge points there is no additional complexity at trace exits
other than the generation of the trace exit handler. As described in Section 5.6.1 trace exit
handlers include generated code that flushes all the values in registers to the expression stack
in preparation for execution returning to the interpreter.This is done by walking the shadow
stack and storing each slot that is not already spilled into its home location. Consequently, the
values stay in registers if execution remains on-trace, butare flushed when a trace exit occurs.
Linked trace exits result in potentially redundant stack traffic as values are flushed by the trace
exit handler only to be reloaded by the destination trace.
Similar to a trace exit handler, when an unfamiliar virtual instruction is encountered, code
is generated to flush any temporary values held in registers back to the Java expression stack.
Then, a sequence of calls is generated to dispatch the bodiesof the uncompilable virtual in-
structions. Compilation resumes, with an empty shadow stack, with any compilable virtual
instructions that follow. This means that generated code must be able to load and store values
to the same Java expression stack referred to by the C code implementing the virtual instruction
bodies. Our current PowerPC implementation side-steps this difficulty by dedicating hardware
registers for values that are shared between generated codeand bodies. Currently we dedicate
registers for thevPC, the top of the Java expression stack and the pointer to the base of the
local variables. Code is generated to adjust the value of the dedicated registers as part of the
flush sequence described above for trace exit handlers.
RCSfile : implementation − yeti.lyx, v Revision : 1.13 73

5.6. GENERATING CODE FOR TRACES
The actual machine code generation is performed using the ccg [38] run-time assembler.
5.6.3 Trace Optimization
We describe two optimizations here: how loops are handled and how the training data can be
used to optimize method invocation.
Inner Loops One property of the trace selection heuristic is that innermost loops of a pro-
gram are often selected into a single trace with the reverse branch at the end. (This is so because
trace generation starts at the target of reverse branches and ends whenever it reaches a reverse
branch. Note that there may be many branches, including calls and returns, along the way.)
Thus, when the trace is generated the loop will be obvious because the trace will end with a
virtual branch back to its beginning. This seems an obvious optimization opportunity that, so
far, we have not exploited other than to compile the last trace exit as a conditional branch back
to the head of the trace.
Virtual Method Invocation When a trace executes, if the class of the invoked-upon object
is different than when the trace was generated, a trace exit must occur. At trace generation time
we know the on-trace destination of each call and from the training profile know the class of
each invoked-upon object. Thus, we can easily generate avirtual invoke guardthat branches to
the trace exit handler if the class of the object on top of the Java run time stack is not the same
as recorded during training. Then, we can generate code to perform a faster, stripped down
version of method invocation. The savings are primarily thework associated with looking up
the destination given the class of the receiver. The virtualguard is an example of a trace exit
that guards a speculative optimization [24].
Inlining The final optimization we will describe is a simple form of inlining. Traces are ag-
nostic towards method invocation and return, treating themlike any other multiple-destination
virtual branch instructions. However, when a return corresponds to an invoke in the same trace
RCSfile : implementation − yeti.lyx, v Revision : 1.13 74

CHAPTER 5. DESIGN AND IMPLEMENTATION OF YETI
the trace generator can sometimes remove almost all method invocation overhead. Consider
when the code between a method invocation and the matching return is relatively simple, for
instance, it does not touch the callee’s stack frame (other than the expression stack) and it can-
not throw. Then, no invoke is necessary and the only method invocation overhead that remains
is the virtual invoke guard. If the inlined method body contains any trace exits the situation is
slightly more complex. In this case, in order to prepare for areturn somewhere off-trace, the
trace exit handlers for the trace exits in the inlined code must modify the run time stack exactly
as the (optimized away) invoke would have done
5.7 Polymorphic bytecodes
So far we have implemented our ideas in a Java virtual machine. However, we expect that many
of the techniques will be useful in other virtual machines aswell. For instance, languages like
Tcl or JavaScript define polymorphic virtual arithmetic instructions. An example would be
ADD, which adds the two values on the top of the expression stack. Each time it is dispatched
ADD must check the type of its inputs, which could be integer,float or even string values, and
perform the correct type of arithmetic. This is similar to polymorphic method invocation.
We believe the same profiling infrastructure that we use to optimize monomorphic callsites
in Java can be used to improve polymorphic arithmetic bytecodes. Whereas the destination of
a Java method invocation depends only upon the type of the invoked upon object, the operation
carried out by a polymorphic virtual instruction may dependon the type ofeachinput. Now,
suppose that an ADD in Tcl is effectively monomorphic. Then,we would generate two virtual
guards, one for each input. Each would check that the type of the input is the same as observed
during training and trace exit if it differs. Then, we would dispatch a type-specialized version
of the instruction (integer ADD, float ADD, string ADD, etc) and/or generate specialized code
for common cases.
RCSfile : implementation − yeti.lyx, v Revision : 1.13 75

5.8. OTHER IMPLEMENTATION DETAILS
5.8 Other implementation details
Our use of a dispatch loop similar to Figure 5.1 in conjunction with ending virtual bodies with
inlined assembler return instructions results in a controlflow graph that is not apparent to the
compiler. This is because the optimizer cannot know that control flows from the inlined return
instruction back to the dispatch loop. Similarly, the optimizer cannot know that control can
flow from the function pointer call in the dispatch loop to anybody. We insert computed goto
statements that are never actually executed to simulate themissing edges. If the bodies were
packaged as nested functions like in Figure 3.1 these problems would not occur.
5.9 Packaging and portability
A obvious packaging strategy for a portable language implementation based on our work would
be to differentiate platforms into “primary” targets, (i.ethose supported by our trace-oriented
JIT) and “secondary” targets supported only by direct threading.
Another approach would be to package the bodies as for subroutine threading (i.e. as illus-
trated by Figure 3.2) and use direct call threading on all platforms. In Section 6.2 we show that
although direct call threading is much slower than direct threading it is about the same speed
as switch dispatch. Many useful systems run switch dispatch, so presumably its performance is
acceptable under at least some circumstances. This would cause the performance gap between
primary and secondary platforms to be larger than if secondary platforms used direct threaded
dispatch.
Bodies could be very cleanly packaged as nested functions. Ostensibly this should be
almost as portable as the computed goto extensions direct threading depends upon. However
nested functions do not yet appear to be in mainstream usage and so even gcc support may be
unreliable. For instance, a recent version of gcc, version 4.0.1 for Apple OSX 10.4, shipped
with nested function support disabled.
RCSfile : implementation − yeti.lyx, v Revision : 1.13 76

Chapter 6
Evaluation of Yeti
In this chapter we show how Yeti gradually improves in performance as we extend the size
of execution units. We prototyped Yeti in a Java VM (rather than a language which does
not have a JIT) to allow comparisons of well-known benchmarks against other high-quality
implementations.
In order to evaluate the effectiveness of our system we need to examine performance from
three perspectives. First, we show that almost all execution comes from the trace cache. Sec-
ond, to evaluate the overhead of trace selection, we measurethe performance of our system
with the JITturned off. We compare elapsed time against SableVM and a version of JamVM
modified to use subroutine threading. Third, to evaluate theoverall performance of our modest
trace-oriented JIT compiler we compare elapsed time for each benchmark to Sun’s optimizing
HotSpotTM Java virtual machine.
Table 6.1 briefly describes each SpecJVM98 benchmark [47]. We also report data for
scimark, a typical scientific program. Below we report performance relative to the perfor-
mance of either unmodified JamVM 1.3.3 or Sun’s Java Hotspot JIT, so the raw elapsed time
for each benchmark appears in Table 6.1 also.
All our data was collected on a dual CPU 2 GHz PPC970 processor with 512 MB of mem-
ory running Apple OSX 10.4. Performance is reported as the average of three measurements
77

6.1. EFFECT OF REGION SHAPE ON REGION DISPATCH COUNT
Table 6.1: SPECjvm98 benchmarks including elapsed time for unmodified JamVM 1.3.3 and
Sun Java Hotspot 1.05.0_6_64
Elapsed Time
Benchmark Description (seconds)
JamVM HotspotTM
compress Lempel-Ziv compression 98 8.0
db Database functions 56 23
jack Parser generator 22 5.4
javac Java compiler JDK 1.0.2 33 9.9
jess Expert shell System 29 4.4
mpeg decompresses MPEG-3 87 4.6
mtrt Two thread raytracer 30 2.1
raytrace raytracer 29 2.3
scimark FFT, SOR and LU, ’large’ 145 16
of elapsed time, as printed by thetime command.
Java Interpreters We present data obtained by running various modifications toJamVM
version 1.3.3 built with gcc 4.0.1. SableVM is a JVM built forquick interpretation. It imple-
ments a variation of selective inlining calledinline threading[23]. SableVM version 1.1.8 has
not yet been ported to gcc 4 so we compiled it with gcc 3.3 instead.
6.1 Effect of region shape on region dispatch count
For a JIT to be effective, execution must spend most of its time in compiled code. Forjack,
traces account for 99.3% of virtual instructions executed.For all the remaining benchmarks,
traces account for 99.9% or more. A remaining concern is how often execution enters and
leaves the trace cache. In our system, regions of generated code are called from dispatch loops
RCSfile : experiments.lyx, v Revision : 1.9 78
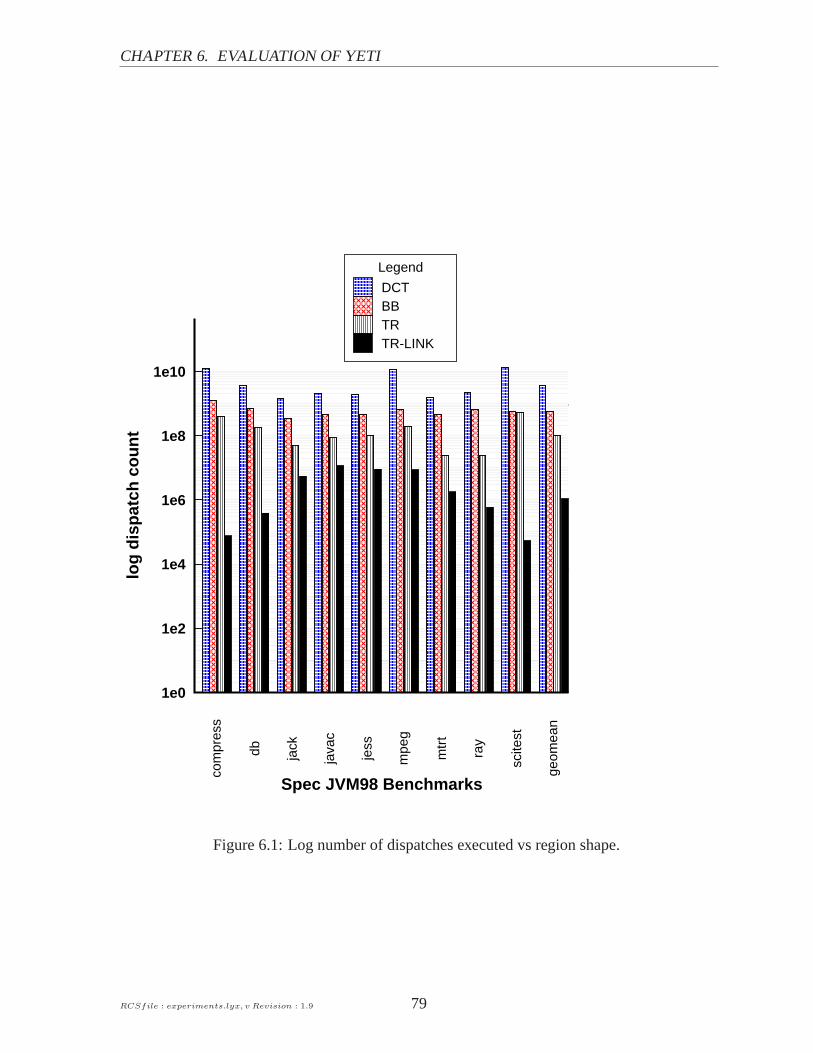
CHAPTER 6. EVALUATION OF YETI
com
pres
s
db jack
java
c
jess
mpe
g
mtr
t
ray
scite
st
geom
ean
1e0
1e2
1e4
1e6
1e8
1e10
log
dis
pat
ch c
ou
nt
Spec JVM98 Benchmarks
Legend
DCTBBTRTR-LINK
Figure 6.1: Log number of dispatches executed vs region shape.
RCSfile : experiments.lyx, v Revision : 1.9 79

6.1. EFFECT OF REGION SHAPE ON REGION DISPATCH COUNT
like those illustrated by Figures 2.2 and 5.1. In this section, we report how many iterations of
the dispatch loops occur during the execution of each benchmark. Figure 6.1 shows how direct
call threading (DCT) compares to basic blocks (BB), traces withno linking (TR) and linked
traces (TR-LINK). Note the y-axis has a logarithmic scale.
DCT dispatches each virtual instruction independently, so the DCT bars on Figure 6.1
report how many virtual instructions were executed. Comparing the geometric mean across all
benchmarks, we see that BB reduces the number of dispatches relative to DCT by about a factor
of 6.3. For each benchmark, the ratio of DCT to BB shows the dynamic average basic block
length. As expected, the scientific benchmarks have longer basic blocks. For instance, the
dynamic average basic block inscitest has about 20 virtual instructions whereasjavac,
jess andjack average about 4 instructions in length.
Even without trace linking, the average dispatch of a trace causes about 10 times more
virtual instructions to be executed than the dispatch of a BB. (This can be read off Figure 6.1
by dividing the height of the TR geomean bar into the BB geomeanbar.) This shows that traces
do predict the path taken through the program. The improvement can be dramatic. For instance,
while running TR,javac executes about 22 virtual instructions per trace dispatch,on average.
This is much longer than its dynamic average basic block length of 4 virtual instructions.
TR-LINK makes the greatest contribution, reducing the number of times execution leaves
the trace cache by between one and 3.7orders of magnitude. The reason TR-LINK is so
effective is that it links traces together around loop nests.
Although these data show that execution is overwhelmingly from the trace cache it gives
no indication of how effectively code cache memory is being used by the traces. A thorough
treatment of this, like the one done by Bruening and Duesterwald [6], remains future work.
Nevertheless, we can relate a few anecdotes based on data that our profiling system collects.
For instance, we observe that for an entire run of thecompress benchmark all generated
traces contain only 60% of the virtual instructions contained in all loaded methods. This is a
good result for traces, suggesting that a trace-based JIT needs to compile fewer virtual instruc-
RCSfile : experiments.lyx, v Revision : 1.9 80

CHAPTER 6. EVALUATION OF YETI
tions than a method-based JIT. On the other hand, forjavac we find that the traces bloat –
almost eighttimesas many virtual instructions appear in traces than are contained in the loaded
methods. Improvements to our trace selection heuristic, perhaps adopting the suggestions of
Hiniker et al [27], are future work.
6.2 Effect of region shape on performance
Figure 6.2 shows how performance varies as differently shaped regions of the virtual program
are identified, loaded and dispatched. The figure shows elapsed time relative to the elapsed time
of the unmodified JamVM distribution, which uses direct-threaded dispatch. Our compiler
is turned off, so in a sense this section reports the dispatchand profiling overhead of Yeti
by comparing to the performance of other high-performance interpretation techniques. The
four bars in each cluster represent, from left to right, subroutine threading (SUB), direct call
threading (DCT), basic blocks (BB), unlinked traces (TR), and linked traces (TR-LINK).
The simplest technique, direct call threading, or DCT, dispatches single virtual instruction
bodies from a dispatch loop as in Figure 2.2. As expected, DCT is slower than direct threading
by about 50%. Not shown in the figure is switch dispatch, for which the geometric mean
elapsed time across all the benchmarks is within 1% of DCT. DCT and SUB are baselines, in
the sense that the former burdens the execution of every virtual instruction with the overhead
of the dispatch loop, whereas for the latter, all overhead was incurred at load time. The results
show that SUB is a very efficient dispatch technique [5]. Our interest here is to assess the
overhead of BB and TR-LINK by comparing them with SUB. BB discovers and generates
code at runtime that is very similar to what SUB generates at load time, so the difference
between them is the overhead of our profiling system. Comparing the geometric means across
benchmarks we see that BB is about 43% slower than SUB. On the other hand, it is difficult to
move forward from SUB dispatch, primarily because it is hardto add and remove the profiling
needed for dynamic region selection.
RCSfile : experiments.lyx, v Revision : 1.9 81

6.2.E
FF
EC
TO
FR
EG
ION
SH
AP
EO
NP
ER
FO
RM
AN
CE
0.731.87
0.950.78
0.66compress
0.871.45
1.050.90
0.80db
0.881.41
1.220.88
0.79jack
0.881.39
1.180.96
0.85javac
0.871.38
1.150.87
0.77jess
0.722.00
0.990.78
0.72mpeg
0.841.11
1.420.820.81
mtrt
0.881.49
1.330.84
0.77ray
0.591.69
1.180.68
0.60scitest
0.801.51
1.150.83
0.75geomean
0.0
0.5
1.0
1.5
2.0
Elapsed time relative to jam-distro
Sp
ec JVM
98 Ben
chm
arks
Legend
SU
BD
CT
BB
TR
TR
-LINK
Figure
6.2:E
lapsedtim
eof
YetiJIT
disa
ble
drelativeto
unmodified
directthreaded
JamV
M
version1.3.3.
RC
Sf
ile:
ex
perim
en
ts.ly
x,v
Revis
ion
:1.9
82

CHAPTER 6. EVALUATION OF YETI
Execution of TR-LINK is faster than BB primarily because tracelinking so effectively
reduces dispatch loop overhead, as described in Section 6.1. We have not yet investigated the
micro-architectural reasons for the speedup of TR-LINK compared to SUB. Presumably it is
caused by the same factors that make context threading faster than SUB [5], namely helping
the hardware to better predict the destination of virtual branch instructions. Regardless of the
precise cause, TR-LINK more than makes up for the profiling overhead required to identify and
generate traces. In fact, even before we started work on our JIT, our profiling system already ran
faster than SUB. Looking forward to Figure 6.3, we see that TR-LINK outperforms selective
inlining as implemented by SableVM 1.1.8 as well.
For all benchmarks, performance improves as execution units become longer, that is, BB
performs better than DCT, TR performs better than BB, etc. Our approach is indeed allowing
us to gradually improve performance by gradually investingin better region selection.
6.2.1 JIT Compiled traces
Figure 6.3 compares the performance of our best-performingversion of Yeti (JIT), to SableVM
(SABVM). Performance is reported relative to the Java HotSpotTM JIT. In addition, we show
the TR-LINK condition from Figure 6.2 again to relate our interpreter and JIT performance.
In most cases TR-LINK, our profiling system alone (i.e withoutthe JIT), does as well or better
than SableVM.Scitest andmpeg are exceptions, where SableVM’s implementation of
selective inlining works well on very long basic blocks.
Not surprisingly, the optimizing HotSpotTMJIT generates much faster code than our naive
compiler. This is particularly evident for mathematical and heavily looping codes like com-
press, mpeg, the raytracers and scitest. Nevertheless, despite supporting only 50 integer and
object virtual instructions, our trace JIT improves the performance of integer programs like
compress significantly. Our most ambitious optimization, of virtualmethod invocation, im-
proved the performance ofraytrace by about 32%.Raytrace is written in an object-
oriented style with many small methods invoked to access object fields. Hence, even though it
RCSfile : experiments.lyx, v Revision : 1.9 83

6.2.E
FF
EC
TO
FR
EG
ION
SH
AP
EO
NP
ER
FO
RM
AN
CE
8.788.14
5.49compress
2.311.93
1.50db
3.063.23
2.59jack
3.922.86
2.43javac
5.735.17
4.25jess
12.2613.73
7.95mpeg
11.6511.9611.87
mtrt
11.469.71
7.20ray
4.075.21
3.45scitest
5.945.69
4.31geomean
0 2 4 6 8 10 12 14
Elapsed time relative to hotspot
Sp
ec JVM
98 Ben
chm
arks
Legend
SA
BV
MT
R-LIN
KJIT
Figure
6.3:E
lapsedtim
erelative
toS
unJava
1.05.0_6_64co
mpares
JIT,ourJIT-enabled
ver-
sionofY
eti,vsS
ableVM
1.1.8w
ithselective
inlining.
RC
Sf
ile:
ex
perim
en
ts.ly
x,v
Revis
ion
:1.9
84
CHAPTER 6. EVALUATION OF YETI
is a floating point benchmark, it is greatly improved by devirtualizing and inlining the acces-
sor methods. Comparing geometric means, we see that our trace-oriented JIT is roughly 24%
faster than just linked traces.
RCSfile : experiments.lyx, v Revision : 1.9 85

6.2. EFFECT OF REGION SHAPE ON PERFORMANCE
RCSfile : experiments.lyx, v Revision : 1.9 86

Chapter 7
Conclusions and Future Work
We described an architecture for a virtual machine interpreter that facilitates its gradual ex-
tension to a trace-based mixed-mode JIT compiler. We start by taking a step back from high-
performance dispatch techniques to direct call threading.We package all execution units (from
single instruction bodies up to linked traces) as callable routines that are dispatched via a func-
tion pointer in an old-fashioned dispatch loop. The first benefit is that existing bodies can be
reused by generated code, so that compiler support for virtual instructions can be added one
by one. The second benefit is that it is easy to add instrumentation, allowing us to discover
hot regions of the program and to install new execution unitsas they reveal themselves. The
cost of this flexibility is increased dispatch overhead. We have shown that by generating larger
execution units, the frequency of dispatch is reduced significantly. Dispatching basic blocks
nearly breaks even, losing to direct threading by only 15%. Combining basic blocks into traces
and linking traces together, however, wins by 17% and 25% respectively. Investing the ad-
ditional effort to generate non-optimized code for roughly50 integer and object bytecodes
within traces gains an additional 18%, now running nearly twice as fast as direct threading.
This demonstrates that it is indeed possible to achieve gradual, but significant, performance
gains through gradual development of a JIT.
Substantial additional performance gains are possible by extending the JIT to handle more
87

types of instructions such as the floating point bytecodes, and by applying classical optimiza-
tions such as common subexpression elimination. More interesting, however, is the opportu-
nity to apply dynamic and speculative optimizations based on the profiling data that we already
collect. The technique we describe for optimizing virtual dispatch in Section 5.6.3 could be
applied to guard various speculations. In particular, thistechnique could be used in languages
like Python or JavaScript to optimize virtual instructionsthat must accept arguments of varying
type. Finally, just as basic blocks are collected into traces, so traces can be collected into larger
units for optimization.
The techniques we applied in Yeti are not specific to Java. By lowering the up-front devel-
opment effort required, a system based on our architecture can gradually bring the benefits of
mixed-mode JIT compilation to other interpreted languages.
RCSfile : concl.lyx, v Revision : 1.6 88

Chapter 8
Remaining Work
We believe that our research is mostly complete and that we have shown that our efficient inter-
pretation technique is effective and supports a gradual extension to mixed-mode interpretation.
By modestly extending our system and collecting more data we can more fully report on the
strenghts and weaknesses of our approach. Hence, during thewinter of 2007 we propose to
extend the functionality and performance instrumentationof our JIT compiler. These exten-
sions and related data collection and writing-up should, ifaccepted by the committee, allow
the dissertation to be finished by late spring or early summerof 2007.
The remaining sections of this chapter describe work we intend to pursue.
8.1 Compile Basic Blocks
In the push to compile traces we skipped the obvious step of compiling basic blocks alone.
The basic block region data presented in Chapter 6 is for CT-style basic blocks with no branch
inlining. It would be interesting to compare the performance of basic blocks compiled with
our JIT to traces. Especially on loop nest dominated programs with long basic blocks, like
scimark, compiled basic blocks might perform well enough torecoup the time spent compiling
cold blocks.
89

8.2. INSTRUMENT COMPILE TIME
8.2 Instrument Compile Time
Our infrastructure does not currently make any attempt to record time spent compiling. Since
compiling short traces will take much less time than the resolution of the Unix clock some
machine dependent tinkering may be required. Knowing the overhead of compilation would
help characterize the overhead of our technique.
8.3 Another Register Class
Adding support for float registers would make our performance results for float programs like
scimark more directly comparible to high performance JIT compilers like HotSpot. Extending
our simple JIT to handle another register class would show that our design is not somehow
limited to one register class. Compiler support would need tobe extended by about another
dozen floating point virtual instructions in order to test our design.
8.4 Measure Dynamic Proportion of JIT Compiled Instruc-
tions
As the JIT is extended to support for more virtual instructions it would be useful to measure
the proportion of all executed virtual instructions made upby JIT compiled instructions.
RCSfile : futureWork.lyx, v Revision : 1.4 90

Bibliography
[1] Vasanth Bala, Evelyn Duesterwald, and Sanjeev Banerjia. Transparent dynamic op-
timization: The design and implementation of Dynamo. Technical report, Hewlett
Packard, 1999. Available from:http://www.hpl.hp.com/techreports/
1999/HPL-1999-78.html.
[2] Vasanth Bala, Evelyn Duesterwald, and Sanjeev Banerjia. Dynamo: A transparent dy-
namic optimization system. InProc. of the ACM SIGPLAN 2000 Conf. on Prog. Language
Design and Impl., pages 1–12, Jun. 2000.
[3] Iris Baron. Dynamic Optimization of Interpreters using DynamoRIO. PhD the-
sis, MIT, 2003. Available from: http://www.cag.csail.mit.edu/rio/
iris-sm-thesis.pdf.
[4] James R. Bell. Threaded code.Comm. of the ACM, 16(6):370–372, 1973.
[5] Marc Berndl, Benjamin Vitale, Mathew Zaleski, and Angela Demke Brown. Context
threading: A flexible and efficient dispatch technique for virtual machine interpreters. In
Proc. of the 3rd Intl. Symp. on Code Generation and Optimization, pages 15–26, Mar.
2005.
[6] Derek Bruening and Evelyn Duesterwald. Exploring optimal compilation unit shapes for
an embedded just-in-time compiler. InProc. of the 3rd ACM Workshop on Feedback-
Directed and Dynamic Optimization (FDDO-3), Dec. 2000. Available from:http:
//www.eecs.harvard.edu/fddo/papers/108.ps.
91

BIBLIOGRAPHY
[7] Derek Bruening, Evelyn Duesterwald, and Saman Amarasinghe. Design and implemen-
tation of a dynamic optimization framework for windows. InProc. of the 4th ACM Work-
shop on Feedback-Directed and Dynamic Optimization (FDDO-4), Dec. 2000.
[8] Derek Bruening, Timothy Garnett, and Saman Amarasinghe.An infrastructure for adap-
tive dynamic optimization. InProc. of the 1st Intl. Symp. on Code Generation and Opti-
mization, pages 265–275, Mar. 2003. Available from:http://www.cag.lcs.mit.
edu/dynamorio/CGO03.pdf.
[9] Emmanuel Chailloux, Pascal Manoury, and Bruno Pagano.Developing Applications With
Objective Caml. O’Reilly France, 2000.
[10] Wen-Ke Chen, Sorin Lerner, Ronnie Chaiken, and David Gillies. Mojo: A dynamic
optimization system. InProc. of the 3rd ACM Workshop on Feedback-Directed and
Dynamic Optimization (FDDO-3), Dec. 2000. Available from:http://www.cs.
washington.edu/homes/lerns/mojo.pdf.
[11] Charles Curley. Life in the FastForth lane.Forth Dimensions, 14(4), January-February
1993.
[12] Charles Curley. Optimizing in a BSR/JSR threaded forth.Forth Dimensions, 14(5),
March-April 1993.
[13] Ron Cytron, Jean Ferrante, B. K. Rosen, M. N Wegman, and F.K. Zadeck. Efficiently
computing static single assignment form and the control dependence graph.ACM Trans-
actions on Programming Languages and Systems, 13(4):451–490, 1991.
[14] James C. Dehnert, Brian K. Grant, John P. Banning, Richard Johnson, Thomas Kistler,
Alexander Klaiber, and Jim Mattson. The Transmeta code morphing software: Using
speculation, recovery, and adaptive retranslation to address real-life challenges. InProc.
of the 1st Intl. Symp. on Code Generation and Optimization, pages 15–24, Mar. 2003.
RCSfile : futureWork.lyx, v Revision : 1.4 92
BIBLIOGRAPHY
[15] Karel Driesen.Efficient Polymorphic Calls. Klumer Academic Publishers, 2001.
[16] Evelyn Duesterwald and Vasanth Bala. Software profilingfor hot path prediction: less is
more.ACM SIGPLAN Notices, 35(11):202–211, 2000.
[17] M. Anton Ertl. Stack caching for interpreters. InProc. of the ACM SIGPLAN 1995
Conf. on Prog. Language Design and Impl., pages 315–327, June 1995. Available from:
http://www.complang.tuwien.ac.at/papers/ertl95pldi.ps.gz.
[18] M. Anton Ertl and David Gregg. The behavior of efficient virtual machine interpreters on
modern architectures.Lecture Notes in Computer Science, 2150, 2001.
[19] M. Anton Ertl and David Gregg. Optimizing indirect branch prediction accuracy in virtual
machine interpreters. InProc. of the ACM SIGPLAN 2003 Conf. on Prog. Language
Design and Impl., pages 278–288, June 2003.
[20] M. Anton Ertl, David Gregg, Andreas Krall, and Bernd Paysan. VMgen — a generator
of efficient virtual machine interpreters.Software Practice and Experience, 32:265–294,
2002.
[21] Paolo Faraboschi, Joseph A. Fisher, and Cliff Young. Instruction scheduling for instruc-
tion level parallel processors. InProceedings of the IEEE, 2001.
[22] S. Fink and F. Qian. Design, implementation, and evaluation of adaptive recompilation
with on-stack replacement. InIn Proceedings of the First Annual IEEE/ACM Interna-
tional Symposium on Code Generation and Optimization (CGO), March 2003. Avail-
able from: http://www.research.ibm.com/people/s/sfink/papers/
cgo03.ps.gz.
[23] Etienne Gagnon and Laurie Hendren. Effective inline threading of Java bytecode using
preparation sequences. InProc. of the 12th Intl. Conf. on Compiler Construction, volume
2622 ofLecture Notes in Computer Science, pages 170–184. Springer, Apr. 2003.
RCSfile : futureWork.lyx, v Revision : 1.4 93

BIBLIOGRAPHY
[24] Andreas Gal, Christian W. Probst, and Michael Franz. Hotpathvm: an effective jit com-
piler for resource-constrained devices. InProc. of the 2nd Intl. Conf. on Virtual Execution
Environments, pages 144–153, 2006.
[25] Kim Hazelwood and Michael D. Smith. Code cache management schemes for dynamic
optimizers. InSixth Annual Workshop on Interaction between Compilers and Computer
Architectures held in conjunction with the Eighth International Symposium on High-
Performance Computer Architecture, Feb 2002. Available from:http://www.eecs.
harvard.edu/hube/publications/interact6.pdf.
[26] J. L. Hennessy and D. A. Patterson.Computer Architecture: A Quantitative Approach.
Morgan Kaufmann Publishers, 1990.
[27] David Hiniker, Kim Hazelwood, and Michael D. Smith. Improving region selection in
dynamic optimization systems. InProc. of the 38th Intl. Symp. on Microarchitecture,
pages 141–154, Nov. 2005.
[28] Glenn Hinton, Dave Sagar, Mike Upton, Darrell Boggs, Doug Carmean, Alan Kyker,
and Patrice Roussel. The microarchitecture of the Pentium 4 processor.Intel Technol-
ogy Journal, Q1, 2001. Available from:http://www.intel.com/technology/
itj/q12001.htm.
[29] Urs Hölzle. Adaptive Optimization For Self:Reconciling High Performance With Ex-
ploratory Programming. PhD thesis, Stanford University, 1994.
[30] IBM Corporation.IBM PowerPC 970FX RISC Microprocessor, version 1.6. 2005.
[31] Intel Corporation.IA-32 Intel Architecture Software Developer’s Manual Volume 3: Sys-
tem Programming Guide. 2004.
[32] Peter M. Kogge. An architectural trail to threaded- code systems.IEEE Computer, 15(3),
March 1982.
RCSfile : futureWork.lyx, v Revision : 1.4 94

BIBLIOGRAPHY
[33] Robert Lougher. JamVM [online]. Available from:http://jamvm.sourceforge.
net/.
[34] P. Geoffrey Lowney, Stefan M. Freudenberger, Thomas J.Karzes, W. D. Lichtenstein,
Robert P. Nix, John S. O’Donnell, and John C. Ruttenberg. The Multiflow Trace Schedul-
ing compiler. The Journal of Supercomputing, 7(1-2):51–142, 1993. Available from:
http://citeseer.nj.nec.com/lowney92multiflow.html.
[35] Motorola Corporation.MPC7410/MPC7400 RISC Microprocessor User’s Manual, Rev.
1. 2002.
[36] Michael Paleczny, Christopher Vick, and Cliff Click. The Java HotSpotTM
server compiler. In 2001 USENIX Java Virtual Machine Symposium, 2001.
Available from: http://www.usenix.org/events/jvm01/full_papers/
paleczny/paleczny.pdf.
[37] Igor Pechtchanski and Vivek Sarkar. Dynamic optimistic interprocedural analysis: A
framework and an application. InProc. of the 16th ACM SIGPLAN Conf. on Object-
Oriented Programming, Systems, Languages, and Applications, pages 195–210, Oct.
2001. Available from:http://www.cs.nyu.edu/phd_students/pechtcha/
pubs/oopsla01.pdf.
[38] Ian Piumarta. Ccg: A tool for writing dynamic code generators. InOOPSLA’99 Work-
shop on simplicity, performance and portability in virtualmachine design, Nov. 1999.
Available from:http://piumarta.com/ccg.
[39] Ian Piumarta. The virtual processor: Fast, architecture-neutral dynamic code generation.
In 2004 USENIX Java Virtual Machine Symposium, 2004.
[40] Ian Piumarta and Fabio Riccardi. Optimizing direct-threaded code by selective inlining.
In Proc. of the ACM SIGPLAN 1998 Conf. on Prog. Language Design andImpl., pages
291–300, June 1998.
RCSfile : futureWork.lyx, v Revision : 1.4 95

BIBLIOGRAPHY
[41] R. Pozo and B. Miller.SciMark: a numerical benchmark for Java and C/C++., 1998.
Available from:http://www.math.nist.gov/SciMark.
[42] Alex Ramirez, Josep-Lluis Larriba-Pey, Carlos Navarro,Josep Torrellas, and Mateo
Valero. Software trace cache. InInternational Conference on Supercomputing, pages
119–126, 1999. Available from:http://citeseer.nj.nec.com/15361.html.
[43] Brad Rodriguez. Benchmarks and case studies of forth kernels. The Computer Journal,
60, 1993.
[44] Theodore H. Romer, Dennis Lee, Geoffrey M. Voelker, AlecWolman, Wayne A. Wong,
Jean-Loup Baer, Brian N. Bershad, and Henry M. Levy. The structure and performance
of interpreters. InProc. ASPLOS 7, pages 150–159, October 1996.
[45] Markku Rossi and Kengatharan Sivalingam. A survey of instruction dispatch techniques
for byte-code interpreters. Technical Report TKO-C79, Helsinki University Faculty of
Information Technology, May 1996.
[46] Eric Rotenberg, Steve Bennett, and James E. Smith. Trace cache: A low latency approach
to high bandwidth instruction fetching. InInternational Symposium on Microarchitecture,
pages 24–35, 1996.
[47] SPECjvm98 benchmarks [online]. 1998. Available from:http://www.spec.org/
osg/jvm98/.
[48] Dan Sugalski. Implementing an interpreter [online]. Available from: http://www.
sidhe.org/%7Edan/presentations/Parrot%20Implementation.ppt.
Notes for slide 21.
[49] Toshio Suganuma, Takeshi Ogasawara, Mikio Takeuchi, Toshiaki Yasue, Motohiro
Kawahito, Kazuaki Ishizaki, Hideaki Komatsu, and Toshio Nakatani. Overview of the
RCSfile : futureWork.lyx, v Revision : 1.4 96

BIBLIOGRAPHY
IBM Java just-in-time compiler.IBM Systems Journals, Java Performance Issue, 39(1),
Feb. 2000.
[50] Toshio Suganuma, Toshiaki Yasue, and Toshio Nakatani.A region-based compilation
technique for dynamic compilers.ACM Trans. Program. Lang. Syst., 28(1):134–174,
2006.
[51] Gregory T. Sullivan, Derek L. Bruening, Iris Baron, Timothy Garnett, and Saman Ama-
rasinghe. Dynamic native optimization of interpreters. InProc. of the Workshop on
Interpreters, Virtual Machines and Emulators, 2003.
[52] V. Sundaresan, D. Maier, P Ramarao, and M Stoodley. Experiences with multi-threading
and dynamic class loading in a Java just-in-time compiler. In Proc. of the 4th Intl. Symp.
on Code Generation and Optimization, pages 87–97, Mar. 2006.
[53] David Ungar, Randall B. Smith, Craig Chambers, and Urs Hölzle. Object, message, and
performance: how they coexist in Self.IEEE-COMPUTER, 25(10):53–64, Oct. 1992.
[54] Raja Vallée-Rai, Phong Co, Etienne Gagnon, Laurie Hendren, Patrick Lam, and Vijay
Sundaresan. Soot - a java bytecode optimization framework.In Proceedings of the 1999
conference of the Centre for Advanced Studies on Collaborative research, page 13. IBM
Press, 1999.
[55] Benjamin Vitale and Tarek S. Abdelrahman. Catenation andoperand specialization for
Tcl VM performance. InProc. 2nd IVME, pages 42–50, 2004.
[56] Benjamin Vitale and Mathew Zaleski. Alternative dispatch techniques for the Tcl vm
interpreter. InProceeedings of Tcl’2005: The 12th Annual Tcl/Tk Conference, Oc-
tober 2005. Available from:http://www.cs.toronto.edu/syslab/pubs/
tcl2005-vitale-zaleski.pdf.
RCSfile : futureWork.lyx, v Revision : 1.4 97

BIBLIOGRAPHY
[57] Hank S Warren, Jr. Instruction scheduling for the IBM RISCsystem/6000 processor.IBM
Systems Journals, 34(1), Jan 1990.
[58] Tom Wilkinson. The Kaffe java virtual machine [online]. Available from: http://
www.kaffe.org/.
[59] Emmett Witchel and Mendel Rosenblum. Embra: Fast and flexible machine simulation.
In Measurement and Modeling of Computer Systems, pages 68–79, 1996. Available from:
citeseer.nj.nec.com/witchel96embra.html.
[60] Mathew Zaleski, Marc Berndl, and Angela Demke Brown. Mixed mode execution with
context threading. InCASCON ’05: Proceedings of the 2005 conference of the Centre
for Advanced Studies on Collaborative research. IBM Press, 2005.
RCSfile : futureWork.lyx, v Revision : 1.4 98