Yellowknife Gold Project Feasibility Study Executive Summary
82
Volume 1 Executive Summary Yellowknife Gold Project Feasibility Study Northwest Territories, Canada Report Prepared for Report Prepared by August 21, 2012
Transcript of Yellowknife Gold Project Feasibility Study Executive Summary

Volume 1 Executive Summary Yellowknife Gold Project Feasibility Study Northwest Territories, Canada
Report Prepared for
Report Prepared by
August 21, 2012

SRK Consulting, Lyntek Incorporated, Knight Piésold Consulting Volume 1 Executive Summary – Yellowknife Gold Project Feasibility Study Page i
BCS/MLM Yellowknife_FS_Vol1_ExecSummary_250300.010_021_MLM.docx August 21, 2012
Volume 1 Executive Summary Yellowknife Gold Project Feasibility Study Northwest Territories, Canada
Tyhee Gold Corp. Suite 401 - 675 West Hastings Street Vancouver, British Columbia V6B 1N2 Canada Tel: (604) 681-2879
SRK Consulting (U.S.), Inc. 7175 West Jefferson Avenue, Suite 3000 Lakewood, CO 80235 e-mail: [email protected] website: www.srk.com Tel: +1.303.985.1333 Fax: +1.303.985.9947
SRK Project Number 250300.010 August 21, 2012 Authors and Contributors: Bret Swanson/SRK Consulting (U.S.), Inc. Eric J. Olin/SRK Consulting (U.S.), Inc. Jeff Volk/SRK Consulting (U.S.), Inc. John Tinucci/SRK Consulting (U.S.), Inc. Anthony Lowe /SRK Consulting (U.S.), Inc. Travis Leach/SRK Consulting (U.S.), Inc. Jens Lichter/Lyntek, Inc. Doug Maxwell/Lyntek, Inc. Ken Smith/Lyntek, Inc. David Grills/Lyntek, Inc. Jeff Coffin/Knight Piésold Harjinder Gill /Tyhee Gold Corp. Hugh Wilson/Tyhee Gold Corp. Valmar Pratico/Tyhee Gold Corp. Doug Levesque/Tyhee Gold Corp. Reviewed by: Bret Swanson/SRK Consulting (U.S.), Inc. Brian Briggs/Tyhee Gold Corp.

SRK Consulting, Lyntek Incorporated, Knight Piésold Consulting Volume 1 Executive Summary – Yellowknife Gold Project Feasibility Study Page ii
BCS/MLM Yellowknife_FS_Vol1_ExecSummary_250300.010_021_MLM.docx August 21, 2012
Table of Contents List of Abbreviations ....................................................................................................... vii
1 Introduction .................................................................................................................. 1
1.1 Location ............................................................................................................................................... 1
1.2 Land and Legal ................................................................................................................................... 1
1.3 Ownership ........................................................................................................................................... 2
2 Environmental and Social Responsibility .................................................................. 3
2.1 Environmental and Permitting ............................................................................................................. 3
2.2 Community Relations and Social Responsibility ................................................................................. 3
3 Geology ......................................................................................................................... 5
3.1 History ................................................................................................................................................. 5
3.2 Regional Geology ................................................................................................................................ 5
3.3 Local Geology ..................................................................................................................................... 5
3.4 Exploration and Drilling ....................................................................................................................... 6
3.5 Drilling, Quality Control and Data Verification ..................................................................................... 6
4 Resource Estimation ................................................................................................... 8
4.1 Mineral Resources .............................................................................................................................. 8
4.2 Mineral Resource Statement .............................................................................................................. 8
5 Mining ......................................................................................................................... 10
5.1 Geotechnical Mine Design Parameters ............................................................................................ 10
5.2 Mine Operations ................................................................................................................................ 13
5.2.1 Open Pit Mining ..................................................................................................................... 13
5.2.2 Underground Mining .............................................................................................................. 16
5.2.3 Underground Sustaining Capital Costs ................................................................................. 19
5.3 Mill Schedule – Open Pit, Underground and Rehandle Operations ................................................. 20
6 Reserve Statement ..................................................................................................... 22
6.1 Reserve Estimation ........................................................................................................................... 22
7 Metallurgy ................................................................................................................... 23
7.1 Test Composite Characterization ...................................................................................................... 23
7.2 Metallurgical Test Program ............................................................................................................... 23
7.3 Grindability Studies ........................................................................................................................... 23
7.4 Grind-Recovery: Gravity Concentration/Rougher Flotation .............................................................. 24
7.5 Grind-Recovery: Rougher Flotation Concentrate ............................................................................. 24
7.6 Locked-Cycle Testwork ..................................................................................................................... 24
7.7 Concentrate Cyanidation .................................................................................................................. 25
SRK Consulting, Lyntek Incorporated, Knight Piésold Consulting Volume 1 Executive Summary – Yellowknife Gold Project Feasibility Study Page iii
BCS/MLM Yellowknife_FS_Vol1_ExecSummary_250300.010_021_MLM.docx August 21, 2012
7.8 Detoxification Studies........................................................................................................................ 25
7.9 Recoverability .................................................................................................................................... 26
8 Process and Plant ...................................................................................................... 27
8.1 Design Philosophy/Design Criteria ................................................................................................... 27
8.2 Recovery Method .............................................................................................................................. 27
8.2.1 Crushing ................................................................................................................................ 27
8.2.2 Primary Ball Milling ................................................................................................................ 28
8.2.3 Rougher / Scavenger Flotation ............................................................................................. 28
8.2.4 Cleaner / Scavenger Flotation ............................................................................................... 28
8.2.5 Carbon-in-Leach Cyanidation Circuit .................................................................................... 28
8.2.6 Adsorption-Desorption-Recovery Circuit ............................................................................... 29
8.3 Process Material Balance ................................................................................................................. 29
8.4 Process Plant Water Balance ........................................................................................................... 30
8.5 Process Flow Diagrams, Piping & Instrumentation Diagrams and Electrical Single Line Diagrams 31
8.6 Process Equipment ........................................................................................................................... 31
8.7 Process Plant Operating Cost Estimate............................................................................................ 31
8.8 Process Plant Capital Cost Estimate ................................................................................................ 32
9 Infrastructure .............................................................................................................. 34
9.1 General ............................................................................................................................................. 34
9.2 Site Access ....................................................................................................................................... 34
9.3 Mine Infrastructure ............................................................................................................................ 34
9.3.1 Truck Shop ............................................................................................................................ 34
9.4 Plant Infrastructure ............................................................................................................................ 34
9.4.1 General Plant Infrastructure .................................................................................................. 34
9.4.2 Site Utilities ............................................................................................................................ 35
9.4.3 Crushing Building .................................................................................................................. 35
9.4.4 Process Equipment ............................................................................................................... 35
9.5 Security ............................................................................................................................................. 36
9.6 Site Logistics ..................................................................................................................................... 36
10 Tailings Management and Closure ........................................................................... 37
10.1 Tailings Containment Area and Tailings Management ..................................................................... 37
10.2 TCA Closure ...................................................................................................................................... 38
11 Project Implementation ............................................................................................. 39
11.1 Project Execution .............................................................................................................................. 39
11.1.1 Scope of Work ....................................................................................................................... 39
11.1.2 Engineering, Procurement and Construction Management (EPCM) Execution Schedule ... 40
11.2 Project Considerations ...................................................................................................................... 41

SRK Consulting, Lyntek Incorporated, Knight Piésold Consulting Volume 1 Executive Summary – Yellowknife Gold Project Feasibility Study Page iv
BCS/MLM Yellowknife_FS_Vol1_ExecSummary_250300.010_021_MLM.docx August 21, 2012
11.2.1 Logistics................................................................................................................................. 41
11.2.2 Weather ................................................................................................................................. 41
11.2.3 Project Engineering & Procurement Schedule ...................................................................... 42
11.2.4 Corporate Health and Safety Policy Statement..................................................................... 42
12 Operations Plan ......................................................................................................... 43
13 Schedule ..................................................................................................................... 44
14 Financial Analysis ...................................................................................................... 45
15 Opportunities and Risks ............................................................................................ 50
15.1 Land and Legal ................................................................................................................................. 50
15.2 Geology and Resources ................................................................................................................... 50
15.3 Open Pit Mining ................................................................................................................................. 51
15.4 Underground Mining.......................................................................................................................... 52
15.5 Process and Recovery ...................................................................................................................... 52
15.6 Infrastructure ..................................................................................................................................... 54
15.7 Tailings Containment Area ................................................................................................................ 54
15.8 Environment, Permits, Licenses and Authorizations ........................................................................ 55
15.9 Community Relations and Social Responsibility ............................................................................... 55
15.10 Project Implementation ..................................................................................................................... 56
15.11 Operations Plan ................................................................................................................................ 57
16 Conclusions and Recommendations ....................................................................... 58
16.1 Geotechnical Mine Design ................................................................................................................ 58
16.2 Open Pit Mining ................................................................................................................................. 58
16.3 Underground Mining.......................................................................................................................... 59
16.4 Metallurgy .......................................................................................................................................... 59
16.5 Process and Recovery ...................................................................................................................... 59
16.6 Infrastructure ..................................................................................................................................... 60
16.7 Tailings Containment Area ................................................................................................................ 61
16.8 Project Implementation ..................................................................................................................... 62
16.9 Environment, Permits, Licenses and Authorizations ........................................................................ 62
16.10 Community Relations and Social Responsibility ............................................................................... 62
16.11 Financial Modeling ............................................................................................................................ 63
Disclaimer ........................................................................................................................ 64
Copyright ......................................................................................................................... 64

SRK Consulting, Lyntek Incorporated, Knight Piésold Consulting Volume 1 Executive Summary – Yellowknife Gold Project Feasibility Study Page v
BCS/MLM Yellowknife_FS_Vol1_ExecSummary_250300.010_021_MLM.docx August 21, 2012
List of Tables Table 1.2.1: Ormsby-Nicholas Lake Property Mining Leases ........................................................................... 1
Table 1.2.2: Goodwin Lake Property Mining Leases and Mineral Claims ......................................................... 2
Table 1.2.3: Clan Lake Property Mineral Claims ............................................................................................... 2
Table 4.2.1: Mineral Resource Statement for Tyhee’s Yellowknife Gold Project, Northwest Territories, Canada: SRK Consulting (U.S.), Inc., July 1, 2012 .............................................................................. 9
Table 5.2.1.1: In-Situ Open Pit Production Schedule for Ormsby, Bruce and Clan Lake ............................... 14
Table 5.2.1.2: Proposed Open Pit Equipment Fleet ........................................................................................ 15
Table 5.2.1.3: Open Pit Mine Operating Cost ................................................................................................. 15
Table 5.2.2.2: Underground Production Schedule for Nicholas Lake and Ormsby......................................... 18
Table 5.2.2.3: Summary of Underground Operating Costs (US$) .................................................................. 19
Table 5.2.3.1: Underground Equipment Fleet ................................................................................................. 20
Table 5.3.1: Mill Production Schedule ............................................................................................................. 21
Table 6.1.1: Reserve Statement for Tyhee’s Yellowknife Gold Project, Northwest Territories, Canada: SRK Consulting (U.S.), Inc., July 28, 2012 .................................................................................................. 22
Table 7.1.1: Test Composite Head Analyses .................................................................................................. 23
Table 7.6.1: Gravity/Flotation Locked-Cycle Gold and Silver Recovery Summary ........................................ 24
Table 7.7.1: Cyanidation Test Results on Cleaner-1 Flotation Concentrates at Selected Regrind Size ........ 25
Table 7.7.2: Cyanidation Results on Cleaner-2 Flotation Concentrates at Selected Regrind Size ................ 25
Table 7.8.1: Cyanide Detoxification Results on Ormsby Master and Variability Composite ........................... 26
Table 7.9.1: Projected Gold Recoveries for Ormsby, Nicholas Lake and Clan Lake ...................................... 26
Table 8.3.1: Basic Material Balance Criteria ................................................................................................... 30
Table 8.3.2: Design Gold Recovery Values for Ormsby Type Ore ................................................................. 30
Table 8.7.1: Summary of Operating Costs ...................................................................................................... 32
Table 8.8.1: Capital Cost Summary ................................................................................................................. 33
Table 14.1: Principal Assumptions .................................................................................................................. 45
Table 14.2: LoM Capital Costs ........................................................................................................................ 46
Table 14.3: LoM Operating Cost Summary ..................................................................................................... 46
Table 14.4: Pre-Tax Financial Model Results.................................................................................................. 47
Table 14.5: Post-Tax Financial Model Results ................................................................................................ 48
Table 14.6: Project Sensitivity (NPV5%, US$000’s) ....................................................................................... 48
Table 14.7: Gold Price Sensitivity .................................................................................................................... 49
Disclaimer & Copyright Disclaimer ......................................................................................................................................................... 64
Copyright .......................................................................................................................................................... 64

SRK Consulting, Lyntek Incorporated, Knight Piésold Consulting Volume 1 Executive Summary – Yellowknife Gold Project Feasibility Study Page vi
BCS/MLM Yellowknife_FS_Vol1_ExecSummary_250300.010_021_MLM.docx August 21, 2012
List of Figures Figure 1-1: Property Location Map .................................................................................................................. 66
Figure 1-2: Ormsby – Nicholas Lake Property Mining Lease Map .................................................................. 67
Figure 1-3: Goodwin Lake Property Mining Lease and Mineral Claim Map .................................................... 68
Figure 1-4: Clan Lake Property Mineral Claim Map ........................................................................................ 69
Figure 5-1: Perspective View of Ormsby ......................................................................................................... 70
Figure 5-2: Ormsby Underground .................................................................................................................... 71
Figure 5-3: Nicholas Lake Underground Layout and Design .......................................................................... 72
Figure 7-1: Locked-Cycle Test Flowsheet ....................................................................................................... 73

SRK Consulting, Lyntek Incorporated, Knight Piésold Consulting Volume 1 Executive Summary – Yellowknife Gold Project Feasibility Study Page vii
BCS/MLM Yellowknife_FS_Vol1_ExecSummary_250300.010_021_MLM.docx August 21, 2012
List of Abbreviations The metric system has been used throughout this report. Tonnes are metric of 1,000 kg, or 2,204.6
lb. All currency is in U.S. dollars (US$) unless otherwise stated.
Abbreviation Description ° degree % percent amsl above mean sea level ARD acid rock drainage Au gold C$ Canadian Dollar CIL carbon-in-leach CoG cut-off grade CuSO4 copper sulfate DAR Developers Assessment Report DVR digital video recorder EPCM Engineering, Procurement and Construction Management FOS factor of safety FS Feasibility Study ft feet G&A General and Administrative GAC granulated activated carbon Ga billion years before present g gram g/h grams per hour g/L grams per liter g/t grams per tonne gpm gallons per minute h hour ha hectare (10,000 m2) Hz hertz ID2 inverse distance weighting I/O input and outputs k thousand kg kilogram kg/t kilogram per tonne km kilometer koz thousand ounces KP Knight Piésold and Co. kPa kilopascal kt thousand tonnes kV kilovolt kVa kilovolt ampere kW kilowatt KWh kilowatt hour kWh/t kilowatts per tonne L liter LAN local area network Lyntek Lyntek Incorporated m meter m2 square meter m3 cubic meter mm millimeter Mm3 million cubic meters Ma million years before present MCC motor control center min minute Mt million tonnes

SRK Consulting, Lyntek Incorporated, Knight Piésold Consulting Volume 1 Executive Summary – Yellowknife Gold Project Feasibility Study Page viii
BCS/MLM Yellowknife_FS_Vol1_ExecSummary_250300.010_021_MLM.docx August 21, 2012
Abbreviation Description MMER Metal Mining Effluent Regulations MVA megavolt ampere MW megawatt Na2S2O5 sodium metabisulfite NaOH sodium hydroxide NI 43-101 Canadian National Instrument 43-101 NN nearest neighbor NWT Northwest Territories oz troy ounce P&ID process and instrument diagrams PFD process flowsheet diagram PLC programmable logic controller PoE point-of-entry psf pounds per square foot QA/QC Quality Assurance/Quality Control RoM run-of-mine RPM revolutions per minute SRK SRK Consulting (U.S.), Inc. SO2 sulfur dioxide st short ton st/d short tons per day TCA tailings containment area t metric tonne (dry) t/d tonnes per day t/h tonnes per hour t/m3 tonnes per cubic meter t/y tonnes per year Tyhee Tyhee Gold Corporation and/or Tyhee NWT Corporation µm micron US$ United States Dollar V volt VFD variable frequency drive VOIP voice-over internet protocol wt% weight percent y year YGP Yellowknife Gold Project

SRK Consulting, Lyntek Incorporated, Knight Piésold Consulting Volume 1 Executive Summary – Yellowknife Gold Project Feasibility Study Page 1
BCS/MLM Yellowknife_FS_Vol1_ExecSummary_250300.010_021_MLM.docx August 21, 2012
1 Introduction Tyhee Gold Corp., through its 100% owned subsidiary, Tyhee, (both referred to herein as Tyhee),
has commissioned a Feasibility Study (FS) on the Yellowknife Gold Project (YGP or the Project)
located in the Northwest Territories (NWT), Canada. The FS has been prepared based on technical
and economic input by a team of consultants consisting of SRK Consulting (U.S.), Inc., (SRK),
Lyntek Incorporated (Lyntek) and Knight Piésold and Co. (KP) and EBA (collectively referred to as
the Consultants). The FS consists of 14 Volumes, of which this is Volume 1 Executive Summary.
1.1 Location The YGP area straddles National Topographic System (NTS) map sheets 85J/16, 85O/01, 85P/04
and 85P/05 extending 44 kilometers (km) north-northeast from Clan Lake to Nicholas Lake. The
Project base of operations is located at latitude 63° 11’ North, longitude 113° 55’ west at the
Discovery Camp 90 km north of the City of Yellowknife (Figure 1-1).
1.2 Land and Legal The YGP is located on public lands in the NWT, Canada. For the most part, Tyhee purchased the
mineral rights in transactions with individuals and a public company for value payable either in cash
or common stock of Tyhee and royalty interest. In every instance, Tyhee has fully paid the
consideration and the transactions have been properly closed. In few instances, Tyhee acquired the
mineral rights by staking the land itself.
In one instance, advance royalty is payable annually; this payment has been made.
In every instance, an annual lease fee is payable to Canada, and in each instance, the fees are up to
date and mineral rights are in good standing. The YGP is made up of the Ormsby-Nicholas Lake
Property, Goodwin Lake Property and the Clan Lake Property (Figure 1-2).
Table 1.2.1: Ormsby-Nicholas Lake Property Mining Leases
Name Lease Owner Issue Date Anniversary Date Acres NIC 1 ML 3542 Tyhee NWT Corp 3/09/1996 3/09/2017 329.0 NIC 2 ML 3543 Tyhee NWT Corp 3/09/1996 3/09/2017 1,312.0 SAINT 1 ML 3774 Tyhee NWT Corp 2/27/1998 2/27/2019 1,809.0 SAINT 2 ML 3775 Tyhee NWT Corp 2/27/1998 2/27/2019 167.0 SAINT 3 ML 3776 Tyhee NWT Corp 2/27/1998 2/27/2019 321.0 BUSH 2 ML 3926 Tyhee NWT Corp 7/12/1998 7/12/2019 1,913.0 BUSH 3 ML 3927 Tyhee NWT Corp 7/12/1998 7/12/2019 2,059.0 BUSH 4 ML 3928 Tyhee NWT Corp 7/12/1998 7/12/2019 579.0 BUSH 5 ML 3929 Tyhee NWT Corp 7/12/1998 7/12/2019 486.0 PIG 1 ML 3930 Tyhee NWT Corp 3/23/1999 3/23/2020 1,423.0 GMC 1 ML 4236 Tyhee NWT Corp 2/12/2002 2/12/2023 1,706.0 JIM 2 ML 4239 Tyhee NWT Corp 12/27/2001 12/27/2022 1,214.0 SAINT 4 ML 4547 Tyhee NWT Corp 01/21/2003 01/21/2024 1,178.0 SAINT 5 ML 4548 Tyhee NWT Corp 01/21/2003 01/21/2024 1,154.0 Total 15,650.0
The Ormsby-Nicholas Lake property was purchased in 2001 from David R. Webb and GMD
Resources Corporation (GMD) for cash consideration and 2¼% NSR royalty payable to each of the
vendors on the entire property. In 2003 royalty obligation to GMD was eliminated by mutual

SRK Consulting, Lyntek Incorporated, Knight Piésold Consulting Volume 1 Executive Summary – Yellowknife Gold Project Feasibility Study Page 2
BCS/MLM Yellowknife_FS_Vol1_ExecSummary_250300.010_021_MLM.docx August 21, 2012
agreement. Non-refundable advance royalty in the amount of US$20,000 is paid on the remaining
royalty annually.
The Goodwin Lake property is composed of the leases and a claim as presented in Table 1.2.2 and
Figure 1-3.
Table 1.2.2: Goodwin Lake Property Mining Leases and Mineral Claims
Name Lease Claim Owner Issue Date Anniversary Date Acres Nak 1 ML 5125 Tyhee NWT Corp 12/15/1999 12/15/2030 309.90 Nak 2 ML 5125 Tyhee NWT Corp 12/15/1999 12/15/2030 103.30 Nak 4 ML 5125 Tyhee NWT Corp 3/27/2000 3/27/2031 731.10 Vad F85947 Tyhee NWT Corp 11/20/2006 11/20/2016 503.59 Total 1,647.89
The Goodwin Lake property was purchased in 2006 from Lane Dewar, an independent prospector;
the consideration was Tyhee common stock and 2% NSR royalty interest. Tyhee has the option of
reducing the royalty interest by a half for a one-time payment.
The Clan Lake property is composed of the claims presented in Table 1.2.3 and Figure 1-4.
Table 1.2.3: Clan Lake Property Mineral Claims
Name Claim Owner Issue Date Anniversary Date Acres Nose F85948 Tyhee NWT Corp 11/27/2006 11/27/2016 774.50 CL1 F85949 Tyhee NWT Corp 2/20/2007 2/20/2017 1,003.00 CL2 F85950 Tyhee NWT Corp 2/20/2007 2/20/2017 2,530.80 CL3 F85962 Tyhee NWT Corp 2/20/2007 2/20/2017 1,446.20 CL4 F85961 Tyhee NWT Corp 2/20/2007 2/20/2017 619.80 CL5 F97890 Tyhee NWT Corp 4/20/2007 4/20/2017 309.90 CL6 K12403 Tyhee NWT Corp 9/22/2008 9/22/2018 1,084.60 CL7 F97883 Tyhee NWT Corp 8/31/2009 8/31/2019 103.30 CL8 F97884 Tyhee NWT Corp 8/31/2009 8/31/2019 826.40 CL9 K13789 Tyhee NWT Corp 9/12/2011 9/12/2013 1,446.20 CL10 K13790 Tyhee NWT Corp 9/12/2011 9/12/2013 206.60 Total 10,381.55
Tyhee acquired the property by staking the mineral claims from 2006 through 2011.
Annual fees payable to Canada are current to the anniversary date for all of the mineral claims;
Tyhee has performed the required work for all the mineral claims and the returns are current.
1.3 Ownership The Canada Mining Regulations of the Territorial Lands Act govern the administration and
dispositions of minerals belonging to Her Majesty in right of Canada under all lands forming part of
the NWT.
The YGP consists of 17 mining leases and 12 mineral claims that total 27,675 acres in the South
Mackenzie Mining District of the NWT, Canada. The registered owner of all mining leases and
mineral claims is Tyhee NWT Corp, a 100% owned subsidiary of Tyhee Gold Corp.
Tyhee NWT Corp currently holds Land Use Permits and a Water License that allows the company to
conduct advanced exploration activities (both surface and underground), to use water and dispose of
wastes .
SRK Consulting, Lyntek Incorporated, Knight Piésold Consulting Volume 1 Executive Summary – Yellowknife Gold Project Feasibility Study Page 3
BCS/MLM Yellowknife_FS_Vol1_ExecSummary_250300.010_021_MLM.docx August 21, 2012
2 Environmental and Social Responsibility
2.1 Environmental and Permitting The YGP will be developed using proven environmental management plans to ensure conformance
with applicable environmental regulations and guidelines, ensuring that it is environmentally sound.
Comprehensive environmental baseline studies have been carried out by Tyhee and its consultants
between 2004 and 2011. In all cases these, studies have indicated that any potential adverse
environmental effects can be satisfactorily mitigated, and that progressive reclamation and closure
activities will return the mine and processing site to a landscape comparable to the surrounding area.
Water management plans have been specifically designed for the YGP site to contain potentially
contaminated water within a controlled Tailings Containment Area (TCA). Excess storage capacity
allowances provide for operational flexibility and contingencies.
Water treatment facilities include a potable water treatment plant, a sewage treatment plant, a
cyanide detoxification plant, and a TCA. These facilities are expected to produce water suitable for
discharge into the downstream receiving water bodies. No planned discharges are expected from
the TCA; however, should discharges be required, then water discharged from the TCA will meet the
standards set out in the Metal Mining Effluent Regulations (MMER) or as specified in the Project’s
water license.
Following implementation of mitigation measures, no effects on existing aquatic resources are
expected from mining and milling operations at the YGP, and monitoring of Narrow Lake is expected
to be included in the YGP water license. Although the YGP is located within the Bathurst caribou
herd’s winter range, it is outside known migration corridors. Therefore, the YGP is not expected to
affect the migratory routes of the Bathurst caribou.
The YGP will incorporate a program of progressive reclamation that minimizes costs and allows
timely monitoring of performance. Upon closure, some waste rock may be used as backfill material
for the Ormsby pit and Nicholas Lake underground mining operations; other waste rock will remain
in-situ. For closure, the waste rock material is assumed to be resistant to erosion and rilling at the
design slope of 37o (1.3H:1.0V) and will not be regarded. Natural, volunteer re-vegetation is
assumed to establish on the Waste Rock Facility (WRF) surfaces. The WRF’s will not need to be
covered as a result of the operational management of the potential acid generating (PAG) materials,
and the gradation indicates gravel and cobble size material will not generate fugitive dust. A series
of diversion ditches will collect surface runoff from the waste rock storage areas and redirect it to
settling ponds or other appropriate receiving area.
All operating permits and licenses will be issued by the Mackenzie Valley Land and Water Board and
Tyhee does not foresee any concerns in this regard, allowing the YGP to proceed as scheduled in
the FS.
2.2 Community Relations and Social Responsibility The development of the YGP is expected to provide significant new employment and business
benefits for indigenous people and regional communities, the NWT and Canada. The YGP is
located within the Chief John Drygeese traditional Territory of the Akaitcho Region of the NWT,

SRK Consulting, Lyntek Incorporated, Knight Piésold Consulting Volume 1 Executive Summary – Yellowknife Gold Project Feasibility Study Page 4
BCS/MLM Yellowknife_FS_Vol1_ExecSummary_250300.010_021_MLM.docx August 21, 2012
where the Yellowknives Dene First Nation (YKDFN) is one of the primary aboriginal groups with
which that Tyhee liaises. The North Slave Métis Alliance is another indigenous people that may
benefit from the YGP.
The development of the YGP is expected to provide significant new employment and business
benefits, during its projected 15-year mine life.
It is estimated that the YGP will employ up to 265 people depending on the mine phase
(construction, operations, or reclamation). During construction approximately 75 workers (not
including contractors – estimated at 200) will be required, with up to 20% of the workforce coming
from the NWT.
During operations, average personnel requirements are estimated at 220 people per year, including
120 people on site. During the operations phase, up to 50% of the workforce could be from the
NWT.
In addition to the employment and business benefits, Tyhee’s Social Responsibility Statement will
guide management, operations personnel and all contractors to operate within the statement’s
guiding principles.
SRK Consulting, Lyntek Incorporated, Knight Piésold Consulting Volume 1 Executive Summary – Yellowknife Gold Project Feasibility Study Page 5
BCS/MLM Yellowknife_FS_Vol1_ExecSummary_250300.010_021_MLM.docx August 21, 2012
3 Geology
3.1 History The YGP commenced with the acquisition by Tyhee of the Discovery Mine property (ML GMC1) from
GMD and the Nicholas Lake property from David R. Webb. The Discovery Mine property was
acquired for staged payments totaling US$265,000 and the Nicholas Lake property was purchased
for payments totaling US$225,000. Both properties have been paid in full. Each previous owner
initially retained a sliding scale net smelter royalty. Tyhee purchased the royalty held by GMD for
US$75,000 in August 2003. The purchases marked the first-ever consolidated ownership of the two
properties despite exploration and development since the 1940’s. Subsequently, Tyhee acquired the
Clan Lake and Goodwin Lake mineral claims by staking.
Total production from the Discovery Mine during its operation between 1950 and 1969 is estimated
to be 1,023,550 oz of gold from 1,018,800 short tons of ore. The average production grade of
slightly more than 1 oz gold per short ton is generally considered the highest average grade of gold
produced in the Yellowknife gold district.
3.2 Regional Geology The YGP properties are located within the southern Slave Province of the Precambrian Shield and
more precisely within the Archean aged Yellowknife Basin. The Slave Province is described as an
Archean craton, which covers a major portion of the northwest Canadian Shield and consists of
variable amounts of granitic-gneissic, metasedimentary and metavolcanic lithologies. The Slave
province is bounded by paleoproterozoic orogenic belts to the east and west. Development of the
Slave Province is a result of the tectonic evolution of northern Canada which involved a series of
accretionary events alternating with periods of continental extension
The Yellowknife Greenstone Belt is the southernmost exposed greenstone belt of those that occur
throughout the Slave Province. The Yellowknife Greenstone Belt trends north-northeasterly from
Yellowknife Bay for approximately 100 km. Southern portions of the greenstone belt are
continuously exposed and well researched, whereas more northern extents are less well exposed
and studied. Lithologies within the belt define a homocline which dips steeply to the east. These
sequences of greenstone consist of greenschist to amphibole facies metamorphosed mafic to felsic
volcanic rocks below a thick sequence of related metasedimentary rocks termed the Yellowknife
Basin.
The geological units of the Yellowknife Basin that are the subject of this report include, from north to
south: the Nicholas Lake granodiorite-quartz diorite intrusion; the mafic volcanics of the Giauque
Lake Formation; the gabbro sill at Goodwin Lake; and, the bimodal mafic-intermediate volcanics of
the Clan Lake Complex. All of these lithologies are hosted and deposited within, and/or
subsequently buried by, the metasediments of the Burwash Formation.
3.3 Local Geology Burwash Formation lithologies consist predominantly of variably laminated and interbedded
greywacke-mudstone turbidite sequences with syn-formational volcanic vent sequences such as
those seen at Clan Lake and Giauque Lake, among others. Bedding thickness ranges from the

SRK Consulting, Lyntek Incorporated, Knight Piésold Consulting Volume 1 Executive Summary – Yellowknife Gold Project Feasibility Study Page 6
BCS/MLM Yellowknife_FS_Vol1_ExecSummary_250300.010_021_MLM.docx August 21, 2012
millimeter scale to over 8 meters (m). With regional tectonic activity and orogenesis, the lithologies
of the Burwash Formation were compressed, thickened, and complexly folded between circa 2650
and 2580 Ma, with a peak in crustal anatexis between 2595 and 2585 Ma that resulted in numerous
granitoid intrusive and diabase dike swarm events. It is postulated that the various gold deposits
were formed during these orogenic events. Hydrothermal alteration including silicification,
sericitization and other minor phases can be seen throughout the Burwash Formation. Quartz
veining and ductile shearing are common in areas of significant large scale regional tectonic
structural trends. Gold mineralization within the Burwash Formation is typically associated with
ductile to brittle shear zones and replacement deposits with variable proportions of arsenopyrite,
pyrrhotite, pyrite, sphalerite, chalcopyrite, and galena. Gold deposits to date occur near the isograd
defining greenschist to amphibolite grade metamorphism.
3.4 Exploration and Drilling Diamond drill programs on the Nicholas Lake deposit totals 27,590 m in 141 holes. In 1994, a
previous operator developed the Nicholas Lake decline for 820 m of underground development with
a 3,000 tonne (t) bulk sample excavated, which is stored on surface. The Nicholas Lake portal is
currently flooded and the portal barricaded.
Diamond drill programs on the Ormsby and Bruce deposits total 157,570 m in 707 drill holes, both
surface and underground. Total underground development by Tyhee is 959 m of decline, 531 m of
level development and 89 m of raise. The decline is currently flooded but was pumped out in 2011
to allow inspection by SRK and KP personnel as part of this FS. A bulk sample of approximately
7,000 t was excavated from two subdrifts and stored on surface which was used in part for bulk
metallurgical sampling.
Diamond drill programs on the Goodwin Lake property total 5,934 m in 28 holes and on the Clan
Lake property drilling has totaled 40,515 m in 185 holes.
Tyhee conducted detailed mapping and sampling programs on each of the properties.
3.5 Drilling, Quality Control and Data Verification Quality Assurance/Quality Control (QA/QC) Procedures
Quality Control (QC) procedures and results made available to SRK by Tyhee include documentation
of inter-laboratory check assay results, blank sample assay results, standard sample results,
duplicate pulp assay results and duplicate coarse reject assay results. Pulps from samples were
regularly submitted to ALS Chemex of North Vancouver, BC, to verify Acme Laboratories’ assay
results.
Tyhee maintains a separate series of spreadsheets containing sample information for each drill hole.
Records of blanks, standards and duplicates are kept as part of those spreadsheets. The sample
interval data and coded geological data are compiled into a master Microsoft Access database for
each deposit for the purpose of QA/QC monitoring. The QC data is compiled into a separate
database for analysis. QC samples (blanks, repeats and lab standards) were inserted into the
sample stream approximately every 20 to 50 m. Tyhee compiled and analyzed QC data for all
assays conducted from 2004 to the present. Statistics, graphs and results of selected Ormsby
analyses were audited by SRK and are discussed in more detail below. QC samples (blanks,

SRK Consulting, Lyntek Incorporated, Knight Piésold Consulting Volume 1 Executive Summary – Yellowknife Gold Project Feasibility Study Page 7
BCS/MLM Yellowknife_FS_Vol1_ExecSummary_250300.010_021_MLM.docx August 21, 2012
repeats and lab standards) were inserted by the laboratory into the sample stream approximately
every 20 to 50 m. Tyhee requested specific pulp repeats and reject repeats in addition to the normal
laboratory repeats. Statistics, graphs and results of analyses compiled by Tyhee between 2004 and
2011 were reviewed by SRK. Based on this review of the results of the QA/QC programs
implemented by Tyhee during the period 2004 to 2011, SRK is of the opinion that the data provided
is reliable, and suitable for use in resource estimation.
Data Verification
SRK conducted validation of the data for the five deposit areas using random manual checks of 10%
of the database against the original certificates provided by Tyhee. The 10% random assay
comparisons were conducted for gold for 13,503 sample intervals. The overall error rate was
extremely low (72 data entry errors). Based on this analysis, SRK is of the opinion that the data is of
high quality, and suitable for resource estimation.
SRK Consulting, Lyntek Incorporated, Knight Piésold Consulting Volume 1 Executive Summary – Yellowknife Gold Project Feasibility Study Page 8
BCS/MLM Yellowknife_FS_Vol1_ExecSummary_250300.010_021_MLM.docx August 21, 2012
4 Resource Estimation
4.1 Mineral Resources SRK conducted a mineral resource estimate of the Tyhee’s YGP, which comprises the Ormsby,
Bruce, Nicholas Lake, Clan Lake and Goodwin Lake deposits using the data from both the historic
drilling and Tyhee’s drilling from 2003 to 2011. A database was compiled using data from 980 core
holes, with collar, survey, geological and assay information, containing a total of 134,033 m of non-
zero assayed intervals.
In the process of completing the resource estimate update, SRK validated and verified the database,
interpretation and available data. The block dimensions selected for the open pit models were 3.0 m
x 3.0 m x 3.0 m, and are based on the existing drilling pattern, spatial distribution and mine planning
considerations. The Nicholas Lake model, which is considered amenable to underground mining,
was constructed using a block size of 1.5 m x 1.5 m x 1.5 m. The resource estimate was
interpolated using Maptek Vulcan™ (Vulcan) software, the inverse distance weighting method (ID2)
and nearest neighbor (NN) methods for model validation. No significant discrepancies exist between
the methods and values obtained from ID2 have been used for the resource tabulation.
The ID2 block models for Ormsby, Bruce, Clan Lake, and Goodwin Lake were exported to
Gemcom™ Whittle (Whittle) software for pit optimization, based on the Lerchs-Grossman 3D
algorithm. The optimized pit shells were generated by SRK using Measured, Indicated and Inferred
resources. Various economic parameters, such as mining and processing, General and
Administrative (G&A) costs, gold recovery and pit slope angle, were used as input parameters for the
resource pit shells. All open pit resources are stated above a 0.50 grams per tonne (g/t) gold cut-off.
Additional potentially mineable resources are also stated at the Ormsby, Bruce, Clan Lake and
Nicholas Lake deposits. The underground resources are stated above a 1.50 g/t gold cut-off.
The mineral resources for the Tyhee YGP have been estimated by SRK at 27,115 thousand tonnes
(kt) grading an average of 1.97 g/t gold classified as Measured and Indicated mineral resources; with
an additional 5,744 kt grading an average of 2.62 g/t gold classified as Inferred mineral resources.
The mineral resources are stated above are at a 26.0 g/t silver equivalent cut-off and contained
within a potentially economically mineable open pit.
The mineral resources are reported in accordance with CSA, NI 43-101 standards and have been
estimated in conformity with generally accepted CIM “Estimation of Mineral Resource and Mineral
Reserves Best Practices” guidelines.
4.2 Mineral Resource Statement The effective date of this mineral resource estimate is July 1, 2012 and is based on data received by
SRK in August 2011. The mineral resource statement for the Project is presented in Table 4.2.1.

SRK Consulting, Lyntek Incorporated, Knight Piésold Consulting Volume 1 Executive Summary – Yellowknife Gold Project Feasibility Study Page 9
BCS/MLM Yellowknife_FS_Vol1_ExecSummary_250300.010_021_MLM.docx August 21, 2012
Table 4.2.1: Mineral Resource Statement for Tyhee’s Yellowknife Gold Project, Northwest Territories, Canada: SRK Consulting (U.S.), Inc., July 1, 2012
Deposit Type Deposit Area Resource Category
Quantity(000’s)
AverageGrade
Contained Metal (000’s)
Tonnes Au (g/t) Au Oz
Open Pit
Ormsby(2)(3) Measured 7,339 1.59 376 Subtotal Measured 7,339 1.59 376 Ormsby(2)(3)
Indicated 13,295 1.68 718
Bruce(2)(3) 749 1.59 38 Clan Lake(2)(3) 1,266 1.68 69 Subtotal Indicated 15,310 1.68 825 Subtotal Measured and Indicated 22,649 1.65 1,201 Ormsby(2)(3)
Inferred
218 1.23 9 Bruce(2)(3) 60 1.56 3 Clan Lake(2)(3) 1,964 2.46 155 Goodwin Lake(2)(3) 875 1.15 32 Subtotal Inferred 3,117 1.99 199
Underground
Ormsby(4)
Indicated
1,662 3.30 176 Bruce(4) 440 3.17 45 Clan Lake(4) 110 2.77 10 Nicholas Lake(4) 2,255 3.91 283 Subtotal Indicated 4,466 3.58 514 Ormsby(4)
Inferred
113 2.89 11 Bruce(4) 71 2.47 6 Clan Lake(4) 1,784 2.80 161 Nicholas Lake(4) 689 5.00 111 Subtotal Inferred 2,658 3.37 288
All Total Measured and Indicated 27,115 1.97 1,715 Total Inferred 5,774 2.62 487
(1) Mineral Resources are not Mineral Reserves and do not have demonstrated economic viability. There is no certainty that all or any part of the Mineral Resources estimated will be converted into Mineral Reserves.
(2) Open pit resources stated as contained within a potentially economically minable open pit above a 0.50 g/t Au cut-off. (3) Pit optimization is based on an assumed gold price of US$1,500/oz, metallurgical recovery of 90%, mining cost of
US$2.00/t and processing and G&A cost of US$23.00/t. (4) Underground resources stated as contained within potentially economically minable gold grade shapes above a 1.50 g/t
Au cut-off. (5) Mineral resource tonnage and contained metal have been rounded to reflect the accuracy of the estimate, and numbers
may not add due to rounding. (6) Mineral resource tonnage and grade are reported as undiluted and reflect a potentially minable bench height of 3.0m (7) Contained Au ounces are in-situ and do not include metallurgical recovery losses (8) Mineral resources are inclusive of Mineral Reserves

SRK Consulting, Lyntek Incorporated, Knight Piésold Consulting Volume 1 Executive Summary – Yellowknife Gold Project Feasibility Study Page 10
BCS/MLM Yellowknife_FS_Vol1_ExecSummary_250300.010_021_MLM.docx August 21, 2012
5 Mining Mining will be a combination of traditional open pit truck and shovel operations at Ormsby, Bruce
Lake and Clan Lake, combined with underground operations at Nicholas Lake and Ormsby. SRK
has evaluated previous work conducted by EBA who prepared a Pre-feasibility Study of the
Yellowknife Gold Project dated July 22, 2010 (PFS) and recommended new and appropriate
geotechnical parameters that were utilized in both open pit and underground design. Project
economics and metallurgical recoveries used for mine design vary from those published in the final
economic model, although no material differences were encountered. A complete first principle work
up of operation and capital cost estimates for both underground and open pit operations was
completed. SRK is of the opinion the mine plans are achievable and adequately costed for the
purpose of this FS.
5.1 Geotechnical Mine Design Parameters All geotechnical data used for the design is from previous prefeasibility study work. No new field
data has been collected and no new laboratory testing has been performed for this work. The raw
data and summarized data have been reviewed and found to be reasonably relied on for
recommending geotechnical design parameters for this FS.
Between 2006 and 2010, 50 geotechnical holes (totaling over 6,000 m) were drilled at Ormsby and
Nicholas Lake, 17 of which were oriented core. Ormsby has the most quantitative data, followed (in
descending order) by Nicholas Lake, Bruce and Clan Lake. Drill holes were located in a variety of
key areas including the Ormsby and Nicholas Lake proposed mine sites. The rock quality in this
region is generally good. Open pit and underground mine design parameters are based on mean
values minus one standard deviation of rock mass strengths. Geotechnical parameters have been
assessed for three pit areas (Ormsby, Clan Lake and Bruce resources) and two underground areas
(Nicholas Lake and Ormsby). Ormsby required the highest level of confidence because its open pit
resource is deep and its underground resource is particularly difficult due to its low dip angle.
The pit design aims to achieve the closest match to the optimal pit shells from the mine optimization
process. Due to the practical considerations of a mine design considerations, such as location of
ramps, the design will not exactly match the Lerch-Grossman optimized pit shell. The optimization
process allows for the ramp in the overall slope angle, but does not allow for it specific placement.
Other parameters that influence pit design include:
The open pit mining has not made allowances for dilution because the geology does not
have a distinct grade boundary and the planned mining block makes the cut-off grade (CoG)
even though parts of a block may be below the CoG.
The overall pit slopes vary depending on ramp locations around the pits and, in areas where
the maximum pit angle is not met; additional catch berms have been included.
The underground mining has allowed for 5% dilution at Nicholas Lake due to the near-
vertical hangingwall in stopes, and 9% at Ormsby due to the unfavorable low-angle dip of the
stopes.
Underground mining using modified longhole (Ormsby) and longhole (Nicholas Lake) stoping
methods.

SRK Consulting, Lyntek Incorporated, Knight Piésold Consulting Volume 1 Executive Summary – Yellowknife Gold Project Feasibility Study Page 11
BCS/MLM Yellowknife_FS_Vol1_ExecSummary_250300.010_021_MLM.docx August 21, 2012
Pit Design Parameters and Stability
The Ormsby pit is the deepest of the three designed pits. The target overall slope angle for the
Ormsby pit is 50º with an inter-ramp angle of 55º, depending on the rock mass domain. A total of six
domains have been identified as determined by pit wall exposure direction and rock type. Overall
slopes angles, which control global pit wall stability, range from 49° to 53.2°. The wall height around
the pit ranges from 304 to 371 m, which is considered a relatively deep pit by industry standards.
Stability analyses have been performed in all six domains using a limit equilibrium Slide program.
Assuming lower rock mass strength parameters to account for uncertainties in rock quality, global
stability and local inter-ramp bench stability have been analyzed. Cases were examined assuming
static (long-term equilibrium) and dynamic (quasi-static earthquake) conditions, and assuming
saturated, dewatered and dry conditions. Results indicate that under the least favorable conditions
(dynamic and saturated), all domains have a factor of safety (FOS) greater than 1.8, which is more
stable than the minimum 1.3 criteria. The pit is predicted to be stable.
These analyses assume gravitational overburden stresses. Published data on Canadian Shield
stresses suggest the horizontal stresses to be about 2.0 to 2.5 times the vertical stress. However,
the hydrogeologic characterization indicates well inflow of about 250 gallons per minute (gpm) from
fractures, which suggests the in situ horizontal stresses are not unusually elevated and the assumed
lithostatic stresses are reasonable for this level of analysis. Additional numerical modeling stability
analyses are recommended prior for final design, which can explicitly simulate the effects of
groundwater pressure and pre-mining in situ stresses.
There is a potential upside for steepening the overall pit walls by 3° to 5° degrees. This would lower
the overall FOS closer to the minimum 1.3 criteria, but would allow deepening the pit to recover
some ore via less expensive open pit operations rather than the more expensive underground
operations.
Due to a lower geotechnical understanding of the Clan Lake and Bruce Lake deposits, the overall
slope angle have been targeted to 50º. Locally, the overall angle will depend on the ramp location
and in some cases is 5° to 8° steeper. Clan Lake pit wall rock mass is situated in a competent
andesite and the Bruce Lake pit wall rock is in a competent amphibolite. At about 100 m, these pits
are significantly shallower than the Ormsby pits and hence more stable because of the similar design
criteria. The limit equilibrium stability analysis results indicate a FOS greater than 4.0 under the least
favorable conditions (dynamic and saturated) for both the pits. These pits are predicted to be stable.
More exploration drilling should be conducted at Clan Lake and Bruce Lake to delineate the extents
of the rock quality along strike and at depth. The additional data will support estimated pit slope
geometry and can be used to examine kinematic block stability of benches due to fracture
intersections.
Underground Mine Design Parameters and Stability
The orebody at Nicholas Lake is found in near vertical veins, which can be mined using a longhole
stoping method. The mining thickness will range from 2 to 24 m wide, with an average of 4 m wide.
Sill heights have been established at 20 m, which gives an open hangingwall of 23 m using a 3 m in-
stope mining height. The length of stopes have been established using an allowable hydraulic
radius (open stope area divided by perimeter) that depends on the rock quality and using an
empirical design method. If the stopes were to remain open after mining, then sill pillars and dip

SRK Consulting, Lyntek Incorporated, Knight Piésold Consulting Volume 1 Executive Summary – Yellowknife Gold Project Feasibility Study Page 12
BCS/MLM Yellowknife_FS_Vol1_ExecSummary_250300.010_021_MLM.docx August 21, 2012
pillars would be required to prevent collapse of the hangingwall, but at the planned depths of 20 to
290 m, significant ore would be left unmined. To minimize the remnant ore left unmined, backfilling
stopes will reduce or eliminate the need for pillars.
The following geotechnical design criterion has been used for the stopes at Nicholas Lake:
Cemented rockfill will be used in all primary stopes (i.e., 1, 3, 5 sequence where possible);
Uncemented rockfill can be used in secondary stopes where no mining adjacent to backfill is
planned;
The assumed cement quantity in the rockfill is 4% by weight at stope ends adjacent to
sequential stope (i.e., about 25% rockfill will be cemented);
Mining sequence is overhand progressing upwards;
Sill pillars are defined where deeper mining meets shallower mining such that pillar
dimensions are driven by stress at depth (pillar load divided by rock strength) and pillar
slenderness (pillar height to width ratio);
Mining infrastructure should be kept 20 m from mining;
Dilution of 5% has been included to account for overbreak and localized hangingwall falls of
ground;
Mining sequence should be from hangingwall south and west to footwall on north and east;
and
No abutment pillars are necessary where nearest mining is at least 2.0 times the mining
width away (i.e., unmined rock serves as natural abutment pillar).
The mineable orebody at Ormsby is smaller than at Nicholas Lake because most of the Ormsby ore
is mined via open pit method. Underground mining at Ormsby is planned using modified longhole
because the ore dips at about 35° to 45°. This dip is unfavorable for hangingwall stability because a
blocky rock mass is least stable under low-stress gravitational loading conditions (i.e., flatter or
steeper is more stable and easier to mine). The objective to maintaining stability in this type rock
mass is to keep openings small and backfill as soon as practicable.
The ore thickness ranges from 3 to 6 m wide with an average of 4 m width. Sill heights have been
established at 9 m which gives an open hangingwall of 15 m using a 3 m in-stope mining height for a
45° dip of the orebody. Stope lengths have been established using an allowable hydraulic radius.
Backfilling stopes is planned, eliminating the need for leaving pillars that contain ore.
The following geotechnical design criterion has been used for the stopes at Ormsby:
Stopes shallower than 40° will be mined using a cut and fill method, unless footwall cutouts
can be used to allow breasting to 4.5 m height;
Uncemented rockfill will be used in all cut and fill stopes and, in modified longhole stopes, an
assumed cement quantity of 4% by weight is used at stope ends adjacent to sequential
stope;
No sill pillars are anticipated because mining areas are relatively isolated;
Mining infrastructure should be kept 20 m from mining; and
Dilution of 9% has been included to account for overbreak and localized hangingwall falls of
ground where 30% of the time instability will be deeper into the hangingwall.
Since the rock mass at Ormsby and Nicholas Lake are similar, ground support has been specified to
be similar at both locations. It is anticipated that a variety of support methods and arrangements will

SRK Consulting, Lyntek Incorporated, Knight Piésold Consulting Volume 1 Executive Summary – Yellowknife Gold Project Feasibility Study Page 13
BCS/MLM Yellowknife_FS_Vol1_ExecSummary_250300.010_021_MLM.docx August 21, 2012
be used depending on local ground conditions (i.e., heavier support will be used in less favorable
ground and lighter support in more favorable ground).
Development drifts are planned to be 4 m wide x 3 m high. It is anticipated that, in long-term access
entries in good rock, mass quality will be supported by 2 m long mechanical anchor bolts spaced 1.2
m apart. In poor ground conditions (10% of the development), bolt spacing will be reduced to 0.9 m
and chain-link mesh will be required. In very good ground conditions (10% of the development) spot
bolting can be used and, in limited-use entries, the use of split sets will provide a more cost effective
support.
5.2 Mine Operations Mining operations analyzed in this FS include Ormsby Open Pit, Ormsby Underground, Nicholas
Lake Underground, Clan Lake Open Pit and Bruce Lake Open Pit. The Ormsby site will be the
destination for all the open pit and underground ore and the only external waste dump outside of
Ormsby will be located at Clan Lake. Technical staff will be located at Ormsby for all mine
operations along with maintenance and general housing. Small camps may be located at Nicholas
Lake and Clan Lake if the need arises.
5.2.1 Open Pit Mining
Ormsby Open Pit
While the Ormsby open pit is the largest operation in terms of ore delivered, capital cost
requirements and manpower, it contributes the greatest number of ounces and highest throughput
rates to the mill.
The Ormsby open pit is situated in gentle terrain surrounded by numerous small lakes, sparse
vegetation and barren rock. The open pit size and economics have been maximized through the
process of pit optimization, mine design and grade bin scheduling to supply 4,000 t/d of mill feed.
The ultimate pit is 600 m from east to west, 1,130 m north to south with a maximum high-wall height
of 350 m and volume of 64.4 Mm3. At a cut-off of 0.6 g/t Au, the overall strip ratio (waste:feed) of the
pit is estimated at 10.1 containing 984 koz of proven and probable gold reserves.
The Ormsby production schedule entails nine years of in-situ mining that provides five grade bin ore
streams for mill feed selection. The premise for the production schedule is to maintain a consistent
mine production fleet that brings forward high grade material and defer lower grade material to the
end of the mine life. This incurs a re-handle penalty but ensures low grade ore does not displace
higher value ore during the capital payback period.
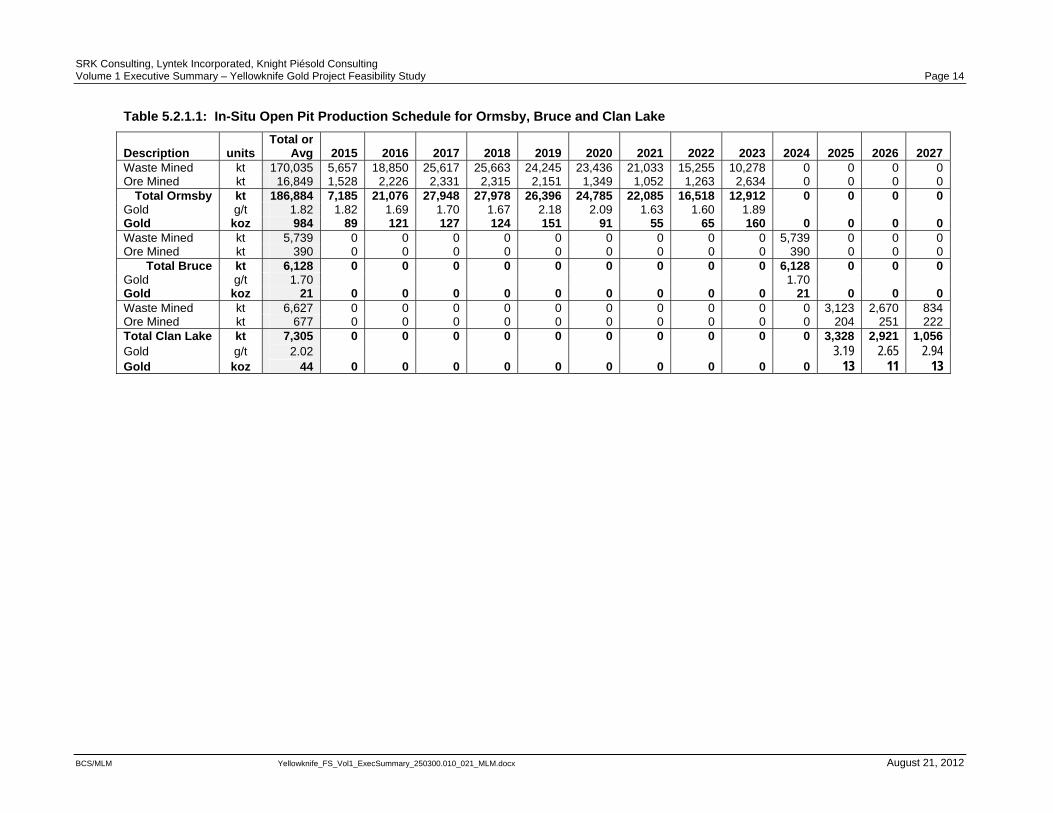
The open pit production schedule is detailed in Table 5.2.1.1. It should be noted the amount of ore
mined is in excess of the mill production. In practice, only the highest value gold grade bins are
combined with ore from Nicholas Lake and Ormsby underground to meet full mill capacity. The
material not directly fed to the mill is stored in the low grade stockpile that is placed in the dewatered
portion of Winter Lake and abutting the TCA.
SRK Consulting, Lyntek Incorporated, Knight Piésold Consulting Volume 1 Executive Summary – Yellowknife Gold Project Feasibility Study Page 14
BCS/MLM Yellowknife_FS_Vol1_ExecSummary_250300.010_021_MLM.docx August 21, 2012
Table 5.2.1.1: In-Situ Open Pit Production Schedule for Ormsby, Bruce and Clan Lake
Description units Total or
Avg 2015 2016 2017 2018 2019 2020 2021 2022 2023 2024 2025 2026 2027 Waste Mined kt 170,035 5,657 18,850 25,617 25,663 24,245 23,436 21,033 15,255 10,278 0 0 0 0 Ore Mined kt 16,849 1,528 2,226 2,331 2,315 2,151 1,349 1,052 1,263 2,634 0 0 0 0
Total Ormsby kt 186,884 7,185 21,076 27,948 27,978 26,396 24,785 22,085 16,518 12,912 0 0 0 0Gold g/t 1.82 1.82 1.69 1.70 1.67 2.18 2.09 1.63 1.60 1.89 Gold koz 984 89 121 127 124 151 91 55 65 160 0 0 0 0Waste Mined kt 5,739 0 0 0 0 0 0 0 0 0 5,739 0 0 0 Ore Mined kt 390 0 0 0 0 0 0 0 0 0 390 0 0 0
Total Bruce kt 6,128 0 0 0 0 0 0 0 0 0 6,128 0 0 0Gold g/t 1.70 1.70 Gold koz 21 0 0 0 0 0 0 0 0 0 21 0 0 0Waste Mined kt 6,627 0 0 0 0 0 0 0 0 0 0 3,123 2,670 834 Ore Mined kt 677 0 0 0 0 0 0 0 0 0 0 204 251 222 Total Clan Lake kt 7,305 0 0 0 0 0 0 0 0 0 0 3,328 2,921 1,056Gold g/t 2.02 3.19 2.65 2.94 Gold koz 44 0 0 0 0 0 0 0 0 0 0 13 11 13

SRK Consulting, Lyntek Incorporated, Knight Piésold Consulting Volume 1 Executive Summary – Yellowknife Gold Project Feasibility Study Page 15
BCS/MLM Yellowknife_FS_Vol1_ExecSummary_250300.010_021_MLM.docx August 21, 2012
Mine equipment has been sized to support detailed mining of ore and bulk mining required for waste
stripping. Therefore, use of the Komatsu 605-7 rigid body dump trucks combined with Komatsu
PC800LC-8 Loaders (with suitable support equipment) have been estimated for both capital and
operating costs for ore. Similarly, Komatsu HD785-7 and Komatsu PC2000-8 Hydraulic face shovel
will be the main waste fleet. Drilling will be performed by a CAT MD5050T 127 mm blast hole drill rig
and explosive loading and supply will be outsourced to a blasting contractor. Both CAT and
Komatsu quotes were considered during the course of the FS and a combined fleet was reported.
During procurement, both vendors indicated the capital cost may reduce given a firm order. The
current makeup of the proposed open pit fleet (without ancillary items) is detailed in Table 5.2.1.2.
Table 5.2.1.2: Proposed Open Pit Equipment Fleet
Description Unit CostUS$000’s
Freight andAssembly US$000’s
FuelL/hr
LubeL/hr
Total US$/hr
Max Units Required
Primary Mine Equipment CAT MD5050T 650 8 21.00 4.22 97.93 4 Komatsu PC2000-8 2,823 354 74.00 8.50 201.46 2 Komatsu PC800LC-8 900 108 48.00 2.09 98.78 1 Komatsu WA470–6 408 8 15.00 0.78 37.41 1 Komatsu HD785-7 1,340 313 52.00 3.36 115.44 16 Komatsu HD605-7 885 42 48.00 2.13 83.11 2 CAT 740 667 8 22.00 2.44 54.17 2 Roads & Dumps Komatsu D275AX-5E0 Dozer 980 8 48.00 1.96 92.36 1 Komatsu WD600-3 905 8 50.00 1.31 86.13 1 CAT 16M 965 8 23.00 1.35 50.87 1 Water Truck - (773 Body - 30kl) 1,220 15 44.00 1.53 79.43 1 Komatsu WA 380 315 8 12.50 0.69 26.65 2
The initial open pit mine capital is estimated at US$23.5 million with an additional US$33.6 million in
sustaining capital that includes new purchases and major equipment rebuilds. Mine operating costs
are estimated at US$1.81/t mined and are based on Canadian labor rates with a 23% burden and a
fuel price of US$1.06/L. Additional costs applied to labor are captured in the G&A estimate. Table
5.2.1.3 details the mine operating cost on a unit basis and does not include pre-production
capitalized costs of US$9.6 million.
Table 5.2.1.3: Open Pit Mine Operating Cost
Description Unit Rate
(US$/t-RoM) Unit Cost
(US$/t-Moved) LoM Cost
(US$000’s) Open Pit Mining 17.716 1.807 362,004 Rehandle 0.813 1.386 16,612
Waste Rock Storage Facility
The waste rock storage for the Ormsby operation has been designed to limit the vertical expansion
of the waste dump and have dump toes located for control of surface run-off. The dumps have also
been located in areas that have been previously disturbed and in catchments that will be impacted
from mining operations. The dumps are not placed on the west side of the pit which is an up-hill haul
and in undisturbed water catchments.

SRK Consulting, Lyntek Incorporated, Knight Piésold Consulting Volume 1 Executive Summary – Yellowknife Gold Project Feasibility Study Page 16
BCS/MLM Yellowknife_FS_Vol1_ExecSummary_250300.010_021_MLM.docx August 21, 2012
Waste rock produced from the Ormsby mining operations (both open pit and underground) will be
placed on surface in two designated areas. The “Runway dump” is located between the narrow lake
and the proposed TCA. The “NE Dump” is to the northeast of the pit covering round lake and part of
the discovery mine tailings cap.
The “Runway dump” has capacity to store 11.5 Mm3 or 25.5 Mt of material at a loose density of 2.25
t/m3 with the ability to expand in length to the south. Current dimensions are 1.3 km north to south,
500 m east to west, with a maximum height of 35 m terminating at elevation 325.
The “NE dump” has capacity to store 73.5 Mm3 or 161.7 Mt of material at a loose density of 2.25 t/m3
with the ability to expand in height. Current dimensions are 1.5 km north to south, 800m east to
west, with a maximum height of 35 m terminating at elevation 385.
Scheduling of waste rock removal from the open pit and underground operations will facilitate
material management and will allow for the waste pile to be segmented into potential acid generating
(PAG) and non acid generating (NAG) material.
The closure activities will include construction of a series of catchment and diversion ditches to
collect surface runoff from the waste rock storage areas. The ditches will be designed to control
sediment loading into the natural water drainage, to minimize erosion of surface materials, and to
divert any potential acidic or metal-rich waters to the Ormsby pit.
Bruce Open Pit
The Bruce deposit is an off-shoot of the old Discovery Mine and provides a small contribution to the
overall economics of the project. The Bruce open pit has been included in the reserve statement
and economic model; although it is unlikely it will be mined until after the Ormsby open pit has
finished and, if alternate mineralization is discovered in the general area of the deposit, not at all. To
validate Bruce for a mine reserve, full pit optimization, pit design, geotechnical and economic
analysis have been completed on the deposit.
Clan Lake Open Pit
The Clan Lake deposit is located approximately 30 km south from the Ormsby deposit with no all-
weather road connecting the two. Clan Lake only provides a small contribution to the overall
economics of the project and is in the early stages of resource evaluation. While the current
resources is small, an assumption has been made that ore would be transported by ice-road to the
Ormsby mill. If resources increase during further exploration, it is likely another mill or all-weather
road would be constructed between the two deposits. The Clan Lake open pit has been included in
the reserve statement and economic model, although it is unlikely it will be mined until after the
Ormsby open pit has finished. To validate it for a mine reserve, full pit optimization, pit design,
geotechnical and economic analysis has been completed on the deposit.
5.2.2 Underground Mining
Two underground operations have been considered as part of the FS. Nicolas Lake is approximately
10 km north of Ormsby and comprises a high grade, lower recovery (82% vs. 92% at Ormsby)
underground operation that will feed the Ormsby mill beginning in 2016. Upon completion at
Nicholas Lake, the mine production fleet and personnel will be relocated to the Ormsby underground
accessed through the open pit, which will have finished primary operations.

SRK Consulting, Lyntek Incorporated, Knight Piésold Consulting Volume 1 Executive Summary – Yellowknife Gold Project Feasibility Study Page 17
BCS/MLM Yellowknife_FS_Vol1_ExecSummary_250300.010_021_MLM.docx August 21, 2012
Figure 5-2 illustrates the Ormsby underground workings and its relation to the open pit.
From an ore geometry perspective, Nicholas Lake is generally steeply dipping (80° to 90° dip) with
the width of the economic mineralization varying from 2 to 24 m with an average of approximately 4
m. In contrast, Ormsby is generally moderately dipping (45 to 60° dip) with the width of economic
mineralization varying from 3 to 6 m with an average of approximately 4 m.
Figure 5-3 illustrates the Nicholas Lake underground layout and design. This design is based on a
ramp to access the ore. The vertical blue line in Figure 5-3 is the ventilation raise.
Longhole stope mining method using conventional drill and blast and cemented rock fill (CRF) will be
used for Nicholas Lake only. Diesel LHD’s will clean out the respective headings to a nearby
muckbay to allow the drilling crew to start the mining cycle in a timely manner. Underground haul
trucks being loaded with the LHD’s will collect ore or waste from the muckbays for transport to the
surface stockpile. Material from the ore stockpile is transferred to the processing facility at Ormsby
using CAT 740’s or rehandle equipment. Waste material transported back underground by the
underground ore trucks will be used for the cemented rock backfill.
The following parameters define the production schedule:
8 m/d development advance;
Nicholas Lake production at 800 t/d;
Ormsby production at 400 t/d; and
Initially target high grade stopes at Nicholas Lake.
The Ormsby underground is separated into six different mines, each being accessed by a separate
portal. Mining begins with the development of the portal. A single development crew then mines all
of the development before that crew becomes the production crew.
Nicholas Lake will be in production for a total of ten years. Development starts in June 2016 and
production begins in February 2017. Production will finish in May 2026.
Ormsby underground will be in production for a total of six years. The first portal at Ormsby starts
development in January 2024 and production begins in 2024. Production from the last portal will
finish in December 2029.
Table 5.2.2.2 details the underground production schedule from Nicholas Lake and Ormsby
underground. Ore material is directly fed to the Ormsby mill due to its high grade and ability for the
open pit to stockpile lower grade material.

SRK Consulting, Lyntek Incorporated, Knight Piésold Consulting Volume 1 Executive Summary – Yellowknife Gold Project Feasibility Study Page 18
BCS/MLM Yellowknife_FS_Vol1_ExecSummary_250300.010_021_MLM.docx August 21, 2012
Table 5.2.2.2: Underground Production Schedule for Nicholas Lake and Ormsby
Description Units Total or Avg 2016 2017 2018 2019 2020 2021 2022 2023 2024 2025 2026 2027 2028 2029
Nicholas Lake
Waste kt 684 96 107 98 99 93 91 69 30 0 0 0 0 0 0
Development Ore kt 252 31 41 25 14 32 33 57 19 0 0 0 0 0 0
Stope Ore kt 1,777 0 124 146 146 146 146 146 237 292 292 101 0 0 0
Total Mined kt 2,713 127 272 269 259 271 270 272 286 292 292 101 0 0 0
Development Ore g/t 3.06 2.99 3.51 2.99 3.06 2.82 3.40 2.87 2.62
Stope Ore g/t 3.15 4.65 3.30 2.81 2.67 3.32 3.28 3.40 3.01 2.85 2.51
Average Grade g/t 3.14 2.99 4.37 3.26 2.84 2.69 3.33 3.16 3.34 3.01 2.85 2.51
Total Gold koz 205 3 23 18 15 15 19 21 27 28 27 8 0 0 0
Ormsby
Waste kt 663 0 0 0 0 0 0 0 0 98 93 78 117 154 123
Development Ore kt 173 0 0 0 0 0 0 0 0 19 19 13 29 31 62
Stope Ore kt 599 0 0 0 0 0 0 0 0 64 24 77 46 125 264
Total Mined kt 1,435 0 0 0 0 0 0 0 0 182 135 168 192 310 449
Development Ore g/t 3.33 3.57 2.62 2.75 3.99 2.58 3.66
Stope Ore g/t 3.54 3.53 2.34 3.57 4.72 3.12 3.62
Average Grade g/t 3.49 3.54 2.47 3.45 4.44 3.01 3.63
Total Gold koz 87 0 0 0 0 0 0 0 0 10 3 10 11 15 38

SRK Consulting, Lyntek Incorporated, Knight Piésold Consulting Volume 1 Executive Summary – Yellowknife Gold Project Feasibility Study Page 19
BCS/MLM Yellowknife_FS_Vol1_ExecSummary_250300.010_021_MLM.docx August 21, 2012
Underground Mining Operating Costs
The underground mine operating cost is built from several individual estimates and is expected to
remain consistent for the duration of the underground mining considered in this study. Table 5.2.2.3
presents a summary of the average operating cost estimates on a yearly basis, averaged for the life
of mine for the underground operations. The individual operating cost estimates are for the develop
headings based on the development schedule advance in meters, the production costs are based on
the scheduled tonnage and the backfill is estimated from the void space volume based on the cubic
meters requirements to be backfilled. These estimates do not include labor costs, which are handled
separately.
Table 5.2.2.3: Summary of Underground Operating Costs (US$)
Description Units Value Development Main Ramps (4m by 3m) US$/m $597.18 Stope Access Ramp (4m by 3m) US$/m $492.64 Vent Raise - Conventional US$/m $613.38 Production Long Hole Ore Stope US$/t-RoM $5.16 Ore Haulage to Surface US$/t-RoM $1.11 Mine General US$/t-RoM $3.33 Back Fill Density t/m3 2.10 Haulage US$/m3 $1.47 Placement US$/m3 $0.32 Cement (3 %) US$/m3 $5.11
5.2.3 Underground Sustaining Capital Costs
Underground mine development takes place after the mill is in full production; hence capital items
are categorized as sustaining capital rather than initial capital. Table 5.2.3.1 details the equipment
cost breakdown and major infrastructure items for access to Nicholas Lake. The infrastructure
associated with wet/dry, fuel storage, etc., is sourced from the current Tyhee mancamp, which will be
relocated when mining commences.
Total sustaining capital for underground operations has been estimated at US$9.5 million. Site
infrastructure incorporates an all-weather road to access Nicholas Lake.

SRK Consulting, Lyntek Incorporated, Knight Piésold Consulting Volume 1 Executive Summary – Yellowknife Gold Project Feasibility Study Page 20
BCS/MLM Yellowknife_FS_Vol1_ExecSummary_250300.010_021_MLM.docx August 21, 2012
Table 5.2.3.1: Underground Equipment Fleet
Description Unit CostUS$000’s
Total CostUS$000’s
Max Units
Primary Equipment Sandvik TH430 – Haul Truck 867 1,751 2 Sandvik LH 307 - LHD 643 2,603 4 Sandvik DD321 –Two Boom Jumbo 986 986 1 Sandvik DD311 – Single Boom Jumbo 814 814 1 Sandvik DL230 – Longhole Drill 348 696 2 Support Equipment Getman Grader 320 320 1 Getman Charger 300 300 1 Getman Fuel/Lube 300 300 1 Personnel Carrier 90 180 2 Infrastructure All Weather Road 1500 Dry @ Misc 30 Total $9,474
5.3 Mill Schedule – Open Pit, Underground and Rehandle Operations The production schedule was carried out using the Chronos scheduling package and comprised of
an “In-Situ” mine schedule from open pit and underground operations, followed by a “Stockpile” or
plant feed schedule.
Central to the production schedule is the use of grade bins to maximize the metal content being
delivered to the process plant and delaying lower grade material which would displace higher grade
ore during the early years where the discount rate is of great importance. To do this, total rock is
mined at a rate where the number of trucks (90 Mt capacity) required is capped at 16 or
approximately 29 Mt depending on haul distance. The grade bins accumulate for each schedule
period and become inventory for the Stockpile schedule. When a stockpile bin is mined in the same
period as it is sent to the plant, it is assumed the material is directly fed to the crusher. When there
is a period lag, it is assumed it was mined and sent to the low grade stockpile and treated separately.
The combined open pit, underground and stockpile re-handle schedule is detailed in Table 5.3.1.
Due to the different recoveries at Nicholas Lake, Ormsby and Clan Lake, the weighted average
recoveries are also reported.

SRK Consulting, Lyntek Incorporated, Knight Piésold Consulting Volume 1 Executive Summary – Yellowknife Gold Project Feasibility Study Page 21
BCS/MLM Yellowknife_FS_Vol1_ExecSummary_250300.010_021_MLM.docx August 21, 2012
Table 5.3.1: Mill Production Schedule
Mill Feed Schedule
Description Unit Total 2015 2016 2017 2018 2019 2020 2021 2022 2023 2024 2025 2026 2027 2028 2029
RoM to Mill Open Pit Ore kt 17,633 391 1,429 1,295 1,289 1,300 1,282 1,281 1,257 1,204 1,084 1,126 1,269 1,385 1,304 738Underground Ore kt 2,801 0 31 165 171 160 178 179 203 256 376 334 191 75 156 325
Total RoM kt 20,434 391 1,460 1,460 1,460 1,460 1,460 1,460 1,460 1,460 1,460 1,460 1,460 1,460 1,460 1,063Grade Open Pit g/t 1.84 3.71 2.40 2.43 2.37 3.06 2.27 1.60 1.65 3.02 1.35 0.94 1.01 0.88 0.89 0.69
Underground g/t 3.23 2.99 4.37 3.26 2.84 2.69 3.33 3.16 3.34 3.13 2.80 2.95 4.44 3.01 3.63 Average Grade g/t 2.03 3.71 2.41 2.65 2.47 3.03 2.32 1.81 1.86 3.08 1.81 1.36 1.26 1.06 1.12 1.59 Total Gold koz 1,334 47 113 125 116 142 109 85 87 145 85 64 59 50 53 54Gold Produced
Average Recovery % 90.5% 92.0% 91.7% 90.1% 90.5% 91.0% 90.6% 89.7% 89.6% 90.1% 88.7% 87.8% 90.6% 92.0% 92.0% 92.0% Gold Produced koz 1,207 43 104 112 105 130 99 76 78 130 75 56 54 46 48 50Tailings
Tailings Produced kt 20,396 389 1,457 1,457 1,457 1,456 1,457 1,458 1,458 1,456 1,458 1,458 1,458 1,459 1,458 1,061Gold Grade g/t 0.19 0.30 0.20 0.26 0.24 0.27 0.22 0.19 0.19 0.31 0.21 0.17 0.12 0.09 0.09 0.13

SRK Consulting, Lyntek Incorporated, Knight Piésold Consulting Volume 1 Executive Summary – Yellowknife Gold Project Feasibility Study Page 22
BCS/MLM Yellowknife_FS_Vol1_ExecSummary_250300.010_021_MLM.docx August 21, 2012
6 Reserve Statement Reserves are valid at the time of estimation and include CoG assumptions made before the final
economic model is published. SRK confirmed there were no periods of negative cash flow and the
overall Project economics are favorable at the three year moving average gold price of US$1,400/oz
Au.
6.1 Reserve Estimation Table 6.1.1: Reserve Statement for Tyhee’s Yellowknife Gold Project, Northwest Territories,
Canada: SRK Consulting (U.S.), Inc., July 28, 2012
Deposit Type Deposit Area Resource Category Quantity
(000’s)Average
Grade Contained Metal
(000’s) Tonnes Au (g/t) Au Oz
Open Pit
Ormsby Proven 6,347 1.75 357 Subtotal Proven 6,347 1.75 357 Ormsby
Probable 10,502 1.86 627
Bruce 390 1.70 21 Clan Lake 394 2.93 37 Subtotal Probable 11,286 1.68 685
Underground Ormsby
Probable 772 3.49 87
Nicholas Lake 2,029 3.14 205 Subtotal Probable 2,801 3.24 291
Total Proven and Probable 20,433 2.03 1,334
Reserves are inclusive of mineral resources; Reserves are based on a gold price of US$1,400/oz; Open pit reserves assume full mine recovery; Open pit reserves are not diluted (Further to dilution inherent in the resource model and assume selective mining unit of 3m
x 3m x 3m.); Underground reserves assume planned dilution, 5% unplanned dilution at Nicholas Lake and 9% at Ormsby; In situ Au Ounces do not include metallurgical recovery of 92% for Ormsby, Clan Lake and Bruce or 82% for Nicholas Lake; An open pit CoG of 0.6g/t-Au was applied to open pit resources constrained by the final pit design; An underground CoG of 2.0 g/t-Au was applied to underground resources constrained by a final underground design; and Mineral resource tonnage and contained metal have been rounded to reflect the accuracy of the estimate, and numbers
may not add due to rounding. The mineral reserve estimate for the YPG was calculated by Bret C Swanson, BE (Min) MMSAQP #04418QP, of SRK
Consulting (U.S.) in accordance to CSA, NI 43-101 standards and generally accepted CIM “Estimation of Mineral Resource and Mineral Reserves Best Practices” guidelines.

SRK Consulting, Lyntek Incorporated, Knight Piésold Consulting Volume 1 Executive Summary – Yellowknife Gold Project Feasibility Study Page 23
BCS/MLM Yellowknife_FS_Vol1_ExecSummary_250300.010_021_MLM.docx August 21, 2012
7 Metallurgy SRK designed and supervised a feasibility-level metallurgical development program for Tyhee’s
YGP, which was conducted by the Metallurgical Division of Inspectorate Exploration and Mining
Service Ltd (Inspectorate). Metallurgical studies were conducted on master composites and
variability composites from the Ormsby, Nicholas Lake and Clan Lake ore deposits.
7.1 Test Composite Characterization The Ormsby master composite was formulated from a split of a large bulk composite that had been
used for pilot plant testing at Inspectorate in 2007. The Ormsby variability composites, as well as the
Nicholas Lake and Clan Lake master composites and variability composites, were formulated from
drill core. Table 7.1.1 provides gold head analyses for each test composite.
Table 7.1.1: Test Composite Head Analyses
Composite Au (g/t) Ormsby Master 1.78 OM-105 4.39 OM-417 1.71 OM-559 3.40 OM-723 4.99 Bruce Zone 4.68 Nicholas Lake Master 2.32 NL-West 1.91 NL-Central 4.48 NL-East 2.50 Clan Lake Master 1.92 CL-North Main 6.05 CL-Central Main 1.63 CL Southeast Main 2.27
7.2 Metallurgical Test Program The metallurgical program was based on earlier prefeasibility studies that were conducted by
Inspectorate from 2007 to 2009, and was designed to evaluate a process flowsheet that would
include:
Three-stage crushing;
Ball mill grinding;
Gravity concentration of the coarse gold;
Gold flotation from the gravity tailing;
Cyanide leaching of the gold flotation concentrate;
Cyanide detoxification of the cyanidation residue; and
Tailing thickening.
7.3 Grindability Studies Bond ball mill work index tests were conducted on the three master composites and the five Ormsby
variability composites. The Bond ball mill work index (BWi) for the Ormsby master composite was
found to be 14.6 kWh/t, and the Ormsby variability composites were found to range from 13.8 to 15.4

SRK Consulting, Lyntek Incorporated, Knight Piésold Consulting Volume 1 Executive Summary – Yellowknife Gold Project Feasibility Study Page 24
BCS/MLM Yellowknife_FS_Vol1_ExecSummary_250300.010_021_MLM.docx August 21, 2012
kWh/t, with an average of 14.7 kWh/t. The Nicholas Lake master composite was found to be
somewhat harder with a BWi of 16.2 kWh/t and the Clan Lake master composite was found to be
somewhat softer with a BWi of 13.6 kWh/t. Based on these results, these composites would be
classified as medium to medium-hard.
7.4 Grind-Recovery: Gravity Concentration/Rougher Flotation A grind-recovery test series was carried out on the Ormsby master composite to evaluate gravity
concentration followed by gold flotation from the gravity tailing. Based on the results of these tests, a
grind at P80 120 m appeared to be optimal and was selected as the optimum primary grind for the
remainder of the test program on the Ormsby composites. Similar grind-recovery tests were also
conducted on the Nicholas Lake and Clan Lake master composites, which resulted in the selection of
a primary grind of P80 120 m for the Nicholas Lake master composite and primary grind of P80 150
m for the Clan Lake master composite.
7.5 Grind-Recovery: Rougher Flotation Concentrate Upgrading of rougher flotation concentrates by regrinding and cleaner flotation was performed to
assess regrind size, number of stages cleaning and collector dosage requirements. Grind-recovery
tests were conducted on rougher concentrates produced from the Ormsby master composite over
the range from P80 125 to 30 m. Regrinding to P80 30 m regrind resulted in the highest gold
recovery. Regrind tests were also conducted on rougher flotation concentrates produced from
Nicholas Lake and Clan Lake master composites. This work resulted in selecting a regrind size of
P80 74 m for Nicholas Lake and a regrind size of P80 120 m for Clan Lake.
7.6 Locked-Cycle Testwork The optimum process conditions developed for the Ormsby master composite were tested in an
eight-cycle locked-cycle test designed to demonstrate the impact of recycling intermediate process
streams on overall gravity/flotation gold recovery. The locked-cycle test flowsheet is shown in Figure
7-1, and includes primary grinding, gravity concentration followed by rougher and cleaner flotation of
the gravity tailing and recycling of intermediate flotation products. The Nicholas Lake and Clan Lake
master composites were also evaluated with the same locked-cycle test flowsheet using the optimum
test conditions that were established for each of these composites.
The results of the locked-cycle test performed on each test composite are summarized in Table 7.6.1
and show that, for the Ormsby master composite, an overall gold recovery into gravity and flotation
concentrates of 93% was obtained. For the Nicholas Lake master composite, an overall gold
recovery of 86.4% was obtained and, for the Clan Lake master composite, an overall gold recovery
of 93.7% was obtained.
Table 7.6.1: Gravity/Flotation Locked-Cycle Gold and Silver Recovery Summary
Composite Gravity Conc. Flotation Conc. Overall Au % Ag % Au % Ag % Au % Ag %
Ormsby 49.6 41.3 43.4 49.5 93.0 90.8 Nicholas Lake 22.3 3.7 64.1 69.7 86.4 73.4 Clan Lake 44.5 49.2 93.7
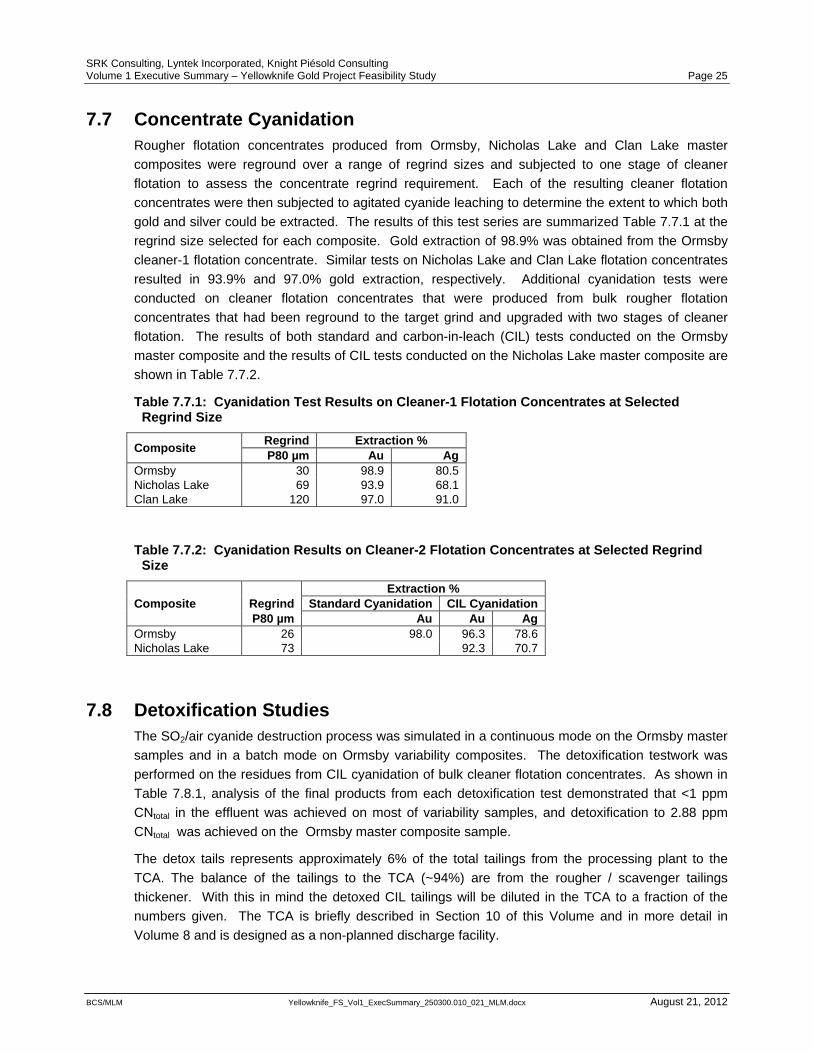
SRK Consulting, Lyntek Incorporated, Knight Piésold Consulting Volume 1 Executive Summary – Yellowknife Gold Project Feasibility Study Page 25
BCS/MLM Yellowknife_FS_Vol1_ExecSummary_250300.010_021_MLM.docx August 21, 2012
7.7 Concentrate Cyanidation Rougher flotation concentrates produced from Ormsby, Nicholas Lake and Clan Lake master
composites were reground over a range of regrind sizes and subjected to one stage of cleaner
flotation to assess the concentrate regrind requirement. Each of the resulting cleaner flotation
concentrates were then subjected to agitated cyanide leaching to determine the extent to which both
gold and silver could be extracted. The results of this test series are summarized Table 7.7.1 at the
regrind size selected for each composite. Gold extraction of 98.9% was obtained from the Ormsby
cleaner-1 flotation concentrate. Similar tests on Nicholas Lake and Clan Lake flotation concentrates
resulted in 93.9% and 97.0% gold extraction, respectively. Additional cyanidation tests were
conducted on cleaner flotation concentrates that were produced from bulk rougher flotation
concentrates that had been reground to the target grind and upgraded with two stages of cleaner
flotation. The results of both standard and carbon-in-leach (CIL) tests conducted on the Ormsby
master composite and the results of CIL tests conducted on the Nicholas Lake master composite are
shown in Table 7.7.2.
Table 7.7.1: Cyanidation Test Results on Cleaner-1 Flotation Concentrates at Selected Regrind Size
Composite Regrind Extraction % P80 µm Au Ag
Ormsby 30 98.9 80.5 Nicholas Lake 69 93.9 68.1 Clan Lake 120 97.0 91.0
Table 7.7.2: Cyanidation Results on Cleaner-2 Flotation Concentrates at Selected Regrind Size
Composite Extraction %
Regrind Standard Cyanidation CIL Cyanidation P80 µm Au Au Ag
Ormsby 26 98.0 96.3 78.6 Nicholas Lake 73 92.3 70.7
7.8 Detoxification Studies The SO2/air cyanide destruction process was simulated in a continuous mode on the Ormsby master
samples and in a batch mode on Ormsby variability composites. The detoxification testwork was
performed on the residues from CIL cyanidation of bulk cleaner flotation concentrates. As shown in
Table 7.8.1, analysis of the final products from each detoxification test demonstrated that <1 ppm
CNtotal in the effluent was achieved on most of variability samples, and detoxification to 2.88 ppm
CNtotal was achieved on the Ormsby master composite sample.
The detox tails represents approximately 6% of the total tailings from the processing plant to the
TCA. The balance of the tailings to the TCA (~94%) are from the rougher / scavenger tailings
thickener. With this in mind the detoxed CIL tailings will be diluted in the TCA to a fraction of the
numbers given. The TCA is briefly described in Section 10 of this Volume and in more detail in
Volume 8 and is designed as a non-planned discharge facility.

SRK Consulting, Lyntek Incorporated, Knight Piésold Consulting Volume 1 Executive Summary – Yellowknife Gold Project Feasibility Study Page 26
BCS/MLM Yellowknife_FS_Vol1_ExecSummary_250300.010_021_MLM.docx August 21, 2012
Table 7.8.1: Cyanide Detoxification Results on Ormsby Master and Variability Composite
Composite CN WAD, mg/L CN Total, mg/L Ormsby Master 1.61 2.88 OM-105 4.90 6.43 OM-417 0.28 0.35 OM-559 0.07 0.15 OM-723 0.06 0.08 Bruce Zone <0.05 <0.05
7.9 Recoverability Gold recoveries for Ormsby, Nicholas Lake and Clan Lake have been developed from the results of
both locked-cycle testwork and from bulk gravity/flotation tests that were conducted on each of the
test composites to produce flotation concentrates for regrind and cyanidation testwork. As
summarized in Table 7.9.1, gold recoveries for Ormsby and Clan Lake are projected at 92% and
gold recovery for Nicholas Lake is projected at 82%. SRK has used gold extraction results from
standard cyanidation tests instead of CIL cyanidation tests to project overall gold recovery due to
concerns that the carbon may have been over-attritioned during the CIL cyanidation tests, resulting
in gold losses in the carbon fines that report in the leach residue.
Table 7.9.1: Projected Gold Recoveries for Ormsby, Nicholas Lake and Clan Lake
Composite Gravity Flotation Cyanidation Overall Lab Projected
Recovery % Recovery % Extraction, % Recovery, % Recovery, % Ormsby 52.3 41.0 98 92.5 92 Nicholas Lake 15.5 72.6 93 83.0 82 Clan Lake 46.3 48.4 97 93.3 92

SRK Consulting, Lyntek Incorporated, Knight Piésold Consulting Volume 1 Executive Summary – Yellowknife Gold Project Feasibility Study Page 27
BCS/MLM Yellowknife_FS_Vol1_ExecSummary_250300.010_021_MLM.docx August 21, 2012
8 Process and Plant
8.1 Design Philosophy/Design Criteria There are several factors that influenced the process design of the concentrator for this project. Two
test programs had been conducted on this ore prior to the present team becoming involved. These
programs demonstrated that there was a considerable amount of gold in the ore that could be
recovered by gravity (density) separation. These programs also demonstrated that froth flotation
would recover a very high fraction of any remaining gold. And finally the programs demonstrated
that gold could be easily leached from flotation concentrates with the use of cyanide.
These factors, plus the plant location and other external factors, led to the development of a
flowsheet consisting of conventional three-stage crushing, followed by ball mill ore grinding with
gravity recovery of coarse gold, rougher flotation, regrinding of rougher concentrate, cleaner flotation,
CIL cyanide extraction of gold from cleaner concentrate and SO2/air process for cyanide
detoxification of the leach residue.
Combining preliminary operating cost estimates for the mine and concentrator led to the specification
of a 4,000 t/d processing rate for the mill. The concentrator has been designed with two parallel,
equal capacity (2,000 t/d) processing lines from fine ore storage, through grinding, gravity gold
recovery, and rougher froth flotation. The two parallel lines provide greater flexibility for operation if
treating primarily underground ores later in the project life, and also provide a degree of safety for a
continued processing capability in the event of catastrophic equipment failure in one of the primary
processing lines given the fact that the project is constrained to an ice road for oversize equipment.
There will be a single regrinding operation on flotation concentrate, followed by cleaner flotation.
The cleaner flotation concentrate will then feed the leaching circuit. To keep the leaching and gold
recovery circuit simple and compact, a CIL circuit has been specified. An SO2/air process type
cyanide destruction circuit will treat the leach residue to reduce cyanide concentrations to levels
below those regulated in the MMER.
The flotation tailings will be thickened to recover as much water as practical and reduce the volume
sent to the tailings facility. The detoxified leach residue will also be sent, separately from the
flotation tailings, to the tailings facility for disposal.
The specifications above and other criteria necessary for the design of the concentrating plant have
been assembled in a design criteria document.
8.2 Recovery Method
8.2.1 Crushing
The ore processing begins with (run-of-mine) RoM ore dumped into a feed bin. From the feed bin
the ore will flow to a vibrating grizzly feeder that will remove the -100 mm material from the feed to
the primary jaw crusher to reduce the load on the crusher. The crusher will reduce the RoM ore to
80% finer than 100 mm. Fine material from the grizzly and the crusher will flow to a three deck
vibrating screen. A three deck screen can produce four products, one from each of the three screen
decks and the fine product that passes through the bottom screen deck.

SRK Consulting, Lyntek Incorporated, Knight Piésold Consulting Volume 1 Executive Summary – Yellowknife Gold Project Feasibility Study Page 28
BCS/MLM Yellowknife_FS_Vol1_ExecSummary_250300.010_021_MLM.docx August 21, 2012
In the Yellowknife crushing plant, the coarse products from the top two screen decks will be
combined and feed the secondary, “standard,” cone crusher. The crushed material from the
secondary crusher will return to the vibrating screen. The intermediate product that flows off the top
of the third deck of the screen will feed the tertiary, “short head,” cone crusher. Crushed material
from the tertiary crusher will also recycle to the vibrating screen.
The fine (finer than 9.5 mm) product that flows through the third (bottom) deck of the vibrating screen
is the final crusher product fine ore. The fine ore is transported by conveyor to either one of two fine
ore storage silos. A reversing conveyor selects to which silo the ore flows. Each fine ore silo has a
storage capacity of 2,000 t of ore, sufficient for 24 hrs of operations of one ball mill - rougher /
scavenger flotation line.
8.2.2 Primary Ball Milling
Apron feeders will control the flow of ore from the fine ore storage silos on to feed belts that will feed
the two parallel grinding circuits. One fine ore bin will feed one grinding mill with no cross over
provided. The ball mills will operate in closed circuit with hydrocyclone size classifiers to produce a
product ground to 80% finer than 120 microns (µm). The hydrocyclone overflow (fine) product will
flow to a rougher-scavenger flotation circuit. A portion of each hydrocyclone circuit underflow stream
will be fed to a centrifugal gravity concentrator to recover coarse free gold. Concentrate from the
centrifugal concentrators will be combined and fed to a shaking table for clean-up. The shaking table
concentrate will be handled in a secure gold room.
8.2.3 Rougher / Scavenger Flotation
The hydrocyclone overflow streams from the grinding circuits will feed two, parallel, rougher-
scavenger flotation circuits. These flotation circuits will recover as much of the gold remaining in the
ore as possible. Tank type flotation cells have been selected for this plant. The concentrate streams
from the rougher-scavenger flotation circuits will be combined to feed the regrind mill. Tailings from
this circuit will flow to a tailings thickener and thickened tailings will flow to the tailings management
facility.
8.2.4 Cleaner / Scavenger Flotation
To achieve optimum separation of gold from barren constituents of the ore, the rougher-scavenger
concentrate will be ground in a Vertimill fine grinding mill to a size of 80% finer than 40 µm. This will
liberate the gold from gangue minerals and allow a further concentration of gold in the cleaner
flotation circuit.
The cleaner flotation circuit will consist of three stages: first cleaner, cleaner scavenger, and second
cleaner. The final product of this will be about 6% of the overall plant feed. Tailings from the cleaner
scavenger circuit will flow to the rougher circuit feed. Second cleaner (final) concentrate will flow to a
pre-leach thickener.
8.2.5 Carbon-in-Leach Cyanidation Circuit
The thickened flotation concentrate will first flow to a pre-leach aeration tank. If necessary, the
concentrate slurry can be aerated in this tank to passivate cyanide consuming constituents in the
ore. After pre-leach aeration, the slurry will flow to the CIL circuit. Cyanide solution will be added

SRK Consulting, Lyntek Incorporated, Knight Piésold Consulting Volume 1 Executive Summary – Yellowknife Gold Project Feasibility Study Page 29
BCS/MLM Yellowknife_FS_Vol1_ExecSummary_250300.010_021_MLM.docx August 21, 2012
and the slurry will flow, by gravity, from tank to tank in the leach circuit. Coarse granular activated
carbon (GAC) will be added to the circuit to adsorb dissolved gold from the slurry.
The GAC will be retained in each leach tank by interstage carbon screens. Periodically, a portion of
the slurry will be pumped to the next tank upstream to move the carbon in a counter-current flow to
the leach slurry. Carbon will be transferred from the first leach tank to the carbon stripping circuit.
The leach slurry will flow from the last leach tank to the detox thickener. This thickener will reduce
the volume of material needing detoxification and recover cyanide solution that will be recycled to the
first leach tank.
8.2.6 Adsorption-Desorption-Recovery Circuit
The activated carbon that is loaded with gold will be washed with acid to remove scale then stripped
with a strong hot cyanide solution to recover the adsorbed gold. The strip solution will circulate
through electro-winning cells where the gold will be plated onto steel wool. The steel wool and
sludge from the electro-winning cells will be sent to the secure gold room.
The thickened leach residue will flow to a cyanide detoxification circuit with two tanks in series. After
detoxification, the slurry will flow to a storage tank and will periodically be pumped to a containment
area within the tailings management facility.
The shaking table concentrate and electro-winning products will be combined and smelted into doré
in the secure gold room.
8.3 Process Material Balance The material balance for the plant was made utilizing the metallurgical testwork conducted by
Inspectorate in Vancouver under the direction of SRK and various recommendations based on
previous engineering experience. These limiting parameters were then used to model the mass
balance partially in AggFlow and fully in Metsim.
The material balance for the crushing circuit was initially prepared using the software called
AggFlow. AggFlow is a material balance program that utilizes existing actual equipment
manufacturers’ data to create material balances with conditions that reflect real life situations for
crushing circuits. AggFlow offers the opportunity to use various vendors’ equipment specifications
giving the user the ability to pick and choose both the specific equipment and the vendor for the
proper solution. The crushing circuit was modeled multiple times in AggFlow with various process
configurations using a variety of vendors. The final agreed upon process configuration, which is
utilized in the Process Flow Diagrams, and the most realistic vendor parameters were used as the
final AggFlow model.
The ore parameters used to feed the grinding circuit in Metsim are the same as those feeding the
crushing circuit except that the throughput was decreased to 181 t/h solids (mill and flotation circuit
availability is considerably higher than crushing circuit availability). The ore size distribution was
adjusted to account for the crushing process, and the percent moisture was increased from dust
control in crushing.
The parameters for the recovery of the gold in the grinding, flotation and leaching circuits of the
Metsim model were interpreted using results from the metallurgical testwork. Based on the
metallurgical testwork results for the Ormsby ore, SRK recommended using the recoveries shown in

SRK Consulting, Lyntek Incorporated, Knight Piésold Consulting Volume 1 Executive Summary – Yellowknife Gold Project Feasibility Study Page 30
BCS/MLM Yellowknife_FS_Vol1_ExecSummary_250300.010_021_MLM.docx August 21, 2012
Table 8.3.2. Specific parameters in Metsim were varied until the results converged on the recoveries
required.
Table 8.3.1: Basic Material Balance Criteria
Item ParameterGold Head Grade 2.31 g/tAverage Head Percent Moisture 3%Solids Specific Gravity 3.05Throughput Solids to the crushing circuit 266 t/h
*Note: The Design Criteria, and mass balances, were based on an average head grade of 2.46 g/t Au. Subsequent optimization of the mine has reduced the average head grade to 2.31 g/t. This change has no effect on the design of the processing plant, and minimal effect on the mass balances. All economic calculations are based on the revised head grade of 2.31 g/t. Mass balances on the PFD’s reflect the head grade of 2.46 g/t listed in the Design Criteria.
Table 8.3.2: Design Gold Recovery Values for Ormsby Type Ore
Area Recovery (%) Gravity Separation 50% Rougher Flotation 88% Cleaner Flotation 96% Cyanide Leaching 98% Overall Recovery 92%
Based on the above criteria, and a 2.31 g/t average head grade, approximately 400 kg of gravity
concentrates containing ~4.3 kg (137 oz) of gold will be recovered from the grinding circuit each day.
Leach circuit feed (cleaner flotation concentrate) will be approximately 6% of grinding circuit feed or
11 t/h. The CIL circuit will produce approximately 1.3 t of loaded carbon per day containing ~4.3 kg
(137 oz) of gold. Total gold production is predicted to be ~8.5 kg (273 oz) per day.
On average, 170 t/h of flotation tailings will flow to the tailings thickener. Eleven t/h of detoxified
leach residue will flow to the leach residue storage tank.
8.4 Process Plant Water Balance The water balance for the Tyhee project was completed in conjunction with the material balance,
shown in Section 8.3, as modeled in Metsim.
Metsim is modeling software that, given required parameters, can create a model that accurately
represents the process in question. While the material balance was being created within Metsim, it
was important that the water requirements were also modeled so the overall mass balance would be
accurate in steady state. Once again, steady state would be the mass balance averaged over an
entire day rather than including batch operations which would have to be calculated separately.
The Metsim model also displays the water requirements for both raw water and recycled return
process water. The model shows an assumption that the gland water for pumps and water makeup
for reagents will be clean raw water, resulting in a minimum steady state raw water requirement of
approximately 12.5 m3/hr (55 gpm). The rest of the water requirements within the model are coming
from the return water, but because there is not enough return water to supply all of the
aforementioned water requirements there could be a fresh water demand of up to 150 m3/hr (660
gpm). Note that these figures are for the concentrator only and do not include potable water or any

SRK Consulting, Lyntek Incorporated, Knight Piésold Consulting Volume 1 Executive Summary – Yellowknife Gold Project Feasibility Study Page 31
BCS/MLM Yellowknife_FS_Vol1_ExecSummary_250300.010_021_MLM.docx August 21, 2012
water that may be needed in the mining operation. All fresh water will be supplied from the Giauque
Lake freshwater system.
8.5 Process Flow Diagrams, Piping & Instrumentation Diagrams and Electrical Single Line Diagrams The process description above refers to the drawing and equipment numbers shown on the process
flow diagrams. Line numbers on the diagrams correlate with stream numbers in the Metsim mass
balance. Preliminary piping and instrumentation diagrams (P&IDs) have been developed to assist in
estimating costs for piping and instruments. These have been developed to a level that is between
60% and 80% of final design. Few additional instruments will be required, expected changes will
include adding actuators to valves and altering connections.
Electrical one line diagrams for power distribution have been developed based on the equipment list
and physical location of the loads. The electrical one line diagrams provide a basis for determining
the equipment required to distribute power throughout the site. This allows for estimating the cost of
the switchgear, MCC’s, transformers, electrical cabling, etc.
8.6 Process Equipment Equipment type selection and sizing used a combination of standard industry practices, data from
the laboratory testing program, the mass and volume flow data from the mass balance models,
experience of engineers at Lyntek and SRK, vendor recommendations and client preferences.
Critical items included the crushers, grinding mills, gravity concentrators, flotation cells, leach tanks,
thickeners and detoxification tanks.
When the equipment duty specifications for major equipment were finalized, they were summarized
on equipment data sheets. These data sheets accompanied requests for quotation for the major
pieces of equipment during this FS and will be updated for the same purpose in detailed engineering
and procurement.
8.7 Process Plant Operating Cost Estimate The plant operating cost is built from several individual estimates as discussed below. The operating
costs are expected to remain consistent for the duration considered in this study. The throughput of
the processing plant is also expected to be consistent for that period, meaning that costs per tonne
will not vary significantly. The head grade is expected to vary, therefore the processing cost per troy
ounce of gold will vary somewhat. Table 8.7.1 presents a summary of the average processing cost
estimates on a yearly basis, averaged for the first five years of operation.

SRK Consulting, Lyntek Incorporated, Knight Piésold Consulting Volume 1 Executive Summary – Yellowknife Gold Project Feasibility Study Page 32
BCS/MLM Yellowknife_FS_Vol1_ExecSummary_250300.010_021_MLM.docx August 21, 2012
Table 8.7.1: Summary of Operating Costs
Item Annual Cost
US$000’s Cost per Tonne
US$ Labor 6,843 4.69 Comminution Consumables 3,357 2.30 Reagents 4,850 3.32 Processing Power 14,917 10.22 Lighting Power 945 0.65 Maintenance & Lubrication Supplies 1,800 1.23 Laboratory and Analytical Supplies 100 0.07 Total Processing Costs $32,813 $22.47 Cost Per Nominal Troy Ounce Produced $329
8.8 Process Plant Capital Cost Estimate The Project’s capital cost estimate is presented in third quarter 2012 (3Q12) United States dollars
(US$).
The initial capital cost estimate is summarized in Table 8.8.1 and total US$124.0 million. The capital
cost estimate includes the design, construction and/or procurement of the following items:
Truck shop;
Ore crushing building;
Fine ore bins;
Complete mill processing building with milling equipment, administration offices, mill lab,
change facility, mechanical and electrical shops, warehouse, reagent area and power
generators;
Tailings thickener;
Fuel storage area;
Covered lay down storage area;
Mancamp;
Water pump station; and
Other indirect costs as specifically listed in Table 8.8.1.
Other initial and sustaining capital costs related to process plant and infrastructure are included
elsewhere in this report and in the economic model these include:
First fills;
Construction insurance;
Construction contractor employee transportation from Yellowknife to Tyhee site; and
Sustaining capital for the process plant.
The costs associated with these excluded items are contained elsewhere in the financial model and
are accounted for separately in the FS.
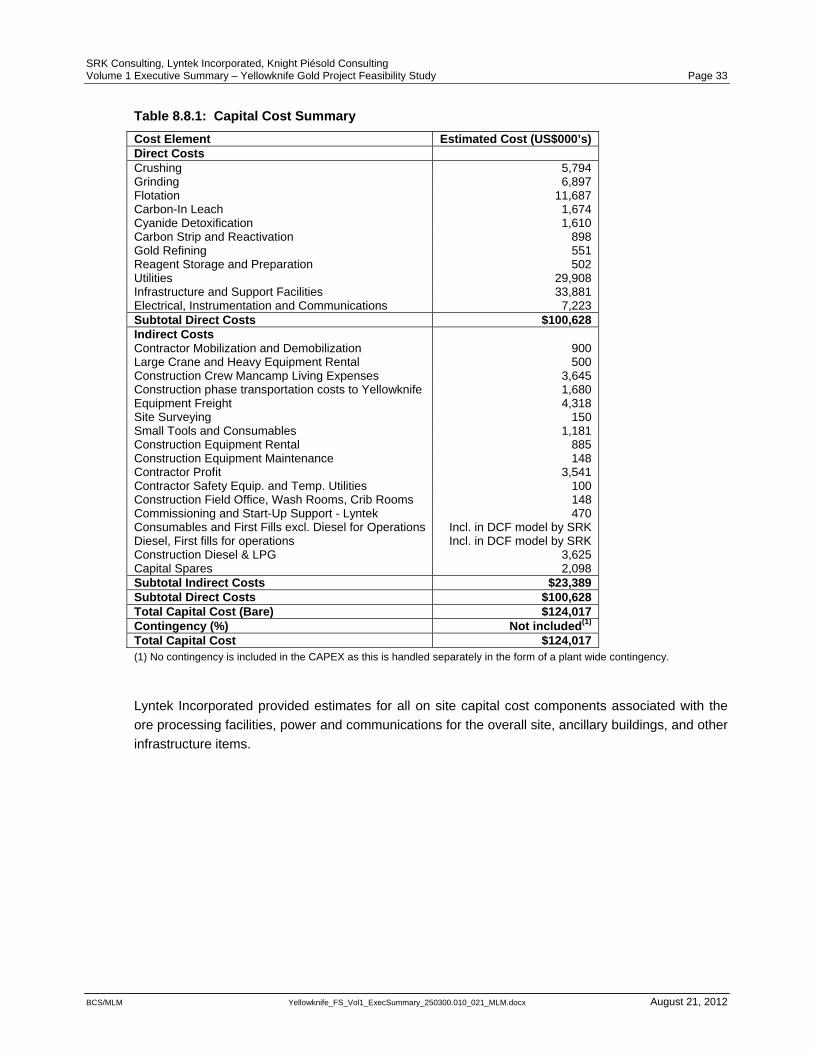
SRK Consulting, Lyntek Incorporated, Knight Piésold Consulting Volume 1 Executive Summary – Yellowknife Gold Project Feasibility Study Page 33
BCS/MLM Yellowknife_FS_Vol1_ExecSummary_250300.010_021_MLM.docx August 21, 2012
Table 8.8.1: Capital Cost Summary
Cost Element Estimated Cost (US$000’s) Direct Costs Crushing 5,794 Grinding 6,897 Flotation 11,687 Carbon-In Leach 1,674 Cyanide Detoxification 1,610 Carbon Strip and Reactivation 898 Gold Refining 551 Reagent Storage and Preparation 502 Utilities 29,908 Infrastructure and Support Facilities 33,881 Electrical, Instrumentation and Communications 7,223 Subtotal Direct Costs $100,628 Indirect Costs Contractor Mobilization and Demobilization 900 Large Crane and Heavy Equipment Rental 500 Construction Crew Mancamp Living Expenses 3,645 Construction phase transportation costs to Yellowknife Equipment Freight
1,680 4,318
Site Surveying 150 Small Tools and Consumables 1,181 Construction Equipment Rental 885 Construction Equipment Maintenance 148 Contractor Profit 3,541 Contractor Safety Equip. and Temp. Utilities 100 Construction Field Office, Wash Rooms, Crib Rooms 148 Commissioning and Start-Up Support - Lyntek 470 Consumables and First Fills excl. Diesel for Operations Diesel, First fills for operations Construction Diesel & LPG
Incl. in DCF model by SRK Incl. in DCF model by SRK
3,625 Capital Spares 2,098 Subtotal Indirect Costs $23,389 Subtotal Direct Costs $100,628 Total Capital Cost (Bare) $124,017 Contingency (%) Not included(1) Total Capital Cost $124,017 (1) No contingency is included in the CAPEX as this is handled separately in the form of a plant wide contingency.
Lyntek Incorporated provided estimates for all on site capital cost components associated with the
ore processing facilities, power and communications for the overall site, ancillary buildings, and other
infrastructure items.

SRK Consulting, Lyntek Incorporated, Knight Piésold Consulting Volume 1 Executive Summary – Yellowknife Gold Project Feasibility Study Page 34
BCS/MLM Yellowknife_FS_Vol1_ExecSummary_250300.010_021_MLM.docx August 21, 2012
9 Infrastructure
9.1 General Tyhee’s YGP is composed of a mining, milling, and refining operation on the site. The Ormsby Zone
is a combined open pit and underground mining operation designed to process 4,000 t/d of ore.
Construction of the plant is expected to take 19 months, though detailed construction planning is
pending the detailed design phase of the project.
9.2 Site Access The Ormsby site is only accessible by air either by landing at the current air strip or float dock or by
land through use of a winter ice road which begins at Prosperous Lake North of Yellowknife and
crosses roughly 90 km of frozen land and lakes. The winter ice road is constructed and operated for
approximately 3 to 5 months per year beginning in December and depending on ice conditions
allows actual transport of materials and supplies for about 2 to 3 months. The assumption made in
this report is that the ice will have sufficient thickness to support the weight of transported goods to
the mine site for two months of the year.
To account for any shifts in the formation of the ice road, annual storage of consumables is specified
at fourteen months. Tyhee has its own current Land Use Permit for construction of an ice road from
the mine site to the North end of Prosperous Lake and will not need to rely on the Tibbitt to
Contwyoto Joint Venture for the use of that winter road. It is intended that each year Tyhee will
construct the ice road to the site using this Land Use Permit these costs are included in Owner’s
Cost and G&A.
9.3 Mine Infrastructure
9.3.1 Truck Shop
A truck shop has been included in the infrastructure. The truck shop includes three drive-through
maintenance bays capable of handling the large haul equipment as well as tracked vehicles, one
drive through wash bay, and an attached 450 m2 workshop, tools and storage area.
9.4 Plant Infrastructure
9.4.1 General Plant Infrastructure
Geotechnical evaluation of the site prompted the decision to scale the site 2 m to eliminate damaged
bedrock, with the excavated material used as fill where necessary. Use of excavated material will
reduce the number of trucks traveling the ice road to prepare for construction. Cut slopes are
considered to be stable but, if considered prudent during construction, slopes will be stabilized using
rock bolts.
Existing facilities from previous exploration trips will be utilized for operations in addition to the newly
developed mine and plant. Facility design conforms to relevant industry standards and best
engineering practices.

SRK Consulting, Lyntek Incorporated, Knight Piésold Consulting Volume 1 Executive Summary – Yellowknife Gold Project Feasibility Study Page 35
BCS/MLM Yellowknife_FS_Vol1_ExecSummary_250300.010_021_MLM.docx August 21, 2012
The site will be exposed to harsh cold climates, limited access, and year round operations.
Considerations for these conditions include reliable power generation, fourteen month fuel and
reagent storage, insulated and heated buildings, a waste-heat recovery system, and on site water
supply with heat traced and insulated piping.
9.4.2 Site Utilities
Power is generated on site using a series of seven diesel generators to provide power for the
facilities around site while minimizing electrical losses with the chosen distribution system. Six
generators will be required to provide power to the plant and operations with one generator
remaining on standby to facilitate scheduled maintenance or provide power in the event of a failure
of one of the generator sets. The use of several generators minimizes plant shutdowns as multiple
failures are required to drop the generated power below the site power demand. Waste heat from
the generators is captured through a heat exchanger system, which heats water used to heat the
buildings. Raw water to site is pulled from Giauque Lake using redundant submersible pumps for
use on site as makeup process water or as domestic water with treatment. Water from Giauque
Lake is considered safe for use as potable water after sterilization to eliminate biological
contaminants. Water from specific facility operations, such as thickeners and filter presses, is
reclaimed to reduce the generation of waste water and the associated costs. Both the reclaim heat
system and electrical heaters are provided in the buildings to ensure proper control of the process
and safe occupancy conditions for operators.
9.4.3 Crushing Building
The crushing area is fed ore by haul trucks from the mine. Ore is sorted for crushing by the vibrating
grizzly feeder which feeds the jaw crusher. A conveyor system will route the crushed material to a
triple deck screen which feeds two cone crushers. Material from the crushing area is stored in fine
ore bins until being transferred to the mill.
9.4.4 Process Equipment
Process equipment housed in the mill building encompasses the comminution plant, flotation circuit,
CIL circuit, carbon reactivation, water storage, reagent preparation, utilities and gold room. Size
reduction is carried out by two ball mills on the west side of the building, each fed by a conveyor.
Cyclones are used for size separation following the two primary ball mills. The flotation circuit is
composed of two parallel sets of seven rougher tank cells, two parallel sets of three scavenger tank
cells, five cleaner/cleaner scavenger tanks and four second cleaner tanks. The plant area is also
equipped with a Vertimill for regrind of the rougher/scavenger concentrate ahead of the cleaner
circuit. The CIL process is composed of a leach solution tank, pre-leach tank, eight carbon
contacting tanks, detox tails storage tank and detox thickener. The flotation circuit is composed of a
fourteen tank rougher circuit, six scavenger tanks, six rougher cleaner tanks, five scavenger cleaner
tanks and four second cleaner tanks. The plant area is also equipped with a Vertimill for secondary
size reduction.
Equipment has been sized and specified to ensure that the process building is compact, making it
more energy efficient and less costly to construct. Buildings are predominantly heated using waste
heat recovery from the power generation units, as well as waste oil and lubricants primarily from the
mining fleet.

SRK Consulting, Lyntek Incorporated, Knight Piésold Consulting Volume 1 Executive Summary – Yellowknife Gold Project Feasibility Study Page 36
BCS/MLM Yellowknife_FS_Vol1_ExecSummary_250300.010_021_MLM.docx August 21, 2012
9.5 Security The site will be equipped with security cameras at points of entry. Additional security will be
provided for the gold room which will have restricted access and an alarm system. Gold room
facilities include electrowinning cells, a shaker table, a filter press and a refining area where the final
doré bars are stored in a secure vault.
9.6 Site Logistics Independent operation of this facility is essential. Adequate fuel storage and a backup generator
ensure that electrical power is able to meet the demand for the site. The dry storage area has been
sized to provide adequate storage for 14 month of supply for all reagents and other process
consumables and supplies. Three different workshop facilities are available to service the electrical,
mechanical, and mobile equipment as necessary. The electrical and mechanical workshops are
located inside of the mill building on the south side. Mobile equipment is serviced at the truck shop
located southwest of the mill. Truck shop facilities are equipped for three heavy vehicles bays and
include an internal tool shop and truck washing bay.
Laboratory facilities onsite allow personnel to optimize the process to varying conditions as well as
verify the recovery and grade of the product. The mancamp addition will provide room and board to
the expected personnel and provides the necessary facilities to keep the operation staffed and
running. Plant workers will be able to change clothing inside of the plant building where lockers,
restrooms, and showers have been made available. Additional mancamp facilities include a
cafeteria, laundry room, and recreation areas.
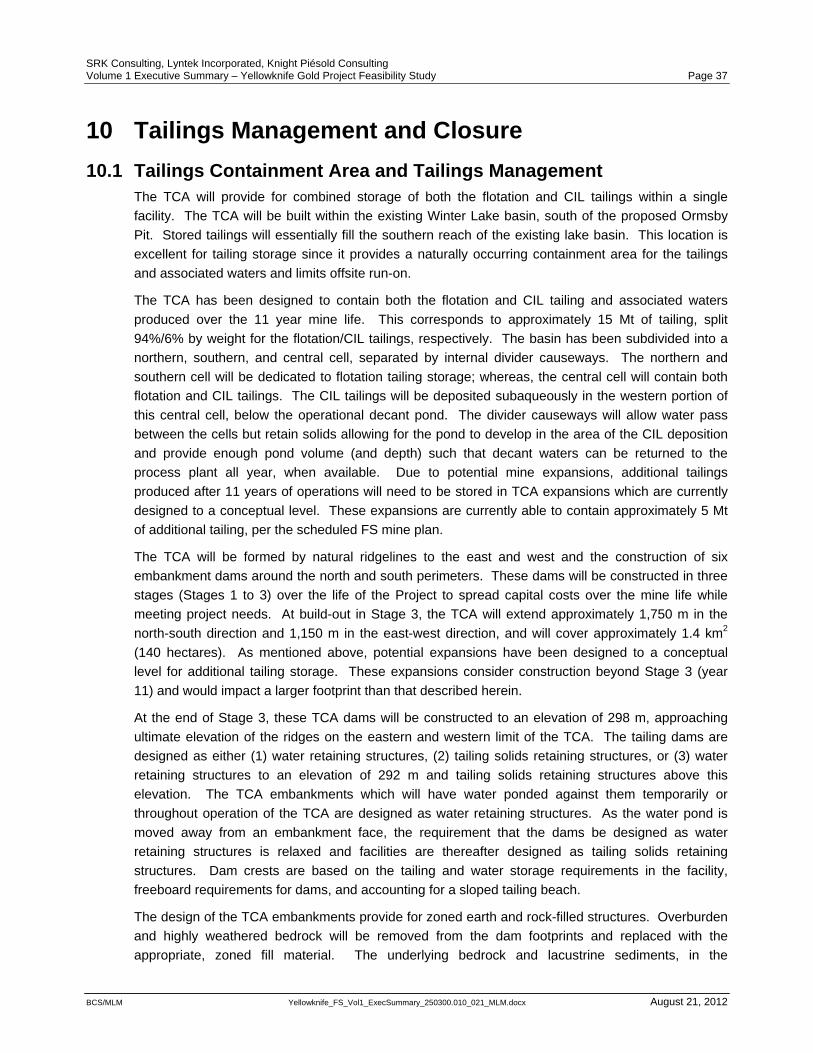
SRK Consulting, Lyntek Incorporated, Knight Piésold Consulting Volume 1 Executive Summary – Yellowknife Gold Project Feasibility Study Page 37
BCS/MLM Yellowknife_FS_Vol1_ExecSummary_250300.010_021_MLM.docx August 21, 2012
10 Tailings Management and Closure
10.1 Tailings Containment Area and Tailings Management The TCA will provide for combined storage of both the flotation and CIL tailings within a single
facility. The TCA will be built within the existing Winter Lake basin, south of the proposed Ormsby
Pit. Stored tailings will essentially fill the southern reach of the existing lake basin. This location is
excellent for tailing storage since it provides a naturally occurring containment area for the tailings
and associated waters and limits offsite run-on.
The TCA has been designed to contain both the flotation and CIL tailing and associated waters
produced over the 11 year mine life. This corresponds to approximately 15 Mt of tailing, split
94%/6% by weight for the flotation/CIL tailings, respectively. The basin has been subdivided into a
northern, southern, and central cell, separated by internal divider causeways. The northern and
southern cell will be dedicated to flotation tailing storage; whereas, the central cell will contain both
flotation and CIL tailings. The CIL tailings will be deposited subaqueously in the western portion of
this central cell, below the operational decant pond. The divider causeways will allow water pass
between the cells but retain solids allowing for the pond to develop in the area of the CIL deposition
and provide enough pond volume (and depth) such that decant waters can be returned to the
process plant all year, when available. Due to potential mine expansions, additional tailings
produced after 11 years of operations will need to be stored in TCA expansions which are currently
designed to a conceptual level. These expansions are currently able to contain approximately 5 Mt
of additional tailing, per the scheduled FS mine plan.
The TCA will be formed by natural ridgelines to the east and west and the construction of six
embankment dams around the north and south perimeters. These dams will be constructed in three
stages (Stages 1 to 3) over the life of the Project to spread capital costs over the mine life while
meeting project needs. At build-out in Stage 3, the TCA will extend approximately 1,750 m in the
north-south direction and 1,150 m in the east-west direction, and will cover approximately 1.4 km2
(140 hectares). As mentioned above, potential expansions have been designed to a conceptual
level for additional tailing storage. These expansions consider construction beyond Stage 3 (year
11) and would impact a larger footprint than that described herein.
At the end of Stage 3, these TCA dams will be constructed to an elevation of 298 m, approaching
ultimate elevation of the ridges on the eastern and western limit of the TCA. The tailing dams are
designed as either (1) water retaining structures, (2) tailing solids retaining structures, or (3) water
retaining structures to an elevation of 292 m and tailing solids retaining structures above this
elevation. The TCA embankments which will have water ponded against them temporarily or
throughout operation of the TCA are designed as water retaining structures. As the water pond is
moved away from an embankment face, the requirement that the dams be designed as water
retaining structures is relaxed and facilities are thereafter designed as tailing solids retaining
structures. Dam crests are based on the tailing and water storage requirements in the facility,
freeboard requirements for dams, and accounting for a sloped tailing beach.
The design of the TCA embankments provide for zoned earth and rock-filled structures. Overburden
and highly weathered bedrock will be removed from the dam footprints and replaced with the
appropriate, zoned fill material. The underlying bedrock and lacustrine sediments, in the

SRK Consulting, Lyntek Incorporated, Knight Piésold Consulting Volume 1 Executive Summary – Yellowknife Gold Project Feasibility Study Page 38
BCS/MLM Yellowknife_FS_Vol1_ExecSummary_250300.010_021_MLM.docx August 21, 2012
southeastern reach of the facility, appear adequate for founding the tailing dams. Construction of the
embankments is based on the use of on-site materials.
Results of the operational water balance have been used to size the TCA and provide parameters for
their operation. This includes parameters related to providing fresh and return water to the process
facilities, and anticipates that no planned, controlled discharges to the downstream receiving
environment will be necessary. Although the new water balance indicates that no discharge from the
TCA to the downstream environment is expected during operation, Tyhee recognizes that the ability
to allow discharge of TCA supernatant may be required at some point during the planned mine life
and expect the option to do so would be included in the operations water license issued by the
Mackenzie Valley Land and Water Board (MVLWB) following the Regulatory Phase. The YGP is
committed to meeting MMER discharge criteria on any releases to the downstream environment as
well as CCME water quality guidelines in downstream receiving water bodies. Based on current test
work on the YGP process waste streams, any releases from the TCA are expected to meet the
MMER standards at the point of discharge and the resulting concentrations in Narrow Lake are
expected to meet the CCME guidelines.
10.2 TCA Closure The design and operating criteria for the tailing impoundment considers closure and reclamation of
the tailing mass. The tailings facility surface will be covered using a combination of soil and
geosynthetics to allow revegetation and provide a low permeability cover over the CIL tailing to limit
potential oxidation. Voluntary revegetation is anticipated over the tailings covers. Pipelines will be
removed and disposed of.

SRK Consulting, Lyntek Incorporated, Knight Piésold Consulting Volume 1 Executive Summary – Yellowknife Gold Project Feasibility Study Page 39
BCS/MLM Yellowknife_FS_Vol1_ExecSummary_250300.010_021_MLM.docx August 21, 2012
11 Project Implementation The Tyhee YGP occurs as three separate claim/lease blocks that extend from Clan Lake
(approximately 60 km north of the city of Yellowknife) to Nicholas Lake (approximately 100 km north-
northeast of Yellowknife). The YGP consists of 14 mineral leases and 13 mineral claims that total
10,520 hectares (25,985 acres). The site is accessible by seasonal winter road and year round by
aircraft during daylight hours. The 1,100 m long gravel airstrip is able to accommodate cargo and
passenger airplanes as large as a Buffalo or Dash 7 aircraft. Giauque Lake provides float plane
access to the property by means of a wharf connecting to the camp by an all season gravel road.
The current project plan allows for the development of the concentrator to treat the Ormsby ore, with
an allowance for supplemental ore from Nicholas Lake in year two.
A key consideration in the implementation plan is the seasonal road. All shipments will need to be
scheduled to coincide with the 2014 and 2015 seasonal road availability.
11.1 Project Execution
11.1.1 Scope of Work
Tyhee has retained several engineering companies to assist in the design and development of the
property into a producing project. SRK is acting as the lead engineering company for this project
development, including the mine design, and related facilities. KP has been assigned the
responsibility of designing the TCA and developing all the necessary site geotechnical studies, to
allow for the design and construction of the TCA and plant site foundations. Lyntek has been
assigned the process plant design, man-camp, utilities/support facilities, project logistics and
transportation, including evaluation of equipment options and recommendations on equipment and
supplies.
The Project scope of work includes designing the entire project facility starting with:
The mine and mining method – SRK;
Ore handling and crushing – Lyntek;
Milling and processing – Lyntek;
TCA – KP;
Waste ore dumps- SRK;
All site infrastructure, roads, utilities, communications, etc. – SRK / Lyntek;
Site Logistics, including transportation of goods and men – Lyntek / Tyhee;
Other site facilities, including man-camp, maintenance and shop facilities – Lyntek / Tyhee;
and
Fuel storage and power generation and distribution – Lyntek.
Feasibility-level engineering has been completed in all of these areas to allow the development of a
project execution plan starting in Q3 of 2012, and completion in Q3 of 2015 with production starting
at the beginning of Q4 in 2015.

SRK Consulting, Lyntek Incorporated, Knight Piésold Consulting Volume 1 Executive Summary – Yellowknife Gold Project Feasibility Study Page 40
BCS/MLM Yellowknife_FS_Vol1_ExecSummary_250300.010_021_MLM.docx August 21, 2012
11.1.2 Engineering, Procurement and Construction Management (EPCM) Execution Schedule
A detailed preliminary schedule has been developed for the project that will allow production to begin
in October 2015
The detailed engineering for this project is anticipated to commence early in the 3rd quarter 2012,
with procurement of the primary ball mills early in the 4th quarter that same year (First week of
October 2012). The completion of the detailed design is expected by the end of 2013 with some
construction related design activities still required in Q1 of 2014.
It will be necessary to procure additional long lead items before the completion of the detailed
engineering study. An early review and detailing of the construction schedule in 2012 will allow
refinements to be made to the procurement schedules of the project. The detailed engineering will
be prioritized accordingly to ensure readiness of the design in time for the procurement requirements
of the project.
In preparation for the site construction phase and the first shipments to site in Q1 of 2014, the
following activities will need to be completed in 2013;
A temporary laydown area will need to be prepared at Tyhee site in preparation of receiving
the first shipments in February 2014;
The contractor for the ice road will need to be selected;
Primary haul contractor identified and selected. This will need to be completed early in 2013
so as to ensure adequate availability of trucks and a suitable staging area in Yellowknife to
allow the staging of the shipments on the ice road;
Long term diesel supply contracts will need to be established to ensure adequate availability
of diesel both for the construction phase as well as the production phase of the project;
Construction contractor(s) will need to be selected;
Temporary (enviro) diesel storage tanks will need to be secured to allow adequate fuel
storage for the construction phase;
An aggregate plant and a batch plant will need to be secured;
Temporary generators will need to be secured to provide power for the mancamp and the
construction activities during the construction phase; and
Logistics and supply contracts will need to be in place to provide for the construction crews.
The bulk of the procurement for the buildings, civils, initial equipment, site contractors and storage
facilities will begin in early 2013 to ensure availability of services, and the delivery of the materials to
Yellowknife for the 2014 ice-road season.
The balance of the procurement, including the bulk of the equipment, will begin early 2014 to ensure
delivery of the equipment to Yellowknife for the 2015 ice-road season.
Special consideration will be given to staging. All loads will be staged in Yellowknife at a marshaling
yard with a specific emphasis on prioritizing deliveries to site, maximizing utilization of the trucks,
maximizing use of the periods where heavy loads can be transported.
It is expected that site preparation will be completed by the end of April 2014. Concrete pouring will
begin early May 2014 once temperatures have moderated.
It is planned to complete the following activities before the onset of winter in 2014:

SRK Consulting, Lyntek Incorporated, Knight Piésold Consulting Volume 1 Executive Summary – Yellowknife Gold Project Feasibility Study Page 41
BCS/MLM Yellowknife_FS_Vol1_ExecSummary_250300.010_021_MLM.docx August 21, 2012
The primary ball mills will be set in place;
The main concentrator building, the truck shop, and the long term storage area will be
erected and skinned suitable for winter construction to take place inside these buildings; and
Half of the permanent diesel storage tanks will be erected in preparation of receiving the
construction and production fuel requirements for 2015.
The 2014/2015 winter construction period will be used to finish off the inside of the buildings, erect
structural steel, manufacture large tanks, and start on piping and electrical.
The balance of the site construction activities will commence in March 2015 with the arrival of the
first loads on the 2015 ice road. Mechanical completion is planned for early September 2015, with
commissioning completed by October 1, 2015.
11.2 Project Considerations The location of this plant requires some specific considerations associated with the development of a
plant in the NWT. The two dominant considerations relate to the reliance on a seasonal ice road and
the influence of a harsh winter on construction schedules. Specific measures have been
implemented in the Project Execution Plan to mitigate the potential risks.
11.2.1 Logistics
One of the primary considerations associated with the procurement and construction phase of this
project relates to the reliance on a seasonal road for the transport of all major equipment, materials,
and consumables to site.
Two measures are implemented in the Project Execution Plan to offset this risk:
Construction has been spread over two summer seasons. This reduces the dependence of
the project on a single ice road season; and
All major shipments will be staged in Yellowknife, with critical items required in Yellowknife
by December 31st of 2013 and 2014. This will allow a two month buffer before the opening
of the seasonal road, with an additional two months buffer before the seasonal road is no
longer passable.
The delivery schedules for long lead items used in the EPCM schedule have been confirmed by the
equipment vendors.
The site can be accessed by air throughout the year which will provide adequate capability for
bringing small (less than 4 t) supplies to site if required.
11.2.2 Weather
To help minimize the risk associated with a harsh winter in 2013-2014, the construction is scheduled
over two summer seasons. The first season in 2013-2014 will concentrate on the completion of the
civil works, the erection of the mill buildings, the erection of the mancamp, and the installation of
sufficient tankage to provide the diesel storage requirements for the first year of operation. An
enclosed and heated workspace (the concentrator building and the truck shop) will be available for
continued activity during the winter months.

SRK Consulting, Lyntek Incorporated, Knight Piésold Consulting Volume 1 Executive Summary – Yellowknife Gold Project Feasibility Study Page 42
BCS/MLM Yellowknife_FS_Vol1_ExecSummary_250300.010_021_MLM.docx August 21, 2012
The second summer season (2014-2015), will be used to install the balance of the equipment and to
prepare the plant for a September/October startup. Starting construction in 2014 will allow adequate
time to prepare the site for equipment and consumables shipments in 2015. It will also allow any
construction delays due to a harsh winter to be recovered, either with extra activity in the winter, or
by moving some of the construction tasks to 2015.
11.2.3 Project Engineering & Procurement Schedule
Reliance on the ice roads for all major shipments will require an engineering and procurement
schedule specifically tailored to meet the delivery schedule for all major equipment and supplies.
The Engineering and Procurement schedules developed for the project make specific allowances to
ensure that necessary activities are prioritized so as to ensure sufficient time is available to procure
and ship all equipment and materials to Yellowknife. Buffers have been included to minimize risk
associated with late delivery of equipment. A very fast start to the procurement schedule is required
and anticipated. Equipment selections for long lead items have been finalized as part of this FS.
11.2.4 Corporate Health and Safety Policy Statement
Tyhee is committed to preventing the accidental loss of any of its resources, including employees
and physical assets.
In fulfilling this commitment to protect both people and property, management will provide and
maintain a safe and healthy work environment in accordance with industry standards and in
compliance with legislative requirements, and will strive to eliminate any foreseeable hazards which
may result in property damage, accidents, or personal injury/illness.
We recognize that the responsibility for health and safety are shared. All employees will be equally
responsible for minimizing accidents within our facilities and on our work sites. Safe work practices
and job procedures will be clearly defined in Tyhee’s Policies & Procedures Manual for all employees
to follow.
Accidental loss can be controlled through good management in combination with active employee
involvement. Safety is the direct responsibility of all managers, supervisors, employees, and
contractors.
All management activities will comply with Tyhee’s safety requirements as they relate to planning,
operation and maintenance of facilities and equipment. All employees will perform their jobs properly
in accordance with established procedures and safe work practices.
The safety information in this policy does not take precedence over Occupational Health and Safety
legislation. All employees should be familiar with the NWT Mine Health & Safety Act and
Regulations.
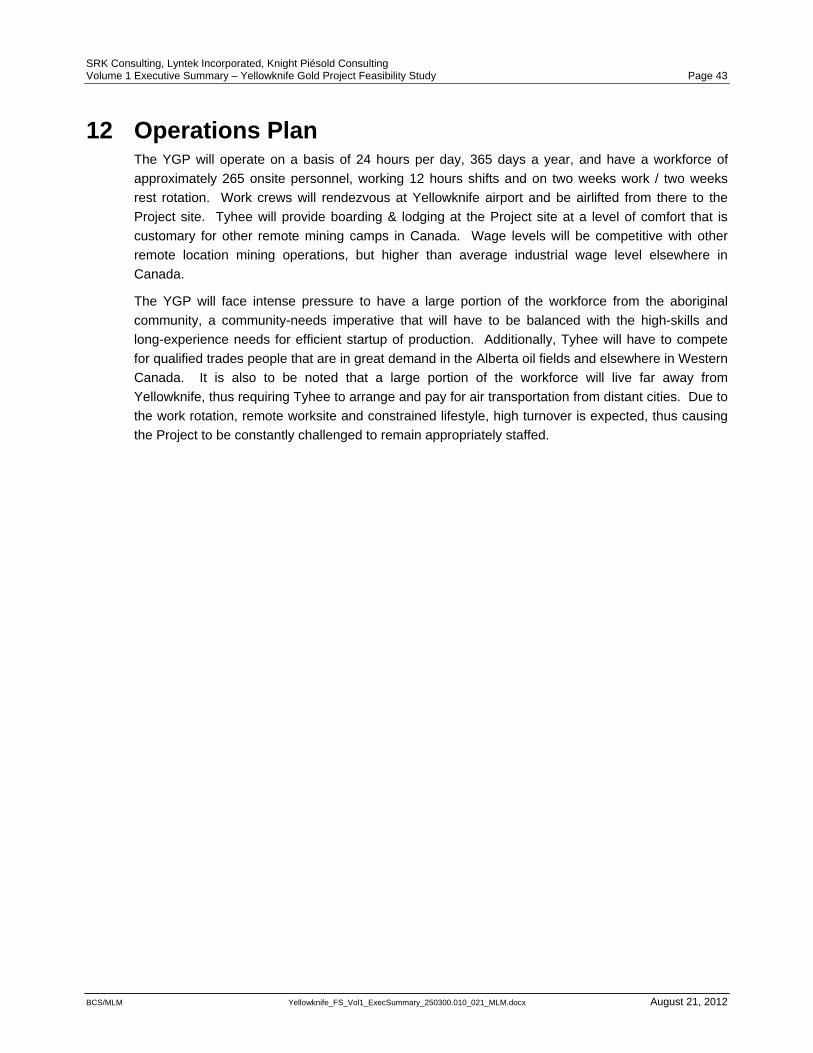
SRK Consulting, Lyntek Incorporated, Knight Piésold Consulting Volume 1 Executive Summary – Yellowknife Gold Project Feasibility Study Page 43
BCS/MLM Yellowknife_FS_Vol1_ExecSummary_250300.010_021_MLM.docx August 21, 2012
12 Operations Plan The YGP will operate on a basis of 24 hours per day, 365 days a year, and have a workforce of
approximately 265 onsite personnel, working 12 hours shifts and on two weeks work / two weeks
rest rotation. Work crews will rendezvous at Yellowknife airport and be airlifted from there to the
Project site. Tyhee will provide boarding & lodging at the Project site at a level of comfort that is
customary for other remote mining camps in Canada. Wage levels will be competitive with other
remote location mining operations, but higher than average industrial wage level elsewhere in
Canada.
The YGP will face intense pressure to have a large portion of the workforce from the aboriginal
community, a community-needs imperative that will have to be balanced with the high-skills and
long-experience needs for efficient startup of production. Additionally, Tyhee will have to compete
for qualified trades people that are in great demand in the Alberta oil fields and elsewhere in Western
Canada. It is also to be noted that a large portion of the workforce will live far away from
Yellowknife, thus requiring Tyhee to arrange and pay for air transportation from distant cities. Due to
the work rotation, remote worksite and constrained lifestyle, high turnover is expected, thus causing
the Project to be constantly challenged to remain appropriately staffed.

ID Task Name Duration Start Finish Predecessors Successors
0 Tyhee Gold Corp. 1153 days Mon 7/16/12 Thu 10/1/15
1 FEASIBILITY STUDY 28 days Mon 7/16/12 Thu 8/23/12
6 FEASIBILITY STUDY GEOCHEM 115 days Mon 7/16/12 Thu 12/27/12
8 PROJECT FINANCING 180 days Mon 7/16/12 Fri 3/29/13
10 ENVIRONMENTAL & PERMITTING 435 days Mon 7/16/12 Mon 3/31/14
12 DAR PROCESS 250 days Mon 7/16/12 Mon 7/8/13
14 REGULATORY PHASE 175 days Tue 7/9/13 Mon 3/17/14
16 ENGINEERING & DESIGN - YEAR 2012 162 days Wed 8/1/12 Wed 3/20/13
28 PROCUREMENT ACTIVITIES - YEAR 2012 462 days Fri 8/17/12 Fri 11/29/13
35 ENGINEERING & DESIGN - YEARS 2013 - 2014 383 days Wed 8/1/12 Fri 1/31/14
119 DESIGN PHASE COMPLETION 160 days Thu 8/1/13 Tue 3/18/14
124 PROCUREMENT ACTIVITIES - YEAR 2013 757 days Fri 11/9/12 Thu 12/18/14
223 PROCUREMENT ACTIVITIES - YEAR 2014 403 days Tue 11/5/13 Fri 12/19/14
355 SITE CONTRUCTION PACKAGES - 2013 89 days Wed 5/1/13 Tue 7/30/13
363 CONSTRUCTION ACTIVITIES - YEAR 2013 84 days Thu 5/16/13 Fri 8/9/13
365 CONSTRUCT WINTER ROAD 778 days Tue 1/15/13 Sun 3/15/15
369 CONSTRUCTION ACTIVITIES - 2014 519 days Tue 9/3/13 Thu 2/12/15
425 CONSTRUCTION ACTIVITIES - YEAR 2015 226 days Fri 1/23/15 Tue 9/8/15
459 MECHANICAL COMPLETION 0 days Thu 9/17/15 Thu 9/17/15 462FF-14 days
460 PLANT COMMISSIONING 60 days Sun 8/2/15 Thu 10/1/15
462 PLANT START-UP 0 days Thu 10/1/15 Thu 10/1/15 459FF-14 days,
9/17
10/1
Qtr 2 Qtr 3 Qtr 4 Qtr 1 Qtr 2 Qtr 3 Qtr 4 Qtr 1 Qtr 2 Qtr 3 Qtr 4 Qtr 1 Qtr 2 Qtr 3 Qtr 4 Qtr 12013 2014 2015 2016
Task
Split
Milestone
Summary
Project Summary
External Tasks
External Milestone
Deadline
Progress
Tyhee Gold Corp. NWT Gold Project
7‐Day Week for Procurement/Construction
Page 1
Lyntek Project No.: 11027Date: Tue 7/31/12

SRK Consulting, Lyntek Incorporated, Knight Piésold Consulting Volume 1 Executive Summary – Yellowknife Gold Project Feasibility Study Page 45
BCS/MLM Yellowknife_FS_Vol1_ExecSummary_250300.010_021_MLM.docx August 21, 2012
14 Financial Analysis Principal Assumptions
The gold price used in the technical economic model is based on the 36-month moving average. As
of July 2012, the 36-month average was US$1,396.35/oz. For the purposes of economic analysis a
rounded up average of US$1,400/oz Au has been used for reserves and economic modeling.
The economic model presented is a base case, technical economic model and constructed on a pre-
tax basis. The model assumes 100% equity to provide a clear picture of the technical merits of the
project. Principal assumptions used are summarized in Table 14.1.
Table 14.1: Principal Assumptions
Model Parameter Technical Input General Assumptions Preproduction Period 32 months Ormsby OP Mine Life 8.67 years Bruce OP Mine Life 1.00 years Clan Lake OP Mine Life 3.00 years Nicholas UG Mine Life 9.67 years Ormsby UG Mine Life 6.00 years Process Plant Life 14.33 years Operating Days per Year 365 days/yr Production Rate 4,000 t/d Market Assumptions Discount Rate 5% Gold Price US$1,400/oz Au Royalty 3rd Party 2.25%
A 32-month preproduction period is assumed to allow for construction of site access and associated
infrastructure. The Project will have an estimated life of 14.33 years given the reserves described in
Section 6 at the assumed production rate of 4,000 t/d.
Capital Cost
Life of mine (LoM) capital costs totaling US$265.2 million are summarized in Table 14.2.
Preproduction capital costs are estimated at US$193 million. Ongoing capital costs of US$72.2
million account for the remaining mine life expenditure and are classified as sustaining capital.
Capital cost estimates are stated in Q2 2012 US constant dollar terms with a US to Canada
exchange rate assumption of US$1.00:C$1.00.

SRK Consulting, Lyntek Incorporated, Knight Piésold Consulting Volume 1 Executive Summary – Yellowknife Gold Project Feasibility Study Page 46
BCS/MLM Yellowknife_FS_Vol1_ExecSummary_250300.010_021_MLM.docx August 21, 2012
Table 14.2: LoM Capital Costs
Description Initial
Capital(US$000’s)
Sustaining Capital
(US$000’s)
LoM CapitalCost
(US$000’s) Capitalized Costs Open Pit Mining(Pre-Production and Diesel) 7,213 2,269 9,482 Processing 990 8,484 9,474 G&A 21,241 0 21,241 Subtotal 29,444 10,753 40,198 Capital Costs Open Pit Mining 23,490 33,586 57,076 Underground Mining 0 9,480 9,480 Process Plant & Site Infrastructure 117,955 6,062 124,017 Tailings Storage Facilities 6,121 1,335 7,456 Owners Costs 4,149 0 4,149 Mine Closure 0 10,460 10,460 Project Contingency(@10%ofProcess&Infrastructure) 11,796 606 12,402 Subtotal 163,511 61,529 225,040 Total Capital 192,955 72,283 265,238
Operating Cost
LoM operating costs are summarized in Table 14.3. Operating cost estimates are in Q2 US constant
dollar terms.
Table 14.3: LoM Operating Cost Summary
Description Unit Rate
(US$/t-RoM) Unit Cost
(US$/t-Moved) LoM Cost
(US$000’s) Open Pit Mining(1) 17.716 1.807 362,004 Underground Mining 5.541 40.419 113,218 Rehandle 0.813 1.386 16,612 Processing 21.303 21.303 435,291 G & A 4.369 4.369 89,271 Total Opex $49.741 - $1,016,396 (1) Does not include mine pre-production capitalized cost
Pre-Tax Financial Results
The financial analysis results, shown in Table 14.4, indicate a pre-tax NPV5% of US$215.7 million
with an IRR of 20%. Pre-tax payback occurs 42 months after the start of gold production (Q1 2019).
The following provides the basis of the LoM plan and economics:
Total project life of 15 years using three open pits and two underground mines;
An overall average metallurgical recovery rate of 90.5% Au, over the LoM that includes 92%
recovery for Ormsby, Clan and Bruce Lake ores and 82% for Nicholas;
A cash operating cost of US$853.86/oz-Au;
Mine closure costs, included in the above sustaining capital estimate, of US$10 million; and
No provision for salvage value.

SRK Consulting, Lyntek Incorporated, Knight Piésold Consulting Volume 1 Executive Summary – Yellowknife Gold Project Feasibility Study Page 47
BCS/MLM Yellowknife_FS_Vol1_ExecSummary_250300.010_021_MLM.docx August 21, 2012
Table 14.4: Pre-Tax Financial Model Results
Description Units Value Unit Cost
(US$/oz-Au) Production Ore Processed kt 20,434 - Gold Recovered koz 1,207 - Estimate of Cashflow Gold Price US$/oz-Au $1,400.00 -
Gross Revenue US$000’s 1,689,522 - Refinery Charge US$000’s (8,448) (7.00) Freight US$000’s (86) (0.07) Insurance US$000’s (252) (0.21)
NSR US$000’s 1,680,736 $1,392.72 Nicholas Lake Royalty US$000’s (5,259) (4.36)
Net Revenue US$000’s 1,675,477 $1,388.36 Operating Costs OP Mining US$000’s 362,004 299.97 UG Mining US$000’s 113,218 93.82 Rehandle US$000’s 16,612 13.77 Processing US$000’s 435,291 360.70 G & A US$000’s 89,271 73.97
Total Operating Costs US$000’s 1,016,396 $842.22 LoM Cash Cost US$/oz-Au 853.86
Operating Profit US$000’s 659,080 $546.14 Capital Expenditure US$000’s (225,040) - Capitalized Costs US$000’s (40,198) -
Pre-Tax Cashflow US$000’s 393,843 $326.35 NPV @5% US$000’s 215,724 -
IRR % 20% -
Post-Tax Financial Results
All results presented in this section are based on a monthly cash flow developed by SRK. The SRK
LoM plan and post-tax economics are based on the base case presented above with the addition of
the following:
The NWT Mining Tax is US$58.2 million over the LoM at an average rate of 9.6% after
deductions;
A total income tax rate of 26.5%;
Current company loss carry forward of US$13.8 million;
Initial capital and capitalized costs are added to the loss carry forward for Class41(A) tax
calculation; and
Project payback 4.1years after the start of production.
The post-tax case economic analysis results, shown in Table 5.3.1, indicate a post-tax net present
value of US$115.1 million at a 5% discount rate with an IRR of 15%.

SRK Consulting, Lyntek Incorporated, Knight Piésold Consulting Volume 1 Executive Summary – Yellowknife Gold Project Feasibility Study Page 48
BCS/MLM Yellowknife_FS_Vol1_ExecSummary_250300.010_021_MLM.docx August 21, 2012
Table 14.5: Post-Tax Financial Model Results
Description Units Value Unit Cost
(US$/oz-Au) Production Ore Processed kt 20,434 - Gold Recovered koz 1,207 - Estimate of Cashflow Gold Price US$/oz-Au $1,400.00 -
Gross Revenue US$000’s 1,689,522 - Refinery Charge US$000’s (8,448) ($7.00) Freight US$000’s (86) ($0.07) Insurance US$000’s (252) ($0.21)
NSR US$000’s 1,680,736 $1,392.72 Nicholas Lake Royalty US$000’s (5,259) ($4.36)
Net Revenue US$000’s 1,675,477 $1,388.36 Operating Costs OP Mining US$000’s 362,004 $299.97 UG Mining US$000’s 113,218 $93.82 Rehandle US$000’s 16,612 $13.77 Processing US$000’s 435,291 $360.70 G & A US$000’s 89,271 $73.97
Total Operating Costs US$000’s 1,016,396 $842.22 LoM Cash Cost US$/oz-Au $0.00
Operating Profit US$000’s 659,080 $546.14 Capital Expenditure US$000’s (225,040) - Capitalized Costs US$000’s (40,198) -
Pre-Tax Cashflow US$000’s 393,843 $326.35 NWT Mining Tax US$000’s (58,251) - Income Tax US$000’s (99,491) -
After-Tax Cashflow US$000’s 236,100 NPV @5% US$000’s 115,139 -
IRR % 15% - Payback years 4.1 -
Sensitivity
Sensitivity analyses for key economic parameters are shown in Tables 14.6 and 14.7. This analysis
suggests that the project is most sensitive to market price. Operating costs are more sensitive than
capital costs primarily due to the diesel fuel price.
Table 14.6: Project Sensitivity (NPV5%, US$000’s)
Description -20% -15% -10% -5% Base 5% 10% 15% 20% Pre-Tax Revenue (7,476) 48,324 104,124 159,924 215,724 271,523 327,323 383,123 438,923 Opex 348,134 315,032 281,929 248,826 215,724 182,621 149,518 116,415 83,313 Diesel 276,180 262,133 247,374 231,905 215,724 198,831 181,228 162,913 143,887 Capex 262,234 250,606 238,979 227,351 215,724 204,096 192,469 180,841 169,214 Post-Tax Revenue (31,366) 6,651 43,058 79,468 115,139 151,765 187,169 222,403 257,490 Opex 201,282 180,114 158,886 136,618 115,139 93,798 72,371 50,140 28,255 Diesel 155,608 146,365 135,854 125,706 115,139 104,071 92,646 80,761 68,153 Capex 152,097 143,139 134,164 124,413 115,139 106,105 97,039 87,953 77,973

SRK Consulting, Lyntek Incorporated, Knight Piésold Consulting Volume 1 Executive Summary – Yellowknife Gold Project Feasibility Study Page 49
BCS/MLM Yellowknife_FS_Vol1_ExecSummary_250300.010_021_MLM.docx August 21, 2012
Table 14.7: Gold Price Sensitivity
Gold Price Sensitivity $1,300 $1,400 $1,500 $1,600 $2,500 Pre-Tax NPV5% (US$000’s) 136,010 215,724 295,438 375,152 1,092,578 IRR 15% 20% 24% 28% 52% Post-Tax NPV5% (US$000’s) 63,658 115,139 166,957 217,379 666,312 IRR 11% 15% 18% 21% 43%

SRK Consulting, Lyntek Incorporated, Knight Piésold Consulting Volume 1 Executive Summary – Yellowknife Gold Project Feasibility Study Page 50
BCS/MLM Yellowknife_FS_Vol1_ExecSummary_250300.010_021_MLM.docx August 21, 2012
15 Opportunities and Risks
15.1 Land and Legal Public lands where the YGP is located are part of the aboriginal land claims process in Canada,
wherein the Government of Canada is responding to the certain rights being asserted by the
aboriginal people. It is uncertain how and when this process will come to a conclusion and what
impact it may have on the YGP.
Whereas most of the mineral rights are subject to private royalties payable to the vendors, it may be
possible to reduce the quantum of, or eliminate the royalties, within the terms of the purchase
agreements, negotiations, or otherwise.
15.2 Geology and Resources The primary risk associated with the resource estimates and the mining plan is in the geological
models. The risk is mitigated as much as possible by the geological models being derived from
observation of underground and surface exposures and diamond drill core.
The discovery of previously unknown gold mineralization is usual during mining operations due to
occurrences of gold mineralization not encountered in diamond drill core. Mining operations also
provide the opportunity for geological staff to improve the geological models.
The potential for the development of additional resource exists for the Ormsby, Nicholas Lake,
Goodwin Lake and Clan Lake properties. The deposits are open laterally or vertically and additional
diamond drilling has the potential to develop significant new gold resource.
The resource potential of the Ormsby deposit is limited laterally but unbounded vertically. Diamond
drilling that defines the Ormsby gold resource demonstrates geological continuity to the bottom of the
known gold resource, approximately 400 m below surface. Two deep diamond drill holes show the
amphibolite and gold mineralization occur 650 m below the surface. The nearby Discovery Mine
deposit, which produced 1,000,000 oz of gold from stopes as deep as 1,240 m below surface,
suggests a possible vertical extent to the Ormsby deposit.
Diamond drilling limits the lateral extent of the Nicholas Lake deposit but the deposit is unbounded
below the bottom of Nicholas Lake resource approximately 360 m below surface.
The Goodwin Lake property has some potential for diamond drilling to expand the Vad Zone
resource and the property hosts a prospective metavolcanic unit with historical gold showings.
The Clan Lake Main Zone gold deposit is unbounded both laterally and vertically. Considering only
the immediate vicinity of the Clan Lake Main Zone gold deposit, diamond drill programs have been
conducted on only 25% to 30% of the area that surface prospecting has demonstrated to contain
gold mineralization. The 10,381 acre Clan Lake property hosts highly prospective metavolcanic units
and numerous gold showings over a 7 km north-south trend. All of the showings have geological
and mineralogical similarities to the Clan Lake Zone gold deposit.

SRK Consulting, Lyntek Incorporated, Knight Piésold Consulting Volume 1 Executive Summary – Yellowknife Gold Project Feasibility Study Page 51
BCS/MLM Yellowknife_FS_Vol1_ExecSummary_250300.010_021_MLM.docx August 21, 2012
15.3 Open Pit Mining Any potential resource expansion for Ormsby, Bruce, Nicholas Lake or associated targets along the
mineralization trend would have the benefit of taking demand off the Ormsby open pit and potentially
increasing the grade being fed through the plant. These additional resources would enable the
production rate to be scaled back at Ormsby, thus reducing the sustaining capital required.
There is a history of mining within the YGC region. This will help sourcing of technical and hourly
staff who wish to stay in the Yellowknife area rather than commuting to the far north mining
operations. Yellowknife also has good infrastructure to support mining operations.
A dedicated all-weather road would remove the risk of fuel shortages and ability to source critical
spares. Although this is possible to alleviate with heavy lift helicopters, there would be a significant
cost savings. The additional benefit would include cheaper transportation rates for Nicholas Lake
and Clan Lake.
Increased slope angles will allow the open pit to reduce the overall strip ratio and at the same time
increase the potential open pit reserves. Depending on economics it may be possible to liberate the
high grade ore currently being targeted by underground operations below the current pit floor.
After open pit operations commence, the quantity and quality of ore will soon be realized and the
grade model calibrated. This reconciliation may or may not improve the quality of ore but has the
potential to fill in the blanks if the mineralization is more consistent than that realized from drill core.
The mineralization of the Ormsby deposit is controlled by the level of silicification rather than
lithological control. As such, it will not be possible to proportion the effect of the selective mining unit
on the mineralization control. Therefore, the estimation of composited gold into the selective mining
unit is the only inherent dilution applied to the Ormsby model. To counter this, a 3 m x 3 m blast
pattern in ore combined with two samples per hole has been costed in the model. From an
operational perspective, it will be vital to ensure the information sampled is made available for
precise selective mining of the ore by excavator operators.
Where possible, at least 60 m was left between phase walls that formed the basis of the production
schedule. While this is adequate for a FS, careful control of pit congestion and blasted inventory will
need to be monitored to determine if this mining width is adequate.
Fuel must be transported in once a year via the ice road; if estimates are incorrect, there is the risk
production targets will not be met.
Labor rates and cost escalation will all play a part in mining to an economical level given the
geographical location of the deposit.
Drill and blast operations are relatively expensive. Due to the grade control requirement the 0.6 kg/t
powder factor for ore is sufficient but waste uses a 0.25 kg/t powder factor that was based on the
assumption that the rock shatters well (as indicated during underground operations when the
Ormsby decline was driven). If this assumption is incorrect and fragmentation becomes a problem,
drill and blast cost may escalate.
Acid rock drainage and metals base accounting indicate that the potential for oxidation and liberation
of deleterious elements will be slow but do exist. It will be important to instill an operational culture

SRK Consulting, Lyntek Incorporated, Knight Piésold Consulting Volume 1 Executive Summary – Yellowknife Gold Project Feasibility Study Page 52
BCS/MLM Yellowknife_FS_Vol1_ExecSummary_250300.010_021_MLM.docx August 21, 2012
that understands the negative effects of acid rock drainage (ARD) and ensure potentially acid
generating material is encapsulated as specified in the Waste Rock Facility plan.
15.4 Underground Mining There is an opportunity to mine a greater proportion of the orebody than has been presented in this
design. A long-term gold price of US$1,250/oz has been used to calculate the CoG and hence the
stoping limits. However, the current gold price is higher and if used to plan the short-term
production, would result in a lower CoG. This would lead to more material being included within the
economic stope limits.
In the preparation of the ore reserve estimate, all inferred material had its grade zeroed and was in
effect treated as waste dilution. In the current reserve design for Nicholas Lake, approximately
720,000 t of inferred material at 3.56 g/t was set to zero gold grade but was included in the design.
In the current reserve design for Ormsby underground, approximately 17,000 t of inferred material at
2.46 g/t was set to zero gold grade but was included in the design.
There is potential to improve the efficiency of the ventilation system during the detailed design
phase, thus optimizing the power requirements, capital equipment cost and possibly access drift
sizes.
As with all underground mining operations, ground conditions pose a significant risk. The most
effective defense against risk from poor ground conditions is a sound engineering practice, good
miner training, well-motivated supervision and a high degree of management focus on safety and
standards.
If the pre-mining stresses are higher than assumed the mining of near stopes could become difficult.
If this is the case, then the last stope in a block would have to be cut shorter to alleviate the stresses
in the next stope block.
It may be difficult to achieve the 8 m per day development rate in long dead-end drifts. The current
production schedule allows for multiple headings. This should allow the higher development rate by
allowing the equipment to be moved to different locations and not being clustered in one heading.
15.5 Process and Recovery There are opportunities to reduce both the capital cost as well as the operating cost for the Tyhee
project.
Capital equipment prices are based on feasibility-level quotes and proposals provided by equipment
vendors. No negotiation has taken place and there are opportunities to negotiate better pricing, as
well as bundling equipment, to secure greater discounts.
There are also opportunities for reducing reagent consumption and cost by tuning the process. The
laboratory program did not extensively test all possible reagent choices nor did the program attempt
to optimize dosages for the reagents used. These optimizations are best determined in the full scale
operation. For instance, the reagent dosages need to account for the use of reclaim water which will
contain residual reagent. The effect of this reclaim on the process can only be determined in the full
scale operation but typically will reduce reagent additions as a result of the recycled reagent

SRK Consulting, Lyntek Incorporated, Knight Piésold Consulting Volume 1 Executive Summary – Yellowknife Gold Project Feasibility Study Page 53
BCS/MLM Yellowknife_FS_Vol1_ExecSummary_250300.010_021_MLM.docx August 21, 2012
Some other parts of the process can be adjusted, such as the degree of pre-leach aeration, air
addition to the leaching tanks, carbon transfer frequency, etc. Again, these adjustments are best
tested in operation and may change as with the natural variations in the ore.
There is also an opportunity to improve on the overall recoveries for the Nicholas Lake ore. The
initial work completed Inspectorate on Nicholas Lake composites as part of the PFS indicated that
significantly higher flotation recoveries (~10% higher) are possible, than the recoveries obtained for
the Nicholas Lake composites tested as part of the FS. This could translate into an overall recovery
improvement of up to 8% on the Nicholas Lake ores if similar recoveries to the PFS can be obtained.
The differences in the recoveries are not well understood at this time and further work has been
commissioned to better understand the differences. The recovery data used in this FS use the
lower, more recently developed, recoveries for the Nicholas lake ore, as determined by the second
series of tests.
As a general statement, the concentrator process design for Tyhee’s YGP uses technologies and
systems that are well proven and in use throughout the gold industry. Further, the proposed process
has been tested on a selection of samples from the project ore bodies. Therefore, the risks for this
process are low, and only those encountered in most mineral development projects. The proposed
process will recover gold from the ore and is likely to achieve the projected recoveries.
Specific risks in the process are that various unit operations may not achieve optimum recovery as
designed. Extensive test data is available, but it is restricted to a limited number of composite
samples. Variations in the ore may require changes in the operation of the plant, including but not
limited to, grind size and reagent additions. Adjustments will need to be made in the field to account
for any variations in the response of the ore if it differs from the composite sample(s) tested at
Inspectorate. Adequate design margin has been incorporated into the design to allow for anticipated
possible variations in the ore.
Comminution consumables, both crusher and mill liners, as well as grinding media, are estimated
based on limited data. Allowances have been made to ensure a reasonable buffer is available for
the first year of operation. There is both a risk and an opportunity that comminution consumables
consumption could differ from the design values. The values used are relatively conservative, but
significant variations from the design value are possible. Optimization of the metallurgy for both the
liners and the grinding media is a normal process. The cost of freight will put an emphasis on quality
and life rather than cost. If adequate inventory is kept on site, the only risk is that of increasing
OPEX due to increased consumables requirement.
The rest of the concentrator is deliberately designed to be flexible and allow for adjustments in
operation. This will mitigate most risks in processing. Again the risks are not that the process will or
won’t work, the risks are that the process may leave more gold in the tailings than an optimum
process would recover.
A significant fraction of the OPEX is power generation, which is 100% reliant on diesel fuel. The
OPEX is therefore sensitive to increases in the delivered cost of diesel fuel.
To a lesser extent, pricing on other reagents and consumables, as well as transport costs to site,
impact the OPEX. Changes in the reagent prices, most notably cyanide, will impact the operating
costs.

SRK Consulting, Lyntek Incorporated, Knight Piésold Consulting Volume 1 Executive Summary – Yellowknife Gold Project Feasibility Study Page 54
BCS/MLM Yellowknife_FS_Vol1_ExecSummary_250300.010_021_MLM.docx August 21, 2012
15.6 Infrastructure It is probable that the “minimum 2 m” of excavation required to remove all fractured and weathered
rock from the surface will not be necessary everywhere. This will be assessed during the detailed
engineering phase, as well as during construction as differing clearing practices can result in cost
savings. Reducing the quantity of blast and backfill will provide both cost savings as well as have a
positive influence on the construction schedule.
Transformer, MCC, and switchgear sizes are conservative to mitigate possible risks associated with
the lack of electrical data. Further design information may reduce the size of the equipment,
providing an opportunity for a reduction in the CAPEX.
Lighting was estimated per recommendations in the appropriate building codes, which is commonly
considered a conservative estimate. A review of lighting requirements, lighting options and
optimized building design could reduce the lighting requirements, providing a saving both in the
OPEX and the CAPEX.
The availability of quality aggregate for the use as both concrete and structural fill is currently under
evaluation. At this time tests indicate a higher amount of fine aggregate than is acceptable for a
competent concrete mix. However this can be mitigated by screening out the fine material, or by
blending material from the multiple borrow sites available to the project. The risk is considered to be
small and will only have an impact on the cost of the aggregate material insomuch as it will require
an additional screening stage. Adequate quantities are available.
Currently there has not been extensive testing done to the local water sources to determine whether
or not they can be used in the production of concrete. Testing will have to be completed in
conformance with ASTM C1602 standards. This is considered a low risk to cost and schedule as it
has been determined that the local water sources are acceptable as potable water with minimal
treatment, and high levels of contaminants are unlikely.
Power factor correction is currently excluded under the assumption that the system will operate at an
acceptable power factor, with minimal impact on the OPEX. This will be reviewed in the detailed
design phase of the project. Additionally, a full ground and lightning analysis was not performed, and
the costs are estimated using the best available information.
15.7 Tailings Containment Area The following list presents either risks or opportunities that may impact the value or consequences of
the project. These should be assessed further as part of future phases of design.
Limited borrow materials on site. It is cost prohibitive to haul materials into site due to
access.
Necessity to pump water from Giauque into Narrow Lake to restore “base flow” conditions
during operations.
It is currently unclear how ore from Clan, Nicholas, and Bruce Lake mining operations will
affect the water quality of the decant pond within the TCA. This may impact the ability to
discharge waters during operations which meet the MMER and CCME guidelines, without
additional treatment though. As noted above no planned discharges are expected and
therefore the risk is deemed low.

SRK Consulting, Lyntek Incorporated, Knight Piésold Consulting Volume 1 Executive Summary – Yellowknife Gold Project Feasibility Study Page 55
BCS/MLM Yellowknife_FS_Vol1_ExecSummary_250300.010_021_MLM.docx August 21, 2012
Additional subsurface investigation work may be required to evaluate the site groundwater
regime.
Potential for better/worse storage efficiency in the TCA than has been estimated for this FS.
Tailings density results from the consolidation model have been reduced by approximately
12% to account for ice lensing and ground freezing of the flotation tailings during operations.
This is based on experience in similar environments, but is dependent on site conditions and
operations during the life of the TCA, and this may either under- or over- estimate the
density of the placed tailings.
It is currently assumed that there will be sufficient non-PAG waste rock available for early
stages of construction for the TCA dams.
Some PAG material may be used for construction of the divider causeways or the upstream
shell material of early stages of dam construction. By doing this, the materials will be
inundated and this may limit potential oxidation.
There may be additional opportunities for TCA expansions beyond the two described herein.
These would allow for additional tailings processing and storage due to potential increases in
mine reserves.
15.8 Environment, Permits, Licenses and Authorizations The YGP will provide the opportunity to improve the projects economics and minimize environmental
impacts by:
Shorter haulage distance for waste rock storage to the areas by increasing height of waste
dumps;
Minimize the environmental impacts from the YGP operations by placing the waste rock
storage area over a portion of the Discovery Mine Tailings cap and the area between Winter
and Narrow Lakes; and
The points mentioned above keeps the majority of project activities and the environmental
impacts contained within the “brown-field” site of the Discovery Mine.
Risks related to the YGP and to some degree related to the opportunities mentioned above are:
Assuming the environmental liability related to the deposition of waste rock on the Discovery
Mine tailings cap is something Tyhee is aware of and based on project economics the
assumption of this liability is seen to be acceptable.
Although the geochemistry of the various ore zones are seen not to be an issue in the long
term, Tyhee will monitor the waste rock piles during operations and any mitigative measures
required to address these issues, will be implemented.
15.9 Community Relations and Social Responsibility The YGP will provide additional employment and business opportunities to the residents of the NWT
and to the affected First Nations business organizations and their people within whose territory the
YGP is located. This will give them the opportunity to participate in the mineral sector while
providing a high standard of living for them and their families.
The recently announced Social Responsibility Statement will provide the foundation to working with
the affected First Nations and all stakeholders in a socially responsible manner, which Tyhee is

SRK Consulting, Lyntek Incorporated, Knight Piésold Consulting Volume 1 Executive Summary – Yellowknife Gold Project Feasibility Study Page 56
BCS/MLM Yellowknife_FS_Vol1_ExecSummary_250300.010_021_MLM.docx August 21, 2012
committed to doing. This commitment includes but is not limited to developing an Impact Benefit
Agreement with the affected First Nations groups.
Risks related to the YGP could be related to the following:
Tyhee must recognize the involvement of the First Nations groups within whose territory the
YGP is located and must accommodate them to participate in the Project by not only
employment opportunities but also by meaningful business opportunities.
If the Operation does not achieve funding or environmental permits, the potential economic
benefits from the mine will not eventuate.
Reaching an agreement with the affected First Nations is seen to be critical to the success of
the YGP and failure to reach such an agreement in a timely manner may be a risk to the
YGP meeting its production schedule.
15.10 Project Implementation The study is currently at a feasibility-level with opportunity to optimize the implementation plan. In
particular, three opportunities exist:
a) Optimized Cash Flow. There are significant opportunities to optimize the cash flow of the
Project. In particular, payment terms, delivery requirements, and the 2014 and 2015
construction periods can all still be optimized to improve overall project cash flow.
b) Accelerated Schedule. Once discussions with equipment vendors and site construction
contractors are complete, opportunities will be evaluated to shorten the construction
schedule and bring the plant on line earlier than currently scheduled.
c) Construction Schedule and Costs. There is an opportunity to improve on the estimates for
the construction work. Negotiations with potential contractors will highlight possible savings
in time estimates due to an optimized construction schedule.
Logistics provide the single largest risk of this project. Late deliveries (deliveries that miss the
required ice road availability) will significantly impact delivery cost and the construction schedule.
Items that can be airlifted on a DASH 7 aircraft can be brought to site at a relatively modest cost.
Items larger than the carrying capacity of a Dash 7 would need to wait for the following ice road.
Measures in place to manage this risk include:
Early delivery of critical equipment to the Yellowknife marshaling yard, providing an
adequate buffer between availability of equipment;
Careful selection of vendors with proven delivery track records, and control of fabrication
facilities selected by the vendors; and
Extension of the construction period to provide access to two ice roads, with adequate time
available ahead of the 2015 ice road to ensure timeous delivery.
The weather provides an additional risk. Mild winters will affect the duration of the ice road. Long
winters will affect the length of the spring to fall construction period. Measures in place to manage
this risk include:
A construction period extended over two summers. This minimized the work scheduled
during the harsh winter months, specifically outdoor activities. The schedule also allows for
construction delays (if present) to be managed by extending construction over the winter
months or providing additional crews in the summer construction period. Any shortfalls

SRK Consulting, Lyntek Incorporated, Knight Piésold Consulting Volume 1 Executive Summary – Yellowknife Gold Project Feasibility Study Page 57
BCS/MLM Yellowknife_FS_Vol1_ExecSummary_250300.010_021_MLM.docx August 21, 2012
observed in the pace of construction in 2014 can be remedied in 2015 either by an early
start, or by increasing the availability of construction personnel on site.
Any shortfall in the 2014 winter road can be accommodated in the 2015 winter road. By
extending the construction period (and the subsequent deliveries to site over two winter
roads) the load on the road in any one season will be significantly reduced.
A detailed construction plan has not been generated in conjunction with a construction company.
Extensive discussions have, however, taken place with construction contractors familiar with, and
experienced in, construction in the NWT. These discussions included, but were not limited to,
project and site specific labor rates and efficiencies, general construction schedules and manpower
loadings. There is some risk to the construction cost until detailed plans and estimates are
developed as part of the EPCM phase.
15.11 Operations Plan Tyhee may not be able to find adequately skilled people among the aboriginal community and thus
not be able to extend employment offers in synch with aboriginal community’s expectations. Tyhee
may need to implement additional training programs to mitigate this potential risk.
In view of acute shortage in certain high technology trades, Tyhee may not be able to fill some of the
key positions on a permanent basis thus requiring contractor personnel to perform some tasks at a
much higher cost. Rotational work and high turnover make it difficult to organize the workforce into a
labor union, which in turn allows greater flexibility for the employer to manage. Additionally the two
week on/off schedule is seen as attractive to many potential employees.
Should the efforts to recruit among residents of Canada prove to be difficult, it may be possible to
obtain necessary approvals from Citizenship and Immigration Canada for Temporary Foreign
Workers.

SRK Consulting, Lyntek Incorporated, Knight Piésold Consulting Volume 1 Executive Summary – Yellowknife Gold Project Feasibility Study Page 58
BCS/MLM Yellowknife_FS_Vol1_ExecSummary_250300.010_021_MLM.docx August 21, 2012
16 Conclusions and Recommendations
16.1 Geotechnical Mine Design More exploration drilling should be conducted at Clan Lake and Bruce Lake to delineate the extents
of the rock quality along strike and at depth. Both rock mass characterization of coreholes and
laboratory testing of samples should be conducted. The additional data will support estimated pit
slope geometry and can be used to examine kinematic block stability of benches due to fracture
intersections. Kinematic stability analyses should be performed using site-specific data for the Clan
Lake and Bruce Lake pits to check local bench stability.
Numerical stress analyses of critical sections the Ormsby, Clan Lake and Bruce Lake pits should be
conducted to more accurately account for pre-mining state of stress and groundwater conditions that
influence slope stability. These analyses would be especially important if the overall pit slope is
steepened by 5° to 8° and the Ormsby pit is deepened.
Stability analyses of the Ormsby underground stopes should be performed to verify hangingwall
stability in the presence of jointed rock mass. Empirical design methods are less certain because of
the unfavorable dip of the orebody relative to gravitational block stability. Numerical modeling should
also be used to identify the depth of distressing that controls dilution of low-angle stopes (less than
40° dip).
16.2 Open Pit Mining Through the process of pit optimization, fleet estimation, mine design, production scheduling and
economic modeling, the YGP open pit operations have been sized and estimated appropriately at a
feasibility-level. SRK has estimated a mining cost of US$1.81/t mined for insitu operations and an
additional US$1.37 for re-handle material over the life of mine. Combined with a ramp-up to 75 kt/d,
the benefit of high production rates, grade bin schedule and support from underground operations,
SRK is of the opinion the costs estimated are reasonable at the present time (2012).
Open pit mine capital is estimated at US$23.5 million with an addition US$33.6 million in sustaining
capital that includes new purchases and major equipment rebuilds.
SRK is of the opinion further work programs should include:
Detailed monthly scheduling and haul profile estimation for the first three years of production
that is linked into a short term economic model;
In-fill drilling carried out on material mined in the first three years;
Operational guidelines for treatment of any ARD waste rock;
Fragmentation study to better identify optimal drill spacing and powder factors;
Detailed schedule for pre-production earthworks;
Continued discussion with vendors for equipment quotes and detailed fuel usage;
Analysis of underground voids at Bruce Lake;
Continued resource drilling at Clan Lake;
Further discussions about all-weather roads from Yellowknife; and
More defined estimates of groundwater in-flow from local fractures/structures into the pit.

SRK Consulting, Lyntek Incorporated, Knight Piésold Consulting Volume 1 Executive Summary – Yellowknife Gold Project Feasibility Study Page 59
BCS/MLM Yellowknife_FS_Vol1_ExecSummary_250300.010_021_MLM.docx August 21, 2012
16.3 Underground Mining The Tyhee FS underground mine design and production schedule presents a reasonably
conservative estimate of the ore that can be economically and safely extracted from the geologic
model. Only ore reserves determined from the indicated resource is evaluated in the design for gold
content.
The longhole stoping mine design that is applied to the orebody is a widely used method in the
industry and was used successfully at the Discovery mine.
The mine production schedule achieves a consistent production rate within a reasonable ramp-up
period and waste development is able to keep up with the demands of stope production.
Nicholas Lake reserves are calculated to include 2,029 kt of ore at an average grade of 3.14 g/t
using a CoG of 2.0 g/t. Ormsby underground reserves are calculated to include 772 kt of ore at an
average grade of 3.49 g/t using a CoG of 2.0 g/t.
SRK is of the opinion that Tyhee should:
Proceed with the detailed design phase;
Hire key underground technical and management staff on a priority basis to facilitate the
detailed design phase;
Order long lead time capital equipment on a priority basis;
Review the use of a lower CoG in the short term mining plan to take advantage of the high
gold price to increase the amount of gold recovered from the resource;
Optimize the ventilation and electrical power systems; and
Carry out detailed geotechnical studies.
16.4 Metallurgy The following conclusions and recommendations are made regarding the metallurgical program that
was conducted in support of the YGP FS:
The Ormsby, Nicholas Lake and Clan Lake metallurgical composites found to be highly
amenable to gold recovery by conventional processing methodologies that included gravity
concentration, gold flotation from the gravity tailing and cyanide leaching of the flotation
concentrates.
Overall gold recovery for Ormsby and Clan Lake is projected at 92% and gold recovery for
Nicholas Lake is projected at 82%.
A primary grind of P80 120 m was determined for the Ormsby and Nicholas Lake Master
composites and a coarser primary grind of P80 150 m was determined for the Clan Lake
Master composite.
A rougher concentrate regrind size of P80 35 to 40 m was established for Ormsby. In
addition, rougher flotation concentrate regrind sizes of P80 74 m for Nicholas Lake and P80
120 m for Clan Lake were determined.
Cyanide leach residues can be detoxified using the industry standard SO2/air process.
16.5 Process and Recovery Process and recovery conclusions are:

SRK Consulting, Lyntek Incorporated, Knight Piésold Consulting Volume 1 Executive Summary – Yellowknife Gold Project Feasibility Study Page 60
BCS/MLM Yellowknife_FS_Vol1_ExecSummary_250300.010_021_MLM.docx August 21, 2012
The process plant (concentrator) has been designed based on an extensive laboratory
testing program using a bulk sample and core material from the Ormsby ore body.
The process uses standard, proven processes that have been demonstrated to work in the
laboratory testing program.
The particular process using gravity and flotation for primary gold recovery and cyanide
leaching of flotation concentrate was chosen to reduce the plant footprint due to the location
in northern Canada.
The concentrator has been designed to process 4,000 t/d of ore.
There are two primary grinding/gravity/flotation lines with a capacity of 2,000 t/d each to
allow for turn down.
Equipment sizing and selection has emphasized flexibility of operation.
A mass and water balance model of the projected plant has been created in Metsim
simulation software.
A drawing package including: Process Flow Diagrams, General Arrangement Drawings,
preliminary Piping and Instrumentation Drawings, preliminary Single Line Electrical
Drawings, etc. have been created to allow cost estimation to the desired accuracy.
An operating cost estimate has been produced. Average annual operating cost is projected
to be US$32.813 million. Average operating cost per tonne of ore is projected to be
US$22.47 and average concentrator operating cost per ounce of gold produced is projected
to be US$329.
The capital cost estimate for the concentrator is US$124.017 million. Of that total,
US$100.628 are direct costs and US$$23.389 million are indirect costs.
Recommendations are:
Crushability Testing - Crusher selection is currently based on Bond Grindability Tests.
Additional testwork is required to determine the crushability index for the Ormsby ore. The
preferred crushability test will be vendor specific. Samples should be provided to crushing
equipment vendors for vendor specific testing for crusher sizing and power usage before
equipment selection is finalized.
Settling Rate Determination - Due to the size and expense of thickeners, determining the
minimum settling area required can have a significant effect on capital costs. For this
reason, additional sedimentation testing is highly recommended during the detailed design
phase. If sufficient sample can be produced (15 kg each of tailings and cleaner flotation
concentrate), dynamic settling tests can be conducted. Dynamic tests are considered the
most accurate for critical thickener sizing. These tests can be conducted by thickener
vendors, but that would require multiple samples (one for each vendor). An alternative is to
have the testing run at an independent laboratory that is acceptable to all vendors.
16.6 Infrastructure Infrastructure conclusions and recommendations are:
Infrastructure exists on site including a 50 bed mancamp, limited fuel storage, limited power
generation capacity, and access roads on site. These will need to be augmented for the
construction and operation phases of the project, but they are available as initial
infrastructure for mobilization.

SRK Consulting, Lyntek Incorporated, Knight Piésold Consulting Volume 1 Executive Summary – Yellowknife Gold Project Feasibility Study Page 61
BCS/MLM Yellowknife_FS_Vol1_ExecSummary_250300.010_021_MLM.docx August 21, 2012
Primary access to site for bulk goods will be a seasonal ice road, which will be specifically
prepared for this site. Manpower and perishables will utilize air transport from Yellowknife to
site.
All infrastructures required for the continuous operation of the mine have been included in
the cost estimate. These include the crusher building, mill concentrator building, power
generation, warehousing, administrative offices, workshops, mobile equipment maintenance
facility, diesel and reagent storage, spares laydown area, and mancamp.
All heat requirements for the heating of the workspaces will be provided by recovered heat
form the power generation units. No additional fuel will be required for heating with the
possible exception of the mancamp.
Further geotechnical testing will need to be completed for the aggregate for concrete mix
design, as well as for the design of the engineered fill.
16.7 Tailings Containment Area The TCA has been designed to contain both the flotation and CIL tailings and associated waters
produced over the 11 years mine life. This corresponds to approximately 15 Mt of tailing, split
94%/6% by weight for the flotation/CIL tailings, respectively. The basin has been subdivided into a
northern, southern, and central cell, separated by internal divider causeways. The northern and
southern cell will be dedicated to flotation tailings storage; whereas, the central cell will contain both
flotation and CIL tailings. The CIL tailings will be deposited subaqueously in the western portion of
this central cell, below the operational decant pond. The divider causeways will allow water pass
between the cells but retain solids allowing for the pond to develop in the area of the CIL deposition
and provide enough pond volume (and depth) such that decant waters can be returned to the
process plant all year, when available. Due to potential mine expansions, additional tailings
produced after 11 years of operations will need to be stored in TCA expansions which are currently
designed to a conceptual level. These expansions are currently able to contain approximately 5 Mt
of additional tailing, per the potential expanded mine plan.
Additional work to be performed in support of the final design of the TCA would include, but not be
limited to, the following:
Additional geochemical testing on a sample representative of the supernatant pond waters
produced when liberated waters from the CIL and flotation tailings are mixed;
Additional geochemical testing on samples representative of the waste rock being used for
construction of the TCA dams. This should include both waste rock from the Ormsby pit for
construction of the TCA dams and the waste rock from plant site construction used for use in
the cofferdam;
Final design-level subsurface site investigations in select areas including geotechnical
laboratory testing, including a study to estimate available borrow material quantities;
Finalization of the embankment sections including foundation excavation limits for use in
final designs;
Additional subsurface investigation to support a site-wide hydrogeologic evaluation of the
project area;

SRK Consulting, Lyntek Incorporated, Knight Piésold Consulting Volume 1 Executive Summary – Yellowknife Gold Project Feasibility Study Page 62
BCS/MLM Yellowknife_FS_Vol1_ExecSummary_250300.010_021_MLM.docx August 21, 2012
Final design-level study and design of the run-off collection channels and ponds.
Finalization of the Winter Lake dewatering system including cofferdam section and
construction sequence;
Final design of tailings distribution system and water reclaim system considering a potential
economic trade-off study for different system options. This will include the preparation of an
operations manual for the operation of both of these systems;
Final design of potential expansion options to increase the TCA capacity from 15 to 20.3 Mt;
Conduct a dam break analysis in potentially impacted drainages;
Conduct a site specific seismic hazard assessment;
Preparation of technical specifications and construction QA/QC plans. This will include a
study of the blending ratio of esker to lacustrine sediments necessary for construction of the
cofferdam and zoned embankment cores. Additionally, a specification will be needed to
provide guidance as to how these materials are to be blended to provide sufficient mixing
during construction;
Preparation of the TCA instrumentation and monitoring program; and
Preparation of an Emergency Action Plan (EAP).
The final design phase will include preparation of design drawings in sufficient detail for use during
construction and an updated quantity and cost estimate to a final design-level. Services during
construction include resident engineering, home office support, and construction QA/QC services.
16.8 Project Implementation Conclusions and recommendations are as follows:
The detailed design, procurements schedule and construction schedule will need to be
designed specifically around the availability of the seasonal ice road.
An accelerated procurement schedule will be required for some equipment choices.
The logistics associated with the procurement, transport of equipment, and construction of
the plant, will be of primary importance. There is however adequate experience available for
construction in the NWT to ensure a successful execution of the project with minimized risk
to either the cost or the schedule.
16.9 Environment, Permits, Licenses and Authorizations Tyhee is very confident that the YGP can be constructed, operated and closed in an acceptable
manner and in accordance with the issued operating water license and land use permits.
16.10 Community Relations and Social Responsibility Tyhee will construct, operate and close the YGP in a responsible manner keeping in mind the values
of the affected First Nations groups and as Tyhee committed in its Social Responsibility Statement.
Based on new information and economics provided by the FS, a revised socio economic assessment
will be conducted during the EPCM phase of the project. This new assessment will detail the direct
economic effects and disbursements to local, state and regional governments and estimate the
project multiplier effect at large.

SRK Consulting, Lyntek Incorporated, Knight Piésold Consulting Volume 1 Executive Summary – Yellowknife Gold Project Feasibility Study Page 63
BCS/MLM Yellowknife_FS_Vol1_ExecSummary_250300.010_021_MLM.docx August 21, 2012
16.11 Financial Modeling SRK is of the opinion that the economic model presented and discussed in this volume meets
current industry standards. The base case economic analysis results indicate a pre-tax net present
value of US$215.7 million at a 5% discount rate with an IRR of 20%.
This analysis suggests that the project is most sensitive to market price. Operating costs are more
sensitive than capital costs due primarily to the diesel fuel price. The project is very sensitive to the
discount rate due to the extended preproduction period.

SRK Consulting, Lyntek Incorporated, Knight Piésold Consulting Volume 1 Executive Summary – Yellowknife Gold Project Feasibility Study Page 64
BCS/MLM Yellowknife_FS_Vol1_ExecSummary_250300.010_021_MLM.docx August 21, 2012
Disclaimer The opinions expressed in this Report have been based on the information supplied to SRK
Consulting (U.S.), Inc. (SRK), Lyntek Inc. (Lyntek) and Knight Piésold (KP) by Tyhee Gold Corp.
(Tyhee). These opinions are provided in response to a specific request from Tyhee to do so, and are
subject to the contractual terms between SRK, Lyntek, KP and Tyhee. SRK, Lyntek and KP have
exercised all due care in reviewing the supplied information. Whilst SRK, Lyntek and KP have
compared key supplied data with expected values, the accuracy of the results and conclusions from
the review are entirely reliant on the accuracy and completeness of the supplied data. SRK, Lyntek
and KP do not accept responsibility for any errors or omissions in the supplied information and do
not accept any consequential liability arising from commercial decisions or actions resulting from
them. Opinions presented in this report apply to the site conditions and features as they existed at
the time of SRK, Lyntek and KP’s investigations, and those reasonably foreseeable. These opinions
do not necessarily apply to conditions and features that may arise after the date of this Report.
Copyright This report is protected by copyright vested in SRK Consulting (U.S.), Inc. It may not be reproduced
or transmitted in any form or by any means whatsoever to any person without the written permission
of the copyright holder, SRK except for the purpose as set out in this report.

SRK Consulting, Lyntek Incorporated, Knight Piésold Consulting Volume 1 Executive Summary – Yellowknife Gold Project Feasibility Study Page 65
BCS/MLM Yellowknife_FS_Vol1_ExecSummary_250300.010_021_MLM.docx August 21, 2012
Figures

Yellowknife Gold Project,
Northwest Territories, Canada
Figure 1-1
Property Location Map Source: Tyhee, 2012

Yellowknife Gold Project,
Northwest Territories, Canada
Figure 1-2
Ormsby – Nicholas Lake Property Mining Lease Map Source: Tyhee, 2012

Yellowknife Gold Project,
Northwest Territories, Canada
Figure 1-3
Goodwin Lake Property Mining Lease and Mineral Claim Map Source: Tyhee, 2012

Yellowknife Gold Project,
Northwest Territories, Canada
Figure 1-4
Clan Lake Property Mineral Claim Map Source: Tyhee, 2012

Yellowknife Gold Project,
Northwest Territories, Canada
Figure 5-1
Perspective View of Ormsby

Yellowknife Gold Project,
Northwest Territories, Canada
Figure 5-2
Ormsby Underground

Yellowknife Gold Project,
Northwest Territories, Canada
Figure 5-3
Nicholas Lake Underground Layout and Design
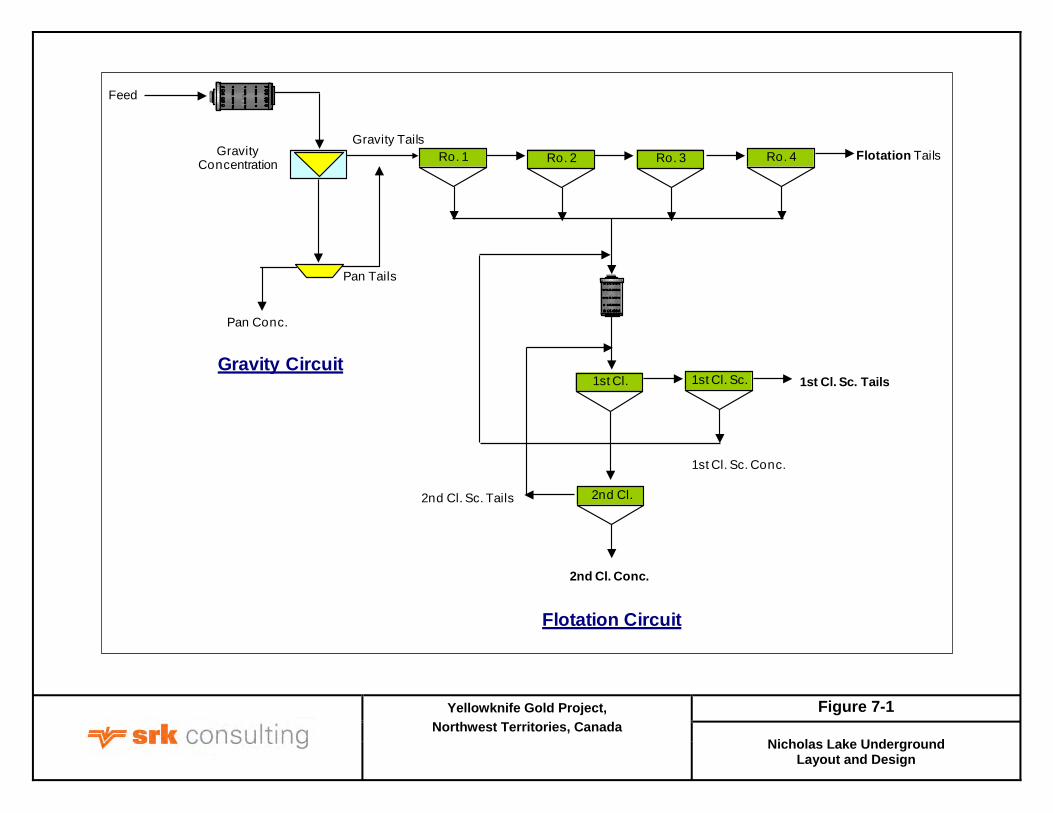
Yellowknife Gold Project,
Northwest Territories, Canada
Figure 7-1
Nicholas Lake Underground Layout and Design
Flotation Tails
Feed
Gravity Concentration
Pan Conc.
Gravity TailsRo. 1
Gravity Circuit
Flotation Circuit
Ro. 2 Ro. 3
1st Cl.
2nd Cl.
1st Cl. Sc. 1st Cl. Sc. Tails
1st Cl. Sc. Conc.
2nd Cl. Conc.
2nd Cl. Sc. Tails
Pan Tails
Ro. 4