Yellow Change Interval and All Red Clearance Interval … Change Interval and All Red Clearance...
26
Yellow Change Interval and All Red Clearance Interval Review City of St. Petersburg Interval Review for the “Stop on Red” Campaign Prepared for: The City of St. Petersburg St. Petersburg, Florida Prepared by: Kimley-Horn and Associates, Inc. Tampa, Florida ¤Kimley-Horn and Associates, Inc. May 2013 148773013
Transcript of Yellow Change Interval and All Red Clearance Interval … Change Interval and All Red Clearance...
Yellow Change Interval and AllRed Clearance Interval Review
City of St. Petersburg
Interval Review for the“Stop on Red” Campaign
Prepared for:
The City of St. PetersburgSt. Petersburg, Florida
Prepared by:
Kimley-Horn and Associates, Inc.Tampa, Florida
Kimley-Horn and Associates, Inc.May 2013148773013
Yellow Change Interval and All Red Clearance Interval Review
“Stop on Red” Campaign Page - i May 2013
TABLE OF CONTENTSPage
Introduction ................................................................................................................................ 1FDOT Guidelines ....................................................................................................................... 2Data Collection .......................................................................................................................... 3Yellow Change Interval .............................................................................................................. 3All Red Clearance Interval ........................................................................................................11Review of Other Agencies’ Yellow Interval Documentation ......................................................18Conclusions ...............................................................................................................................23Appendix...................................................................................................................................24
LIST OF TABLESPage
TABLE 1: Yellow Change Interval Summary Using the Legal Driving Speed ...................... 5TABLE 2: Yellow Change Interval Summary Using the 85th Percentile Speed .................... 8TABLE 3: All Red Clearance Interval Summary Using the Legal Driving Speed.................12TABLE 4: All Red Clearance Interval Summary Using the 85th Percentile Speed ...............15
APPENDICES
APPENDIX A: City of St. Petersburg and FDOT Traffic Signal Maintenance AgreementAPPENDIX B: Observed Vehicle Speed DataAPPENDIX C: FDOT District 7 Traffic Operations policy, Staff CorrespondenceAPPENDIX D: City of St. Petersburg Signal Timing DataAPPENDIX E: Terminology UsedAPPENDIX F: Referenced PublicationsAPPENDIX H:APPENDIX I:
Yellow Change Interval and All Red Clearance Interval Review
“Stop on Red” Campaign Page - 1 May 2013
Introduction
The City of St. Petersburg is continually evaluating the “Stop on Red” campaign, which includes metrics
such as crash analysis as well as traffic signal operational characteristics like yellow change intervals and
all red clearance intervals. This document provides a review of the yellow change interval and all red
clearance intervals for each phase of the traffic signal operating plan at the 10 intersections that are
included in the “Stop on Red” campaign, which are:
4th Street & Gandy Boulevard
4th Street & 54th Avenue North
4th Street & 22nd Avenue North
34th Street & 38th Avenue North
34th Street & 1st Avenue North
34th Street & 1st Avenue South
34th Street & 22nd Avenue South
66th Street & 38th Avenue North
66th Street & Tyrone Boulevard
66th Street & 22nd Avenue North
The specific evaluation of intersection yellow change intervals and the all red clearance intervals at the 10
intersections that comprise the “Stop on Red” campaign has been prepared to provide the City staff and
officials with an analysis of the existing intervals based on the legal driving speed, which is the Florida
Department of Transportation (FDOT) District 7 policy. A review of the existing intervals was also
conducted using the observed vehicular speed (85th percentile) data collected at the specific intersection
approaches. This analysis follows the yellow change interval and all red clearance interval calculation
requirements defined by the FDOT within the FDOT Traffic Engineering Manual. The intersections
included in this evaluation are under the jurisdiction of the FDOT, and therefore any adjustments
identified as a recommendation for revision must be submitted to FDOT staff as a request for update, with
the final decision resting with the FDOT reviewer. This request and review procedure is consistent with
the agreement for traffic signal maintenance between the City of St. Petersburg and the FDOT, which is
included as Appendix A.
Yellow Change Interval and All Red Clearance Interval Review
“Stop on Red” Campaign Page - 2 May 2013
FDOT Guidelines
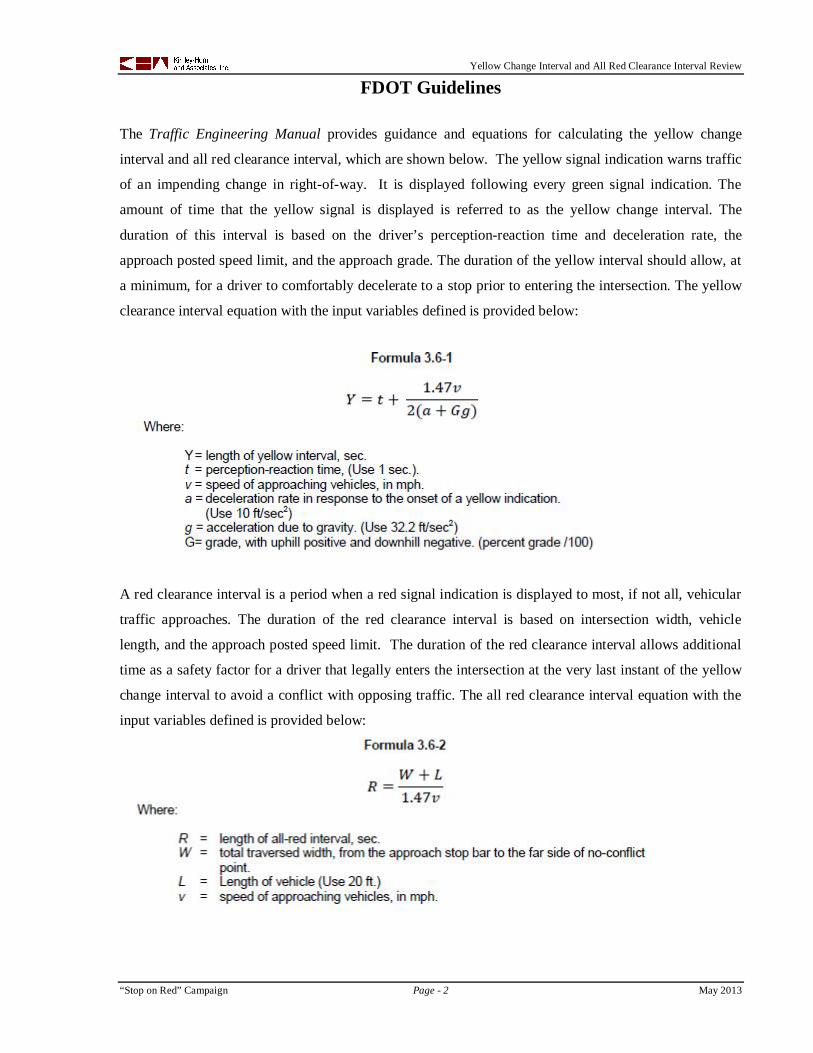
The Traffic Engineering Manual provides guidance and equations for calculating the yellow change
interval and all red clearance interval, which are shown below. The yellow signal indication warns traffic
of an impending change in right-of-way. It is displayed following every green signal indication. The
amount of time that the yellow signal is displayed is referred to as the yellow change interval. The
duration of this interval is based on the driver’s perception-reaction time and deceleration rate, the
approach posted speed limit, and the approach grade. The duration of the yellow interval should allow, at
a minimum, for a driver to comfortably decelerate to a stop prior to entering the intersection. The yellow
clearance interval equation with the input variables defined is provided below:
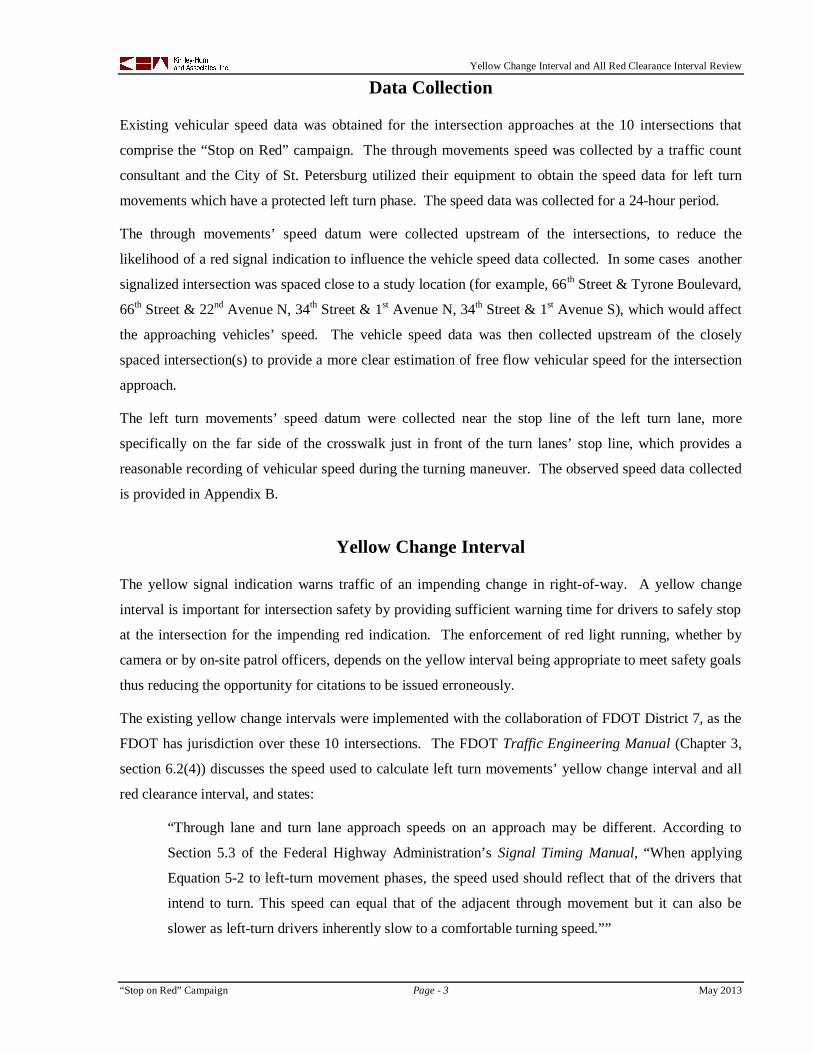
A red clearance interval is a period when a red signal indication is displayed to most, if not all, vehicular
traffic approaches. The duration of the red clearance interval is based on intersection width, vehicle
length, and the approach posted speed limit. The duration of the red clearance interval allows additional
time as a safety factor for a driver that legally enters the intersection at the very last instant of the yellow
change interval to avoid a conflict with opposing traffic. The all red clearance interval equation with the
input variables defined is provided below:
Yellow Change Interval and All Red Clearance Interval Review
“Stop on Red” Campaign Page - 3 May 2013
Data Collection
Existing vehicular speed data was obtained for the intersection approaches at the 10 intersections that
comprise the “Stop on Red” campaign. The through movements speed was collected by a traffic count
consultant and the City of St. Petersburg utilized their equipment to obtain the speed data for left turn
movements which have a protected left turn phase. The speed data was collected for a 24-hour period.
The through movements’ speed datum were collected upstream of the intersections, to reduce the
likelihood of a red signal indication to influence the vehicle speed data collected. In some cases another
signalized intersection was spaced close to a study location (for example, 66th Street & Tyrone Boulevard,
66th Street & 22nd Avenue N, 34th Street & 1st Avenue N, 34th Street & 1st Avenue S), which would affect
the approaching vehicles’ speed. The vehicle speed data was then collected upstream of the closely
spaced intersection(s) to provide a more clear estimation of free flow vehicular speed for the intersection
approach.
The left turn movements’ speed datum were collected near the stop line of the left turn lane, more
specifically on the far side of the crosswalk just in front of the turn lanes’ stop line, which provides a
reasonable recording of vehicular speed during the turning maneuver. The observed speed data collected
is provided in Appendix B.
Yellow Change Interval
The yellow signal indication warns traffic of an impending change in right-of-way. A yellow change
interval is important for intersection safety by providing sufficient warning time for drivers to safely stop
at the intersection for the impending red indication. The enforcement of red light running, whether by
camera or by on-site patrol officers, depends on the yellow interval being appropriate to meet safety goals
thus reducing the opportunity for citations to be issued erroneously.
The existing yellow change intervals were implemented with the collaboration of FDOT District 7, as the
FDOT has jurisdiction over these 10 intersections. The FDOT Traffic Engineering Manual (Chapter 3,
section 6.2(4)) discusses the speed used to calculate left turn movements’ yellow change interval and all
red clearance interval, and states:
“Through lane and turn lane approach speeds on an approach may be different. According to
Section 5.3 of the Federal Highway Administration’s Signal Timing Manual, “When applying
Equation 5-2 to left-turn movement phases, the speed used should reflect that of the drivers that
intend to turn. This speed can equal that of the adjacent through movement but it can also be
slower as left-turn drivers inherently slow to a comfortable turning speed.””
Yellow Change Interval and All Red Clearance Interval Review
“Stop on Red” Campaign Page - 4 May 2013
This flexibility for setting the intervals for left turn movements indicates that engineering judgment was
applied when establishing the existing yellow change interval and all red clearance intervals. Currently,
the FDOT District 7 policy is to implement the yellow interval for left turn movements using the adjacent
through movement’s posted speed. Correspondence with the FDOT District 7 Traffic Operations staff
member, Mark Hall, is attached as Appendix C.
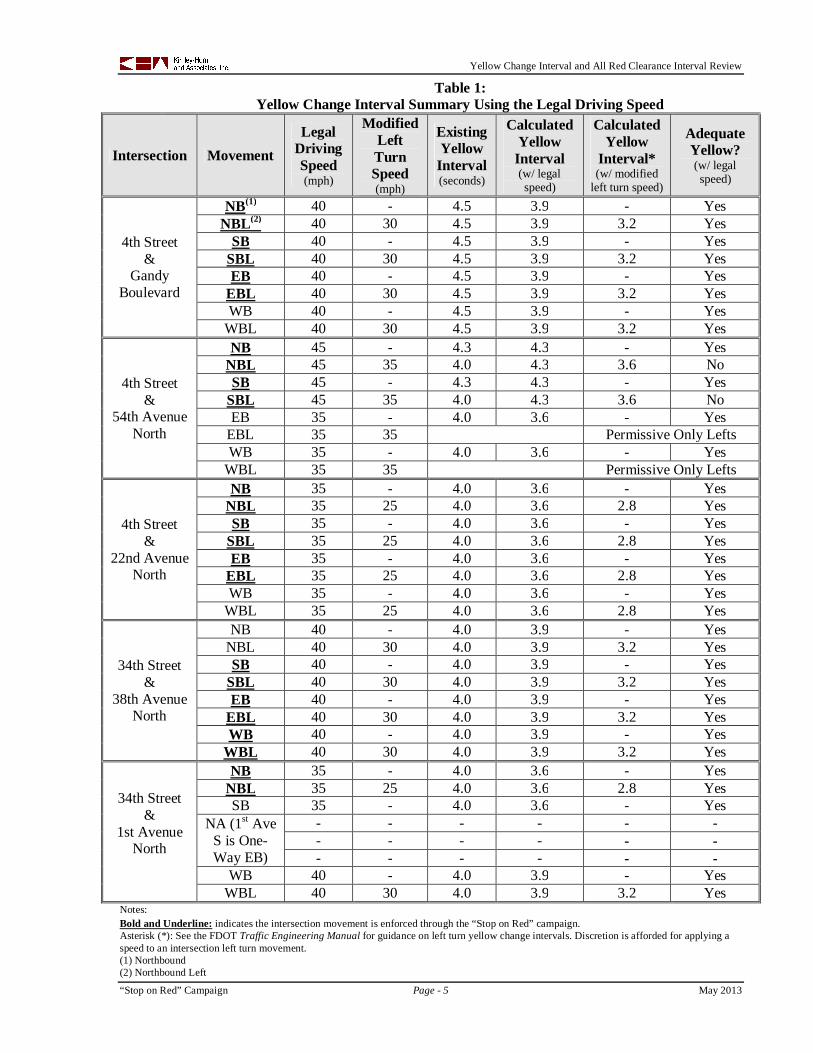
The yellow change interval was reviewed at the intersection movements for the 10 intersections that
comprise the “Stop on Red” campaign. The approach grades were assumed to be flat. Intersection
approaches with and without camera enforcement were reviewed to provide a better understanding of the
whole intersection, as safety at an entire intersection is the desired outcome instead of only intersection
approaches with camera enforcement. Table 1 provides a summary of the yellow change interval using
the legal driving speed (posted speed limit).
Yellow Change Interval and All Red Clearance Interval Review
“Stop on Red” Campaign Page - 5 May 2013
Notes:Bold and Underline: indicates the intersection movement is enforced through the “Stop on Red” campaign.Asterisk (*): See the FDOT Traffic Engineering Manual for guidance on left turn yellow change intervals. Discretion is afforded for applying aspeed to an intersection left turn movement.(1) Northbound(2) Northbound Left
Table 1:Yellow Change Interval Summary Using the Legal Driving Speed
Intersection MovementLegal
DrivingSpeed(mph)
ModifiedLeftTurnSpeed(mph)
ExistingYellow
Interval(seconds)
CalculatedYellow
Interval(w/ legalspeed)
CalculatedYellow
Interval*(w/ modified
left turn speed)
AdequateYellow?(w/ legalspeed)
4th Street&
GandyBoulevard
NB(1) 40 - 4.5 3.9 - YesNBL(2) 40 30 4.5 3.9 3.2 Yes
SB 40 - 4.5 3.9 - YesSBL 40 30 4.5 3.9 3.2 YesEB 40 - 4.5 3.9 - Yes
EBL 40 30 4.5 3.9 3.2 YesWB 40 - 4.5 3.9 - Yes
WBL 40 30 4.5 3.9 3.2 Yes
4th Street&
54th AvenueNorth
NB 45 - 4.3 4.3 - YesNBL 45 35 4.0 4.3 3.6 NoSB 45 - 4.3 4.3 - Yes
SBL 45 35 4.0 4.3 3.6 NoEB 35 - 4.0 3.6 - Yes
EBL 35 35 Permissive Only LeftsWB 35 - 4.0 3.6 - Yes
WBL 35 35 Permissive Only Lefts
4th Street&
22nd AvenueNorth
NB 35 - 4.0 3.6 - YesNBL 35 25 4.0 3.6 2.8 YesSB 35 - 4.0 3.6 - Yes
SBL 35 25 4.0 3.6 2.8 YesEB 35 - 4.0 3.6 - Yes
EBL 35 25 4.0 3.6 2.8 YesWB 35 - 4.0 3.6 - Yes
WBL 35 25 4.0 3.6 2.8 Yes
34th Street&
38th AvenueNorth
NB 40 - 4.0 3.9 - YesNBL 40 30 4.0 3.9 3.2 YesSB 40 - 4.0 3.9 - Yes
SBL 40 30 4.0 3.9 3.2 YesEB 40 - 4.0 3.9 - Yes
EBL 40 30 4.0 3.9 3.2 YesWB 40 - 4.0 3.9 - Yes
WBL 40 30 4.0 3.9 3.2 Yes
34th Street&
1st AvenueNorth
NB 35 - 4.0 3.6 - YesNBL 35 25 4.0 3.6 2.8 YesSB 35 - 4.0 3.6 - Yes
NA (1st AveS is One-Way EB)
- - - - - -- - - - - -- - - - - -
WB 40 - 4.0 3.9 - YesWBL 40 30 4.0 3.9 3.2 Yes
Yellow Change Interval and All Red Clearance Interval Review
“Stop on Red” Campaign Page - 6 May 2013
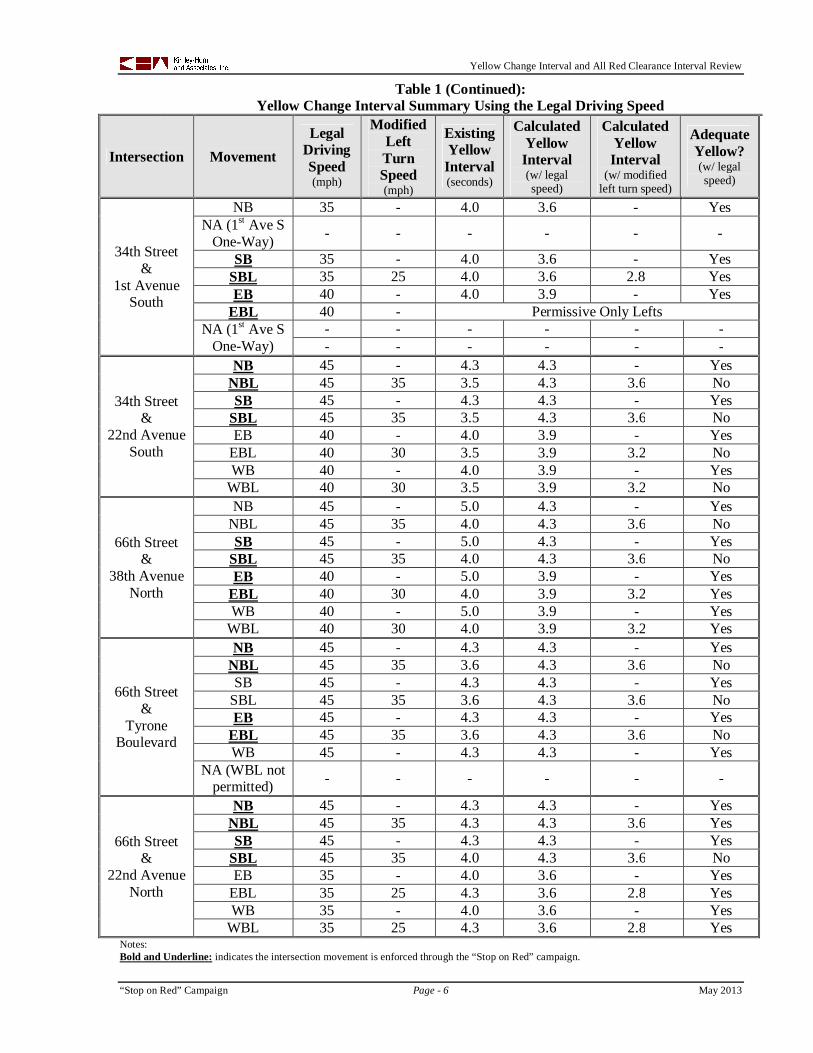
Notes:Bold and Underline: indicates the intersection movement is enforced through the “Stop on Red” campaign.
Table 1 (Continued):Yellow Change Interval Summary Using the Legal Driving Speed
Intersection MovementLegal
DrivingSpeed(mph)
ModifiedLeftTurnSpeed(mph)
ExistingYellow
Interval(seconds)
CalculatedYellowInterval(w/ legalspeed)
CalculatedYellowInterval
(w/ modifiedleft turn speed)
AdequateYellow?(w/ legalspeed)
34th Street&
1st AvenueSouth
NB 35 - 4.0 3.6 - YesNA (1st Ave S
One-Way) - - - - - -
SB 35 - 4.0 3.6 - YesSBL 35 25 4.0 3.6 2.8 YesEB 40 - 4.0 3.9 - Yes
EBL 40 - Permissive Only LeftsNA (1st Ave S
One-Way)- - - - - -- - - - - -
34th Street&
22nd AvenueSouth
NB 45 - 4.3 4.3 - YesNBL 45 35 3.5 4.3 3.6 NoSB 45 - 4.3 4.3 - Yes
SBL 45 35 3.5 4.3 3.6 NoEB 40 - 4.0 3.9 - Yes
EBL 40 30 3.5 3.9 3.2 NoWB 40 - 4.0 3.9 - Yes
WBL 40 30 3.5 3.9 3.2 No
66th Street&
38th AvenueNorth
NB 45 - 5.0 4.3 - YesNBL 45 35 4.0 4.3 3.6 NoSB 45 - 5.0 4.3 - Yes
SBL 45 35 4.0 4.3 3.6 NoEB 40 - 5.0 3.9 - Yes
EBL 40 30 4.0 3.9 3.2 YesWB 40 - 5.0 3.9 - Yes
WBL 40 30 4.0 3.9 3.2 Yes
66th Street&
TyroneBoulevard
NB 45 - 4.3 4.3 - YesNBL 45 35 3.6 4.3 3.6 NoSB 45 - 4.3 4.3 - Yes
SBL 45 35 3.6 4.3 3.6 NoEB 45 - 4.3 4.3 - Yes
EBL 45 35 3.6 4.3 3.6 NoWB 45 - 4.3 4.3 - Yes
NA (WBL notpermitted) - - - - - -
66th Street&
22nd AvenueNorth
NB 45 - 4.3 4.3 - YesNBL 45 35 4.3 4.3 3.6 YesSB 45 - 4.3 4.3 - Yes
SBL 45 35 4.0 4.3 3.6 NoEB 35 - 4.0 3.6 - Yes
EBL 35 25 4.3 3.6 2.8 YesWB 35 - 4.0 3.6 - Yes
WBL 35 25 4.3 3.6 2.8 Yes
Yellow Change Interval and All Red Clearance Interval Review
“Stop on Red” Campaign Page - 7 May 2013
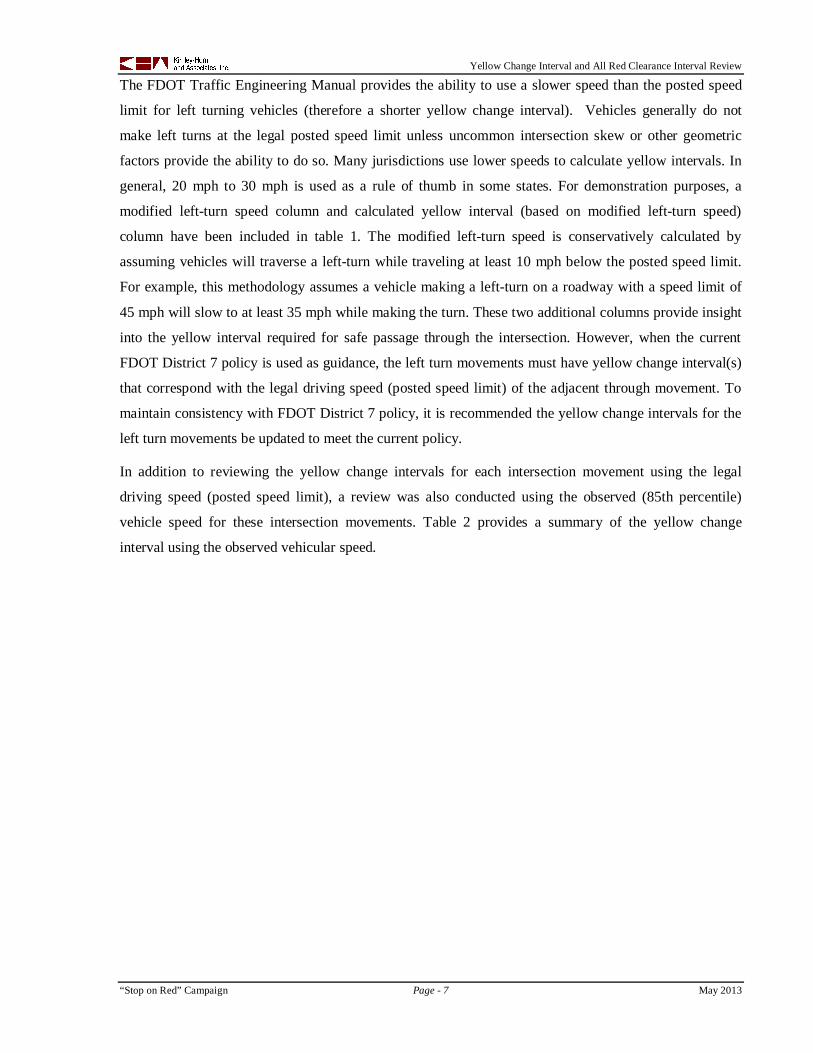
The FDOT Traffic Engineering Manual provides the ability to use a slower speed than the posted speed
limit for left turning vehicles (therefore a shorter yellow change interval). Vehicles generally do not
make left turns at the legal posted speed limit unless uncommon intersection skew or other geometric
factors provide the ability to do so. Many jurisdictions use lower speeds to calculate yellow intervals. In
general, 20 mph to 30 mph is used as a rule of thumb in some states. For demonstration purposes, a
modified left-turn speed column and calculated yellow interval (based on modified left-turn speed)
column have been included in table 1. The modified left-turn speed is conservatively calculated by
assuming vehicles will traverse a left-turn while traveling at least 10 mph below the posted speed limit.
For example, this methodology assumes a vehicle making a left-turn on a roadway with a speed limit of
45 mph will slow to at least 35 mph while making the turn. These two additional columns provide insight
into the yellow interval required for safe passage through the intersection. However, when the current
FDOT District 7 policy is used as guidance, the left turn movements must have yellow change interval(s)
that correspond with the legal driving speed (posted speed limit) of the adjacent through movement. To
maintain consistency with FDOT District 7 policy, it is recommended the yellow change intervals for the
left turn movements be updated to meet the current policy.
In addition to reviewing the yellow change intervals for each intersection movement using the legal
driving speed (posted speed limit), a review was also conducted using the observed (85th percentile)
vehicle speed for these intersection movements. Table 2 provides a summary of the yellow change
interval using the observed vehicular speed.
Yellow Change Interval and All Red Clearance Interval Review
“Stop on Red” Campaign Page - 8 May 2013
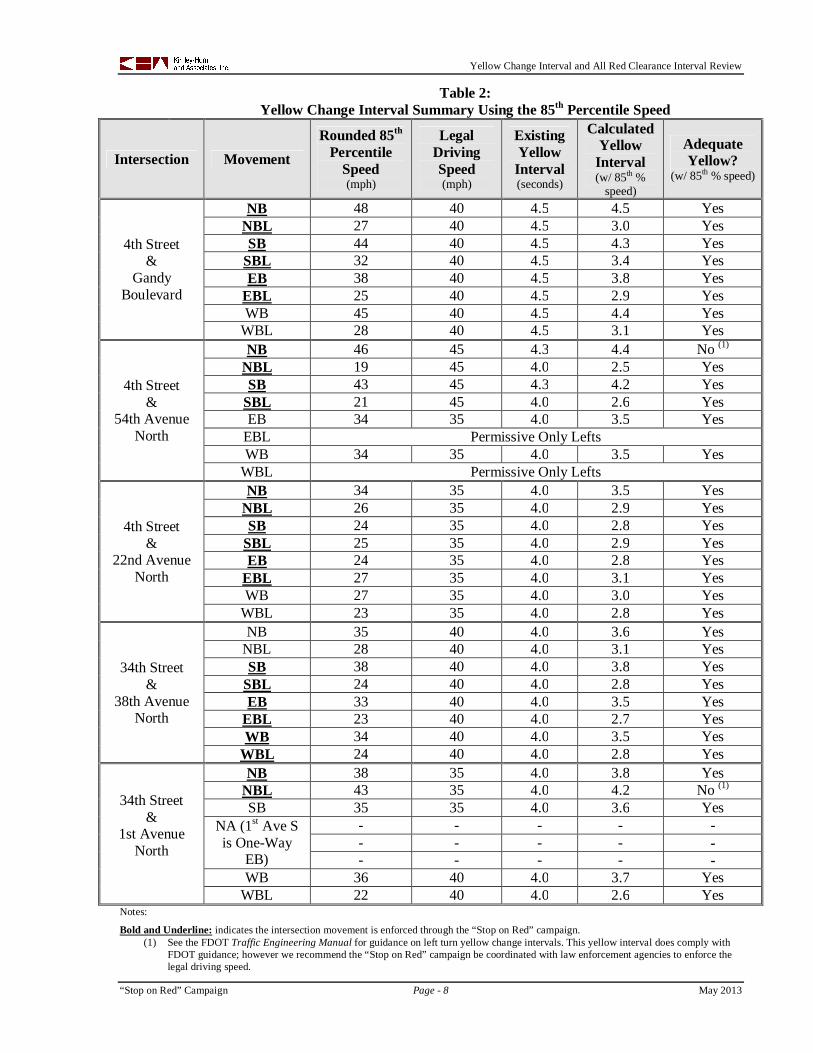
Notes:
Bold and Underline: indicates the intersection movement is enforced through the “Stop on Red” campaign.(1) See the FDOT Traffic Engineering Manual for guidance on left turn yellow change intervals. This yellow interval does comply with
FDOT guidance; however we recommend the “Stop on Red” campaign be coordinated with law enforcement agencies to enforce thelegal driving speed.
Table 2:Yellow Change Interval Summary Using the 85th Percentile Speed
Intersection MovementRounded 85th
PercentileSpeed(mph)
LegalDrivingSpeed(mph)
ExistingYellow
Interval(seconds)
CalculatedYellow
Interval(w/ 85th %
speed)
AdequateYellow?
(w/ 85th % speed)
4th Street&
GandyBoulevard
NB 48 40 4.5 4.5 YesNBL 27 40 4.5 3.0 YesSB 44 40 4.5 4.3 Yes
SBL 32 40 4.5 3.4 YesEB 38 40 4.5 3.8 Yes
EBL 25 40 4.5 2.9 YesWB 45 40 4.5 4.4 Yes
WBL 28 40 4.5 3.1 Yes
4th Street&
54th AvenueNorth
NB 46 45 4.3 4.4 No (1)
NBL 19 45 4.0 2.5 YesSB 43 45 4.3 4.2 Yes
SBL 21 45 4.0 2.6 YesEB 34 35 4.0 3.5 Yes
EBL Permissive Only LeftsWB 34 35 4.0 3.5 Yes
WBL Permissive Only Lefts
4th Street&
22nd AvenueNorth
NB 34 35 4.0 3.5 YesNBL 26 35 4.0 2.9 YesSB 24 35 4.0 2.8 Yes
SBL 25 35 4.0 2.9 YesEB 24 35 4.0 2.8 Yes
EBL 27 35 4.0 3.1 YesWB 27 35 4.0 3.0 Yes
WBL 23 35 4.0 2.8 Yes
34th Street&
38th AvenueNorth
NB 35 40 4.0 3.6 YesNBL 28 40 4.0 3.1 YesSB 38 40 4.0 3.8 Yes
SBL 24 40 4.0 2.8 YesEB 33 40 4.0 3.5 Yes
EBL 23 40 4.0 2.7 YesWB 34 40 4.0 3.5 Yes
WBL 24 40 4.0 2.8 Yes
34th Street&
1st AvenueNorth
NB 38 35 4.0 3.8 YesNBL 43 35 4.0 4.2 No (1)
SB 35 35 4.0 3.6 YesNA (1st Ave Sis One-Way
EB)
- - - - -- - - - -- - - - -
WB 36 40 4.0 3.7 YesWBL 22 40 4.0 2.6 Yes
Yellow Change Interval and All Red Clearance Interval Review
“Stop on Red” Campaign Page - 9 May 2013
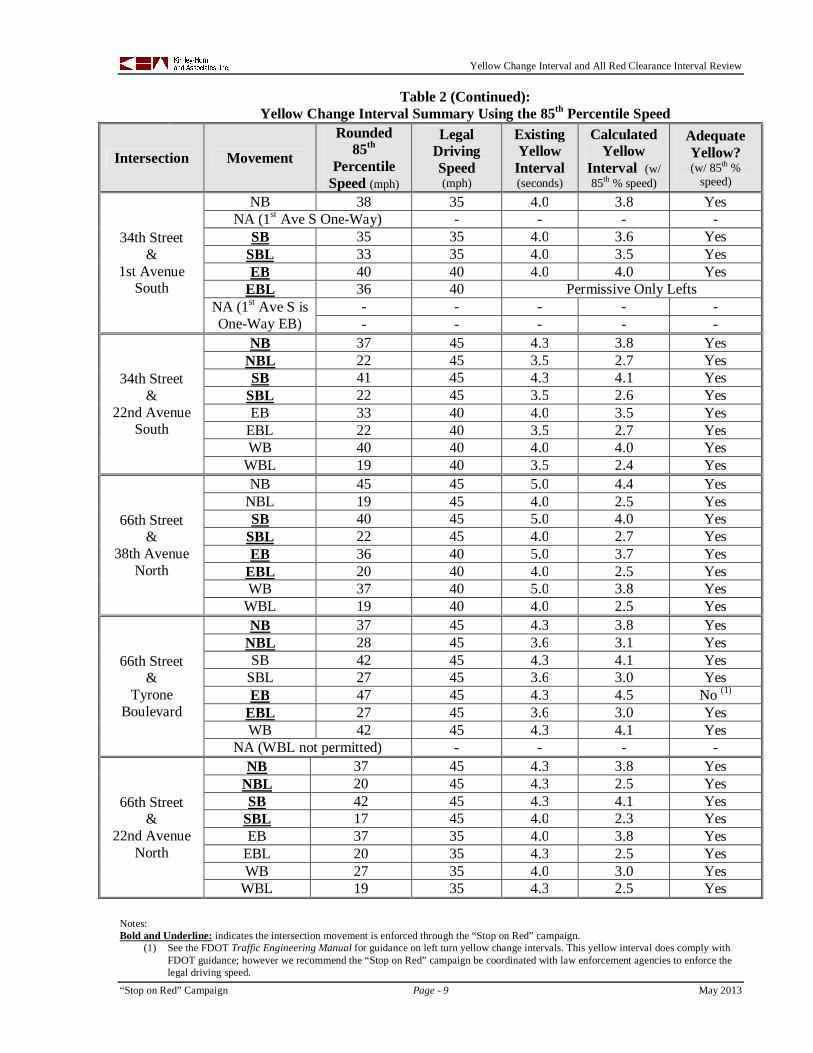
Notes:Bold and Underline: indicates the intersection movement is enforced through the “Stop on Red” campaign.
(1) See the FDOT Traffic Engineering Manual for guidance on left turn yellow change intervals. This yellow interval does comply withFDOT guidance; however we recommend the “Stop on Red” campaign be coordinated with law enforcement agencies to enforce thelegal driving speed.
Table 2 (Continued):Yellow Change Interval Summary Using the 85th Percentile Speed
Intersection Movement
Rounded85th
PercentileSpeed (mph)
LegalDrivingSpeed(mph)
ExistingYellow
Interval(seconds)
CalculatedYellow
Interval (w/85th % speed)
AdequateYellow?(w/ 85th %
speed)
34th Street&
1st AvenueSouth
NB 38 35 4.0 3.8 YesNA (1st Ave S One-Way) - - - -
SB 35 35 4.0 3.6 YesSBL 33 35 4.0 3.5 YesEB 40 40 4.0 4.0 Yes
EBL 36 40 Permissive Only LeftsNA (1st Ave S isOne-Way EB)
- - - - -- - - - -
34th Street&
22nd AvenueSouth
NB 37 45 4.3 3.8 YesNBL 22 45 3.5 2.7 YesSB 41 45 4.3 4.1 Yes
SBL 22 45 3.5 2.6 YesEB 33 40 4.0 3.5 Yes
EBL 22 40 3.5 2.7 YesWB 40 40 4.0 4.0 Yes
WBL 19 40 3.5 2.4 Yes
66th Street&
38th AvenueNorth
NB 45 45 5.0 4.4 YesNBL 19 45 4.0 2.5 YesSB 40 45 5.0 4.0 Yes
SBL 22 45 4.0 2.7 YesEB 36 40 5.0 3.7 Yes
EBL 20 40 4.0 2.5 YesWB 37 40 5.0 3.8 Yes
WBL 19 40 4.0 2.5 Yes
66th Street&
TyroneBoulevard
NB 37 45 4.3 3.8 YesNBL 28 45 3.6 3.1 YesSB 42 45 4.3 4.1 Yes
SBL 27 45 3.6 3.0 YesEB 47 45 4.3 4.5 No (1)
EBL 27 45 3.6 3.0 YesWB 42 45 4.3 4.1 Yes
NA (WBL not permitted) - - - -
66th Street&
22nd AvenueNorth
NB 37 45 4.3 3.8 YesNBL 20 45 4.3 2.5 YesSB 42 45 4.3 4.1 Yes
SBL 17 45 4.0 2.3 YesEB 37 35 4.0 3.8 Yes
EBL 20 35 4.3 2.5 YesWB 27 35 4.0 3.0 Yes
WBL 19 35 4.3 2.5 Yes
Yellow Change Interval and All Red Clearance Interval Review
Page - 10 May 2013
The yellow change interval summary using the 85th percentile speed data shows that sixty-four (64)
intersection movements have a yellow change interval greater than the calculated value, and three (3)
movements with a yellow interval equal to the calculated value. In addition, three (3) movements, which
have observed intersection movement speeds that exceed the legal driving speed, result in yellow interval
calculations that are greater than the existing yellow interval when the observed speed is an input to the
calculation. The yellow clearance interval may not be sufficient to accommodate drivers who exceed the
legal driving speed; therefore we recommend the “Stop on Red” campaign be coordinated with law
enforcement agencies to enforce the legal driving speed.
Yellow Change Interval and All Red Clearance Interval Review
Page - 11 May 2013
All Red Clearance Interval
The all red clearance interval is a safety measure that is not associated with the “Stop on Red” campaign.
The “Stop on Red” campaign is a tool that includes enforcing the law prohibiting drivers from entering
the intersection on a red indication. The all red clearance interval is designed to allow drivers who entered
the intersection legally during the yellow indication, to safely continue through the intersection before
conflicting traffic receives a green indication. The all red clearance interval is important for intersection
safety as it provides the time for drivers to vacate the intersection and significantly reduce the likelihood
of conflicts within the intersection.
The existing all red clearance intervals were implemented with the collaboration of FDOT District 7, as
the FDOT has jurisdiction over these 10 intersections. The FDOT Traffic Engineering Manual (Chapter
3, section 6.2(4)) discusses the speed used to calculate left turn movements’ yellow change interval and
all red clearance interval, and states:
Through lane and turn lane approach speeds on an approach may be different. According to
Section 5.3 of the Federal Highway Administration’s Signal Timing Manual, “When applying
Equation 5-2 to left-turn movement phases, the speed used should reflect that of the drivers that
intend to turn. This speed can equal that of the adjacent through movement but it can also be
slower as left-turn drivers inherently slow to a comfortable turning speed.”
This flexibility for setting the intervals for left turn movements indicates that engineering judgment was
applied when establishing the existing all red clearance intervals. Currently, the FDOT District 7 policy
is to implement the all red clearance interval for left turn movements using the adjacent through
movement’s posted speed. Correspondence with the FDOT District 7 Traffic Operations staff member,
Mark Hall, is attached as Appendix C.
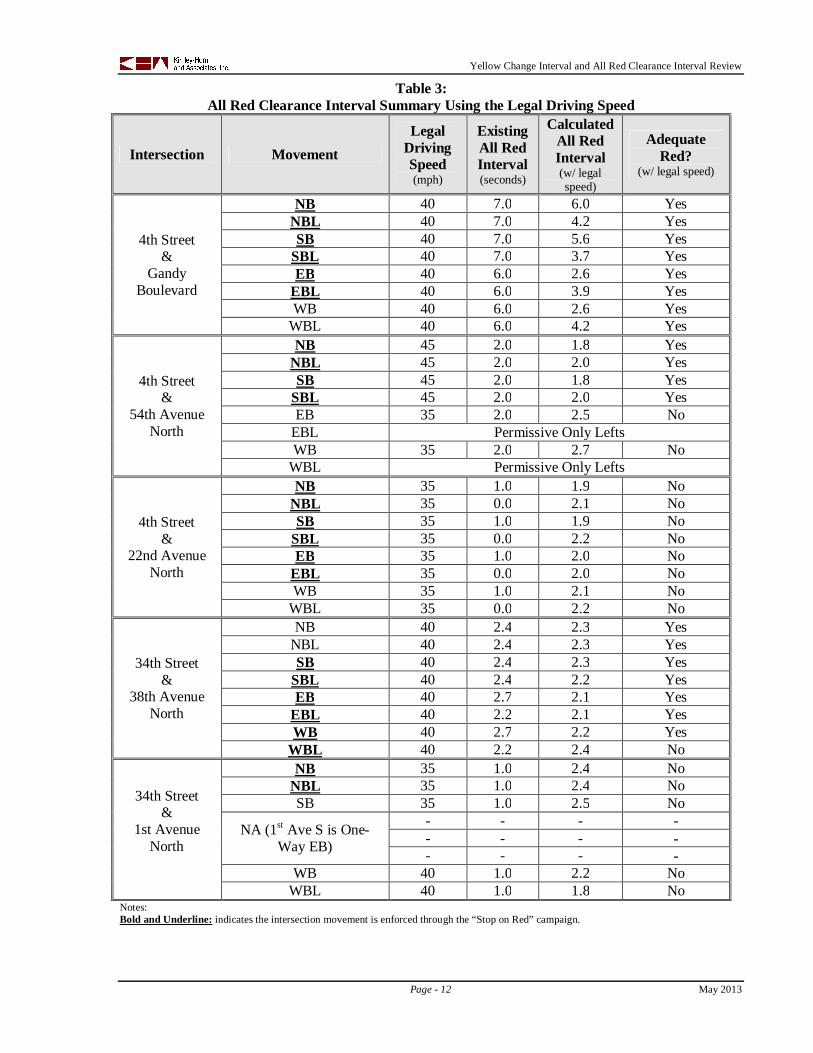
The all red clearance interval was reviewed at the intersection approaches for the 10 intersections that
comprise the “Stop on Red” campaign. The approach grades were assumed to be flat. As with the yellow
change interval review, the intersection approaches with and without camera enforcement were reviewed
to provide a better understanding of the whole intersection, as safety at an entire intersection is the desired
outcome instead of only intersection approaches with camera enforcement. A summary of the all red
clearance interval review is provided in Table 3.
Yellow Change Interval and All Red Clearance Interval Review
Page - 12 May 2013
Notes:Bold and Underline: indicates the intersection movement is enforced through the “Stop on Red” campaign.
Table 3:All Red Clearance Interval Summary Using the Legal Driving Speed
Intersection MovementLegal
DrivingSpeed(mph)
ExistingAll RedInterval(seconds)
CalculatedAll RedInterval(w/ legalspeed)
AdequateRed?
(w/ legal speed)
4th Street&
GandyBoulevard
NB 40 7.0 6.0 YesNBL 40 7.0 4.2 YesSB 40 7.0 5.6 Yes
SBL 40 7.0 3.7 YesEB 40 6.0 2.6 Yes
EBL 40 6.0 3.9 YesWB 40 6.0 2.6 Yes
WBL 40 6.0 4.2 Yes
4th Street&
54th AvenueNorth
NB 45 2.0 1.8 YesNBL 45 2.0 2.0 YesSB 45 2.0 1.8 Yes
SBL 45 2.0 2.0 YesEB 35 2.0 2.5 No
EBL Permissive Only LeftsWB 35 2.0 2.7 No
WBL Permissive Only Lefts
4th Street&
22nd AvenueNorth
NB 35 1.0 1.9 NoNBL 35 0.0 2.1 NoSB 35 1.0 1.9 No
SBL 35 0.0 2.2 NoEB 35 1.0 2.0 No
EBL 35 0.0 2.0 NoWB 35 1.0 2.1 No
WBL 35 0.0 2.2 No
34th Street&
38th AvenueNorth
NB 40 2.4 2.3 YesNBL 40 2.4 2.3 YesSB 40 2.4 2.3 Yes
SBL 40 2.4 2.2 YesEB 40 2.7 2.1 Yes
EBL 40 2.2 2.1 YesWB 40 2.7 2.2 Yes
WBL 40 2.2 2.4 No
34th Street&
1st AvenueNorth
NB 35 1.0 2.4 NoNBL 35 1.0 2.4 NoSB 35 1.0 2.5 No
NA (1st Ave S is One-Way EB)
- - - -- - - -- - - -
WB 40 1.0 2.2 NoWBL 40 1.0 1.8 No
Yellow Change Interval and All Red Clearance Interval Review
Page - 13 May 2013
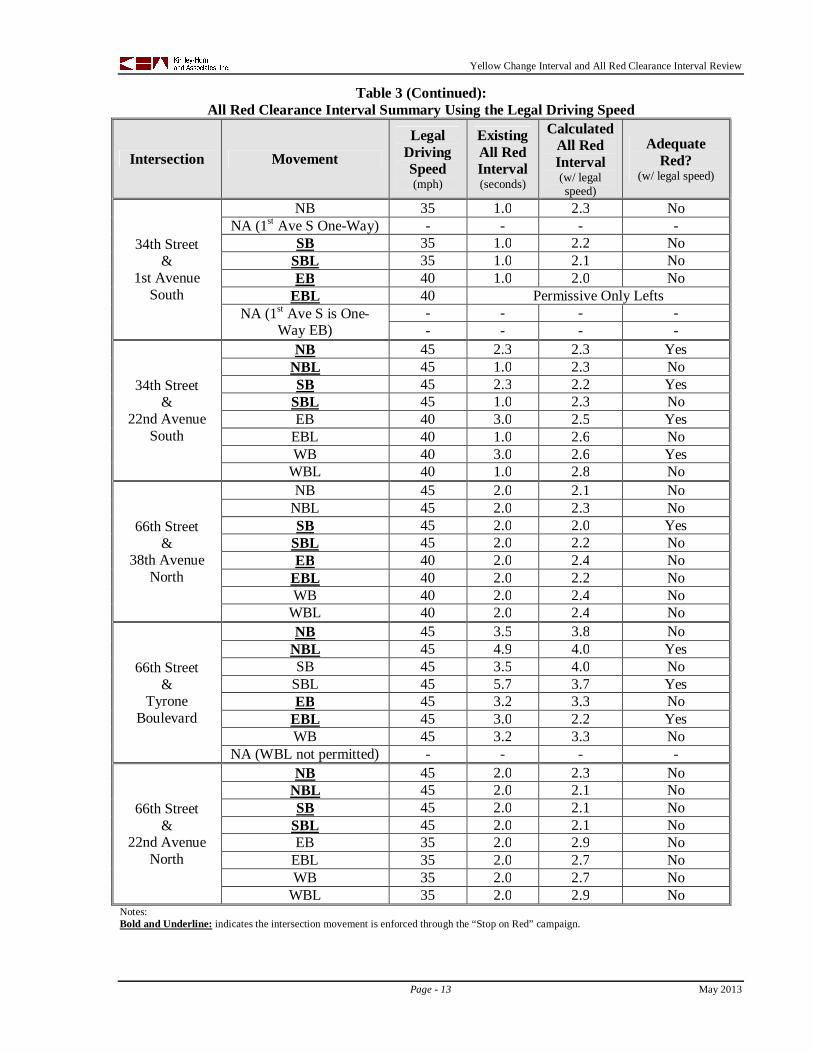
Notes:Bold and Underline: indicates the intersection movement is enforced through the “Stop on Red” campaign.
Table 3 (Continued):All Red Clearance Interval Summary Using the Legal Driving Speed
Intersection MovementLegal
DrivingSpeed(mph)
ExistingAll RedInterval(seconds)
CalculatedAll RedInterval(w/ legalspeed)
AdequateRed?
(w/ legal speed)
34th Street&
1st AvenueSouth
NB 35 1.0 2.3 NoNA (1st Ave S One-Way) - - - -
SB 35 1.0 2.2 NoSBL 35 1.0 2.1 NoEB 40 1.0 2.0 No
EBL 40 Permissive Only LeftsNA (1st Ave S is One-
Way EB)- - - -- - - -
34th Street&
22nd AvenueSouth
NB 45 2.3 2.3 YesNBL 45 1.0 2.3 NoSB 45 2.3 2.2 Yes
SBL 45 1.0 2.3 NoEB 40 3.0 2.5 Yes
EBL 40 1.0 2.6 NoWB 40 3.0 2.6 Yes
WBL 40 1.0 2.8 No
66th Street&
38th AvenueNorth
NB 45 2.0 2.1 NoNBL 45 2.0 2.3 NoSB 45 2.0 2.0 Yes
SBL 45 2.0 2.2 NoEB 40 2.0 2.4 No
EBL 40 2.0 2.2 NoWB 40 2.0 2.4 No
WBL 40 2.0 2.4 No
66th Street&
TyroneBoulevard
NB 45 3.5 3.8 NoNBL 45 4.9 4.0 YesSB 45 3.5 4.0 No
SBL 45 5.7 3.7 YesEB 45 3.2 3.3 No
EBL 45 3.0 2.2 YesWB 45 3.2 3.3 No
NA (WBL not permitted) - - - -
66th Street&
22nd AvenueNorth
NB 45 2.0 2.3 NoNBL 45 2.0 2.1 NoSB 45 2.0 2.1 No
SBL 45 2.0 2.1 NoEB 35 2.0 2.9 No
EBL 35 2.0 2.7 NoWB 35 2.0 2.7 No
WBL 35 2.0 2.9 No
Yellow Change Interval and All Red Clearance Interval Review
Page - 14 May 2013
The FDOT Traffic Engineering Manual provides the ability to use a slower speed for left turning
vehicles. When the current FDOT District 7 policy is used as guidance, both the through movements and
the left turn movements would have all red clearance interval(s) that correspond with the legal driving
speed (posted speed limit) of the through movement. It is recommended that the all red clearance intervals
for the through movements and the left turn movements be updated to meet the current FDOT District 7
policy.
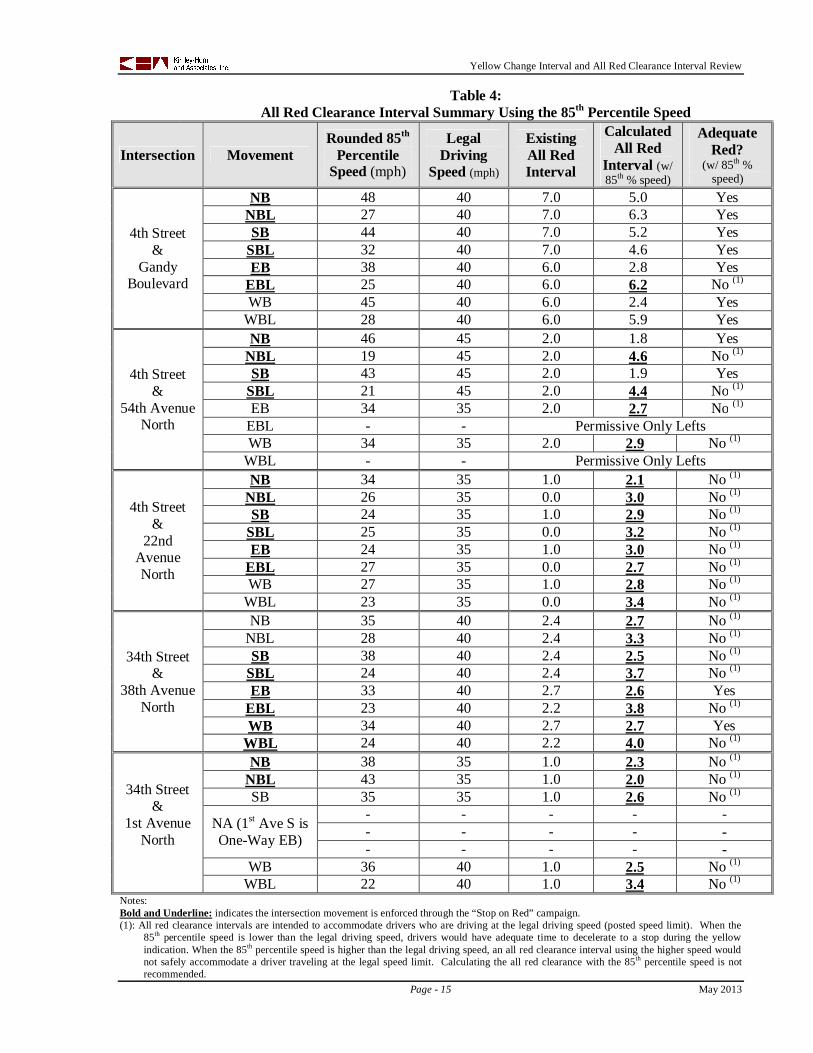
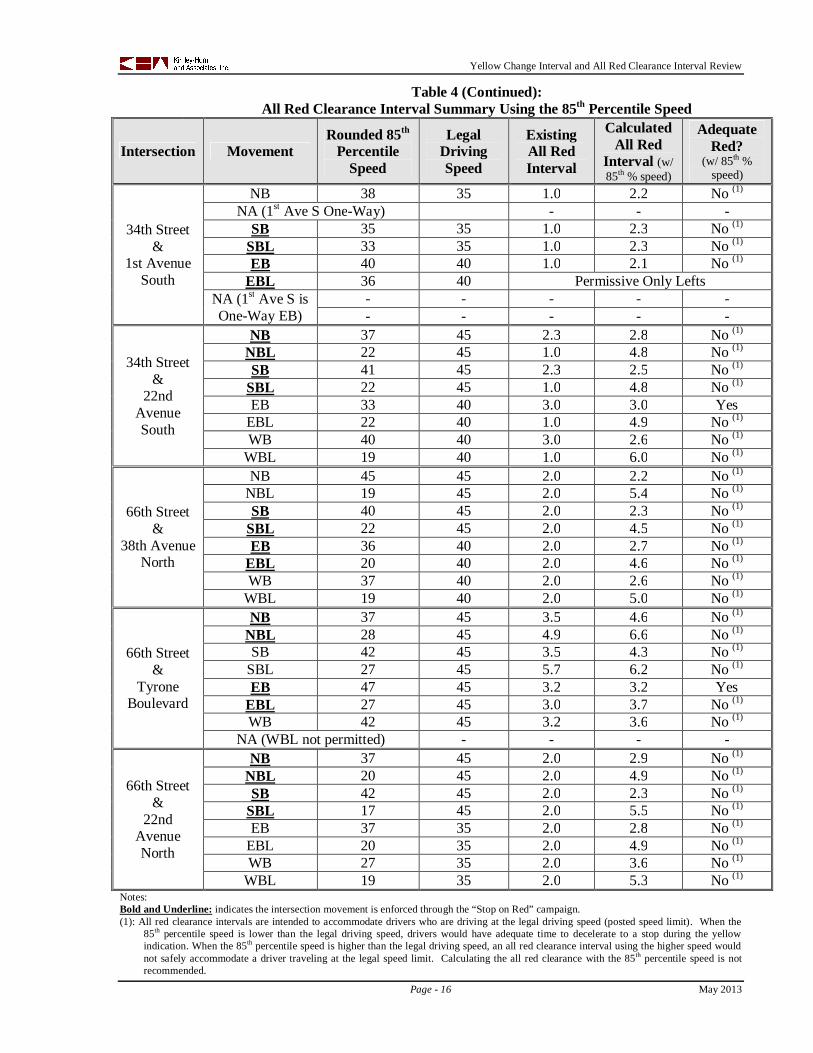
In addition to reviewing the all red clearance intervals for each intersection movement using the legal
driving speed (posted speed limit), a review was also conducted using the observed (85th percentile)
vehicle speed for these intersection movements. Table 4 provides a summary of the all red clearance
interval review using the observed vehicular speed.
Yellow Change Interval and All Red Clearance Interval Review
Page - 15 May 2013
Notes:Bold and Underline: indicates the intersection movement is enforced through the “Stop on Red” campaign.(1): All red clearance intervals are intended to accommodate drivers who are driving at the legal driving speed (posted speed limit). When the
85th percentile speed is lower than the legal driving speed, drivers would have adequate time to decelerate to a stop during the yellowindication. When the 85th percentile speed is higher than the legal driving speed, an all red clearance interval using the higher speed wouldnot safely accommodate a driver traveling at the legal speed limit. Calculating the all red clearance with the 85th percentile speed is notrecommended.
Table 4:All Red Clearance Interval Summary Using the 85th Percentile Speed
Intersection MovementRounded 85th
PercentileSpeed (mph)
LegalDriving
Speed (mph)
ExistingAll RedInterval
CalculatedAll Red
Interval (w/85th % speed)
AdequateRed?
(w/ 85th %speed)
4th Street&
GandyBoulevard
NB 48 40 7.0 5.0 YesNBL 27 40 7.0 6.3 YesSB 44 40 7.0 5.2 Yes
SBL 32 40 7.0 4.6 YesEB 38 40 6.0 2.8 Yes
EBL 25 40 6.0 6.2 No (1)
WB 45 40 6.0 2.4 YesWBL 28 40 6.0 5.9 Yes
4th Street&
54th AvenueNorth
NB 46 45 2.0 1.8 YesNBL 19 45 2.0 4.6 No (1)
SB 43 45 2.0 1.9 YesSBL 21 45 2.0 4.4 No (1)
EB 34 35 2.0 2.7 No (1)
EBL - - Permissive Only LeftsWB 34 35 2.0 2.9 No (1)
WBL - - Permissive Only Lefts
4th Street&
22ndAvenueNorth
NB 34 35 1.0 2.1 No (1)
NBL 26 35 0.0 3.0 No (1)
SB 24 35 1.0 2.9 No (1)
SBL 25 35 0.0 3.2 No (1)
EB 24 35 1.0 3.0 No (1)
EBL 27 35 0.0 2.7 No (1)
WB 27 35 1.0 2.8 No (1)
WBL 23 35 0.0 3.4 No (1)
34th Street&
38th AvenueNorth
NB 35 40 2.4 2.7 No (1)
NBL 28 40 2.4 3.3 No (1)
SB 38 40 2.4 2.5 No (1)
SBL 24 40 2.4 3.7 No (1)
EB 33 40 2.7 2.6 YesEBL 23 40 2.2 3.8 No (1)
WB 34 40 2.7 2.7 YesWBL 24 40 2.2 4.0 No (1)
34th Street&
1st AvenueNorth
NB 38 35 1.0 2.3 No (1)
NBL 43 35 1.0 2.0 No (1)
SB 35 35 1.0 2.6 No (1)
NA (1st Ave S isOne-Way EB)
- - - - -- - - - -- - - - -
WB 36 40 1.0 2.5 No (1)
WBL 22 40 1.0 3.4 No (1)
Yellow Change Interval and All Red Clearance Interval Review
Page - 16 May 2013
Notes:Bold and Underline: indicates the intersection movement is enforced through the “Stop on Red” campaign.(1): All red clearance intervals are intended to accommodate drivers who are driving at the legal driving speed (posted speed limit). When the
85th percentile speed is lower than the legal driving speed, drivers would have adequate time to decelerate to a stop during the yellowindication. When the 85th percentile speed is higher than the legal driving speed, an all red clearance interval using the higher speed wouldnot safely accommodate a driver traveling at the legal speed limit. Calculating the all red clearance with the 85th percentile speed is notrecommended.
Table 4 (Continued):All Red Clearance Interval Summary Using the 85th Percentile Speed
Intersection MovementRounded 85th
PercentileSpeed
LegalDrivingSpeed
ExistingAll RedInterval
CalculatedAll Red
Interval (w/85th % speed)
AdequateRed?
(w/ 85th %speed)
34th Street&
1st AvenueSouth
NB 38 35 1.0 2.2 No (1)
NA (1st Ave S One-Way) - - -SB 35 35 1.0 2.3 No (1)
SBL 33 35 1.0 2.3 No (1)
EB 40 40 1.0 2.1 No (1)
EBL 36 40 Permissive Only LeftsNA (1st Ave S isOne-Way EB)
- - - - -- - - - -
34th Street&
22ndAvenueSouth
NB 37 45 2.3 2.8 No (1)
NBL 22 45 1.0 4.8 No (1)
SB 41 45 2.3 2.5 No (1)
SBL 22 45 1.0 4.8 No (1)
EB 33 40 3.0 3.0 YesEBL 22 40 1.0 4.9 No (1)
WB 40 40 3.0 2.6 No (1)
WBL 19 40 1.0 6.0 No (1)
66th Street&
38th AvenueNorth
NB 45 45 2.0 2.2 No (1)
NBL 19 45 2.0 5.4 No (1)
SB 40 45 2.0 2.3 No (1)
SBL 22 45 2.0 4.5 No (1)
EB 36 40 2.0 2.7 No (1)
EBL 20 40 2.0 4.6 No (1)
WB 37 40 2.0 2.6 No (1)
WBL 19 40 2.0 5.0 No (1)
66th Street&
TyroneBoulevard
NB 37 45 3.5 4.6 No (1)
NBL 28 45 4.9 6.6 No (1)
SB 42 45 3.5 4.3 No (1)
SBL 27 45 5.7 6.2 No (1)
EB 47 45 3.2 3.2 YesEBL 27 45 3.0 3.7 No (1)
WB 42 45 3.2 3.6 No (1)
NA (WBL not permitted) - - - -
66th Street&
22ndAvenueNorth
NB 37 45 2.0 2.9 No (1)
NBL 20 45 2.0 4.9 No (1)
SB 42 45 2.0 2.3 No (1)
SBL 17 45 2.0 5.5 No (1)
EB 37 35 2.0 2.8 No (1)
EBL 20 35 2.0 4.9 No (1)
WB 27 35 2.0 3.6 No (1)
WBL 19 35 2.0 5.3 No (1)
Yellow Change Interval and All Red Clearance Interval Review
Page - 17 May 2013
The all red clearance interval summary using the 85th percentile speed data shows that ten (10)
intersection movements have an all red clearance interval greater than the calculated value, three (3)
movements have a red interval equal to the calculated value, and fifty-seven (57) movements have all red
clearance intervals that are less than the calculated value. Increasing the all red clearance intervals should
be considered for the movements with current red intervals less than the calculated values using the legal
driving speed (posted speed limit). When the current FDOT District 7 policy is used as guidance, the all
red clearance intervals are intended to accommodate drivers who are driving at or below the legal driving
speed (posted speed limit). Drivers who are slower than the legal driving speed would have adequate
time to decelerate to a stop under the yellow indication. As stated earlier, we recommend the all red
clearance intervals for the through movements and the left turn movements to be updated to meet the
current FDOT District 7 policy, which is calculated using the legal driving speed (posted speed limit).
The City of St. Petersburg staff has confirmed that the red clearance intervals used within the City comply
with the requirements within the FDOT Traffic Engineering Manual., which states:
“All new signals installations, intersections with Traffic Infraction Devices, signal phasing
changes, geometric changes affecting the timing or phasing, or corridor re-timing projects must
comply with these guidelines [in the November 2012 edition] immediately upon implementing
timing changes. All other existing signalized intersections on the state highway system must be in
compliance with guidelines of this Section by January 1, 2015.”
City of St. Petersburg staff has confirmed that updating the red clearance intervals across the City are
scheduled to meet the January 1, 2015 date as required by the FDOT.
Yellow Change Interval and All Red Clearance Interval Review
Page - 18 May 2013
Review of Other Agencies’ Yellow Interval Documentation
The Federal Highway Administration (FHWA) provides a resource titled Red-Light Camera Q & A to
answer frequently asked questions regarding red light cameras and their operation. This resource also
includes numerous links to supplemental documents and reports associated with the various red light
camera questions FHWA is attempting to answer. These secondary references include information
relating to yellow change intervals in general and in conjunction with red light cameras. The FHWA
resource and the available secondary resources are provided in the Appendix. Some of the information
gathered from the FHWS resource includes:
Federal Highway Administration, Red-Light Camera Systems Operational Guidelines, 2005
This document is a non-regulatory requirement that is intended to foster initiatives to improve
intersection safety and reduce red light running crashes. With regard to yellow intervals, the
document defines the purpose as allowing enough time for a vehicle to comfortably decelerate to
a stop before entering the intersection or to proceed through the intersection at a constant speed
prior to the signal indication changing to red. Lengthening the yellow interval, within appropriate
guidelines, can reduce the number of inadvertent red light violations. Yellow intervals should be
established in accordance with the MUTCD and the ITE Proposed Recommended Practice
(1985).
Institute of Transportation Engineers (ITE), Making Intersections Safer: A Toolbox of
Engineering Countermeasures to Reduce Red-Light Running, ITE Report 115, 2003
This document focuses on explaining the behavior and characteristics behind red light running to
provide solutions for engineering intersections that discourage red light running. Some of the
contributing factors in red light running include 1) a higher number of approaching vehicles
yielding a higher exposure, 2) a higher number of signal cycles and therefore a higher number of
yellow intervals, and 3) suboptimal signal coordination leading to a yellow interval beginning in
the middle of a platoon of approaching vehicles. Additionally, excessively long yellow intervals
can decrease capacity, violate driver expectancy, and cause frustration when a vehicle comes to a
complete stop at the intersection before the signal indication changes to red. The adjustment of
driver behavior to account for known excessive yellow intervals is referred to as “habituation”
and can result in drivers intentionally disregarding the yellow indication. However, further
research into this phenomenon is needed to obtain reliable statistical data. Conversely, yellow
intervals below the ITE recommended values can also violate driver expectancy and lead to a
Yellow Change Interval and All Red Clearance Interval Review
Page - 19 May 2013
higher number of red light violations. Several studies cited that increasing the yellow interval to
meet ITE recommended values decreased the chance of red light running.
Federal Highway Administration, Guidance Memorandum on Consideration and
Implementation of Proven Safety Countermeasures, 2008, Revision July 1, 2009
This policy summarizes the nine proven safety countermeasures identified by FHWA and
provides guidance for implementation. With regard to yellow change intervals, the background
reiterates that numerous studies support the ITE recommended values as a means to reduce
crashes resulting from red light running. The guidance statement and application for this
countermeasure states that the yellow interval should be adequate to allow a motorist traveling at
the prevailing speed of traffic to comfortably stop at the intersection before the signal indication
changes to red.
In addition to FHWA resources, documentation from the State of Georgia and City of Winnipeg, Canada
outlining their evaluation of local yellow intervals were also reviewed.
State of Georgia House Bill 77, 2008
The State of Georgia passed House Bill 77 in 2008 mandating that “The duration of the yellow or
red light of any traffic-control device at which a traffic-control signal monitoring device is
installed shall not be decreased prior to the installation of a device or during the time for which
the device is operated. The Department of Transportation shall establish minimal yellow light
change interval times for traffic-control devices at intersections where a traffic-control signal
monitoring device is utilized. The minimal yellow light change interval time shall be established
in accordance with nationally recognized engineering standards, and any such established time
shall not be less than the recognized national standard plus one additional second.” This language
is part of the larger bill which sets forth guidelines for local governments to follow prior to
installing red light cameras and the procedures that must be followed for violations. Detailed
research supporting the “plus one additional second” of yellow interval time was not discovered.
City of Winnipeg, Canada, Review the Adequacy of Amber Time Duration at Signalized
Intersections, 2011 Administrative Report
The City of Winnipeg, Canada issued an administrative report titled Review the Adequacy of
Amber Time Duration at Signalized Intersections in 2011. The report evaluated the City’s
existing yellow change intervals in response to media coverage regarding Georgia’s House Bill
77. The report concludes that the City’s existing policy of a consistent 4-second yellow interval at
Yellow Change Interval and All Red Clearance Interval Review
Page - 20 May 2013
all intersections is adequate and should be retained with no calculation based on the ITE
formulas. It did, however, conclude that the existing policy on the all-red change interval should
be updated to include the use of the ITE formulas given certain speed limits and intersection
characteristics.
Research, case studies and a political document were also reviewed from the Texas Transportation
Institute, Virginia Tech, the City of Albuquerque, and the U.S. Congress Majority Leader’s office.
Office of the Majority Leader U.S. House of Representatives, The Red Light Running Crisis
Is it Intentional?, 2001
This document incorrectly indicates that intersection width is a factor in determining the yellow
change interval (page 4, Adlard & Murphy TV interview). The intersection width is used in
determining the all red clearance interval, but not the yellow change interval. This document also
indicates that since 1976 the updates/revisions to yellow change interval calculations and the
addition of all red clearance intervals were made to “specifically accommodate camera
enforcement.” This document appears to weave together a theory of a movement to conspire
between engineering standards and red light running photo enforcement.
Texas Transportation Institute, Effect of Yellow Interval Timing on Red-Light Violation
Frequency at Urban Intersections, 2003
The technical study performs a before and after study at 8 signalized intersections focusing on the
effect that adjusting the yellow change interval has on Red Light Running. Of the 8 study
locations, 4 have substandard yellow change intervals in the before scenario. The sample set is
contaminated with these 4 study locations which do not provide the appropriate yellow interval to
allow drivers to safely come to a stop, thus these drivers are “trapped” into running the red light
in the before scenario. With the contaminated sample set, the red light running was reduced from
113 in the before scenario to 58 in the after scenario (approximately 49%). This study cites
potential engineering countermeasures to reduce red light running, such as:
o Signal coordination
o Signal operation improvements
o Improve visibility of signal through use of backplates
o Improve signal conspicuity through LED indications (bulbs)
The City of St. Petersburg has previously implemented these countermeasures through the
Intersection Public Safety Program. Furthermore, this study recommends that increasing a yellow
interval that is shorter than standard engineering practices (the ITE formula) “will provide the
Yellow Change Interval and All Red Clearance Interval Review
Page - 21 May 2013
greatest return… Therefore, it is recommended that agencies consider timing the yellow interval
such that it at least equals the value obtained from [the ITE formula].” The City of St. Petersburg
confirmed that their yellow change intervals were consistent with standard practices (using the
posted speed limit as vehicular speed) at the 22 camera enforced intersection approaches prior to
the Stop on Red campaign.
Texas Transportation Institute, Development of Guidelines for Identifying and Treating
Locations with a Red-Light-Running Problem, 2004
The analysis shows graphs for crash frequency against the length of yellow change interval.
There is no data to confirm whether or not the study intersections have yellow change intervals
that meet the ITE formula based on speed or the slope of hill on the approach. This study and
provided data, figures, and charts are not directly applicable to the City of St. Petersburg due to
the unavailability of needed engineering data inputs. The Figures 2-4 and 2-6 tend to indicate
that the All Red Clearance Interval can be expected to have a more significant impact on the Red
Light Related Crash Frequency than the Yellow Change Interval.
o +1 sec. of yellow predicts a reduction of +/- 0.3 crashes/3 years
o +1 sec. of red predicts a reduction of +/- 0.8 crashes/3 years
Another chapter entitled “Area Wide Red Light Related Crash Frequency and Enforcement
Effectiveness” identifies the Camera Enforcement Effectiveness as:
o Reducing Red Light violations by 40 to 59 percent
o Reducing Red Light related crashes by 20 to 36 percent
o Reducing city wide crashes by 7 percent (Halo Effect, also experienced by the City of St.
Petersburg)
Virginia Tech Transportation Institute, A Novel Stochastic Procedure for Designing yellow
Intervals At Signalized Intersections, Year Unknown
The perception reaction time of the (real person) 85th percentile study participant (design driver)
was 0.92 seconds. The ITE formula assumes 1.0 second for the perception reaction time. The ITE
formula is conservative by using a slower perception reaction time. The median deceleration of
study participants (real persons) was:
o 11.6 ft/sec2 for drivers at 45 mph
o 12.5 ft/sec2 for drivers at 55 mph
The ITE formula assumes 10 ft/sec2 for the deceleration rate. The ITE formula is conservative
by using a less aggressive deceleration rate.
Yellow Change Interval and All Red Clearance Interval Review
Page - 22 May 2013
Further statistical evaluations were made with imaginary participants (not real persons), which
yielded a different result than the data from human participants of varying age and gender.
Although this evaluation of imaginary participants is interesting, the human participant data tends
to support the standard practices found in the ITE formula for the Yellow Change Interval and the
All Red Clearance Interval
City of Albuquerque, Yellow Light Timing Change and All-Red Clearance Interval Timing
Change Effectiveness Study Final Report, 2012
The study performs a simple before and after study at 18 signalized intersections with the yellow
change interval being adjusted. The study measures total intersection crashes before and after
yellow change intervals were increased. Of the 18 study locations, 2 have substandard yellow
change intervals in the before scenario. The sample set is contaminated with these 2 study
locations which do not provide the appropriate yellow interval to allow drivers to safely come to a
stop, thus these drivers are “trapped” into running the red light in the before scenario. With the
contaminated sample set, the total crashes were reduced from 443 in the before scenario to 407 in
the after scenario (a modest +/- 8% reduction). The study also performs a simple before and after
study at 2 signalized intersections with the all red clearance interval being adjusted. The study
measures total intersection crashes before and after all red clearance interval was increased. This
sample size of 2 intersection locations appears wholly inadequate to draw any conclusions (crash
rates increased). This study shows that at the 18 intersections with yellow time increased and the
2 intersections with all red increased, there was an increase of 9 angle injury crashes and a
reduction of 25 angle crashes with no injuries. This indicates the severity of the crashes increased
with the yellow and red time changes. For the 20 intersections with yellow or red time increased,
this study cites only a slight statistically significant difference in non-injury crashes between the
before and after scenario. No other crash types provided a statistically significant difference
between the before and after scenario.
Yellow Change Interval and All Red Clearance Interval Review
Page - 23 May 2013
Conclusions
The City of St. Petersburg continues to evaluate the “Stop on Red” campaign using crash analysis as one
metric of success, also using characteristics such as yellow change interval and all red clearance intervals
that are a part of the Intersection Public Safety program.
The specific evaluation of intersection yellow change intervals and the all red clearance intervals at the 10
intersections that comprise the “Stop on Red” campaign has been prepared with an analysis of the existing
intervals based on the legal driving speed, which is the Florida Department of Transportation (FDOT)
District 7 policy. This analysis follows the yellow change interval and all red clearance interval
calculation requirements defined by the FDOT within the Traffic Engineering Manual. An additional
review of the existing intervals was also conducted using the observed vehicular speed (85th percentile)
data collected at the specific intersection approaches.
The yellow signal indication warns vehicle traffic of an impending change in right-of-way. The duration
of this yellow change interval is based on the driver’s perception-reaction time and deceleration rate, the
approach posted speed limit, and the approach grade. The duration of the yellow interval should allow, at
a minimum, for a driver to comfortably decelerate to a stop prior to entering the intersection. A yellow
change interval is important for intersection safety by providing sufficient warning time for drivers to
safely stop at the intersection for the impending red indication. The enforcement of red light running,
whether by camera or by on-site patrol officers, depends on the yellow interval being appropriate to meet
safety goals thus reducing the opportunity for citations to be issued erroneously.
The yellow change intervals for the through movements currently meet the FDOT Traffic Engineering
Manual guidelines as well as the FDOT District 7 policy. It is recommended that the yellow change
intervals for the left turn movements be updated to meet the current FDOT District 7 policy, which
is calculated using the legal driving speed (posted speed limit) of the adjacent through movement.
The yellow clearance interval may not be sufficient to accommodate drivers who exceed the legal driving
speed; therefore it is recommended that the “Stop on Red” campaign be coordinated with law
enforcement agencies to enforce the legal driving speed (posted speed limit).
The all red clearance interval is a safety measure that is not associated with the “Stop on Red” campaign.
The all red clearance interval is intended to allow drivers to safely cross an intersection after entering the
intersection on a yellow indication. The all red clearance interval is designed to allow drivers who
entered the intersection on the yellow indication, to safely continue through the intersection before
conflicting traffic receives a green indication. It is recommended that the all red clearance intervals
for the through movements and the left turn movements be updated to meet the current FDOT
District 7 policy, which is calculated using the legal driving speed (posted speed limit).
Yellow Change Interval and All Red Clearance Interval Review
“Stop on Red” Campaign Page - 24 May 2013
Appendix