Yearbook 2003 - Assaereo
81
cargolux Yearbook 2003 Association of European Airlines
Transcript of Yearbook 2003 - Assaereo

cargolux
Yearbook 2003
Association of European Airlines

July 2003 Dear Reader of the AEA Yearbook, The AEA Yearbook has always been the benchmark for the European aviation industry. It is a source of information on current trends supported by facts, figures and careful analysis. This yearbook is no different. It seeks to outline and explain the impact on our industry of one of the toughest periods in the history of aviation. Against a background of global economic slowdown, the war with Iraq, and SARS, global airlines have suffered four consecutive years of losses and no growth. The continued crisis however, has been a catalyst for change and it has energised us to develop new solutions to meet the changing needs of our customers and the marketplace. AEA member airlines have dramatically reduced their overall cost of operations and many are re-evaluating core elements of their current business model, addressing structural inefficiencies, particularly in the short-haul sector. This Yearbook details the problems and the solutions we are seeking to implement to ensure European aviation is healthy and vibrant.
During my chairmanship of the AEA in 2003, we have undertaken a root and branch review to raise awareness of its role and effectiveness as an industry body. The web-site has been revamped and well received and our communications have greatly improved. Without doubt, this has been a very critical year for the industry as a result of external pressures - the continued threat of terrorist activity, the Iraq war and the weak global economy. However, it has also been an historic year. The European Commission has been granted the mandate to negotiate a new air treaty with the US. If it comes to fruition we will achieve true liberalisation and create a vibrant, competitive market which the AEA has long called for. I hope you enjoy reading this document and that it will provide the basis for a continued discussion about the future of European aviation.
Rod Eddington Chief Executive of British Airways AEA Chairman 2003
Avenue Louise 350 B - 1050 BrusselsTel. +32 (0)2 639 89 89 Fax 639 89 99 E-mail [email protected]
_________
Association of European Airlines
Adria Airways, Aer Lingus, Air France, Air Malta, Alitalia, Austrian Airlines, BMI, British Airways, Cargolux, Croatia Airlines, CSA, Cyprus Airways, Finnair, Iberia, Icelandair, JAT, KLM,LOT, Lufthansa, Luxair, Malev, Meridiana, Olympic Airways, SAS, SN Brussels Airlines,Spanair, SWISS, TAP Air Portugal, Tarom, Turkish Airlines, Virgin Atlantic Airways.

ASSOCIATION OF EUROPEAN AIRLINES I - 1
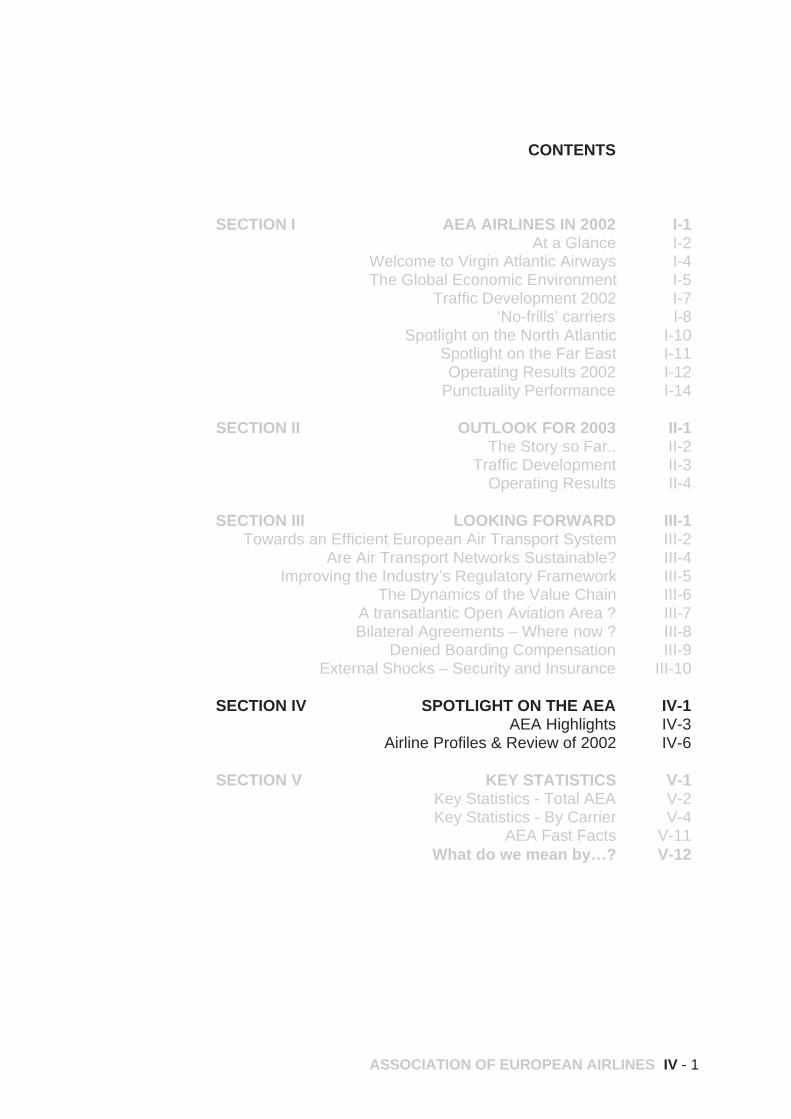
CONTENTS SECTION I AEA AIRLINES IN 2002 I-1 At a Glance I-2 Welcome to Virgin Atlantic Airways I-4 The Global Economic Environment I-5 Traffic Development 2002 I-7 ‘No-frills’ carriers l-8 Spotlight on the North Atlantic I-10 Spotlight on the Far East I-11 Operating Results 2002 I-12 Punctuality Performance I-14 SECTION II OUTLOOK FOR 2003 II-1 The Story so Far.. II-2 Traffic Development II-3 Operating Results II-4 SECTION III LOOKING FORWARD III-1 Towards an Efficient European Air Transport System III-2 Are Air Transport Networks Sustainable? III-4 Improving the Industry’s Regulatory Framework III-5 The Dynamics of the Value Chain III-6 A transatlantic Open Aviation Area ? III-7 Bilateral Agreements – Where now ? III-8 Denied Boarding Compensation III-9 External Shocks – Security and Insurance III-10 SECTION IV SPOTLIGHT ON THE AEA IV-1 AEA Highlights IV-3 Airline Profiles & Review of 2002 IV-6 SECTION V KEY STATISTICS V-1 Key Statistics - Total AEA V-2 Key Statistics - By Carrier V-4 AEA Fast Facts V-11 What do we mean by…? V-12

-3.0
-2.5
-2.0
-1.5
-1.0
-0.5
0.0
0.5
1.0
1.5
2.0
2.5
3.0 billion current US$ after interest
02010099989796959493929190
US$ -3.02 bn (€ -3.2 bn)
US$ -0.87 bn(€ -0.94 bn)
OPERATING PROFIT / LOSS TOTAL SCHEDULED ROUTES
Source: AEA
AEA_YB_03_01
-0.87 billion US$Total Financial Loss (-0.94 € bn)
-2.4 bn US$ Revenue lessTotal Scheduled Revenue all services (-2.5 € bn)
-13.8 million fewer PassengersTotal Scheduled Passenger numbers
-4.8% Passenger Traffic lossTotal Scheduled Passenger Kms
-8.7% reduction in CapacityTotal Scheduled Seat Kms on offer
2002 over 2001
AT A GLANCE
I – 2 ASSOCIATION OF EUROPEAN AIRLINES

Markets which should have beenrecovering from their prolongedweakness were belaeguered once againin early 2003 , first by the Iraq War, thenby the wholly disproportionate effect ofthe SARS outbreak.
A graphic reminder of the shockwavesent through the market by the events ofSeptember 11.
-35
-30
-25
-20
-15
-10
-5
0
5
10
15
20
25
30% change in RPKs
MAY-03JUN-02JUN-01
MONTHLY TRAFFIC MONITOR
Source: AEA
AEA_YB_03_03
September 11th
Geographical Europe
North Atlantic
Far East / Australasia
Geographical Europe
North Atlantic
Far East / Australasia
Geographical Europe
North Atlantic
Far East / Australasia
Middle East
Gulf War II(20-Mar/14-Apr)
-60
-50
-40
-30
-20
-10
0
10% change in RPKs
W50W45W40W37
SEP-DEC 2001
Source: AEA
AEA_YB_03_04
-60
-50
-40
-30
-20
-10
0
10
20% change in RPKs
W25W20W15W12
MAR-JUL 2003
Source: AEA
AEA_YB_03_02
ASSOCIATION OF EUROPEAN AIRLINES I – 3

WELCOME TO VIRGIN ATLANTIC AIRWAYS
I – 4 ASSOCIATION OF EUROPEAN AIRLINES
AEA gained its newest member on July1st 2003, with Virgin Atlantic Airwaysformally joining the Association.
Virgin’s membership application wasunanimously approved by the AEA Presidents’Assembly held in Brussels in May.
Virgin Atlantic began operations in 1984with a single aircraft on a single route(Gatwick-Newark). From the outset, ithas been seen as a pacesetter, with astrong public image combining both valueand service elements – in the words offounder Sir Richard Branson, “a brandname that is known internationally forinnovation, quality and a sense of fun”.On early flights, performers were offeredfree passage if they would entertain theirfellow-passengers en route.
From these modest beginnings, VirginAtlantic has grown into a major globalplayer. Its exclusively long-haul networklinks London (Heathrow and Gatwick)and Manchester with nine USdestinations, five in the Caribbean, four inWest and South Africa and four in Asia.
In 2002 passenger-kilometre terms, the airlineranked seventh among AEA airlines overall,fifth in long-haul and fourth across the NorthAtlantic. The passenger count for the yearexceeded 3.8 million.
The fleet, amongst the youngest in theindustry, consists of twelve Boeing 747sand 14 Airbus A340s. These latterinclude four dash-600 models – thelongest civil aircraft in existence – forwhich Virgin was the launch customer.
In December 1999, Singapore Airlinesacquired a 49% stake in Virgin Atlantic.The two airlines cooperate on theLondon-Singapore route and offerreciprocal frequent-flyer and loungebenefits. Virgin also has commercialagreements with other airlines, includingContinental, Malaysian and bmi.
Virgin Atlantic is part of the highly diversifiedVirgin Holdings group (retailing, publishing,financial services, telecommunications…).The group also includes low-fare airlinebrands in Europe (Virgin Express) andAustralia (Virgin Blue).

THE GLOBAL ECONOMIC ENVIRONMENT
ASSOCIATION OF EUROPEAN AIRLINES I – 5
While 9/11, the Iraq War and SARS havedominated the airline-related headlines since2001, it should not be overlooked that duringthis time the industry has been strugglingthrough a serious economic downturn – adownturn, indeed, not unconnected withthese events.
The global economic slowdown of 2001-3has been the most severe since the USeconomy slumped in 1991, followed byEurope two years later. This timearound, US and European economieshave weakened more or lesssimultaneously.
The slump in the US economy, from aGDP growth of close to 4% in 2000 tojust above zero in 2001, was followed in2002 by a partial recovery to 2.5%.
In Europe, the drop in 2001 was less severe,but worsened again in 2002 and is projectedto mount only the weakest of recoveries in2003. The three-year compound growth inthe EU economy from 2000 to 2003, isexpected to total 3.9% – equivalent to oneyear of strong increase.
The European airlines’ second-largestoverseas market, Japan, has under-performed both the EU and the US withclose-to-zero growth in both 2001 and2002. Japan has in fact suffered anextended period of depression, havingposted only two GDP increases in excessof 2% (and one decrease) in elevenyears.
Sustained powerful increases in theChinese economy, pushing thepassenger market into a position where itchallenges Japan in importance for AEAairlines, have come to an abrupt end in2003 with the devastating impact ofSARS.
Within the EU, the largest nationaleconomy, Germany, has also been themost depressed, with GDP growth of only0.2% in 2002 and a projected 0.4% in2003. Fourth-place Italy and sixth-placeNetherlands have been scarcely anystronger.
-2
-1
0
1
2
3
4
5
6
7% growth in real GDP
04E03E200220001998199619941992199019881986
Japan
USA
EU
REAL GDP GROWTH RATES
Source: OECD Economic Outlook n.73
AEA_YB_03_05
Germany
United Kingdom
France
Italy
Spain
Netherlands
Belgium
Sweden
Austria
Denmark
Finland
Portugal
Ireland
Greece
Luxembourg
2108
1661
1521
1258
694
444
261
256
217
183
140
129
115
99
19
EU15
0.2
1.8
1.2
0.4
2.0
0.3
0.7
1.9
1.0
1.6
1.6
0.5
6.0
4.0
0.4
1.0
0.4
2.2
1.1
1.0
2.0
0.5
1.2
1.4
1.2
1.5
2.2
0.5
3.3
3.6
1.1
1.2
Size of Economy2002 GDP levels
€ bn
GDP growth rate1995 prices
2002 2003
Source: EUROSTAT
AEA_YB_03_06

I – 6 ASSOCIATION OF EUROPEAN AIRLINES
The other major European economies – UK,France and Spain – are experiencing 2002/3growth at or above the EU average, but stillwell below levels commensurate with ahealthy momentum.
A number of specific macro-economicfactors have impacted the marketsituation. The stock-market slump whichbegan in 2000 has affected consumerwealth and confidence – more so than inthe past, since many more individuals areaffected, if not directly, then indirectlythrough their involvement in pensionfunds.
The USA in 2002 experienced the virtuallyunheard-of phenomenon of tumbling stockprices during an economic recovery, possiblymitigating the beneficial effect on traveldemand of an improving economy.
Government monetary policy to counteractthe weak economy has included historicallylow interest rates, to boost householdspending and encourage businessinvestment.
Nevertheless, investment in business inOECD countries decreased by 4.25% in2002, on top of a -2.25% in 2001 – amuch larger decline than in recentrecessions. As well as the falling shareprices, other factors have included afocus on reducing debt burden andgenerating cash and – not insignificantly– avoiding the legal and reputation riskstriggered by a series of well-publicisedcorporate governance scandals.
Full recovery for the OECD economies isforeseen to begin around the end of 2003or early 2004. However, this scenario isdependent on a pick-up in investment, forwhich the situation of depressedbusiness confidence in early 2003 wasnot an encouraging pointer.
Finally, the recovery in Europe could behampered by the appreciation of theEuro, which began in the last quarter of2002, slowing down the growth ofEuropean exports and reducing the valueof profits earned abroad – as well,evidently, as making Europe a moreexpensive destination for US and othertravellers.
50
100
150
200
250
300
350 index (1995 = 100)
200220012000199919981997199619951994
EURO area
USA
SHARE PRICE INDEX
Source: OECD Main Economic Indicators - Dow Jones EURO STOXX Broad, NYSEAEA_YB_03_07
-3.0-2.5-2.0-1.5-1.0-0.50.00.51.01.52.02.53.0 index of confidence
200220001998199619941992199019881986
EURO area
USA
BUSINESS EXPECTATIONS
Source: OECD Main Economic Indicators - normalised series in units of standard deviationAEA_YB_03_09
0
2
4
6
8
10
12
14
16
18% interest rate
2000199519901985198019751970196519601955
US FEDERAL FUND RATE
Source: Federal ReserveAEA_YB_03_08

TRAFFIC DEVELOPMENT 2002
ASSOCIATION OF EUROPEAN AIRLINES I – 7
Total scheduled traffic on AEA carriersdeclined by 4.8% in 2002. For the firsteight months of the year, comparisonwas with the pre-9/11 situation and thedecrease was 10%, with no significantevidence of a diminution of the traffic lossfrom one month to the next.
In the last three months of the year,traffic increased 12%, which representeda recapture of only about 45% of the losttraffic in the previous year. By the end ofthe year ‘real’ traffic losses (measuredagainst a year 2000 baseline) werebeginning to diminish.
Making up the total picture weresubstantial regional variations, althoughall route groups reported minuses in Jan-Aug and plusses in Oct-Dec.
On the North Atlantic, hardest-hit after 9/11,Jan-Aug traffic was down 18.2%. Growth inthe final quarter was 21.1% but the total forthe year was 8.7% lower than in 2001.
Within Europe, the corresponding figureswere: before September -9.6%, afterSeptember +7.9%, overall -3.7%.
Of the main traffic flows, Europe-Far Eastsuffered the least: before -5.0%, after+15.8%, overall -1.0%. The traffic growth in
the final quarter represented a better than fullrecovery of the previous year’s lost traffic.
Among the lower-volume markets for theAEA carriers, two figures stood out:Europe-Sub Saharan Africa was the onlyroute group to record a plus for the year,at +2.6%. The South Atlantic result ofminus 13.0% probably owed more to theeconomic crisis in Argentina than to post-9/11 effects.
A positive aspect in 2002 was that, in overallterms, the airlines succeeded in tailoringcapacity to the much-weakened demand andload factors did not suffer; in fact they weregenerally higher than in 2001.
Total Scheduled seat-km for the year werereduced by 8.7%, resulting in a three-pointimprovement in load factor, to 73.6%, whichwas actually the highest on record.
North Atlantic capacity was down 15.2% forthe year, with a reduction in the Summerschedule of about 21%. Consequently, loadfactors were high, reaching 80.0% for theyear and surpassing the previous high pointof 78.4% in 1997.
In Europe, capacity was reduced by7.1%, and the load factor of 64.7%equalled the previous highest.
-20% RPK growth -15 -10 -5 0 5 10
-20
-15
-10
-5
0
5
10% ASK growth
2002 RPK VS ASK % GROWTH BY REGION
Source: AEA
AEA_YB_03_10
South Atlantic North Atlantic
Eur-North Africa
Eur-Middle East
Total Europe
Mid Atlantic
Eur- Far East & Australasia
Eur-Sub Saharan Africa
Load Factor improved
Load Factor deteriorated
‘NO-FRILLS’ CARRIERS
I – 8 ASSOCIATION OF EUROPEAN AIRLINES
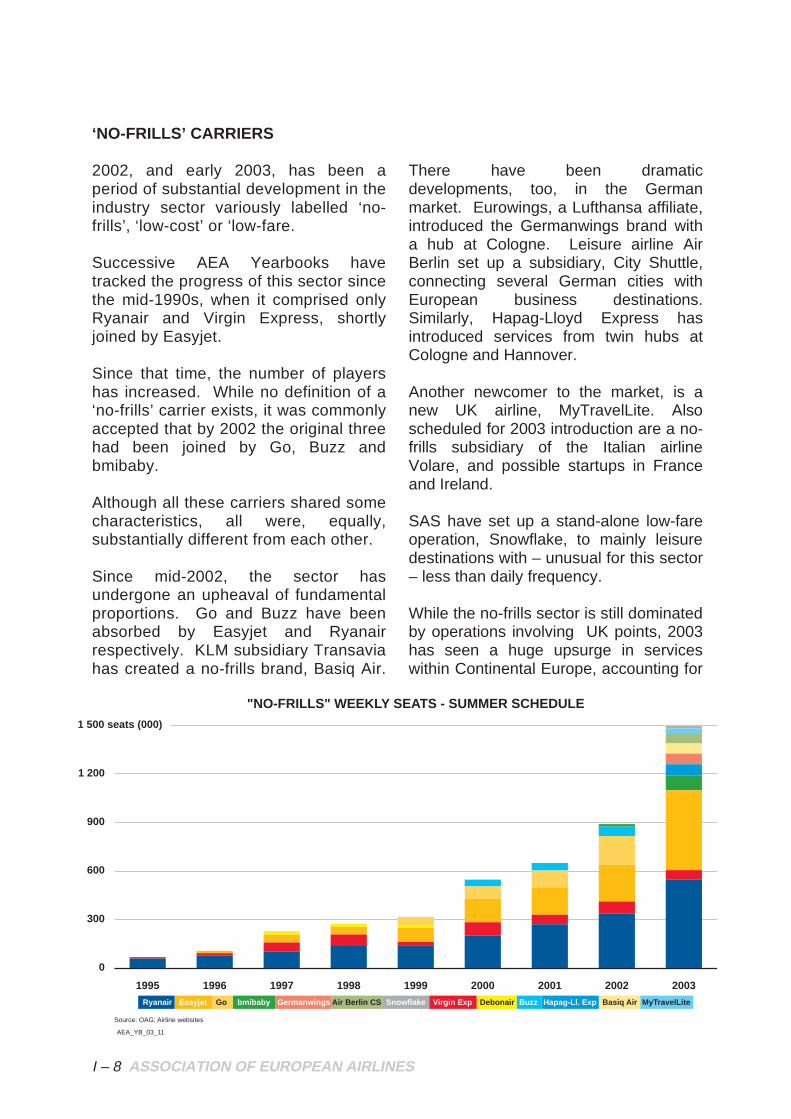
2002, and early 2003, has been aperiod of substantial development in theindustry sector variously labelled ‘no-frills’, ‘low-cost’ or ‘low-fare.
Successive AEA Yearbooks havetracked the progress of this sector sincethe mid-1990s, when it comprised onlyRyanair and Virgin Express, shortlyjoined by Easyjet.
Since that time, the number of playershas increased. While no definition of a‘no-frills’ carrier exists, it was commonlyaccepted that by 2002 the original threehad been joined by Go, Buzz andbmibaby.
Although all these carriers shared somecharacteristics, all were, equally,substantially different from each other.
Since mid-2002, the sector hasundergone an upheaval of fundamentalproportions. Go and Buzz have beenabsorbed by Easyjet and Ryanairrespectively. KLM subsidiary Transaviahas created a no-frills brand, Basiq Air.
There have been dramaticdevelopments, too, in the Germanmarket. Eurowings, a Lufthansa affiliate,introduced the Germanwings brand witha hub at Cologne. Leisure airline AirBerlin set up a subsidiary, City Shuttle,connecting several German cities withEuropean business destinations.Similarly, Hapag-Lloyd Express hasintroduced services from twin hubs atCologne and Hannover.
Another newcomer to the market, is anew UK airline, MyTravelLite. Alsoscheduled for 2003 introduction are a no-frills subsidiary of the Italian airlineVolare, and possible startups in Franceand Ireland.
SAS have set up a stand-alone low-fareoperation, Snowflake, to mainly leisuredestinations with – unusual for this sector– less than daily frequency.
While the no-frills sector is still dominatedby operations involving UK points, 2003has seen a huge upsurge in serviceswithin Continental Europe, accounting for
0
300
600
900
1 200
1 500 seats (000)
Snowflake MyTravelLiteAir Berlin CS Basiq AirGermanwings Hapag-Ll. Expbmibaby BuzzGo DebonairEasyjet Virgin ExpRyanair
200320022001200019991998199719961995
"NO-FRILLS" WEEKLY SEATS - SUMMER SCHEDULE
Source: OAG; Airline websites
AEA_YB_03_11

ASSOCIATION OF EUROPEAN AIRLINES I – 9
28.7% of seats offered, compared with13.6% in 2002.
The German market climbed fromseventh to second in importance, with amore than five-fold increase in capacity.The number of seats on offer more thandoubled in the Italian and Netherlandsmarkets.
As regards airports, the two Londonsatellites of Stansted and Luton aredominant with, between them, more than20% of capacity in this sector. Both arehubs for major players, but alsodestination airports for many of the newMainland Europe start-up carriers.
Cologne, with two resident carriers, hasthe next largest share. Subsequentairports ranked by no-frills capacity aregenerally major hubs or larger regionalairports. Of the remote airports whichare supposed to typify this sector,Frankfurt-Hahn, Milan-Bergamo andBrussels-Charleroi (all Ryanair mini-hubs) would rank 12th, 14th and 17th
respectively.
Among airports without a no-frillsresident, the leisure destinations of Nice(served by 7 carriers), Malaga (6) andAlicante (5) are prominent.
within Continental Europe
British Isles-Continental Europe
within British Isles
2003 2002
28.7%
48.2%
23.1%
"NO-FRILLS" WEEKLY SEATS - SUMMER SCHEDULE
13.6%
53.8%
32.6%
Source: OAG; Airline websites
AEA_YB_03_13
Source: OAG; Airline websites
AEA_YB_03_12
London-Stansted 482 AB HV U2 4U FR
London-Luton 134 U2 X3 FR
Cologne 118 4U X3
Dublin 112 WW FR SK
Amsterdam 112 HV WW U2 VZ TV
Belfast 79 WW U2 VZ
London-Gatwick 77 U2 FR
East Midlands 76 WW U2,
Edinburgh 70 WW U2 4U FR
Nice 70 HV WW U2 X3 SK TV
Liverpool 65 U2 FR
Frankfurt-Hahn 64 FR
Barcelona 64 AB HV WW U2 4U VZ SK TV
Milan-Bergamo 61 AB HV WW X3 FR
Brussels 59 WW TV
Malaga 57 HV WW U2 VZ SK TV
Brussels-Charleroi 48 FR
Glasgow 47 WW U2
Alicante 45 HV WW U2 VZ SK
Rome-Ciampino 44 AB U2 X3 FR
TOP 20 AIRPORTS SERVICED BY THE "NO-FRILLS"WEEKLY SEATS (000)
4U - Germanwings, AB - Air Berlin, FR - Ryanair HV- Basiq Air,SK - Snowflake, TV - Virgin Express, U2 - easyJet, VZ - MyTravelLiteX3 - Hapag-Lloyd Express, WW- bmibaby

SPOTLIGHT ON THE NORTH ATLANTIC
I – 10 ASSOCIATION OF EUROPEAN AIRLINES
In 2000, the North Atlantic marketgenerated for AEA carriers 29.3% of totalpassenger-km and US$ 11.3 billion inrevenue. By 2002 these figures hadfallen to 27.8% and $9.1bn respectively.
Throughout the 1990s, the market wasexhibiting very high growth rates. In theeight years 1993-2000, the average year-on-year increase for AEA carriers was8.5%. In the last three years of thisperiod, it was even higher, at 9.4%.
In this context, the dramatic downturn inthe North Atlantic market for AEA carriersis all the more remarkable. 2002 totalpassenger traffic was at about the samelevel as in the 12 months to September1998 – in other words, four and a quarteryears of market growth had been lost.
Since the beginning of 2003, the markethas again been fluctuating strongly. InJanuary, double-digit growth wasrecorded, in effect recovering about halfthe previous year’s lost traffic, butthereafter conditions weakened greatly inthe countdown to the Iraq conflict.
A traffic loss was posted in nine of thetwelve weeks from mid-March. Thisperiod of depression was undoubtedlyextended by SARS concerns, bothspecifically related to Canadian traveland a more general disinclination to fly.
The accompanying graph shows trendsin the Europe/US market before and afterSeptember 2001. Clearly evident is thedecrease in the market prior to 9/11.
Immediately after 9/11 high-yield trafficposted the largest decreases, althoughultimately it was economy-class travelwhich suffered the greatest decline. Itwas very evident, however, that the nextmarket shock, in the shape of the 2003
Iraq War, had its immediate impact againon the high-yield traffic.
AEA airlines moved decisively to adjustNorth Atlantic capacity to the new marketconditions in 2002. In each of the twelvemonths, load factor improved andreached a record 80.0% for the year.
In the 2002 Summer schedule, AEAcarriers reduced their Europe-USoperations by 19.3%, from 1289 to 1040weekly roundtrips – the equivalent of 35fewer flights per day in each direction.
In 2002, twenty-one AEA and five otherEuropean airlines contested theEurope/US market with six US carriers.
In sharp contrast to the Europeans, theUS carriers made much smaller capacitycutbacks in 2002. In the peak Summerschedule, their weekly seats were downonly 6.4% and weekly flights -7.8%,compared with around 20% for theEuropean airlines.
Consequently, the US carriers’ share ofthe market increased from 41.8% to46.1% in seats offered and – given theirsmaller average aircraft size – from46.3% to 49.9% in number of flights.
65
70
75
80
85
90
95
100
105
110 index of annualised passenger numbers
200220012000
NORTH ATLANTIC TRAFFIC DEVELOPMENT
Source: AEA
AEA_YB_03_14
Aug 2001
First and Business Class
Economy Class

SPOTLIGHT ON THE FAR EAST
ASSOCIATION OF EUROPEAN AIRLINES I – 11
AEA members’ traffic on Far Eastern routesfell by 17% in the immediate aftermath ofSeptember 11, recovered to about -7% bythe end of 2001 and averaged about -5%through the Summer of 2002.
In the final quarter of 2002, traffic hadalmost returned to 2000 levels, with twoyears of growth lost.
As with other regions, the recovery in FarEastern traffic faltered in early 2003 inanticipation of the Iraq War. From thebeginning of February the market growthevaporated. At the outbreak of war, in lateMarch, the traffic decrease reached 11-12%.
Such figures were, however, totallyovershadowed by the subsequentupheaval in the market caused by theSARS outbreak – impacting not onlyaffected areas as travel destinations, butalso creating uneasiness about in-flighthealth issues.
The issue was fuelled by over-reactionon the part of the World Healthorganisation, compounded by mediahype (‘SARS Sweeps Asia’).
While the incidence of the disease wasconcentrated in four main areas – China,Hong Kong, Singapore and Vietnam,market effects were felt over a muchbroader range of destinations.
For eight straight weeks from mid-April toearly June 2003, AEA carriers’ traffic onFar East/Australia routes recordeddecreases in the range 26-31%. Losses
of this magnitude had been measured onlyonce before in any of the AEA’s majormarkets, when very similar figures wereposted on the North Atlantic inOctober/November 2001.
The phenomenon impacted markets whichhad previously been among the strongestperformers within the AEA members’networks. In particular, China – includingHong Kong – would probably in 2003 haveovertaken Canada and Japan as theAEA’s largest longhaul market after theUSA.
Indicative of the size and importance ofthe China market, AEA member airlineshad scheduled an average of 20 directflights daily in Summer 2003, a 50%increase in just four years.
Many of these flights – and those to otheraffected destinations in the region – weresuspended as the severity of the marketreaction became apparent. However,substantial traffic losses had alreadyoccurred before significant capacity cutscould be realised.
In the early stages of the outbreak, loadfactor on all Eastern routes plummettedto just above 60%, and two months intothe crisis had recovered only to about70%, compared to near-80% levels whichwould normally have been anticipated.-80% passenger movements
-70
-60
-50
-40
-30
-20
-10
0
TRAFFIC LOSSES AT SELECTEDASIAN AIRPORTS (APR-03/APR-02)
Source: ACI/Centre for Asia Pacific Aviation
AEA_YB_03_15
HONG
KONG
TAIPEI
JAKARTA
SINGAPORE
SEOUL
BANGKOK
BEIJING
TOKYO

OPERATING RESULTS 2002
Note:Data in this section are aggregated frommembers’ financial year results and maydiffer slightly from the calendar yearfigures elsewhere in the document. Loadfactors refer to passenger and freightcapacity utilisation. Figures refer to totalscheduled services, including Domestic.
AEA airlines suffered their fourthsuccessive annual loss in 2002. Figurespoint to an operating loss, after interest,of US$870 million, following the worst-ever $3.02 billion deficit in 2001.
This represented an improvement inoperating ratio (revenue:expenditure)from 95.4 to 98.6
As might be expected, most AEAmember airlines improved their operatingratio from 2001 to 2002.
The main source of improvement wasamong the mid-size carriers; the group ofsmaller airlines provided the onlyexamples of worsening results, while thelarger carriers in general experiencedless variability.
The main contributor to the operatingratio improvement was the increase inload factor, by 3.6 percentage points to68.5%.
A yield increase (in current US$) of 6.9%was matched by a similar increase in unitcosts, giving a more or less neutralcost/revenue development effect.
The net interest burden, which added2.5% to operating expenses, was higherthan in 2001 and made a small negativecontribution to the change between thetwo years.
70
80 90 100 110 12070
80
90
100
110
120 Operating Ratio*
70
80 90 100 110 12070
80
90
100
110
120
TOTAL SCHEDULED OPERATING RATIOS* BY CARRIER
Source: AEA
AEA_YB_03_17
7 large
9 medium
12 small
2 0 0 1
2002
Operating Ratio deteriorated
Operating Ratio improved
(*) after interest
Operating Ratio after interest
2001 2002
95.4 98.6
Points change in OR as a result of:
Change in Load Factor +3.6
+0.1
-0.3
+3.2
Cost vs Revenue Development
Change in net interest
Total Change
Source: AEA
AEA_YB_03_16
I – 12 ASSOCIATION OF EUROPEAN AIRLINES

Following a very difficult 2001, quarterlyresults for 2002 returned to a ‘normal’profile with profitable operations duringthe two Summer quarters offset by lossesat the beginning and end of the year.
Comparing 2002 with 2000 in the graphbelow, any benefits realised by the relativelymodest losses in the first quarter – whichrepresented a substantial turnaroundfollowing the catastrophic impact of 9/11 –were lost in a poor fourth quarter.
The load factor required to break even –which is in fact the simple relationshipbetween yields and unit costs – was69.4% in 2002, a level which has beenvirtually unchanged for three years. Allthree of these annual figures have beenabove the highest ever AEA annual loadfactor – 69.2%, achieved in 1997 andagain in 2000.
This highlights an essential structuraldilemma in the industry. It is almostinconceivable that further load factorimprovements can be squeezed out –certainly not sufficient to surpass breakevensof around 70% by an adequate margin.
Therefore, the breakevens themselvesmust be brought down. This can be donein one of only two ways – increase yields,or reduce costs. The yield solution wouldinvolve reversing the steady downwardtrend which is a characteristic of themodern-day industry.
Reducing costs is, of course, a priority inthe industry and had been so for manyyears. And so the dilemma becomesmore acute, since a cost saved alreadycan not be saved a second time.
85
90
95
100
105
110 operating ratio
Q4Q3Q2Q1Q4Q3Q2Q1Q4Q3Q2Q1
OPERATING RATIO AFTER INTEREST
2000 2001 2002Source: AEA
AEA_YB_03_19
60
62
64
66
68
70% load factor
200119991997199519931991
TOTAL SCHEDULED OVERALL VS BREAK-EVEN L/F
Source: AEA
AEA_YB_03_18
Break even load factor (after interest)
Overall load factor
ASSOCIATION OF EUROPEAN AIRLINES I – 13

PUNCTUALITY PERFORMANCE
I – 14 ASSOCIATION OF EUROPEAN AIRLINES
2002 saw a reduction in delay rate for AEAmembers. Within Europe, 19.9% ofdepartures were delayed more than 15minutes, down from 24.2% in 2001. The2002 figure was the lowest for five years, butstill very far from the levels around 13% whichprevailed as recently as 1993-94.
A major contributory factor was thereduction in flights in 2002. By the end ofthe year, however, a slight growth intraffic had been resumed, accompaniedby a deterioration in the delay trend.
Eurocontrol’s own figures bear out the AEA’sexperience. For ten months of the year, ‘slot’delay imposed by their Central FlowManagement Unit was down on 2001, butincreased in the last two months of the year,coincidental with a resumption of growth in thenumber of flights through European airspace.
The system is still close to saturationdespite the ‘breathing space’ created bythe drop in airspace utilisation.
Another ‘breathing space’ was achievedearly in 2002 by the introduction ofReduced Vertical Separation Minima inEuropean upper airspace. From 29,000
feet upwards, new flight levels werecreated at 1,000-feet intervals, replacingthe former 2,000-feet spacing.
The change was made possible by muchgreater accuracy in onboard altitude-measuring equipment and substantiallyincreased the capacity of upper airspace.
The Eurocontrol delay figures attribute asubstantial proportion of the slot delay toproblems with the UK system. Normally, nosingle part of Europe’s fragmented systemwill contribute more than 20% of total annualdelay. In 2002, the UK was responsible for36.5% of the total – up from 13.9% in 2001.
Next, in order, were France (13.0%),Germany (9.4%) and Italy andSwitzerland (both 8.4%).
AEA measures departure delay at airports,although the airports themselves are notnecessarily the source of the delay. In 2002,the most frequent delays to AEA airlines wereexperienced at Madrid, with just over 30% ofmembers’ flights more than 15 minutes late.Other airports with delays substantially abovethe average included Dublin, Rome, LondonGatwick and Paris CDG.
500
550
600
650
700
750
800 flights (000) - CFMU
20022001200019991998
EUROPEAN FLIGHT & PUNCTUALITY TRENDS
Source: AEA; EUROCONTROL/CODA
AEA_YB_03_20
10
15
20
25
30
35
40% flights delayed > 15 minutes (AEA)
Restructuring of airspaceover France and Switzerland
Introduction ofRVSMKosovo crisis September 11th Gulf War II
Total flights (CFMU)%flights delayed > 15 mins

ASSOCIATION OF EUROPEAN AIRLINES II - 1
CONTENTS
SECTION I AEA AIRLINES IN 2002 I-1
At a Glance I-2Welcome to Virgin Atlantic Airways I-4 The Global Economic Environment I-5
Traffic Development 2002 I-7 ‘No-frills’ carriers l-8
Spotlight on the North Atlantic I-10 Spotlight on the Far East I-11 Operating Results 2002 I-12
Punctuality Performance I-14
SECTION II OUTLOOK FOR 2003 II-1 The Story so Far.. II-2 Traffic Development II-3
Operating Results II-4
SECTION III LOOKING FORWARD III-1 Towards an Efficient European Air Transport System III-2
Are Air Transport Networks Sustainable? III-4 Improving the Industry’s Regulatory Framework III-5
The Dynamics of the Value Chain III-6 A transatlantic Open Aviation Area ? III-7 Bilateral Agreements – Where now ? III-8
Denied Boarding Compensation III-9 External Shocks – Security and Insurance III-10
SECTION IV SPOTLIGHT ON THE AEA IV-1
AEA Highlights IV-3 Airline Profiles & Review of 2002 IV-6
SECTION V KEY STATISTICS V-1 Key Statistics - Total AEA V-2 Key Statistics - By Carrier V-4
AEA Fast Facts V-11 What do we mean by…? V-12

II – 2 ASSOCIATION OF EUROPEAN AIRLINES
THE STORY SO FAR…
The Iraq War effect in weeks 11-13 hadscarcely begun to moderate before themarket was hit by another huge shock asSARS caused the market to plummet tominus 30% - a level at which it wasanchored for eight weeks.
Traffic between Europe and the MiddleEast, weakening since the start of theyear in anticipation of the start of the IraqWar, collapsed to less than half 2002levels before recovering to about minus10% shortly after direct hostilities ceased.
-60% change in RPKs
-50
-40
-30
-20
-10
0
W20W18W16W14W12W10
2003 WEEKLY TRAFFIC EUROPE-MIDDLE EAST
Source: AEA
AEA_YB_03_21
Beginning of Gulf War II20-Mar-03
End of "hostilities"14-Apr-03
-35
-30
-25
-20
-15
-10
-5
0
5
10% change in RPKs
W25W20W15W10W05
2003 WEEKLY TRAFFICEUROPE-FAR EAST AUSTRALASIA
Source: AEA
AEA_YB_03_22
SARS virus first recognisedend Feb-03
"Disease contained"05-Jul-03
-1.1 to -2.4 bn US$ Financial Result*Total Scheduled (-1.0 to -2.1 € bn)
+2% growth in Passenger Traffic*Total Scheduled RPKs
(*) estimates for 2003

TRAFFIC DEVELOPMENT 2003
ASSOCIATION OF EUROPEAN AIRLINES II – 3
The year 2003 began with traffic growthin all major AEA markets – as might havebeen anticipated, given the severelydepressed situation at the beginning of2002, just 16 weeks after the attacks ofSeptember 11.
Regions most hard-hit after 9/11 – theNorth Atlantic and the Middle East –were,evidently those in which nominal growthwas strongest, both posting double-digitincreases in January 2003.
The situation was not to last long. By theend of January the markets hadweakened and by mid-February intra-Europe, the Middle East and the Far Eastwere again in decline.
The most obvious cause of this instabilitywas the well-signposted preparation forthe Iraq conflict. Even before hostilitiescommenced on 20th March, all the AEA’smajor markets had gone into reverse withthe Middle East recording decreases inexcess of 20%.
The immediate impact of the war was tocause traffic decreases of about 50% onMiddle Eastern routes, about 10% inEurope and to the Far East, and about5% on the North Atlantic – all of thesefigures, of course, applying to underlyingtrends which themselves were distortedby post-9/11 effects.
The duration of the war-related effect isdifficult, if not impossible, to determine,since another and potentially moredamaging phenomenon intervened –SARS – with consequences for the FarEastern market becoming visible in thethird week of the War.
By the beginning of June, the MiddleEastern market had returned to growth,eliminating the last indication of Iraq War
effect, eleven weeks on from thecommencement of hostilities. There was,however, no sign of a diminution of theSARS effect on Far Eastern routes,which had resulted in an eight-weeksequence of traffic losses in the range27-30%.
For the remainder of 2003 the marketsare expected to return to growth,although in the case of Far Easternroutes this may not materialise until thefourth quarter.
Strongest increases are expected on theNorth Atlantic, although evidently this is afunction of the depth of the 2002 lossesrather than any inherent buoyancy in themarket.
For the year as a whole, an overall trafficincrease of just under 2% is foreseen.Had it not been for the Gulf War andSARS effect, the increase would havebeen in the order of 7% – in other words,these events cost the industry almostthree-quarters of its projected growth thisyear.
450
500
550
600
650
700
750 billion RPKs (12 month moving total)
2004200320022001200019991998
AEA TOTAL SCHEDULED RPKs
Source: AEA
AEA_YB_03_23
NO September 11th
NO Gulf War II/SARS
Actual + Outlook

OPERATING RESULTS – OUTLOOK FOR 2003
The AEA airlines’ market environment in2003 has confounded any earlierpredictions made in the context of a post9/11 recovery phase.
Given the ongoing traffic losses of 2002, theoperating result of -$870m, was no worsethan might have been anticipated. With trafficpicking up at the end of the year and loadfactors still high, a reasonable recovery wasin prospect for 2003.
While certain cost items – notably securityand insurance – had spiralled upwards, fuelwas relatively cheap. Crisis-related cost-cutting programmes were also widely inplace. Question-marks remained, however,over the recovery in premium traffic andthe effect on yields of substantially increasedno-frills competition in Europe.
While AEA has made no projectionsbased on this scenario, it mightreasonably be assumed that a positiveresult for 2003 in the region of $1bnmight have been foreseen.
By the start of 2003, however, the industrywas already making projections for the yearbased on the impact of the anticipatedsecond Iraq War, including substantial traffic
losses, fuel price increases, and possiblefurther impacts in security and insurance.
While the war impacts contained nomajor surprises for the airlines, they weretotally unprepared for the subsequentdevastating effect on their traffic –particularly in the vital Far Easternmarket – of the SARS phenomenon.
While a small traffic increase for the yearis anticipated – much lower than whatshould have been achieved in a recoveryyear, it will almost certainly fall below thelevel of capacity increase, leading to adrop in load factor.
The indications are that 2003 yields will bedepressed, in the range 4.5% - 7%. This willprobably be mitigated by a correspondingdrop in unit costs as ongoing cost-cuttingprogrammes contribute their effect.
As for the outcome, a range ofpossibilities is foreseen, with the mostfavourable already slightly worse than the2002 outcome at minus $1.1bn, and thisloss more than doubled in the worst-casescenario. For the AEA airlines as awhole, a fifth consecutive year of lossesis in prospect.
-3.0
-2.5
-2.0
-1.5
-1.0
-0.5
0.0
0.5
1.0
1.5
2.0
2.5 billion current US$ after interest
03E02010099989796959493929190
OPERATING PROFIT / LOSS TOTAL SCHEDULED ROUTES
-1.1 billion US$
-2.4 billion US$
possible outcome
Source: AEA
AEA_YB_03_24
II – 4 ASSOCIATION OF EUROPEAN AIRLINES

ASSOCIATION OF EUROPEAN AIRLINES III - 1
CONTENTS
SECTION I AEA AIRLINES IN 2002 I-1
At a Glance I-2Welcome to Virgin Atlantic Airways I-4 The Global Economic Environment I-5
Traffic Development 2002 I-7 ‘No-frills’ carriers l-8
Spotlight on the North Atlantic I-10 Spotlight on the Far East I-11 Operating Results 2002 I-12
Punctuality Performance I-14
SECTION II OUTLOOK FOR 2003 II-1 The Story so Far.. II-2 Traffic Development II-3
Operating Results II-4
SECTION III LOOKING FORWARD III-1 Towards an Efficient European Air Transport System III-2
Are Air Transport Networks Sustainable? III-4 Improving the Industry’s Regulatory Framework III-5
The Dynamics of the Value Chain III-6 A transatlantic Open Aviation Area ? III-7 Bilateral Agreements – Where now ? III-8
Denied Boarding Compensation III-9 External Shocks – Security and Insurance III-10
SECTION IV SPOTLIGHT ON THE AEA IV-1
AEA Highlights IV-3 Airline Profiles & Review of 2002 IV-6
SECTION V KEY STATISTICS V-1 Key Statistics - Total AEA V-2 Key Statistics - By Carrier V-4
AEA Fast Facts V-11 What do we mean by…? V-12

TOWARDS AN EFFICIENT EUROPEAN AIR TRANSPORT SYSTEM
Around the world, airlines are in trouble. In the USA, the world’s five largest airlineshave had to face the very real threat of bankruptcy – two have already been operatingunder protection from their creditors. In Europe, the members of the AEA havecollectively lost US $ 8.5 billion in the last thirteen years.
The AEA has commissioned a far-reaching study into the structure – and the structuraldeficiencies – of the European air transport industry. This study – entitled ‘Towardsan Efficient European Air Transport System’ – provides AEA airlines with a frameworkwithin which they can analyse their strengths and weaknesses and identify policyareas which need to be addressed if the sector is to avoid following its US counterpartto the brink of life-threatening crisis.
WHY ARE AIR TRANSPORT NETWORKS IMPORTANT?
III – 2 ASSOCIATION OF EUROPEAN AIRLINES
Essential components of the modernworld are Communication and Mobility.Mobile phones … laptop and palm-topcomputers … the internet … ten ortwelve years ago, the world functionedwithout them; today it could not. Mass-market air transport has been around forrather longer, and as such is an evenmore essential facilitator ofcommunication and mobility.
Efficient, affordable air transport hasbecome commonplace, so much so thatit is taken for granted that, for everyjourney requirement, a convenientsolution exists. This is because themajor airlines function as Networks.
How do networks function?
Just as, on the London Underground orthe Paris Metro, you can get from anystation to any other station with a singlechange – at a single fare, on a singleticket – if you are connected to an airline‘hub’, you are interconnected to everydestination served from that hub.
Why are networks so important?Consider: after a long haul fromAustralia, the Far East, North or SouthAmerica, virtually every city in Europe isjust a short connecting flight away.
Europe’s regions become every bit asmuch a part of the ‘Global Village’ as thecapital cities and great conurbations.
Airline networks – passenger and cargo –are essential for world trade. Companiesengaged in globalised production anddistribution need to be in easy reach ofboth their suppliers and their customers.
Consider also the effect of airlinenetworks on the cohesion of the SingleMarket. A business, located almostanywhere in Europe, is one connection
5 AIRCRAFT
A B
C D
E F
G H
I J
5 ROUTES
5 AIRCRAFT
AB
CD
EJ
I
HG
F
55 CONNECTIONS
2 NETWORKS/ALLIANCES
210 CONNECTIONS
EFFICIENCIESOF NETWORKS
Source: AEA
AEA_YB_03_25

ASSOCIATION OF EUROPEAN AIRLINES III – 3
away from a customer located almostanywhere else. This is especiallyimportant for the peripheral regions: inmany countries in Europe the nationalairline is a major contributor to theeconomy and the social fabric. Incountries which rely heavily on tourism,their importance is self-evident. In allcountries, they are major employers, bothdirectly and indirectly.
Consider some figures: The thirtymember airlines of the AEA aloneemployed, in 2002, 358,000 employees.It is estimated that every airline jobgenerates between 4 and 10 airport jobs,as well as 3 in the neighbourhood of theairport. For AEA airlines alone thisamounts to employment for about 4-5million people. Add to this the tourismindustry in Europe which generatesreceipts amounting to 700 million € perday, and the aircraft and enginemanufacturing industry.
To take just a single one of thosemember airlines as an example, Air Maltais estimated to generate 7.6% of thenational GDP.
It is not an exaggeration to say that,without the airline networks, the SingleMarket simply could not function.
What other benefits do networksbring?
In recent years, the major Europeanairlines have worked hard to develop aseamless product across their networks.Through ticketing and baggage transferhas always been available, as hasthrough pricing for unrestricted tickets.
To this has been added through fares ateconomy prices, simplified and shortertransfer procedures, and a vastlyincreased range of destinations,sometimes served through partner andaffiliate airlines.
A consequence of this increase in scalehas been that, for the vast majority ofpotential journeys, passengers have achoice of carrier, as several networkscompete for their business.
Connectivity on this scale does nothappen by accident. It is a productfeature which carries a cost – thedistribution cost of offering throughpricing and ticketing, the infrastructurecost of guaranteeing efficient baggagetransfer, the operational cost ofcoordinating schedules, and the costsinvolved in operating a mixed fleet oflarger and smaller aircraft, in larger andsmaller markets.
Air transport is an innovative industry that drives economic and social progress Over 1.6 billion passengers rely every year on the world’s airlines for business and vacation travel and estimates suggest that by 2010, the number of people travelling by air could exceed 2.3 billion. The total economic impact of air transport on gross world output amounts to at least US$1,360 billion –which comprises US$320 billion in direct impact, US$390 billion in indirect impact, and US$650 billion in induced impact. Over 29 million tonnes of freight a year are transported by air, representing 40%, by value, of the world’s manufactured exports. Air transport is one of the fastest growing sectors of the world economy with expansion rates 2.4 times above Gross Domestic Product (GDP) rates on average. Air transport has provided 28 million jobs worldwide –and is expected to provide 31 million by 2010. This includes direct employment of nearly 4 million people,over 8 million who are employed indirectly, and induced employment conservatively estimated at more than 15 million jobs.
Source: AEA
AEA_YB_03_26

ARE AIR TRANSPORT NETWORKS SUSTAINABLE?
III – 4 ASSOCIATION OF EUROPEAN AIRLINES
In recent years, the network airlines havestruggled financially. The increase incompetition which accompaniedEuropean liberalisation in the early 1990scoincided with a period of sustainedeconomic depression for the industrywhich had begun in 1990, continuedthrough the Gulf War of 1991, and did notend until 1995.
In 5 consecutive unprofitable yearsbetween 1990 and 1994, AEA airlineslost an accumulated US $ 10.3bn. In foursubsequent profitable years, to 1998, thenet benefit was just $ 6.0bn.
This was followed by three more leanyears with an accumulated loss of $4.2bn. Even in the good years, it isarguable whether the network airlines, asa group, succeed in recovering their costof capital.
What about non-network airlines?
The last two or three years have seen thephenomenon of the so-called ‘no-frills’ (or‘low-cost’, or ‘low-fare’) carriersexpanding very rapidly, and doing so – atleast in the case of the two largest – withapparently a high degree of profitability.
The no-frills carriers have not wasted anyopportunity to announce the end of anera, so far as the network carriers areconcerned. They represent the future ofthe industry, they say. They havedetermined what the market wants –which is very low fares, and little else,and the market has responded in theirfavour.
They have also raided some of thenetworks’ more important city-pairsegments, further weakening theestablished structure.
How do they affect the networkairlines?
Once again, the focus is on costs.Although the network airlines areenormously more efficient than they werebefore the 1990-1 crisis, they are still at asubstantial seat-cost disadvantagecompared to the no-frills carriers.
The dual questions arise: how muchmore can they strip out of their cost basewhilst preserving the quality of theproduct, and is the quality of the productworth preserving, in that it can commanda premium in the market?
The success of the no-frills carrierssuggests that the market’s expectations,at least for short-haul travel, have movedaway from the product traditionallyoffered by the quality airlines. To remainresponsive to their market, these airlineswill have to re-analyse their businessplans.
One consequence is that carriers mustre-analyse their relationships withsuppliers and service providers. Airlinesspend money in a ‘Value Chain’ whichstretches from manufacturers of aircraftand engines, through infrastructureproviders such as airports and air trafficcontrol services, to marketing anddistribution systems. Airline workforcesare, of course, part of the chain too.
An important consideration in thisprocess is: what kind of living do theairline industry’s ‘dependents’ enjoy, inthe current circumstances?

IMPROVING THE INDUSTRY’S REGULATORY FRAMEWORK
ASSOCIATION OF EUROPEAN AIRLINES III – 5
The European airline industry operatesunder a regulatory regime whereby wehave de facto liberalisation within theSingle Market, yet many other aspects ofthe EU’s regulatory blueprint for airtransport are incomplete, inconsistentand in some cases contradictory.
How are the regulators inconsistent?
Europe’s regulators are frequently to beheard calling for the industry toconsolidate, yet many of their policies aredesigned to hinder consolidation, andpromote a proliferation of small airlines.
Throughout the liberalisation process, theEuropean Commission was very publiclycommitted to achieving low fares, yetairlines continue to face a range ofregulatory measures which eitherincrease their costs, or hamper theirefforts to reduce them.
An obvious consequence of lower faresis increased demand, yet the regulatorshave been very slow to promoteinfrastructure growth in the area of airtraffic control, and have done nothing toencourage an increase in airport capacityin Europe.
Do the regulators recognise theimportance of networks?
EU competition policy, notably as appliedto airline alliances, has consistently failedto grasp the importance of networks andthe need for network carriers to have astrong presence at their hub airports.
Recent developments in EU externalaviation relations, as exemplified by thedecision of the Court of Justice, havebeen cited by the Commission asstrengthening the position of Europeanairlines worldwide, yet have had the
effect of creating uncertainty andinstability throughout the framework ofbilateral aviation agreements on whichthe global air transport structure isfounded.
Regulatory processes within the USA –European airlines’ major external market,and their major external competitors –have always had a clear focus, topromote and support the US networkcarriers. European policy-making has nosuch focus.
Clearly, it is overwhelmingly in theEuropean interest that there is a strongand dynamic airline infrastructure of bothinternal and external networks. Atpresent, the long-term future of thosenetworks are threatened. It must besecured by interdependent measurestaken by governments and airlines; thedilemma can only be resolved bycollective will on both sides.
Source: AEA
AEA_YB_03_27
We are facing a structural crisis...
AEA airlines are adjusting their business models
ATC, airports and other service providers must
also become flexible and cost efficient
We must redefine our business relationships
We need intense dialogue with regulators
...the Road Map to recovery:
THE DYNAMICS OF THE VALUE CHAIN
III – 6 ASSOCIATION OF EUROPEAN AIRLINES
Many industry sectors earn their livingfrom air transport, and available datasuggests that most of them earnsubstantially higher rates of return thanthe airlines themselves.
Who are the winners in the airtransport business?
AEA airlines, which invariably use newequipment, obtain their aircraft eitherdirectly from the manufacturer or fromleasing companies. While these sectorsalso have good and bad years, onaverage they achieve returns of about15-16%, well above their cost of capital.
Airports, too, can be prosperousbusinesses. In many countries whereairports are in public ownership, profitsfrom major airports are sufficient tosubsidise those serving small and remotecommunities.
Where airports are privatised, profitmargins are often far higher than those ofthe airlines who serve them. The sameis true for other support servicesoperating at airports, such as ground-handling companies and aircraft caterers.
Probably the largest profits in the valuechain are earned by the computerreservations systems (CRSs), which areable to earn margins of 30% or more.
One link in the chain which is not profit-oriented is Air Traffic Control (ATC). Itdoes not need to be, since, in Europe, itoperates on a cost-recovery basisadministered by Eurocontrol. In otherwords, whatever is spent, on facilities,equipment, staff and running costs ispassed directly to the airlines throughuser charges.
Why do these sectors benefit at theairlines’ expense?
All these elements in the value chainhave a characteristic which sets themapart from the airlines: they are allmonopolies or oligopolies.
Two airframe manufacturers, and threeengine-makers, provide all the Western-built jets of over 100 seats. The twolargest leasing companies have 45% ofthe market.
Very few airports offer a choice of morethan two ground handling and cateringservice providers, while these sectors arealso consolidating on a worldwide scale.Four CRSs provide distribution globally,but in individual local and regionalmarkets, one or other is dominant.
Airports compete with each other only atthe margins of the air travel business.Hub-based networks certainly docompete with each other, but these arethe creation of airlines, not airports.
Insofar as ATC is concerned, it is obviousthat, with airspace divided into country-sized national systems and intopredetermined airway networks, airlineshave little flexibility in choosing theirroutings from departure to destination.
Even sectors not normally connectedwith the mainstream of air transportoperation can find themselves in verystrong bargaining positions vis-à-vis theairlines. Recent experience has shownthat the insurance community can makedemands of the airlines which, if not met,can threaten their continued operation.
A TRANSATLANTIC OPEN AVIATION AREA?
ASSOCIATION OF EUROPEAN AIRLINES III – 7
The early part of 2003 has seen amomentous development in thegeopolitical infrastructure within whichairlines operate.
In June, a decision of the EuropeanCouncil granted to the Commission amandate to negotiate a multilateral airlineservice agreement between theCommunity and the United States, whichwill replace the current structure ofindividual bilateral agreements, somerestrictive, some liberal.
This development was made all the morelikely following the late 2002 decision ofthe European Court of Justice that‘nationality clauses’ in bilateralagreements – inasmuch as they limitedoperations from an EU country to airlinesof that country (and its bilateral partner,evidently) – were inconsistent with single-market rules.
Within the liberalised European aviationarea there is, for practical purposes, nosuch thing as a national airline; all are‘Community Carriers’ and as such haveaccess to the entire market.
One of the earliest manifestations of thenew direction in Europe/US aviationrelations is likely to be an extension ofthis concept to transatlantic routes,permitting any airline from an EU countryto operate to the US from anyCommunity airport.
That is not to say that immediate anddramatic developments can beanticipated. The experience of Europeanliberalisation is that airlines with a strongnational identity have opted toconcentrate their resources in their homemarkets and develop their hub-basednetworks.
A more likely consequence may be thatthe new arrangements remove anobstacle to cross-border investmentbetween airlines in Europe. In recentyears, proposed mergers and otherpartnerships involving financialparticipation have faltered because ofconcerns that an airline losing its‘nationality’ would also lose its trafficrights.
Any agreement between the EU and theUS would, of course, concern itselfchiefly with EU and US airlines. Any fifth-freedom operation by, for example,Middle Eastern or Asian carriers wouldbe closely regulated, as it is today.
The status of EU airlines as CommunityCarriers requires them to be majority-owned by EU nationals – i.e. with nomore than 49% foreign ownership. USrules are much more severe, with anupper limit of 25%.
In the European vision of an OpenAviation Area – shared by the AEA – anultimate development could be theremoval of ownership limits, allowingEuropeans to invest in, or establish, UScarriers – and vice versa.
At a more immediate level, the events ofSeptember 11 and their aftermath havecreated a new landscape in EU-USrelations. Issues such as security,information exchange and privacyprotection, insurance and financialassistance urgently require moreharmonised policies.
All of these areas, along with marketaccess, investment and competitionrules, are essential components of the‘level playing field’ which would benefitairlines – on both sides of the Atlantic –and customers alike.

BILATERAL AGREEMENTS – WHERE NOW?
III – 8 ASSOCIATION OF EUROPEAN AIRLINES
The decision of the European Court ofJustice, that the nationality clausescontained in the ‘Open Skies’ EU-USbilaterals were contrary to European law,had repercussions far beyond the eightagreements under investigation.
Evidently, what is contrary to the law inone case, is contrary in all cases, and allbilateral treaties between EU MemberStates and ‘Third Countries’ – totallingsome 2000 agreements – can beassumed to include restrictive (i.e.discriminatory) nationality provisions.
In other words, the agreeement between,for example, Austria and Australia willrestrict services to airlines which areeither Austrian or Australian.
Remedying such anomalies will not be astraightforward process. While amultilateral approach is seen asappropriate for the huge US market,which is comparable in size to the EU,other country markets are much smaller.Even the next-largest non-EU markets –Japan, Canada and China/Hong Kong –are dwarfed by the US, which generatesbetween six and seven times as muchtraffic for AEA airlines.
Where a multilateral solution is not likelyto be appropriate, it may be imaginedthat the third-countries involved couldquestion why they should agree to re-word their agreements with EU statessuch that it would grant additionalopportunities only to the European side.
Into this scenario of uncertainty, theairlines – European and non-European –urgently need to see introduced a note ofclarity, stability and commercial certainty.
Bilateral agreements, concluded andamended over the years, are a
fundamental part of the industry’s politicaland commercial infrastructure. Thetraffic rights enshrined in them areamong the airlines’ most valuable assets.
So far, the European Commission hasgiven every indication that it will bepragmatic and flexible in the transition toa new formula for bilateral agreements.
Less clear is whether, in a new regime inwhich the Commission joins – andultimately monitors – the negotiationsbetween an EU state and its bilateralcounterpart , the airlines will be permittedto maintain their traditional place at thenegotiating table.
For years, airlines have individually anddirectly participated to bilateralnegotiations with their Member States.Such participation has allowed airlines toprovide expertise from a technical andcommercial point of view.
Such involvement in negotiations withthird countries is essential for AEAmembers to support their interests andcontinue business as usual.
There is no doubt whatever that thedelegation from the non-European partyto any such agreement will include fullparticipation from that country’sinterested airlines, ensuring that theirown interests are fully represented.
Whatever the strict legalities, theCommunity policy for external relations inthe field of air transport should seek tocreate a European framework allowingthe airline industry to prosper and furtherreinforce its unique and indispensiblecontribution to the mobility of Europeancitizens, economic growth and politicalcohesion.

DENIED BOARDING COMPENSATION
ASSOCIATION OF EUROPEAN AIRLINES III – 9
A recent decision of the EuropeanParliament has paved the way towards asubstantial increase in the scale andscope of the statutory compensation tobe paid to passengers who are not ableto be accommodated on the flight onwhich they are booked.
Existing rules, which date from 1991,fixed compensation levels of €150 forshorthaul flights and €300 for longhaul.The proposed amendment would doublethe higher figure and set levels of €400and €250 for shorter flights.
The proposal contains a number of othermajor changes. The provisions areapplied to non-scheduled airlines for thefirst time, and are also extended to coverflight cancellations.
Another important aspect of the proposedlegislation is the requirement for airlinesto call for volunteers to surrender theirseats. In such a situation, everyone whodid not travel would do so voluntarily andcome away satisfied with the deal theyhad struck with the airline. Only ifvolunteers were not found would thestatutory compensation levels come intoplay.
In the USA, which has had a volunteersystem in place for some time, 95% ofpassengers who surrender their seats doso willingly.
The AEA has long argued in favour of asystem of volunteer calls, and memberairlines have largely put in place such asystem following the implementation ofthe Airline Passenger ServiceCommitment, which the Associationpioneered in 2001-2 and which nowprotects the majority of air travellers inEurope.
A common perception is that deniedboarding incidents are invariably theresult of systematic overbooking byairlines.
This is far from being the case. Acommon problem is that of passengerswho present themselves at check-in with‘OK’ tickets but for whom there is norecord in the airline’s reservationssystem.
Equally significant is the standardpractice among network airlines ofroutinely accommodating passengerswho have missed their connecting flighton the next available service – whether itis already full or not.
The high incidence of delay in Europe inrecent years, much of it outside theairlines’ control, has contributed to thisproblem. Nevertheless, denied boardingremains, statistically, an extremely rareevent on European airlines.
< 1 500 km €250
1 500 - 3500 km €400
€150
> 3 500 km €600 €300
Include flight cancellations Yes No
Applicable to non-scheduled Yes No
Volunteer calls Mandatory Discretionary
REVISING THE DENIED BOARDING REGULATION
Proposed Existing
Source: EU Parliament
AEA_YB_03_28
}

EXTERNAL SHOCKS – SECURITY AND INSURANCE
III – 10 ASSOCIATION OF EUROPEAN AIRLINES
The terrorist attacks in New York andWashington on September 11 2001turned the public spotlight on aviationand its specificities. One consequencewas the establishment in the USA of anew agency which has as its coremission the enhancement of ‘homelandsecurity’.
This agency, and security agenciesworldwide, have increased securitymeasures at airports and for airlines,which have added substantially to theindustry’s cost burden.
The tempo of enhanced security hasfurther increased with additionalmeasures taken in relation to the 2003Iraq War.
So far, AEA airlines have absorbed about€800 million in costs for such additionalmeasures.
In 2001, and again in 2003, the USgovernment paid billions of dollars tocompensate their aviation industry for thecosts of additional security measures.
In contrast, European governments haveso far declined to bear the costs foraviation security measures that aim atthe protection of society in general.
In addition, European states applydiffering policies with regard to thefinancing of aviation security measures.An obvious consequence is distortion ofcompetition.
The airlines are not seeking State Aid;simply that governments assume theresponsibility and funding for securitymeasures that aim at the protection ofthe general public against terroristattacks.
As well as escalating security costs,insurance premiums for AEA airlineshave soared. In addition to normal hull-loss and passenger cover, payments byAEA airlines for third party war andterrorism liability have increased from€80 million in 2001 to an expected €400million in 2003.
Through late 2001 and much of 2002,European airlines had their third-partywar risk underwritten by governments ina scheme approved by the EU. Thisapproval was discontinued in October2002; subsequently the airlines have hadto rely on inferior – and expensive –commercial cover which can becancelled at short notice.
By comparison, the US airlines havebenefitted from a government schemewhich provides twice their pre-9/11 warliability cover at a fraction of the pricepaid by European carriers on thecommercial market. The US scheme willcontinue until at least December 2006.
The US, in supporting its airlines’ security andinsurance programmes, clearly takes theview that war and terrorism are governmentrisks – i.e. threats against the state.European governments, singly or collectivelywithin the EU, have shown little enthusiasmfor acknowledging a responsibility in thesematters.
Reinforced cockpit doorsOnboard means of surveillanceNew operational onboard procedures Anti-terror crew trainingIntensified guarding of aircraftRegular background checks on staffStaff screeningIndirect costs for catering and cleaning servicesPNR access provision
Some areas in which additional security hasdirectly impacted airline costs:
Source: AEA
AEA_YB_03_29
ASSOCIATION OF EUROPEAN AIRLINES IV - 1
CONTENTS
SECTION I AEA AIRLINES IN 2002 I-1
At a Glance I-2Welcome to Virgin Atlantic Airways I-4 The Global Economic Environment I-5
Traffic Development 2002 I-7 ‘No-frills’ carriers l-8
Spotlight on the North Atlantic I-10 Spotlight on the Far East I-11 Operating Results 2002 I-12
Punctuality Performance I-14
SECTION II OUTLOOK FOR 2003 II-1 The Story so Far.. II-2 Traffic Development II-3
Operating Results II-4
SECTION III LOOKING FORWARD III-1 Towards an Efficient European Air Transport System III-2
Are Air Transport Networks Sustainable? III-4 Improving the Industry’s Regulatory Framework III-5
The Dynamics of the Value Chain III-6 A transatlantic Open Aviation Area ? III-7 Bilateral Agreements – Where now ? III-8
Denied Boarding Compensation III-9 External Shocks – Security and Insurance III-10
SECTION IV SPOTLIGHT ON THE AEA IV-1
AEA Highlights IV-3 Airline Profiles & Review of 2002 IV-6
SECTION V KEY STATISTICS V-1 Key Statistics - Total AEA V-2 Key Statistics - By Carrier V-4
AEA Fast Facts V-11 What do we mean by…? V-12

IV – 2 ASSOCIATION OF EUROPEAN AIRLINES
Rod Eddington, Chief Executive of British Airways and 2003 Chairman of the AEA.

AEA HIGHLIGHTS
ASSOCIATION OF EUROPEAN AIRLINES IV - 3
At the start of the year 2002 Leo van Wijk, CEO of KLM, took up the post of Chairman of the AEA. The position is held for one calendar year, by a member airline’s President or CEO. Together with the Presidents’ Committee, the Chairman has the task of overseeing the work of the AEA Secretariat office in Brussels. The newly elected Chairman for 2003 is Rod Eddington, Chief Executive of British Airways. Ulrich Schulte-Strathaus joined the Association of European Airlines as its new Secretary General from 1st September, 2002. Formerly Corporate Vice President International Relations at Lufthansa, Schulte-Strathaus succeeded Karl-Heinz Neumeister who left his position after nineteen years of very valuable contributions to the Association.
Left to right: Karl-Heinz Neumeister, retiring AEA Secretary General, Leo van Wijk, CEO of KLM, and Ulrich Schulte-Strathaus, incoming Secretary General, at the official ceremony held on the occasion of the Autumn 2002 Assembly of Presidents.
Two new airlines joined the AEA in 2002: LOT Polish Airlines and SN-Brussels Airlines, the successor to Sabena as Brussels’s hub airline.
On 1st July 2003 AEA welcomed its thirty-first member, Virgin Atlantic Airways. A profile of each member airline can be found on pages IV-6 to IV-36.
The activities of the AEA in 2002 and early 2003 were clearly focused on the tasks in hand. The economic slowdown, the events of September 11th, the Iraq war and the SARS epidemic left the industry facing an unprecedented crisis. This Yearbook gives an assessment of the current state of the European airline industry in section I. Whilst the industry addressed its structural problems, AEA worked, on behalf of, and with, its members on a broad range of issues from efforts to minimize the cost burden of additional legislation on the airlines, to arguing for a level-playing field with the American aviation industry, and reassessing every link in the aviation chain on a cost-benefit basis. These and other topics are elaborated on in this Yearbook, to be found under section III.
IV – 4 ASSOCIATION OF EUROPEAN AIRLINES
Ulrich Schulte-Strathaus, AEA Secretary General

MISSION STATEMENT
ASSOCIATION OF EUROPEAN AIRLINES IV – 5
The AEA is a non-profit making association. The AEA is represented jointly by all its members or by persons named for this purpose. The AEA shall serve the common interests of its Members. It shall represent the interests of its Members to the institutions of the European Union, to the European Civil Aviation Conference, to any other international organisation or association involved in or likely to be involved in issues of interest to AEA members and, as appropriate, to individual governments. It shall advance co-operation amongst its Members on any matter likely to be of interest to the membership as a whole and permitted by the laws of the countries in which they operate, whilst respecting the independence of action of its members individually. AEA STRUCTURE Twice a year the Presidents of the member airlines meet to discuss the state of the industry. Each year a Chairman is elected from amongst the Presidents, to preside the Assemblies and the AEA for a period of one year. The Chairman is assisted by the Presidents’ Committee, which is composed of the past and present Chairmen and seven other Presidents elected by the Assembly, with a total of nine representatives. The AEA Secretariat, with at its head the Secretary General, is located in Brussels and has a staff of twenty. AEA Chairman for 2003 Rod Eddington British Airways Presidents’ Committee Jean-Cyril Spinetta Air France Francesco Mengozzi Alitalia
Vagn Soerensen Austrian Airlines Rod Eddington British Airways
Ivan Misetic Croatia Airlines Wolfgang Mayrhuber Lufthansa Fernando Conte Iberia Leo van Wijk KLM Jørgen Lindegaard SAS AEA Secretariat Ulrich Schulte-Strathaus Secretary General
'
Association of European Airlines
ˇ

IV – 6 ASSOCIATION OF EUROPEAN AIRLINES
Review of 2002 2002 in numbers: 0.81 million passengers transported, 88% on scheduled services within Europe, 12% on charter services; 4.6 thousand tonnes of freight carried on passenger services. On a turnover up 4% over 2001, Adria Airways posted a positive operating result just over € 3 million in 2002, compared to € 2.6 million in 2001. Net profit (after taxes) stood at € 0.5 million. Adria implemented some measures to deal with the difficult economic climate the industry is operating in, which included cost-cutting measures, such as a reduction in staff numbers, and the generation of extra income from the servicing of foreign aircraft. In July Bombardier Aerospace appointed Adria Airways as the first Bombardier recognised Canadair CRJ aircraft heavy maintenance facility in Europe. Adria is thus authorised to perform the so-called ‘C’ check and other heavy maintenance on the 50-seater CRJ -100 and -200, the 70 seater CRJ-700 and the 86-seater CRJ-900, as well as aircraft modifications and upgrades. As of 30 th June, 2002 there were 211 CRJ aircraft in service with, or on firm order from, European airlines. Adria took delivery of its first Bombardier CRJ series regional jet in January 1998, and at year-end 2002 operated four CRJ-200s, as well as its three A320s. In early 2003 an additional CRJ was leased from Bombardier, for a period of two years, bringing the total of this aircraft type in the fleet to five. Adria’s established code-share partners include Air France co-operating on the Ljubljana-Paris route, Austrian Airlines with an agreement on Ljubljana-Vienna services and Lufthansa on the Ljubljana to Frankfurt and Munich routes. In November of the previous year (2001) Adria launched flights between Germany and Austria, on the Vienna-Frankfurt route, in direct competition with Austrian Airlines and Lufthansa, on a so-called 7th freedom service. In May 2002 Adria started operating between the Slovenian capital and Podgorica, the capital of Montenegro, following an agreement with Montenegro Airlines. London operations were switched from Heathrow to Gatwick airport with effect from the Summer timetable. In June Adria’s Moscow services were moved from Sheremetyevo airport to the recently upgraded Domodedovo airport.
Adria Airways Kuzmiceva 7 1000 Ljubljana Slovenia www.adria.si Branko Lucovnik, President & CEO 19 Scheduled Destinations 1 within Slovenia 17 rest of Europe 1 beyond Europe 555 Employees 7 Aircraft in Fleet 3 Airbus A320 4 Canadair CRJ-200 0 Aircraft on Order Status at 31st December for information on destinations, employees and fleet. Owned by… 55.8% Slovenian Pension Fund 20% Slovenian Restitution Fund 10.3% National Finance Corporation 9% Nova Ljubljanska Banka 3.4% Porbanka 1.5% Zlata Moneta Owner of… - Major partnerships Code-share agreements with Air France, Austrian Airlines, Croatia Airlines, Lufthansa. Financial Results
€ ‘000 2002 2001 Turnover 112066 107672 Operating profit/loss 3121 2634 Net profit/loss 521 752
Branko Lucovnik President
ˇ
ˇ
ˇ

ASSOCIATION OF EUROPEAN AIRLINES IV - 7
Review of 2002 2002 in numbers: Not available. 2002 was a year of major change for Aer Lingus. The airline made substantial progress in moving the business from the threat of financial crisis at the outset of the year to a return to profitability by year end, recording a net profit of € 35.3 million. Following the terrorist attacks of 11th September, 2001 a radical Survival Plan was prepared by the Board and management of Aer Lingus and was implemented with great speed. Subsequently the company took steps to put in place a new business model which incorporated reductions in its cost base, significant reductions in its business and leisure fares and the introduction of a series of popular, direct routes out of Ireland. Nine new routes were added in 2002, all through greater utilisation of existing aircraft and staff resources. Business and leisure fares were reduced by up to 60% and over 3 million customers availed of low fares seats in 2002. Aer Lingus dotcom became the airline’s main distribution point, with over 40% of all the airline’s bookings being made online by year end, compared with just 2% at the start of 2002. The results of these actions have been dramatic and have led to the transformation in the performance of the business in 2002. The outcome is a return to profitability for Aer Lingus, ahead of the projections in the Survival Plan.
Aer Lingus Dublin Airport Dublin Ireland www.aerlingus.com Tom Mulcahy, Chairman William Walsh, Chief Executive 37 Scheduled Destinations 3 within Ireland 29 rest of Europe 5 beyond Europe 4500 Employees (at 31st Dec ’01) 34 Aircraft in Fleet 4 Airbus A330-300 3 Airbus A330-200 6 Airbus A321-200 4 Airbus A320-200 8 Boeing 737-500 3 Boeing 737-400 6 BAe 146-300 0 Aircraft on Order Status at 31st December for information on destinations, employees and fleet. Owned by… 95% State ownership 5% Aer Lingus employees Owner of… - Major partnerships Member of the Oneworld Alliance. Code-share agreements with: American Airlines, British Airways, Iberia, KLM. Financial Results (Group)
€ mill 2002 2001 Turnover 958.6 1097.2 Operating profit/loss 63.8 (52.1) Net profit/loss 35.3 (139.9)
Tom Mulcahy Chairman
William Walsh Chief Executive
IV – 8 ASSOCIATION OF EUROPEAN AIRLINES
Review of 2002 2002 in numbers: 43.4 million passengers transported on scheduled services, of which: 40% on Domestic routes, 33% within Europe, 14% across the Atlantic, 8% to the African continent and the Middle East and 5% to the Far East; 648 thousand tonnes of freight carried, 51% on all-cargo services. The economic activity of Air France held up well in 2002. Following on from a positive result in 2001, financial year results at 31st March 2003 showed a Group net profit of € 120 million. In January 2002 the US Department of Transport granted anti-trust immunity for the North Atlantic operations of SkyTeam members (AeroMéxico, Air France, Alitalia, CSA, Delta Air Lines and Korean Air). In June this was followed by immunity for Pacific routes, making the SkyTeam the first alliance to benefit from both transpacific and transatlantic immunity. In March, American carrier Atlantic Southeast Airlines initiated a code-share agreement with Air France on flights from Atlanta to several US cities. In October Air France and Russia’s Aeroflot embarked on a code-share agreement on Moscow-Paris. Further synergies were also developed with SkyTeam partners. In 2002 Air France continued to capitalise on its Charles de Gaulle hub, adjusting capacity as required, and building up its transfer operations. For Summer 2002 schedule Air France maintained capacity levels of previous Summer, albeit with a shift from North and Mid Atlantic to Africa and Indian Ocean destinations. The Winter 2002-2003 season was similarly back at the level of planned Winter schedule capacity for 2001-2002, as announced before September 11th 2001. In the fleet, Air France cargo operations took delivery of 3 Boeing 747-400 extended range freighters, with 2 on order. Passenger operations saw the arrival of 6 new A330-200. Over the Winter season, various other aircraft were retired, including all A310s, bringing the total fleet size to 252 units by December 2002.
Air France 45 rue de Paris 95747 Roissy CDG Cedex, France www.airfrance.com Jean-Cyril Spinetta, Chairman Pierre-Henri Gourgeon, CEO 194 Scheduled Destinations 37 within France 75 rest of Europe 82 beyond Europe 70156 Employees (Group, at 31st March ’02) 252 Aircraft in Fleet 4 Concorde 22 Airbus A340-300 8 Airbus A330-200 9 Airbus A321-200 5 Airbus A321-100 50 Airbus A320-200 13 Airbus A320-100 39 Airbus A319-100 25 Boeing 777-200 4 Boeing 767-300 13 Boeing 747-400 3 Boeing 747-400F 4 Boeing 747-300 8 Boeing 747-200 11 Boeing 747-200F 27 Boeing 737-500 7 Boeing 737-300 62 Aircraft Orders 10 Airbus A380-800 9 Airbus A330-200 9 Airbus A320-200 15 Airbus A318-100 14 Boeing 777-300 3 Boeing 747-400 2 Boeing 747-400F Status at 31st December for information on destinations and fleet. Owned by… 54% State ownership 33% Private and Institutional investors 13% Air France employees Owner of… 100% Régional, Brit Air, CityJet 76.4% Sté Nouvelle Air Ivoire (via Holding) 36% Air Austral 11.9% CCM (Corsica) 11.8% Air Afrique 10% Mediterranean Air Services 7.5% Air Tahiti 5.6% Tunis Air 2.9% Royal Air Maroc Major partnerships Member of the SkyTeam Alliance. Subsidiaries/Franchisees: Régional, Brit Air, CityJet, British European, CCM. Various code-share agreements, incl. Aeroflot, Air Mauritius, Austrian Airlines, China Eastern, Iberia, JAL, LOT, Luxair, South African, TAM. Financial Results (Group, FY 31st March)
€ mill 2002/03 2001/02 Turnover 12687 12528 Operating profit/loss 192 235 Net profit/loss 120 153
Jean-Cyril Spinetta Chairman

ASSOCIATION OF EUROPEAN AIRLINES IV - 9
Review of 2002 2002 in numbers: 1.61 million passengers transported, 87% on scheduled services, of which: 81% within Europe, 5% to North Africa and 1% to the Middle East; 8.1 thousand tonnes of freight carried, 11% on all-cargo services. In 2002 Air Malta concluded a multi-million dollar agreement with ILFC for the renewal of its entire fleet over a four-and-a-half year period starting in 2004. Air Malta’s new fleet will comprise Airbus A320 and A319 units with CFM engines and options for the A321 aircraft. A far reaching agreement was also concluded with Sabre Inc. whereby Air Malta’s inventory, DCS and other IT features migrated to Sabre in March 2003. An Memorandum of Understanding was signed between Air Malta and Alitalia in August 2002 leading to code-sharing on all routes between Malta and Italy with effect from Summer 2003 and co-operation between the two carriers in other areas. A landmark agreement was also reached in mid-2002 between Air Malta and Lufthansa Technik AG setting up Lufthansa Technik Malta as a joint venture between the two companies. Air Malta’s Chief Engineer Ing. Louis Giordimaina has been appointed Lufthansa Technik Malta Chief Executive Officer. Ing. Silvio Falzon replaced him as Air Malta Chief Engineer. In October 2002 Air Malta appointed Mr. Ernst Funk as its Chief Executive Officer. Mr. Joe Cappello was appointed Chief Operating Officer in December 2002. In June 2003 Lawrence Zammit took up the position of Chairman of Air Malta, succeeding Louis Grech.
Air Malta Head Office Luqa LQA05 Malta www.airmalta.com Lawrence Zammit, Chairman 43 Scheduled Destinations 1 within Malta 38 rest of Europe 4 beyond Europe 1945 Employees 13 Aircraft in Fleet 4 Airbus A320-200 7 Boeing 737-300 2 Boeing 737-200 0 Aircraft on Order Status at 31st December for information on destinations, employees and fleet. Owned by… 96.4% State ownership 3.6% Private shareholders Owner of… 100% Malta Air Charter Co Ltd 49% AZZURRA Air Major partnerships Code-share agreement with Alitalia Financial Results (Group, FY 31st July)
MTL mill 2002/01 2001/00 Turnover 173,679 123,854 Operating profit/loss 3,046 5,266 Net profit/loss* 332 (3,702)
* before tax
Lawrence Zammit Chairman
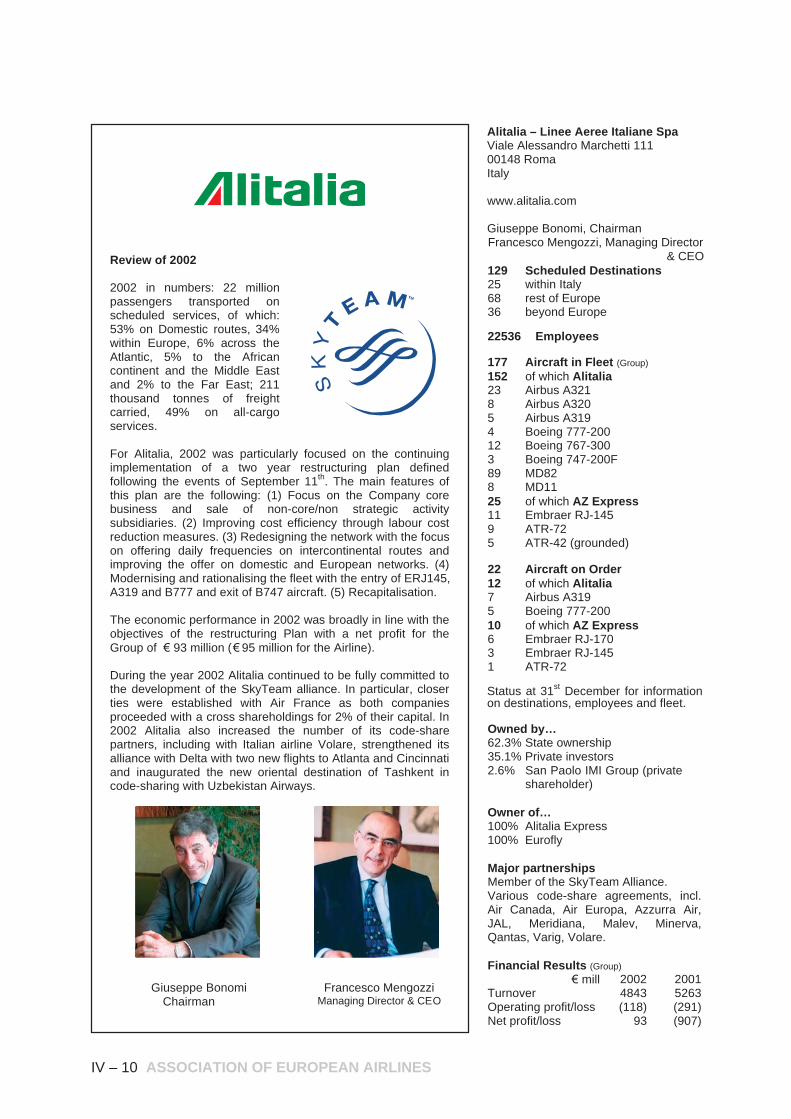
IV – 10 ASSOCIATION OF EUROPEAN AIRLINES
Review of 2002 2002 in numbers: 22 million passengers transported on scheduled services, of which: 53% on Domestic routes, 34% within Europe, 6% across the Atlantic, 5% to the African continent and the Middle East and 2% to the Far East; 211 thousand tonnes of freight carried, 49% on all-cargo services. For Alitalia, 2002 was particularly focused on the continuing implementation of a two year restructuring plan defined following the events of September 11th. The main features of this plan are the following: (1) Focus on the Company core business and sale of non-core/non strategic activity subsidiaries. (2) Improving cost efficiency through labour cost reduction measures. (3) Redesigning the network with the focus on offering daily frequencies on intercontinental routes and improving the offer on domestic and European networks. (4) Modernising and rationalising the fleet with the entry of ERJ145, A319 and B777 and exit of B747 aircraft. (5) Recapitalisation. The economic performance in 2002 was broadly in line with the objectives of the restructuring Plan with a net profit for the Group of € 93 million (€ 95 million for the Airline). During the year 2002 Alitalia continued to be fully committed to the development of the SkyTeam alliance. In particular, closer ties were established with Air France as both companies proceeded with a cross shareholdings for 2% of their capital. In 2002 Alitalia also increased the number of its code-share partners, including with Italian airline Volare, strengthened its alliance with Delta with two new flights to Atlanta and Cincinnati and inaugurated the new oriental destination of Tashkent in code-sharing with Uzbekistan Airways.
Alitalia – Linee Aeree Italiane Spa Viale Alessandro Marchetti 111 00148 Roma Italy www.alitalia.com Giuseppe Bonomi, Chairman Francesco Mengozzi, Managing Director
& CEO 129 Scheduled Destinations 25 within Italy 68 rest of Europe 36 beyond Europe 22536 Employees 177 Aircraft in Fleet (Group) 152 of which Alitalia 23 Airbus A321 8 Airbus A320 5 Airbus A319 4 Boeing 777-200 12 Boeing 767-300 3 Boeing 747-200F 89 MD82 8 MD11 25 of which AZ Express 11 Embraer RJ-145 9 ATR-72 5 ATR-42 (grounded) 22 Aircraft on Order 12 of which Alitalia 7 Airbus A319 5 Boeing 777-200 10 of which AZ Express 6 Embraer RJ-170 3 Embraer RJ-145 1 ATR-72 Status at 31st December for information on destinations, employees and fleet. Owned by… 62.3% State ownership 35.1% Private investors 2.6% San Paolo IMI Group (private
shareholder) Owner of… 100% Alitalia Express 100% Eurofly Major partnerships Member of the SkyTeam Alliance. Various code-share agreements, incl. Air Canada, Air Europa, Azzurra Air, JAL, Meridiana, Malev, Minerva, Qantas, Varig, Volare. Financial Results (Group)
€ mill 2002 2001 Turnover 4843 5263 Operating profit/loss (118) (291) Net profit/loss 93 (907)
Giuseppe Bonomi Chairman
Francesco Mengozzi Managing Director & CEO
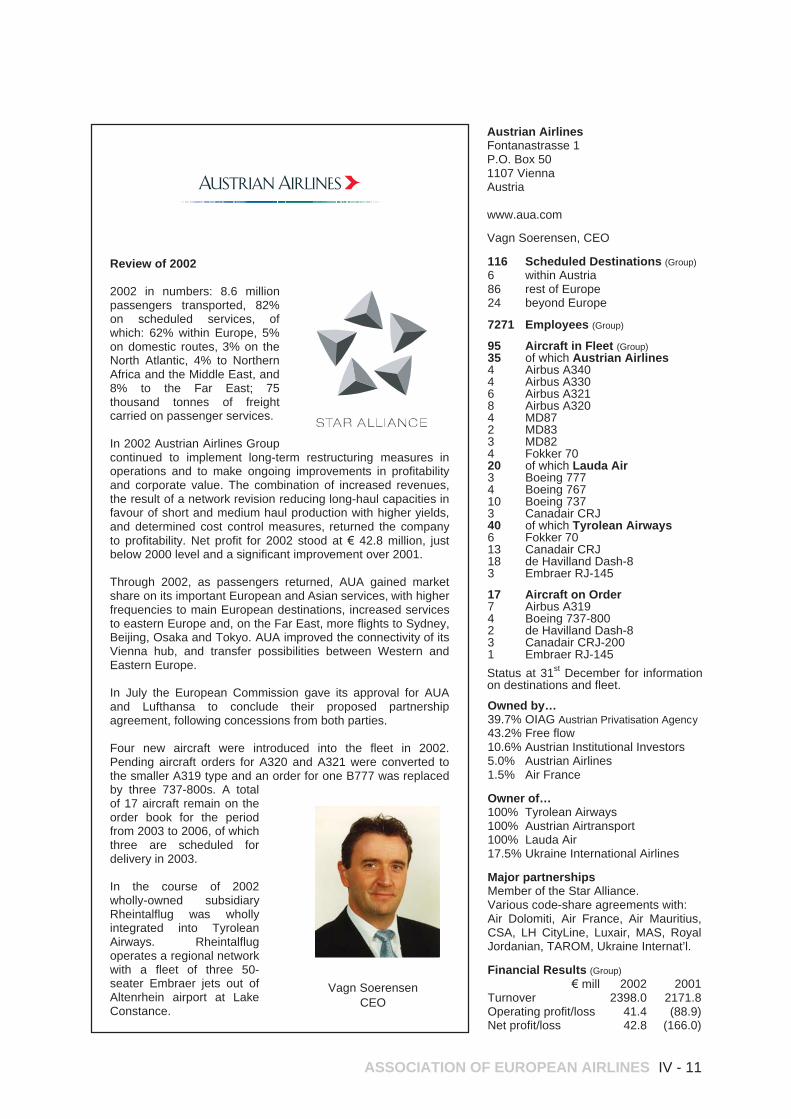
ASSOCIATION OF EUROPEAN AIRLINES IV - 11
Review of 2002 2002 in numbers: 8.6 million passengers transported, 82% on scheduled services, of which: 62% within Europe, 5% on domestic routes, 3% on the North Atlantic, 4% to Northern Africa and the Middle East, and 8% to the Far East; 75 thousand tonnes of freight carried on passenger services. In 2002 Austrian Airlines Group continued to implement long-term restructuring measures in operations and to make ongoing improvements in profitability and corporate value. The combination of increased revenues, the result of a network revision reducing long-haul capacities in favour of short and medium haul production with higher yields, and determined cost control measures, returned the company to profitability. Net profit for 2002 stood at € 42.8 million, just below 2000 level and a significant improvement over 2001. Through 2002, as passengers returned, AUA gained market share on its important European and Asian services, with higher frequencies to main European destinations, increased services to eastern Europe and, on the Far East, more flights to Sydney, Beijing, Osaka and Tokyo. AUA improved the connectivity of its Vienna hub, and transfer possibilities between Western and Eastern Europe. In July the European Commission gave its approval for AUA and Lufthansa to conclude their proposed partnership agreement, following concessions from both parties. Four new aircraft were introduced into the fleet in 2002. Pending aircraft orders for A320 and A321 were converted to the smaller A319 type and an order for one B777 was replaced by three 737-800s. A total of 17 aircraft remain on the order book for the period from 2003 to 2006, of which three are scheduled for delivery in 2003. In the course of 2002 wholly-owned subsidiary Rheintalflug was wholly integrated into Tyrolean Airways. Rheintalflug operates a regional network with a fleet of three 50-seater Embraer jets out of Altenrhein airport at Lake Constance.
Austrian Airlines Fontanastrasse 1 P.O. Box 50 1107 Vienna Austria www.aua.com Vagn Soerensen, CEO 116 Scheduled Destinations (Group) 6 within Austria 86 rest of Europe 24 beyond Europe 7271 Employees (Group) 95 Aircraft in Fleet (Group) 35 of which Austrian Airlines 4 Airbus A340 4 Airbus A330 6 Airbus A321 8 Airbus A320 4 MD87 2 MD83 3 MD82 4 Fokker 70 20 of which Lauda Air 3 Boeing 777 4 Boeing 767 10 Boeing 737 3 Canadair CRJ 40 of which Tyrolean Airways 6 Fokker 70 13 Canadair CRJ 18 de Havilland Dash-8 3 Embraer RJ-145 17 Aircraft on Order 7 Airbus A319 4 Boeing 737-800 2 de Havilland Dash-8 3 Canadair CRJ-200 1 Embraer RJ-145 Status at 31st December for information on destinations and fleet. Owned by… 39.7% OIAG Austrian Privatisation Agency 43.2% Free flow 10.6% Austrian Institutional Investors 5.0% Austrian Airlines 1.5% Air France Owner of… 100% Tyrolean Airways 100% Austrian Airtransport 100% Lauda Air 17.5% Ukraine International Airlines Major partnerships Member of the Star Alliance. Various code-share agreements with: Air Dolomiti, Air France, Air Mauritius, CSA, LH CityLine, Luxair, MAS, Royal Jordanian, TAROM, Ukraine Internat’l. Financial Results (Group)
€ mill 2002 2001 Turnover 2398.0 2171.8 Operating profit/loss 41.4 (88.9) Net profit/loss 42.8 (166.0)
Vagn Soerensen CEO
IV – 12 ASSOCIATION OF EUROPEAN AIRLINES
Review of 2002 2002 in numbers: 7.7 million passengers transported, 97% on scheduled services, of which: 48% within Europe, 46% on Domestic routes and 3% on the North Atlantic; 18 thousand tonnes of freight carried on passenger services. In January bmi announced the launch of a no frills subsidiary, known as bmibaby. Services out of East Midlands airport began in March and expanded to a second base at Cardiff with operations starting in October. The airline announced it was seeking a third UK base, which has subsequently been named as Manchester. Throughout 2002 bmi continued its lobbying for greater competition, choice and lower fares on Heathrow-US routes. However, the restrictive Bermuda II agreement, which allows just four airlines – two British (BA and Virgin) and two American (United and American) – to operate direct between Heathrow and the US, remains in place. In April the US government granted anti-trust immunity to the proposed alliance between bmi and United Airlines, which was subsequently also approved by the UK Office of Fair Trading. In April bmi became the first airline to install Tempus 2000 in-flight telemedicine technology on long-haul flights. In June bmi scrapped its existing fare structure and introduced a new one-way system, which removed minimum stay requirements such as traditional Saturday night stopover. The move meant lower fares and greater convenience for passengers, and resulted in a significant increase in bookings. Many other European airlines made similar changes. In the route network, bmi introduced Leeds Bradford-Cork, Edinburgh-Stornoway and Manchester-Toulouse in 2002. In the fleet, all Boeing 737s (total of 14 aircraft) were transferred to bmibaby. Three Fokker 70 aircraft were also withdrawn from the fleet in the course of the year.
bmi Donington Hall Castle Donington Derby East Midlands DE74 2SB Great Britain www.flybmi.com Sir Michael Bishop CBE, Chairman Austin Reid, CEO 25 Scheduled Destinations 10 within the United Kingdom 14 rest of Europe 1 beyond Europe 4853 Employees 41 Aircraft in Fleet 3 Airbus A330-200 10 Airbus A321-200 10 Airbus A320-200 1 Boeing 737-400 6 Fokker 100 9 Embraer RJ-145 2 Embraer RJ-135 0 Aircraft on Order Status at 31st December for information on destinations, employees and fleet. Owned by… 50% plus 1 share BBW 30% minus 1 share Lufthansa 20% SAS Owner of… 100% bmibaby Major partnerships Member of the Star Alliance. Various code-share agreements with: All Nippon Airways, Air Canada, Austrian Airlines, Gulf Air, Lufthansa, SAS, South African Airways, United Airlines and Virgin Atlantic. Financial Results
£ mill 2002 2001 Turnover 723.8 756.9 Operating profit/loss - - Net profit/loss (19.6) 12.4
Sir Michael Bishop Chairman

ASSOCIATION OF EUROPEAN AIRLINES IV - 13
Review of 2002 2002 in numbers: 34.4 million passengers transported, 99% on scheduled services, of which: 20% on domestic routes, 46% within Europe, 19% across the Atlantic, 7% to the African continent and the Middle East and 6% to the Far East; 614 thousand tonnes of freight carried, 14% on all-cargo services. In February 2002 British Airways announced its ‘Future Size and Shape’ programme which focused on reducing costs, reducing complexity and restructuring its short-haul business. ‘Future Size and Shape’ targeted £650 million annualised cost saving by March 2004, with £450 million to be secured by the end of the financial year 2002/03 and a reduction in headcount of 13,000 by March 2004. The restructuring of its short haul business to compete with no- frills carriers included a new year-round pricing structure on 176 key routes to Europe and the launch of Fare Explorer, a new booking engine, to encourage more booking online. Changes to travel agents payments were also introduced and eight route transfers were made from Gatwick to Heathrow. British Airways and American Airlines withdrew their filing for anti-trust immunity from the US Department of Transportation because the regulatory price for code-sharing on transatlantic routes was too high for both airlines. In July British Airways announced its preferred option for a third runway at London Heathrow in response to the Government paper on airport infrastructure in the UK. In September the airline extended its code-sharing relationship with Iberia and later in the year announced an alliance with SN Brussels Airlines. In early 2003 Rod Eddington, British Airways’ Chief Executive, was elected AEA Chairman for 2003.
British Airways plc Waterside P.O. Box 365 Harmondsworth UB7 0GB Great Britain www.britishairways.com Rod Eddington, Chief Executive & 2003 Chairman of the AEA 159 Scheduled Destinations 29 within the United Kingdom 55 rest of Europe 75 beyond Europe 61,460 Employees (Group, at 31st March ‘02) 348 Aircraft in Fleet (Group*) 7 Concorde 23 Airbus A320 33 Airbus A319 43 Boeing 777 21 Boeing 767-300 16 Boeing 757-200 56 Boeing 747-400 10 Boeing 737-500 29 Boeing 737-400 21 Boeing 737-300 28 Embraer RJ-145 16 Avro RJ100 5 British Aerospace 146 12 BAe Jetstream 41 13 BAe ATP 5 ATR-72 10 de Havilland Dash-8 * Group includes BA, CityFlyer Express, Deutsche BA, BA CitiExpress. 20 Aircraft on Order 10 Airbus A321 7 Airbus A320 3 Airbus A319 Status at 31st December for information on destinations and fleet. Owned by… 100% Publicly quoted company. Owner of… 100% British Airways CitiExpress 100% Deutsche BA 18.9% Qantas Airways 18.3% Comair (South Africa) 9% Iberia Major partnerships Member of the Oneworld Alliance. Franchisees: British Mediterranean, Comair (South Africa), GB Airways, Loganair (UK), Maersk Air (UK), Regional Air (Kenya) and Sun-Air (Denmark) Various code-share agreements. Financial Results (Group, FY 31st March)
£ mill 2002/03 2001/02 Turnover 7688 8340 Operating profit/loss 295 (110) Net profit/loss 72 (142) Rod Eddington
Chief Executive

IV – 14 ASSOCIATION OF EUROPEAN AIRLINES
Review of 2002 2002 in numbers: 478 thousand tonnes of freight transported, 94% on scheduled all-cargo services, of which: 50% to the Far East, 22% on the North Atlantic (including Mid Atlantic), 9% on the South Atlantic, 13% to the African continent and the Middle East. In November 2002 Cargolux appointed Ulrich Ogiermann as President of the Executive Committee and Chief Executive Officer of the company, effective 1stJanuary 2003. In 2002 air cargo carriers were challenged by political instability, rising fuel and insurance costs, weaker consumer markets and diminished demand for automotive, high tech and telecommunications products. Nevertheless Cargolux did well, with financial results indicating a 10% increase in turnover. An operating profit of US$ 55.7 million was recorded. After taxes, net profit for 2002 stood at US$ 49.3 million, up from US$ 15.4 million. Cargolux uses twelve B747-400 freighter and 20 trucking contractors, to move valuable and time-sensitive commodities between 108 destinations, 53 served by aircraft and 55 by truck. The twelfth B747-400F to be delivered to Cargolux since 1993 arrived in August. A thirteenth B747-400F is on order for delivery in the second quarter of 2004. Flexibility is one of Cargolux’ assets and it made a number of schedule adjustments in 2002 to improve services for forwarders whose own customers were rapidly changing their logistics requirements. New destinations introduced included Budapest, Malpensa and Recife. Services to Penang were introduced in January, carrying electronics and computers from, and raw materials to, the Silicon Valley of Malaysia. From Penang, Cargolux also offers fifth freedom services to Australia and New Zealand. Hungary, enjoying a thriving high tech industry and expanding automotive production activities, led to the addition of Budapest to the Cargolux network, effective April 2002, with flights arriving from Hong Kong, Singapore, Kuala Lumpur, Bangkok and Madras. Services on other routes were adjusted, including the introduction of direct flights from Abidjan, Ivory Coast, bringing fresh fruit and fish to Europe.
Cargolux Airlines International Luxembourg Airport L-2990 Luxembourg Grand Duchy of Luxembourg www.cargolux.com Ulrich Ogiermann, President & CEO 53 Scheduled Destinations 1 within Luxembourg 8 rest of Europe 44 beyond Europe 1342 Employees 12 Aircraft in Fleet 12 Boeing 747-400F 1 Aircraft on Order 1 Boeing 747-400F Status at 31st December for information on destinations, employees and fleet. Owned by… 34.9% Luxair 33.7% SAir Lines 31.1% Luxembourg financial institutions 0.3% Others Owner of… - Major partnerships Various agreements with: China Airlines, China Eastern Airlines, Aeromexpress, Asiana, Alitalia and Pacific East Asia Cargo. Financial Results
US$ mill 2002 2001Turnover 807.5 731.1Operating profit/loss 55.7 22.3Net profit/loss 49.3 15.4
Ulrich Ogiermann President & CEO
cargolux

ASSOCIATION OF EUROPEAN AIRLINES IV - 15
Review of 2002 2002 in numbers: 1.3 million passengers transported, 85% on scheduled services, of which: 60% within Europe, 24% on Domestic routes and just under 1% to the Middle East; 3.9 thousand tonnes of freight carried on passenger services. In February 2002, Croatia Airlines introduced a new online booking service ‘FlyOnLine’, enabling passengers to book business and economy class tickets on its flights via internet. In May, Croatia Airlines marked the 10 th anniversary of its first international flight Zagreb-Frankfurt, then operated with a Boeing 737-200 purchased from Lufthansa. In April, in anticipation of increased summer demand, a 90-seater BAe 146, popularly called Jumbolino, was introduced into the fleet to operate scheduled domestic and international flights. From 1st to 31st August Croatia Airlines carried 169,800 passengers. This was the highest number of passengers carried in any month in the company’s history. In October 2001, the Croatian Transport Ministry issued the JAR 145 Certification to Croatia Airlines, authorising the company to perform maintenance work on foreign aircraft in accordance with European Aviation Standards. This was the first of such permissions to be granted in the Republic of Croatia. Subsequently the German aviation authorities authorised base and line maintenance of German aircraft at the Technical sector in Zagreb. In September 2002 Croatia Airlines and Lufthansa Technik subsequently also signed an agreement enabling Croatia Airlines’ technical sector experts to install reinforced flight deck doors on 14 Lufthansa A320 aircraft. In November Mr. Ivan Misetic, President & CEO of Croatia Airlines, became a member of the AEA Presidents’ Committee at the bi-annual meeting of the Association, held in Amsterdam.
Croatia Airlines Savska 41 10000 Zagreb Croatia www.croatiaairlines.hr Ivan , President & CEO 23 Scheduled Destinations 8 within Croatia 15 rest of Europe 0 beyond Europe 992 Employees 11 Aircraft in Fleet 3 Airbus A320-200 4 Airbus A319-100 3 ATR 42-300 1 BAe 146 0 Aircraft on Order Status at 31st December for information on destinations, employees and fleet. Owned by… 94.08% State ownership 2.44% State agency 1.65% Croatian Privatisation Fund 1.83% Other shareholders Owner of… - Major partnerships Marketing and code-share agreement with Lufthansa. Various code-share agreements with: Adria Airways, Air Bosna, Air France, Alitalia, Austrian Airlines, CSA, LOT and Turkish Airlines. Financial Results
US$ mill 2002 2001 Turnover 161.9 141.8 Operating profit/loss 16.2 8.6 Net profit/loss (3.0) (11.6)
Ivan MiseticPresident & CEO
ˇ
ˇ
'Misetic
'
'ˇ
IV – 16 ASSOCIATION OF EUROPEAN AIRLINES
Review of 2002 2002 in numbers: 3.06 million passengers transported, 92% on scheduled services, of which: 79% within Europe, 2% on Domestic routes, 5% on the North Atlantic, 5% to North Africa and the Middle East and less than 1% to the Far East; 14.6 thousand tonnes of freight carried on passenger services. In 2002 CSA exceeded the level of 3 million passengers transported, a growth of 6.5% compared to 2001. The transport of freight and mail also increased. These good results should be seen in the context of the negative effect of the August floods in the Czech Republic, which brought a significant drop in tourist arrivals in the latter part of the year. At the start of the Summer 2002 timetable, CSA offered two new destinations – Venice in Italy and Cologne/Bonn in Germany and from Winter season 2002/2003 flights to Colombo in Sri Lanka via Dubai were introduced. Frequencies to London, Paris and Madrid were increased. New destinations planned for 2003 are Cork in Ireland, Edinburgh in Scotland and Tallinn in Estonia. The CSA fleet includes A310-300s, utilised for long-haul services, with the backbone of the fleet consisting of Boeing 737, -400 and -500 variants, operating on European routes and to the Middle East. The ATR aircraft are used for short-haul and domestic flights. In early 2003 the company announced the expansion of the fleet by Summer 2003 by four aircraft: one Airbus 310-300, one Boeing 737-400 and two Boeing 737-500, which will bring the fleet total to 35 aircraft. In 2003 CSA celebrates its 80 th anniversary. The company’s first flight took place on 29 th October 1923 with an Aero A-14 Brandenburg bi-plane flight from Prague to Kbely.
Czech Airlines Head Office Ruzyne Airport 160 08 Prague 6 Czech Republic ww.czech-airlines.com Miroslav Kula, President, CEO, Chairman of the Board 62 Scheduled Destinations 4 within the Czech Republic 47 rest of Europe 11 beyond Europe 4556 Employees 31 Aircraft in Fleet 2 Airbus A310-300 10 Boeing 737-500 10 Boeing 737-400 4 ATR-72 5 ATR-42 4 Aircraft on Order 1 Airbus A310-300 2 Boeing 737-500 1 Boeing 737-400 Status at 31st December for information on destinations and fleet. Owned by… 56.43% Czech National Property Fund 34.59% Czech Consolidation Bank 4.33% Czech investor
(Ceská pojitovna a.s.) 2.94% City of Prague 0.98% City of Bratislava 0.49% Shares for Endowment Fund 0.24% National Property Fund of
the Slovak Republic Owner of… - Major partnerships Member of the SkyTeam Alliance. Various agreements with: Air France, Aeroflot, Aeromexico, Aerosvit Airlines (Ukraine), Air Malta, Alitalia, Austrian Airlines Group, Croatia Airlines, Delta Air Lines, KLM, LOT, Lufthansa, Malev, Olympic Airways, TAROM and Turkish Airlines. Financial Results
USD mill 2002 2001 Turnover 463.9 Operating profit/loss 25.7 Net profit/loss 14.6 7.8
Miroslav Kula President, CEO,
Chairman of the Board
ˇ
ˇ
ASSOCIATION OF EUROPEAN AIRLINES IV - 17
Review of 2002 2002 in numbers: 1.65 million passengers transported, 99% on scheduled services, of which: 86% within Europe, 12% to the Middle East and 1% to North Africa; 16.4 thousand tonnes of freight carried on passenger services. The indication of financial results for the Cyprus Airways Group for the financial year ending 31st December 2002, shows a net profit after tax of CY£ 10.7 million (€ 18 million), compared to CY£ 2.4 million (€ 4 million) in 2001. Turnover increased by 4% to CY£ 185 million. Passenger numbers transported by Cyprus Airways in 2002 increased by some 9% over 2001. In October 2002 Cyprus Airways announced the creation of a new airline in Greece, to benefit from the anticipated increase in traffic associated with the 2004 Olympic Games. The new airline, Hellas Jet, is 49% owned by Cyprus Airways, 51% by Greek private investors. The company will start operations in June 2003 and will fly to four European destinations – Brussels, London, Zurich and Paris - using three Airbus A320 aircraft. In the fleet Cyprus Airways saw the addition of a new aircraft type, the A319 aircraft, with deliveries in April and one in July 2002. At 31st December 2002 the fleet also included one leased-in 295-seater A330-200s, seven A320 and one A320 formerly operated by 100% owned subsidiary Eurocypria returned to the fleet (early 2003), four Airbus A310 which are due to be withdrawn by April 2003. An additional A330 is to be leased in with effect from April 2003. In April 2003, Haris A. Loizides resigned as Chairman of the company. By June a new Board of directors was appointed, with Constantinos Loizides as Cyprus Airways’ new Chairman.
Cyprus Airways Ltd 21 Alkeou Street 2404 Engomi P.O. Box 21903 1514 Nicosia Cyprus www.cyprusair.com.cy Constantinos Loizides, Chairman 35 Scheduled Destinations 2 within Cyprus 24 rest of Europe 9 beyond Europe 2126 Employees 15 Aircraft in Fleet 1 Airbus A330-200 8 Airbus A320-200 2 Airbus A319-100 4 Airbus A310-200 1 Aircraft on Order 1 Airbus A330-200 Status at 31st December for information on destinations, employees and fleet. Owned by… 69.62% State ownership 30.38% Private shareholders Owner of… 100% Eurocypria 49% Hellas Jet Major partnerships Various code-share agreements with: Aeroflot, Alitalia, El Al, Gulf Air, KLM and Syrian Arab Airlines. Financial Results (Group)
CY£ ‘000 2002* 2001 Turnover 185432 178268 Operating profit/loss 11063 8511 Net profit/loss 10714 2376
*preliminary
Constantinos Loizides Chairman
IV – 18 ASSOCIATION OF EUROPEAN AIRLINES
Review of 2002 2002 in numbers: 7.1 million passengers transported, 82% on scheduled services, of which: 41% within Europe, 33% on Domestic routes, 2% on the North Atlantic and 6% to the Far East; 49 thousand tonnes of freight carried on passenger services. Finnair’s campaign of capacity adjustment and cost-cutting resulted in improved financial results in 2002, with net profit for the Finnair Group at € 36.8 million in 2002. Finnair airline recorded a net profit of € 53.9 million, up from € 8.5 million. Growth in traffic to and from Asia contributed to the results. Besides Tokyo and Singapore already served, 2002 saw the introduction of a new service to Hong Kong and increased frequencies to Bangkok and Beijing. The Far East now accounts for close on 6% of all Finnair passengers, up from 3% in 2001. New start-up services to Shanghai and Osaka are scheduled for 2003. Aero Airlines, established in Estonia, made its maiden flight in March 2002, flying Helsinki-Tallinn. Aero Airlines, which is 49% owned by Finnair Group, is scheduled to take over certain domestic routes from Finnair in 2003. In November a new, third, runway was inaugurated at Helsinki-Vantaa Airport. In 2002 Finnair expanded its code-share agreement with fellow Oneworld Alliance partner British Airways, and entered new agreements with SN Brussels Airlines and Swiss. In the fleet, Finnair have a fifth MD11 on order, for service on the long-haul routes. The Airbus fleet for use on European and domestic routes, saw the arrival of 5 A320s in 2002. By the end of 2003 there should be a total of 24 Airbus aircraft in the fleet, offering crew and operational flexibility with capacity varying between 123-182 seats.
Finnair Oy P.O. Box 15 01053 Finnair Finland www.finnair.com Keijo Suila, President & CEO 54 Scheduled Destinations 16 within Finland 33 rest of Europe 5 beyond Europe 7381 Employees 59 Aircraft in Fleet 4 Airbus A321-200 7 Airbus A320-200 6 Airbus A319-100 7 Boeing 757-200 8 MD83 6 MD82 4 MD11 8 Douglas DC9-51 9 ATR-72 12 Aircraft on Order 2 Airbus A321-200 5 Airbus A320-200 4 Airbus A319-100 1 MD11 Status at 31st December for information on destinations, employees and fleet. Owned by… 66% Public bodies (state, local
government, employment pension funds)
8% Foreign investors 7% Financial institutions &
insurance companies 7% Registered in nominee name 7% Private individuals 4% Private companies 1% Associations Owner of… 49% Aero Airlines (Estonia) Major partnerships Member of the Oneworld Alliance. Various code-share agreements, with: Aero Airlines, Air China, Air France, City Airline, CSA, Golden Air (Sweden), Lithuanian Airlines, LOT, Malev, SN Brussels Airlines, Sun Air, SWISS, TAP, Ukraine International Airlines. Financial Results (Group)
€ mill 2002 2001 Turnover 1639.9 1631.0 Operating profit/loss 60.0 13.3 Net profit/loss 36.8 7.1
Keijo Suila President & CEO

ASSOCIATION OF EUROPEAN AIRLINES IV - 19
Review of 2002 2002 in numbers: 23.9 million passengers transported on scheduled services, of which: 54% on Domestic routes, 33% within Europe, 12% across the Atlantic and 1% to the African continent and the Middle East; 180 thousand tonnes of freight carried, 12% on all-cargo services. In 2002 Iberia results presented a strong turnaround, with operating profit up from € 5 million in 2001 to € 249 million in 2002. Net profit reached € 160 million, compared to € 53 million in the previous year. The results followed the implementation of the airline’s crisis programme in 2001, which included cuts in capacity on offer, a reduction of some 2,500 in staff numbers, the temporary suspension of all wet lease agreements and the postponement of future aircraft deliveries. At year end Iberia’s board approved the strategic objectives for the 2003-2005 period. The strategic objectives of consolidating profitability, achieving growth with flexibility and boosting productivity are keyed to the challenges and opportunities foreseen in the next three years, such as the opening of new runways at Madrid and Barcelona airports, the new passenger terminal at Madrid-Barajas, and the advent of a high-speed train service between Madrid and Barcelona. In April 2002 Iberia sold Binter Canarias, the leading passenger airline of the Canary Islands, 100% owned by Iberia. The company had already sold its other 100% owned company, Binter Mediterraneo to its regional franchisee Iberia Regional/Air Nostrum in 2001. Both sales form part of the strategy of strengthening the mother company’s core business lines. November 2002 brought the delivery of an additional Airbus A321, now numbering five in the fleet. In the course of the year, all Airbus A300s were retired from service. Over the next few years the fleet will be expanded and modernised.
Líneas Aéreas de España SA Calle Velazquez 130 28006 Madrid Spain www.iberia.com Fernando Conte, Chairman & CEO 97 Scheduled Destinations 33 within Spain 34 rest of Europe 30 beyond Europe 25692 Employees (Group) 145 Aircraft in Fleet 17 Airbus A340-300 5 Airbus A321-200 55 Airbus A320-200 4 Airbus A319-100 18 Boeing 757-200 3 Boeing 747-300 5 Boeing 747-200 12 MD88 24 MD87 2 DC8F 14 Aircraft on Order 12 Airbus A340-600 2 Airbus A320 Status at 31st December for information on destinations, employees and fleet. Owned by… 60% Floating 30% Banks and various companies 9% British Airways 1% American Airlines Owner of… - Major partnerships Member of the Oneworld Alliance. Franchisee: Iberia Regional/Air Nostrum Various code-share agreements with: Aer Lingus, Air France, El Al, LOT, Royal Air Maroc, Royal Jordanian, SWISS, Syrian Arab Airlines, TAP, TAROM , Ukraine International Airlines. Financial Results (Group)
€ mill 2002* 2001 Turnover 4700 4738 Operating profit/loss 249 5 Net profit/loss 160 53
* estimates
Fernando Conte Chairman & CEO

IV – 20 ASSOCIATION OF EUROPEAN AIRLINES
Review of 2002 2002 in numbers: 1.4 million passengers transported, 86% on scheduled services, of which: 63% within Europe and 23% on the North Atlantic; 31 thousand tonnes of freight carried, 69% on all-cargo services. The on-going reforms of the Flugleidir/Icelandair Group saw the implementation of a new organisational structure. It addition to the subsidiaries set up in recent years to handle cargo, charter/leasing and ground services, a dedicated subsidiary, Icelandair ehf., was set up at the end of 2002 to handle scheduled international flights, as well as companies to deal with financial services and aircraft maintenance. With effect from the beginning of 2003, the Icelandair parent company Flugleidir is a holding company whose main focus is to generate returns on shareholder capital, investing primarily in companies which are active in flight operations, (Icelandair, Icelandair Cargo and Air Iceland), the travel industry and transportation. The strategic plan implemented in 2001-2002 reaped rewards, with good financial results posted in 2002. The Group recorded a net profit (after tax) of ISK 2611 million (€ 30 million). In the network, regular services operated year-round to Copenhagen, Oslo, Stockholm, London, Glasgow, Amsterdam, Frankfurt and Paris. In winter a sizeable reduction was made in flights to continental Europe, where flight frequency had been sustained to a considerable extent by North Atlantic passengers. In Summer 2002 Icelandair also flew to Milan and Barcelona. On the North Atlantic, the relative importance of the route area was reduced, with services to Boston, Baltimore and Minneapolis operated year-round, while Winter services to New York were discontinued. As before, Orlando was only served in Winter. With the introduction of a Boeing 757-300 in March, Icelandair became the first carrier in the world to operate all models of the 757 simultaneously. At year-end the fleet consisted of thirteen jets, eight of the jets being deployed on scheduled services within the route network, two on cargo flights for Icelandair Cargo and three for Icelandair Charter and Leasing on projects outside Iceland. A further seven turboprops are operated by regional operator Air Iceland.
Icelandair Reykjavik Airport 101 Reykjavik Iceland www.icelandair.com Sigurdur Helgason, President & CEO 23 Scheduled Destinations 4 within Iceland 14 rest of Europe 5 beyond Europe 2181 Employees (Group) 13 Aircraft in Fleet 1 Boeing 757-300 10 Boeing 757-200 1 Boeing 757-200F 1 Boeing 737-300F 0 Aircraft on Order Status at 31st December for information on destinations, employees and fleet. Owned by… 100% Fully Privatised Owner of… Flugleider hf. Holding company is owner of the following airline operations: 100% Icelandair 100% Icelandair Cargo 100% Air Iceland Major partnerships Code-share agreements with SAS. Financial Results (Group)
ISK mill 2002 2001 Turnover 38945 37971 Operating profit/loss 3873 (765) Net profit/loss 2611 (1212)
Sigurdur Helgason President & CEO

ASSOCIATION OF EUROPEAN AIRLINES IV - 21
Review of 2002 2002 in numbers: 1.08 million passengers transported, 91% on scheduled services, of which: 59% within Europe, 26% on Domestic routes, 3% to North Africa and 3% to the Middle East; 3.8 thousand tonnes of freight carried on passenger services. For the first time after many years, last year JAT showed positive business results in the number of passengers carried on its international flights, especially on its European destinations. As a result, JAT leased-in one B-737-300 aircraft, to supplement the 22 aircraft already in the fleet. The so-called ‘Serbian air traffic development program’ is oriented towards establishing Belgrade Airport as crossroads of the corridors between the East and West, benefiting from Belgrade and Serbia & Montenegro’s geo-strategic location. JAT for its part, is re-establishing traffic with countries that sprang up from former Yugoslav republics, Bosnia, Croatia,... At the end of 2002 services to Slovenia and Albania were resumed, with the possibility of returning to Pristina being explored. JAT has also initiated cooperation with carriers in the Balkan. JAT is heading towards the inevitable process of transition, namely privatisation, fleet renewal, streamlining of operations... Furthermore, JAT has evolved a Business Plan up to the 2007 aimed at meeting the needs of passengers and adapting to European standards. JAT forecasts a further growth of the number of passengers at an average rate of 9 % annually, whereby JAT should reach 1,700,000 of carried passengers by the year 2007. The purchase of new generation aircraft remains a priority for the future. As a system, JAT owns a Flight Academy, Maintenance Workshops, Training Centre, Catering, Agricultural (General) Aviation, hotels in downtown Belgrade, an in-house tour-operator Air-Lift. It is expected that these will be privatised in the forthcoming period, with the contribution of either domestic or foreign investments. In 2003 the company will launch a new corporate logo and has changed its name from JAT Yugoslav Airlines to JAT Airways.
JAT Airways 16 Bulevar umetnosti 11070 Novi Beograd Yugoslavia www.jat.com Predrag Vujovic, President 37 Scheduled Destinations 3 within Yugoslavia 27 rest of Europe 7 beyond Europe 4952 Employees 22 Aircraft in Fleet 10 Boeing 737-300 2 Boeing 727-200 1 Douglas DC10-30 6 Douglas DC9-30 3 ATR-72 8 Aircraft on Order 8 Airbus A319-100 Status at 31st December for information on destinations, employees and fleet. Owned by… 100% State ownership Owner of… - Major partnerships Code-share agreements with Adria Airways and CSA Czech Airlines. Financial Results
YUN mill 2002 2001 Turnover 9895 8364 Operating profit/loss (522) (616) Net profit/loss (522) (616)
Predrag VujovicPresident
'
'

IV – 22 ASSOCIATION OF EUROPEAN AIRLINES
Review of 2002 2002 in numbers: 20 million passengers transported on scheduled services, of which: 67% within Europe, 10% on the North Atlantic, 5% on the Mid and South Atlantic, 10% to the African continent and Middle East and 8% to the Far East; 522 thousand tonnes of freight carried, 14% on all-cargo services. For the fiscal year ending 31st March 2003, KLM posted a negative operating income of € 113 million, compared to an operating loss of € 94 million in the previous year. Net loss for the year stood at € 416 million. In particular the latter months of the year saw pressures on revenues and declining demand, which resulted in capacity modifications and a commitment to further cost management for the future. In 2002 KLM reviewed its no-frills strategy, culminating in January 2003 with the sale to Ryanair of its 100% shareholding in buzz. Transavia, the 80% owned leisure carrier, and its activities under the Basiq Air label, will continue to represent the Group in the no-frills sector. In the course of 2002 the company embarked on several new code-share agreements with, amongst others, TAM of Brazil to Buenos Aires from November, Comair of South Africa on routes to Durban and Port Elizabeth, effective January 2003 and with Spanish airliner Air Europa from July 2002. An agreement has also been signed with the French Railways SNCF offering passengers a single ticket journey by high-speed rail from several French cities to Charles de Gaulle airport with onward flight to Amsterdam and beyond. KLM’s order for Boeing 747-400 ER freighters, Boeing 777-200 ER and Airbus A330-200 during 2002 marked the start of an extensive intercontinental fleet renewal. At the end of March 2003 the three freighters were delivered to KLM Cargo. The A330 will be the first aircraft from this manufacturer in the KLM fleet, with delivery from 2005.
KLM P.O. Box 7700 Schiphol Airport 1117ZL The Netherlands www.klm.nl Leo M. van Wijk, President & CEO 136 Scheduled Destinations 4 within the Netherlands 67 rest of Europe 65 beyond Europe 33038 Employees (Group) 156 Aircraft in Fleet 103 of which KLM 12 Boeing 767-300 5 Boeing 747-400 17 Boeing 747-400 Combi 3 Boeing 747-300 8 Boeing 747-300 Combi 2 Boeing 747-300F 4 Boeing 737-900 13 Boeing 737-800 14 Boeing 737-400 15 Boeing 737-300 10 MD11 32 of which KLM cityhopper 20 Fokker 70 12 Fokker 50 21 of which KLM uk 15 Fokker 100 6 Fokker 50 19 Aircraft on Order 6 Airbus A330-200 10 Boeing 777-200 3 Boeing 747-400F Status at 31st December for information on destinations and fleet. Owned by… 100% Publicly quoted company Owner of… 100% KLM cityhopper 100% KLM uk 80% Transavia Airlines 50% Martinair 26% Kenya Airways Major partnerships KLM-Northwest Alliance. Various agreements with e.g. AlaskaAirlines, Aer Lingus, China SouthernAirlines, Comair, Continental, CSA,Cyprus Airways, KLM exel, Maersk Air,MAS, Malev, Meridiana, SurinamAirways, TAM, TNT, Nippon Cargo. Financial Results (Group, FY 31st March)
€ mill 2002/03 2001/02 Turnover 6485 6532 Operating profit/loss (133) (94) Net profit/loss (416) (156)
Leo M. van Wijk President & CEO
WO
RLDWIDE
RE
L I A B I L I TY
NORTHWEST

ASSOCIATION OF EUROPEAN AIRLINES IV - 23
Review of 2002 2002 in numbers: 3.27 million passengers transported, 89% on scheduled services, of which: 55% within Europe, 20% on Domestic routes, 13% on the North Atlantic and 1% to the Middle East; 17.1 thousand tonnes of freight carried on passenger services. With the prospect of joining the Star Alliance in 2003, the ascension of Poland to the European Union in 2004 as well as a possible stock market floatation in the same year, LOT embarked on a deep restructuring program in 2002. A revision of the route network, significant reductions in costs and an improvement in yields meant that by year-end the company reported a net profit of € 29.1 million, compared to a net loss of € 120.8 million in 2001. Revenues in core business activities increased by 12% over 2001, whilst operating costs were reduced by 7%. In 2002 LOT increased the number of passengers transported by 5%. With a reduction in offer of close to 11%, load factors improved significantly. This was the result of a greater tailoring of the company activities to market needs, the implementation of a flexible pricing policy, the growing efficiency of the LOT hub at Okecie Airport in Warsaw coupled with expanding co-operation with other carriers to Poland, especially Lufthansa and Austrian Airlines. On 1st September 2002, LOT and SN Brussels Airlines of Belgium took up membership of the AEA. In the fleet, LOT has bought 18 new aircraft over the last two years and has plans to place an order for up to ten 70-seater aircraft. In the course of 2002 the ATR 42 aircraft of the -300 variant in the fleet were replaced by the -500 variant. LOT currently operates a fleet of 5 wide-body B767, 19 single aisle B737 and 14 regional Embraer RJ-145 jets and 13 ATRs.
LOT Polish Airlines ul.17 Stycznia 39 00-906 Warszawa Poland www.lot.com Marek Grabarek, President & CEO 58 Scheduled Destinations 13 within Poland 40 rest of Europe 5 beyond Europe 3800 Employees 51 Aircraft in Fleet 3 Boeing 767-300 2 Boeing 767-200 10 Boeing 737-500 7 Boeing 737-400 2 Boeing 737-300 14 Embraer RJ-145 8 ATR-72 5 ATR-42 0 Aircraft on Order Status at 31st December for information on destinations and fleet. Owned by… 67.96 State treasury 25.10 SAir Lines 6.94 Employees Owner of… 100% EuroLot Major partnerships Member of the Star Alliance from 2003. Various code-share agreements with: American Airlines, Austrian Airlines, bmi, CSA, Finnair, Lufthansa, SN Brussels Airlines. Financial Results
€ mill 2002 2001 Turnover 702.6 663.2 Operating profit/loss 28.6 (173.4) Net profit/loss 29.1 (120.8)
Marek Grabarek President & CEO
'

IV – 24 ASSOCIATION OF EUROPEAN AIRLINES
Review of 2002 2002 in numbers: 44 million passengers transported on scheduled services, of which: 46% within Europe, 32% on Domestic routes, 11% across the Atlantic, 4% to the African continent and the Middle East and 7% to the Far East; 1047 thousand tonnes of freight carried, 56% on all-cargo services. On 14th May the Star Alliance celebrated its 5th anniversary. In April the cargo alliance between Lufthansa Cargo, SAS Cargo and Singapore Airlines Cargo, adopted a new name ‘WOW’, and were joined by Japan Airlines Cargo in July. Lufthansa and Shanghai Airlines agreed to closer co-operation in several areas. Along with Air China, Shanghai Airlines offers the potential of Lufthansa connecting flights within China. Lufthansa and LOT Polish Airlines, signed a strategic co-operation agreement in September. Eurowings announced its entry into the ‘no-frills’ market, with the creation of ‘Germanwings’, which will operate alongside Eurowings in transporting regional traffic. In the first international ‘travel bank’ arrangement, Lufthansa started Frankfurt to Portland, Oregon services. Generally a ‘travel bank’ consists of local businesses and industry working together, often through the local Chamber of Commerce, to entice a new air carrier or service to their region. From the Summer timetable Lufthansa returned 18 aircraft withdrawn from service after September 11th, to the fleet, including three A340 and 13 short-haul aircraft. Wolfgang Mayrhuber, was elected as successor to Jürgen Weber as Chairman and CEO of Lufthansa, effective June 2003.
Deutsche Lufthansa AG 2-6 Von-Gablenz-Strasse 50679 Cologne Federal Republic of Germany www.lufthansa.com Wolfgang Mayrhuber, Chairman & CEO 170 Scheduled Destinations 19 Germany / 71 Europe / 80 beyond 39822 Employees 384 Aircraft in Fleet (Group) 225 of which Lufthansa 28 / 6 Airbus A340-300 / -200 26 Airbus A321 33 Airbus A320 16 Airbus A319 6 Airbus A310-300 13 Airbus A300-600 30/2 Boeing 747 -400/-200 30/35 Boeing 737-500/-300 73 of which LH CityLine 11/44 Canadair CRJ -700/ -100/200 18 Avro RJ85 22 of which LH Cargo 8 Boeing 747-200F 14 MD11F 64 of which Team LH 1 Boeing 737-700 8/6 ATR 42-500/200 / ATR 72 8 BAe 146 9 Canadair CRJ-100 20 de Havilland Dash-8 1 Embraer RJ-145 2 Fairchild Dornier 328 9 Fokker 50 44 Aircraft on Order 35 of which Lufthansa 15 Airbus A380 10 Airbus A340 -600 10 Airbus A330 9 of which LH CityLine 9 Canadair CRJ-700 Owned by… 89.95% Free float 10.05% Public sector Owner of… 100% Lufthansa Cargo 100% Lufthansa CityLine 98.8% Air Dolomiti 30% bmi 24.9% Eurowings 13% Luxair 10% Condor Major partnerships Member of the Star Alliance. Franchisees (Team Lufthansa): Augsburg Airways, Cimber Air, Cirrus Airlines, Contact Air, Rheintalflug. Code-share agreements: Adria Airways, Air China, Air Dolomiti, Air One, Croatia Airlines, CSA, Eurowings, Luxair, Maersk Air, SAA. Financial Results (Group)
€ mill 2002 2001 Turnover 16971 16690 Operating profit/loss 1592 (316) Net profit/loss 717 (633)
Wolfgang Mayrhuber Chairman & CEO

ASSOCIATION OF EUROPEAN AIRLINES IV - 25
Review of 2002 2002 in numbers: 1.15 million passengers transported, 78% on scheduled services within Europe; 0.21 thousand tonnes of freight carried on passenger services. Despite the difficult economic context and fierce competition in the Luxembourg catchment area, Luxair was able to end the financial year 2002 with a positive net profit totalling € 29.6 million. The substantial increase in freight handling volume at the Luxair-owned CargoCenter, increased activity of Luxair’s main partners and especially the new shareholder Panalpina, as well as a good performance by Luxair Tours contributed to the positive results of this business year. In spite of an adverse economic context, Luxair increased the number of passengers carried. This result was achieved through the enhancement of the network: new destinations were added and frequency was increased in several cities. Luxair managed to increase its market share at Luxembourg Airport from 68% in 2001 to 75% in 2002. The Luxair Group also includes tour operators, Luxair Tours and Happy Summer, transporting passengers on chartered holiday flights to the Mediterranean, Canary Islands, Madeira and North Africa. In December Luxair announced the signing of a share sales agreement between Luxair and Panalpina World Transport of Basle. Subject to statuary approval from the State of Luxembourg and the Luxair Board of Directors, Panalpina will join the institutional shareholders of Luxair, being the Luxembourg State, the state-owned Banque et Caisse d’Epargne de l’Etat, the Dexia Banque Internationale of Luxembourg, the Banque Générale du Luxembourg and the Deutsche Lufthansa AG. Panalpina is a leading provider of intercontinental airfreight and sea freight forwarding and transportation. In the fleet one Fokker 50 was removed in 2002, whilst an order was placed with the Boeing Company for two Boeing 737-700 jetliners, with an option for an additional two aircraft of the same type.
Luxair Luxembourg Airport 2987 Luxembourg www.luxair.lu Christian Heinzmann, President & CEO 57 Scheduled Destinations 1 within Luxembourg 50 rest of Europe 6 beyond Europe 2184 Employees 16 Aircraft in Fleet 3 Boeing 737-500 2 Boeing 737-400 3 Fokker 50 8 Embraer RJ-145 2 Aircraft on Order 2 Boeing 737-700 Status at 31st December for information on destinations, employees and fleet. Owned by… 37.3% Private Companies 23.1% State ownership 13.4% State-owned bank 13.2% Luxair Group and others 13.0% Lufthansa Owner of… 34.88% Cargolux Major partnerships Various agreements with: Air France, Austrian Airlines Group, Finnair, Lufthansa and VLM. Financial Results (Group)
€ mill 2002 2001 Turnover 302.0 282.6 Operating profit/loss 13.3 11.7 Net profit/loss 29.6 20.3
Christian Heinzmann President & CEO

IV – 26 ASSOCIATION OF EUROPEAN AIRLINES
Review of 2002 2002 in numbers: 2.32 million passengers transported, 90% on scheduled services, of which: 80% within Europe, 5% on the North Atlantic, 4% to the Middle East and 1% to Northern Africa; 10.4 thousand tonnes of freight carried on passenger services. Malev reported an operating loss of HUF 4.3 billion (€ 16.9 million) in 2002 which is a significant improvement compared to the operating loss of HUF 11.2 billion (€ 44.1 million) in 2001. The improvement was the result of on-going reorganisation efforts designed to return the company to a healthy growth path. External factors such as fuel price and USD exchange rate followed a favourable trend in 2002 which is also reflected in the results. As part of the reorganisation process Malev developed a new strategy which aims to transform the company to one of the leading carriers in Central-Eastern-Europe. To fulfill this objective the company started to redesign its network and opened four new regional destinations, namely Odessa, Venice, Bologna and Timisoara. In June a new subsidiary - Malev Express - was launched to support the regional expansion. Malev also signed a deal with Bombardier to supply the company with regional aircraft. In 2002 two Canadair CRJ-200 aircraft joined the fleet, operated by Malev Express; a further two are on order. Both new destinations and new regional aircraft showed promising results, although in the introductory phase the cost of market development had a negative financial impact on the company. In 2003 Malev will continue its regional expansion and will introduce new destinations to its network. In parallel the reorganisation will continue to improve the efficiency of the operation and to prepare for the increased competition expected as Hungary joins the European Union in 2004. In 2002, the code-share market changed, with numerous new code-share agreements signed, with: Aeroflot, Air Bosna, Air Europe, Balkan Air. With partners KLM and Northwest the existing code-sharing co-operation was extended to additional destinations. In 2003 Mr. László Sándor was elected as the new Chairman of the Board and CEO of the company.
Malev Hungarian Airlines Roosevelt tér 2 1051 Budapest V Hungary www.malev.hu László Sándor, Chairman & CEO 44 Scheduled Destinations 1 within Hungary 37 rest of Europe 6 beyond Europe 2922 Employees 25 Aircraft in Fleet 2 Boeing 767-200 2 Boeing 737-500 6 Boeing 737-400 7 Boeing 737-300 6 Fokker 70 2 Canadair CRJ-200 20 Aircraft on Order 5 Boeing 737-800 7 Boeing 737-700 6 Boeing 737-600 2 Canadair CRJ-200 Status at 31st December for information on destinations, employees and fleet. Owned by… 97.9% State privatisation and assets
handling company 1.2% Municipalities 0.9% Private shareholders and other
organisations Owner of… 100% Malev Express Major partnerships Marketing agreements with KLM and Northwest Airlines. Various code-share agreements with: Air Bosna, Aeroflot, Aerosvit Airlines (Ukraine), Air Europa, Air France, Alitalia, Austrian Airlines, Balkan Air, CSA, Finnair, KLM, LOT, Northwest Airlines, SWISS and TAROM. Financial Results
HUF bn 2002 2001 Turnover 108.9 108.6 Operating profit/loss (4.3) (11.2) Net profit/loss (2.3) (7.5)
László Sándor, Chairman & CEO

ASSOCIATION OF EUROPEAN AIRLINES IV – 27
Review of 2002 2002 in numbers: 3.4 million passengers transported, 98% on scheduled services, of which: 89% on Domestic routes and 9% within Europe; 2.1 thousand tonnes of freight carried on passenger services. 2002 saw a thorough restructuring of Meridana’s route network. With demand still low following 11th September and the aircraft disaster in Linate, Winter season, up to March 2002, saw a reduction of 25% in seat capacity on offer. At the start of the Summer season the network was again reviewed, with services to some routes terminated. In order to recover traffic and strengthen Meridiana’s position in the market, strong marketing campaigns were put in place in 2002, including special fares for indigenous inhabitants of Sicily, Sardinia and Campina. A new EC/Government rule is applied on the routes from the airports of Cagliari, Alghero and Olbia to the destinations Rome and Milan that assigns the 6 routes to 3 different carriers, for a period of at least two, and possibly three years. Under this rule, known as ‘Territorial Continuity’, Meridiana loses the Cagliari-Milan route and gains routes from Olbia to Milan and Rome. In 2002 established code-share agreements with Alitalia and KLM were joined by new agreements, with Italian carrier Panair on the route Rome-Palermo in March and later in the year, with another Italian airline, Air Industria, flying its three ATRs to and from Naples. At the end of the Summer season the Mount Etna volcano became active, forcing all carriers to divert scheduled services away from Catania during a two month period, which obviously impacted on Winter traffic figures.
Meridiana S.p.A Centro Direzionale Aeroporto Costa Smeralda 07026 Olbia (SS) Italy www.meridiana.it Giovanni Sebastiani, Managing Director
& CEO 26 Scheduled Destinations 22 within Italy 4 rest of Europe 0 beyond Europe 1393 Employees 21 Aircraft in Fleet 17 MD82 4 BAe 146-200 0 Aircraft on Order Status at 31st December for information on destinations, employees and fleet. Owned by… 57.19% Interprogramme Holding SA 17.59% Aga Khan SA 16.10% Meridiana employees 7.90% Financial institutions 1.22% Others Owner of… - Major partnerships Code-share agreements with: Air Industria (Italy), Alitalia, Alpi Eagles, KLM and Panair (Italy). Financial Results
€ mills 2002 2001 Turnover 358.6 366.5 Operating profit/loss (1.9) (15.4) Net profit/loss 0.4 (10.2)
Giovanni Sebastiani Managing Director & CEO

IV - 28 ASSOCIATION OF EUROPEAN AIRLINES
Review of 2002 2002 in numbers: 5.7 million passengers transported, 98% on scheduled services, of which: 51% on Domestic routes, 38% within Europe, 3% on the North Atlantic, 5% to Africa and the Middle East and 1% to the Far East; 35 thousand tonnes of freight carried on passenger services. The implementation of the plan to turn the company around which had been drawn up after 11th September, 2001 continued through 2002. The main aims and thrust of the plan comprised the following: Withdrawal from all non-financially viable routes; stringent measures to lower fixed costs; further cuts in the number of personnel; re-negotiation of existing aircraft leases and adoption and implementation of more aggressive marketing policies and practices. The company expects to post a financial result close to break-even for the year 2002. The Greek State, sole owner of Olympic Airways, will continue with the restructuring of the company and the eventual establishment of an entirely new legal entity (‘New Olympic Airways’) to replace the existing one, which will operate entirely according to free market principles. In the network the termination of the Athens-Bangkok-Melbourne-Sydney-Athens route was noteworthy, in line with the stated objectives of the restructuring plan. The ongoing fleet rationalisation continued through 2002. An additional 148-seater Boeing 737-300 joined the fleet, whilst all 737-200s were retired from the fleet. Olympic Airways was named the ‘Official Carrier’ for the 2004 Olympic Games which will be held in Athens.
Olympic Airways 96-100 Syngrou Avenue Athens 11741 Greece www.olympic-airways.gr Dionyssis Kalophonos, Chairman & CEO 45 Scheduled Destinations 10 within Greece 23 rest of Europe 12 beyond Europe 5027 Employees 47 Aircraft in Fleet 22 of which Olympic Airways 4 Airbus A340-300 3 Airbus A300-600 13 Boeing 737-400 2 Boeing 737-300 22 of which Olympic Aviation 3 Boeing 717-200 7 ATR-72 6 ATR-42 6 Fairchild Dornier 228 3 of which Macedonian Airlines 3 Boeing 737-400 0 Aircraft on Order Status at 31st December for information on destinations, employees and fleet. Owned by… 100% State ownership Owner of… 100% Olympic Aviation 99.9% Macedonian Airlines Major partnerships Code-share agreement with AeroSvit, Air Malta, CSA Czech Airlines, Egyptair, Kuwait Airways, TAP. Financial Results
€ mill 2002 2001 Turnover Operating profit/loss Net profit/loss
Dionyssis Kalophonos Chairman & CEO

ASSOCIATION OF EUROPEAN AIRLINES IV – 29
Review of 2002 2002 in numbers: 23.1 million passengers transported, 99% on scheduled services, of which: 51% within Europe, 42% on Domestic routes within each of the three countries Norway, Sweden and Denmark, 4% on the North Atlantic and 2% to the Far East; 129 thousand tonnes of freight carried, 10% on all-cargo services. Effective 1st July 2002 the SAS Group was restructured to comprise five business areas, of which two - ‘Scandinavian Airlines’ (including SAS Commuter) and ‘Subsidiary and Affiliated Airlines’ - provide airline transport services. Subsidiaries include 100% owned Braathens and Air Botnia, 99.4% owned Widerøe and 74% owned Spanair. The Affiliated airlines are airBaltic, Air Greenland, Skyways and bmi. All figures and information provided in this Yearbook refer to Scandinavian Airlines. In March the EU Commission gave its approval for the SAS Group increase of its stake to 74% in another AEA member airline, Spanair. By year-end the company’s stake in Widerøe had increased from 63.3% to 99.4%. In the second quarter of 2002, SAS implemented a new share issue of SEK 200 million as the final step in the introduction of a single share. In April Scandinavian Airlines and Braathens coordinated their route networks for Norwegian domestic traffic. Total fleet for Scandinavian Airlines stood at 199 units at the end of 2002. The long-term planned renewal of the fleet is almost complete, with just 10 aircraft remaining on the order books. Early in 2002 the A340 aircraft was phased in on all the company’s routes to Asia. Three additional A340 joined the fleet in 2002, coming to a total of 7 aircraft. In October the company’s first Airbus A330-300, for deployment on North Atlantic routes, was delivered.
SAS Frösundaviks Allé 1 19587 Stockholm Sweden www.scandinavian.net Jørgen Lindegaard, President & CEO Sören Belin, COO Sandinavian Airlines 86 Scheduled Destinations 40 within Scandinavia 38 rest of Europe 8 beyond Europe 7566 Employees 199 Aircraft in Fleet 7 Airbus A340-300 2 Airbus A330-300 8 Airbus A321-200 9 Boeing 767-300 19 Boeing 737-800 6 Boeing 737-700 30 Boeing 737-600 8 MD90-30 15 MD87 2 MD83 32 MD82 15 MD81 5 DC-9-41 24 deHavilland Q400 3 Embraer RJ-145 7 Fokker 50 7 Fokker 28 10 Aircraft on Order 2 Airbus A330-300 4 Airbus A321-200 4 Boeing 737-800 Status at 31st December for information on destinations, employees and fleet. Owned by… 50% Private interests 21.4% Swedish State 14.3% Danish State 14.3% Norwegian State Owner of… 100% Air Botnia (Finland) 100% Braathens (Denmark) 99.4% Widerøe’s Flyveselskap(Norway) 74% Spanair 47.2% airBaltic (Latvia) 37.5% Air Greenland 26% Cimber Air (Denmark) 25% Skyways (Sweden) 20% bmi Major partnerships Member of the Star Alliance. Various agreements with: Air Canada, AUA, bmi, Lufthansa, Mexicana, United Airlines, Varig. Financial Results
SEK mill 2002 2001 Turnover 37163 41166 Operating profit/loss 1613 (430) Net profit/loss (1032) (1499)
Jørgen Lindegaard President & CEO

IV – 30 ASSOCIATION OF EUROPEAN AIRLINES
Review of 2002 2002 in numbers: 7.3 million passengers transported, 70% on scheduled services, of which: 62% on Domestic routes, 8% within Europe, and with limited traffic on Mid Atlantic, South Atlantic and to Africa; 8.3 thousand tonnes of freight carried. Spanair significantly improved its results during 2002 despite weak market development. Domestic scheduled traffic is the biggest business area for Spanair. As in other European countries, the overall Spanish domestic market declined in 2002 compared to previous year. Spanair nevertheless maintained its passenger volume and increased market share by cancelling unprofitable routes and moving capacity to markets with higher volumes and better profit potential. New European routes to Spanair´s partner’s home markets in Scandinavia, Germany and Austria were successfully inaugurated. Spanair ceased its intercontinental operations as of March 2002, substituted by code-share co-operations. Spanair started in the charter business in 1988. The operation is performed by a dedicated fleet of charter configured aircraft with additional capacity deployed from scheduled aircraft at peak times. With Spain as the base, more than 100 destinations are served mainly in Scandinavia, UK, Ireland and Italy. The on-going fleet renewal focuses on optimizing synergies between charter and scheduled operations. Spanair joined Star Alliance in April 2003.
Spanair Edificio Spanair Palma de Mallorca Airport 0700 Palma de Mallorca Spain www.spanair.com Gonzalo Pascual Arias, Executive President & Chairman of the Board Enrique Meliá, CEO 32 Scheduled Destinations 21 within Spain 8 rest of Europe 3 beyond Europe 2854 Employees 54 Aircraft in Fleet 50 of which Spanair 4 Airbus A321 6 Airbus A320 3 Boeing 767 3 MD87 23 MD83 11 MD82 4 of which AeBal 4 Boeing 717 10 Aircraft on Order 2 Airbus A321 8 Airbus A320 Status at 31st December for information on destinations, employees and fleet. Owned by… 51% Spanair Holding 49% SAS Owner of… 100% AeBal Major partnerships Member of the Star Alliance in 2003. Various agreements with: Air Canada, Aerolíneas Argentinas, Austrian Airlines Group, Cubana de Aviación, Lufthansa, PGA Portugalia Airlines, Regional Airlines (Morocco), SAS, United Airlines and Varig (Brazil). Financial Results
€ mill 2002 2001 Turnover 783.4 783.6 Operating profit/loss (17.3) (121.2) Net profit/loss (25.8) (49.0)
Gonzalo Pascual Arias Executive President & Chairman of the Board
Enrique Meliá CEO

ASSOCIATION OF EUROPEAN AIRLINES IV - 31
Review of 2002 2002 in numbers: 2.34 million passengers on scheduled services, of which 92% within Europe, 8% to Sub-Saharan Africa; 7.8 thousand tonnes of freight carried. DAT, which operated a fleet of 32 BAe and Avros from Brussels on a wet lease basis, started operations serving European destinations under its own name on 10th November 2001, following the bankruptcy of Sabena, its main customer. A few weeks later DAT and Virgin Express concluded a code-share agreement which will terminate in March 2003. A new identity and trade name - ‘SN Brussels Airlines’ – were launched in February 2002. Rob Kuijpers’ team was joined by Peter Davies as CEO on 1st May. In April SN Brussels Airlines started operations to Africa with two (three as from June) Airbus 330 wet leased from Birdy. By year-end 13 African destinations were being served, representing for some points the only direct link to Europe. The continuously expanding portfolio of services to European destinations is complemented with code-share agreements with Alitalia, British Airways, CSA Czech Airlines, Finnair, Gandalf Airlines, Iberia, LOT and SWISS. In February 2003, a code-share agreement was signed with American Airlines of the US. Three Airbus 319 will be added to the fleet in March 2003 at the end of the code-share agreement with Virgin Express. While keeping costs strictly under control, SN Brussels Airlines managed to continuously improve revenue performance through 2002. On 1st September 2002 SN Brussels Airlines joined AEA.
SN Brussels Airlines Delta Air Transport nv/sa trading as SN Brussels Airlines The Corporate Village Da Vinci laan 9 1930 Zaventem Belgium www.flysn.com Rob Kuijpers, Executive Chairman Peter Davies, CEO 52 Scheduled Destinations 1 within Belgium 38 rest of Europe 13 beyond Europe 1846 Employees 38 Aircraft in Fleet 3 Airbus A330 3 Airbus A319
(to enter service 31st March ’03) 12 Avro RJ100 14 Avro RJ85 6 BAe 146 0 Aircraft on Order Status at 31st December for information on destinations, fleet and employees. Owned by… 78% SN Air Holding 22% SIC Owner of… - Major partnerships Code-share agreements: Alitalia, American Airlines, British Airways, CSA, Finnair, Gandalf, Iberia, LOT, SWISS. Financial Results
€ mill 2002 2001 Turnover 464.9 188.7 Operating profit/loss (102.5) (52.6) Net profit/loss (36.8) (207.2)
Rob Kuijpers Executive Chairman
Peter Davies CEO

IV – 32 ASSOCIATION OF EUROPEAN AIRLINES
Review of 2002 2002 in numbers: 11.3 million passengers transported on scheduled services, of which: 72% within Europe, 8% on Domestic routes and 9% across the Atlantic, 4% to the African continent, 3% to the Middle East and 5% to the Far East; 198 thousand tonnes of freight carried on passenger services. On April 1st 2002, when Swissair discontinued its operations, SWISS expanded its former operations as regional carrier Crossair: new aircraft were leased or purchased and more than 6000 new staff were recruited. Within 4 months SWISS obtained all required new traffic rights and airport slots and fulfilled the requirements for an extension of its Air Operator Certificate to include Airbus A-320 and long-haul operations. Contracts with all service suppliers were negotiated under new terms and three new collective labour agreements were concluded. The company formally adopted its new name Swiss International Air Lines Ltd. on July 1st 2002. In November SWISS and American Airlines were granted U.S. antitrust immunity allowing them to embark on a comprehensive business co-operation, a process which had started with the conclusion of a code-share agreement in May. In the fourth quarter SWISS also announced the first step of a financial and product improvement programme labelled ‘Destination Excellence’. The programme aims at achieving an improvement of the financial results by reducing the fleet by one Boeing MD-11 and Airbus A-320 aircraft each and three 50-seater regional aircraft, operating a reduced charter fleet of four Airbus A-320 aircraft instead of seven Boeing MD-83 aircraft and by making improvements in the in-flight product. Before year-end all major shareholders of SWISS, both private and public, agreed to extend the lock-up period for the sale of their shares in the company until August 2004.
Swiss International Air Lines Ltd 4002 Basel Switzerland www.swiss.com Pieter Bouw, Chairman of the Board André Dosé, President & CEO 117 Scheduled Destinations 6 within Switzerland 70 rest of Europe 41 beyond Europe 11425 Employees 135 Aircraft in Fleet 13 Airbus A330-200 8 Airbus A321 11 Airbus A320 7 Airbus A319 7 MD83 13 MD11 15 Avro RJ100 4 Avro RJ85 25 Embraer RJ-145 29 Saab 2000 3 Saab 340 76 Aircraft on Order 12 Airbus A340-300 4 Airbus A320 30 Embraer RJ-195 30 Embraer RJ-170 Status at 31st December for information on destinations, employees and fleet. Owned by… 64.1% Institutional investors 20.4% Swiss Confederation 12.2% Cantons and communities 3.3% Private individuals Owner of… 70% Europe Continental Airways
(ECA) ‘Crossair Europe’ Major partnerships Code-sharing with American Airlines, El Al, Finnair, Iberia, Malaysian Airline System, Financial Results (Group)
CHF mill 2002 2001Turnover 4395 1385Operating profit/loss (909) (299)Net profit/loss (980) (342)
Pieter Bouw Chairman of the Board
André Dosé President & CEO

ASSOCIATION OF EUROPEAN AIRLINES IV - 33
Review of 2002 2002 in numbers: 5.4 million passengers transported on scheduled services, of which: 55% within Europe, 26% on Domestic routes, 3% on the North Atlantic, 1% on the Mid Atlantic, 9% on the South Atlantic and 5% to Sub-Saharan Africa; 49 thousand tonnes of freight carried on passenger services. On a turnover up 5.5% over 2001, TAP airline posted a positive operating result of € 11.4 million. The net result (after taxes) closed at € 19 million down, compared to a deeper loss of € 66 million in 2001. The Group registered an operating profit of close to € 50 million, up from € 20 million in the previous year, with net result a small loss of € 6 million compared to the 2001 loss of € 44 million. For TAP, 2002 was designated ‘The Customer’s Year’, characterised by several initiatives to optimise customer service and satisfaction. In April, TAP entered into a code-share agreement with SATA, the airline company of the Azores, on the Lisbon-Funchal-Lisbon route. In June TAP and Iberia established a bilateral co-operation including code-share operations to twenty-one domestic and European destinations. A block space agreement with Ukraine International Airlines in October enabled the first direct flight link between Lisbon and Kiev. In 2002 TAP consolidated its position in the Brazilian market, offering on average 28 direct flights from Lisbon to Rio de Janeiro, Sao Paulo, Fortaleza, Recife and Salvador da Bahia. Passenger numbers were up 27% compared to 2001. In the fleet TAP took delivery of its third A321, completing the company’s medium-haul fleet renewal program.
TAP Air Portugal Apartado 50194 1704-801 Lisbon Portugal www.tap.pt António Cardoso e Cunha, Chairman Fernando Pinto, CEO 36 Scheduled Destinations 7 within Portugal 15 rest of Europe 14 beyond Europe 8200 Employees 36 Aircraft in Fleet 4 Airbus A340-300 3 Airbus A321-200 8 Airbus A320-200 16 Airbus A319-100 5 Airbus A310-300 0 Aircraft on Order Status at 31st December for information on destinations, employees and fleet. Owned by… 100% State ownership Owner of… 51% YES Charter Airlines 40% Air Sao Tome e Principe 15% Air Macau via SEAP holding
company (in which TAP holds 75%).
Major partnerships Various agreements with: American Airlines, bmi, Iberia, LAM (Mozambique), Olympic Airways, PGA Portugalia Airlines, SATA (Air Azores), TACV-Transportes Aereos de Cabo Verde. Financial Results
€ mill 2002 2001 Turnover 1084.7 1027.9 Operating profit/loss 11.4 (6.1) Net profit/loss (19.4) (66.0)
António Cardoso e Cunha Chairman
Fernando Pinto CEO

IV – 34 ASSOCIATION OF EUROPEAN AIRLINES
Review of 2002 2002 in numbers: 1.11 million passengers transported, 83% on scheduled services, of which: 57% within Europe, 8% on Domestic routes, 12% to the African continent and the Middle East, 5% on the North Atlantic and 1% to the Far East; 3.9 thousand tonnes of freight carried on passenger services. The year 2002 saw the beginning of a new restructuring process at TAROM, focusing on the adaptation to new technological and marketing requirements such as the use of internet for ticket sales. The company succeeded in halving its operating loss in 2002, ending the year on an estimated net loss – after taxes – of US$ 21.4 million. The operating loss was halved, to minus US$ 13.4 million on a turnover of US$ 192.5 million. In its network, TAROM expanded its partnership with new code-share arrangements with LOT Polish Airlines and Syrian Air. A code-share agreement was also set up with Angel Airlines, a private airline set up in late 2001 offering predominantly domestic Romanian and some regional services on 18-seater Jetstream 32 aircraft. Alexandru Szlivka, who succeeded Nicolae Demetriade in October 2002, was himself succeeded by Ioan
as President and CEO of TAROM, from February 2003.
TAROM – Romanian Air Transport Ploiesti Road 16.5 Km Otopeni Airport Bucharest Romania www.tarom.ro Ioan Lixandru, President & CEO 48 Scheduled Destinations 11 within Romania 27 rest of Europe 10 beyond Europe 2645 Employees 18 Aircraft in Fleet 2 Airbus A310-300 2 Boeing 737-700 7 Boeing 737-300 7 ATR 42-500 2 Aircraft on Order 2 Boeing 737-700 Status at 31st December for information on destinations, employees and fleet. Owned by… 90.59% State ownership 4.85% International Airport Bucharest-
Otopeni 4.11% Romanian Air Traffic Services 0.28% SIF Muntenia (private
financial institution society)
0.17% Romanian Civil Aviation Authority
Owner of… - Major partnerships Various code-share agreements with: Aeroflot, Air France, Alitalia, Angel Airlines, Austrian Airlines, CSA, Iberia, LOT, Malev and Syrian Air. Financial Results
US$ milll 2002* 2001 Turnover 192.5 192.3 Operating profit/loss (13.4) (26.5) Net profit/loss (21.4) (38.3)
* estimate
Ioan Lixandru President & CEO
Lixandru

ASSOCIATION OF EUROPEAN AIRLINES IV - 35
Review of 2002 2002 in numbers: 10.4 million passengers transported, 96% on scheduled services, of which: 48% on Domestic routes, 34% within Europe, 2% on the North Atlantic, 7% to Africa and the Middle East and 5% to the Far East; 119 thousand tonnes of freight carried, 7% on all-cargo services.
Turkish Airlines operates a network of 103 destinations, serving 26 points in Turkey from its mainbases in Istanbul and Ankara, 46 other destinations in Europe and 31 long-haul destinations. New introductions in 2002 included services to Pristina, the capital of Kosovo. In the fleet Turkish Airlines took delivery of two additional Boeing 737-800, bringing the total for this aircraft type in the fleet to twenty-six. At year-end 2002 the fleet counted 66 aircraft, consisting of 11 wide-body Airbus aircraft, 42 narrow-body Boeing aircraft and 11 Avro regional jets. In a reshuffle of the management at Turkish Airlines in early 2003 Abdurrahman Gündogdu took up the position of President and Chairman of the Board of Turkish Airlines.
Türk Hava Yollari A.O. Genel Müdürlük Binasi Atatürk Havalimani 34830 Yesilköy Istanbul Turkey www.turkishairlines.com Abdurrahman Gündogdu, President
& Chairman of the Board 103 Scheduled Destinations 26 within Turkey 46 rest of Europe 31 beyond Europe 10984 Employees 66 Aircraft in Fleet 7 Airbus A340-300 5 Airbus A310-300 26 Boeing 737-800 2 Boeing 737-500 14 Boeing 737-400 9 Avro RJ-100 3 Avro RJ-70 0 Aircraft on Order Status at 31st December for information on destinations, employees and fleet. Owned by… 98.2% State-owned Privatisation
Administration 1.8% Private investors Owner of… 100% THY SRL 50% Sun Express Major partnerships Code-share agreements with American Airlines. Financial Results
TRL tn 2002 2001 Turnover 1935.4 Operating profit/loss Net profit/loss 19.9
Abdurrahman Gündogdu President & Chairman
IV - 36 ASSOCIATION OF EUROPEAN AIRLINES
Review of 2002 2002 in numbers: 3.81 million passengers transported on scheduled services, of which 71% on the North Atlantic, 8% on Mid Atlantic, 9% to Sub-Saharan Africa and 11% to the Far East; 123 thousand tonnes of freight carried on passenger services. After the events of 11th September 2001, Virgin Atlantic acted immediately to realign its business to meet the new demands of the marketplace. With the support of a £25 million investment injection from the shareholders, the company was able to build on the gradual improvements in market conditions to strengthen growth and profitability, resulting in an estimated £10 million pre-tax profit for the financial year ending 30th April 2003. During 2002 Virgin Atlantic Airways opened a new hangar at London’s Heathrow Airport. The hangar, which is double the size of a football pitch, is able to accommodate the new addition to the fleet, the Airbus A340-600, and will allow Virgin Atlantic to complete much of its engineering work in-house. The A340-600, for which Virgin Atlantic Airways was launch customer, made its inaugural flight in Virgin Atlantic service at the Farnborough Air Show in July 2002. This 311-seater, is also the longest airplane in the world. At year-end the Virgin Atlantic Airways fleet included four A340-600, ten A340-300 and twelve 747-400. During the running financial year, 1st May 2003 to 30th April 2004, three Airbus A340-600 and one Boeing 747-400 will be delivered. Early in 2003 Virgin Atlantic Airways introduced a new service from London Gatwick to Port Harcourt in Nigeria, the first ever direct to this destination from the United Kingdom. This was followed in May 2003 by a new service to Grenada and Tobago in the Caribbean. Towards the end of the year, December 2003, Virgin Atlantic will launch a new Manchester to Barbados service.
Virgin Atlantic Airways The Office Manor Royal Crawley, West Sussex RH10 9NU Great Britain www.virgin-atlantic.com Sir Richard Branson, Chairman Steve Ridgway, CEO 22 Scheduled Destinations 3 within the United Kingdom 0 rest of Europe 19 beyond Europe 6671 Employees 26 Aircraft in Fleet 4 Airbus A340-600 10 Airbus A340-300 12 Boeing 747-400 12 Aircraft on Order 6 Airbus A380 5 Airbus A340-600 1 Boeing 747-400 Status at 31st December for information on destinations, employees and fleet. Owned by… 49% Singapore Airlines Owner of… - Major partnerships Various agreements with: Air India, bmi, Continental Airlines, Malaysian Airline System, Singapore Airlines. Financial Results (Group, FY ending 30th April)
£ mill 2002/03 2001/02 Turnover Operating profit/loss Net profit/loss* 10 (92)
*pre-tax, 2002/03 preliminary
Sir Richard Branson Chairman
Steve Ridgway CEO

ASSOCIATION OF EUROPEAN AIRLINES V - 1
CONTENTS
SECTION I AEA AIRLINES IN 2002 I-1
At a Glance I-2Welcome to Virgin Atlantic Airways I-4 The Global Economic Environment I-5
Traffic Development 2002 I-7 ‘No-frills’ carriers l-8
Spotlight on the North Atlantic I-10 Spotlight on the Far East I-11 Operating Results 2002 I-12
Punctuality Performance I-14
SECTION II OUTLOOK FOR 2003 II-1 The Story so Far.. II-2 Traffic Development II-3
Operating Results II-4
SECTION III LOOKING FORWARD III-1 Towards an Efficient European Air Transport System III-2
Are Air Transport Networks Sustainable? III-4 Improving the Industry’s Regulatory Framework III-5
The Dynamics of the Value Chain III-6 A transatlantic Open Aviation Area ? III-7 Bilateral Agreements – Where now ? III-8
Denied Boarding Compensation III-9 External Shocks – Security and Insurance III-10
SECTION IV SPOTLIGHT ON THE AEA IV-1
AEA Highlights IV-3 Airline Profiles & Review of 2002 IV-6
SECTION V KEY STATISTICS V-1 Key Statistics - Total AEA V-2 Key Statistics - By Carrier V-4
AEA Fast Facts V-11 What do we mean by…? V-12
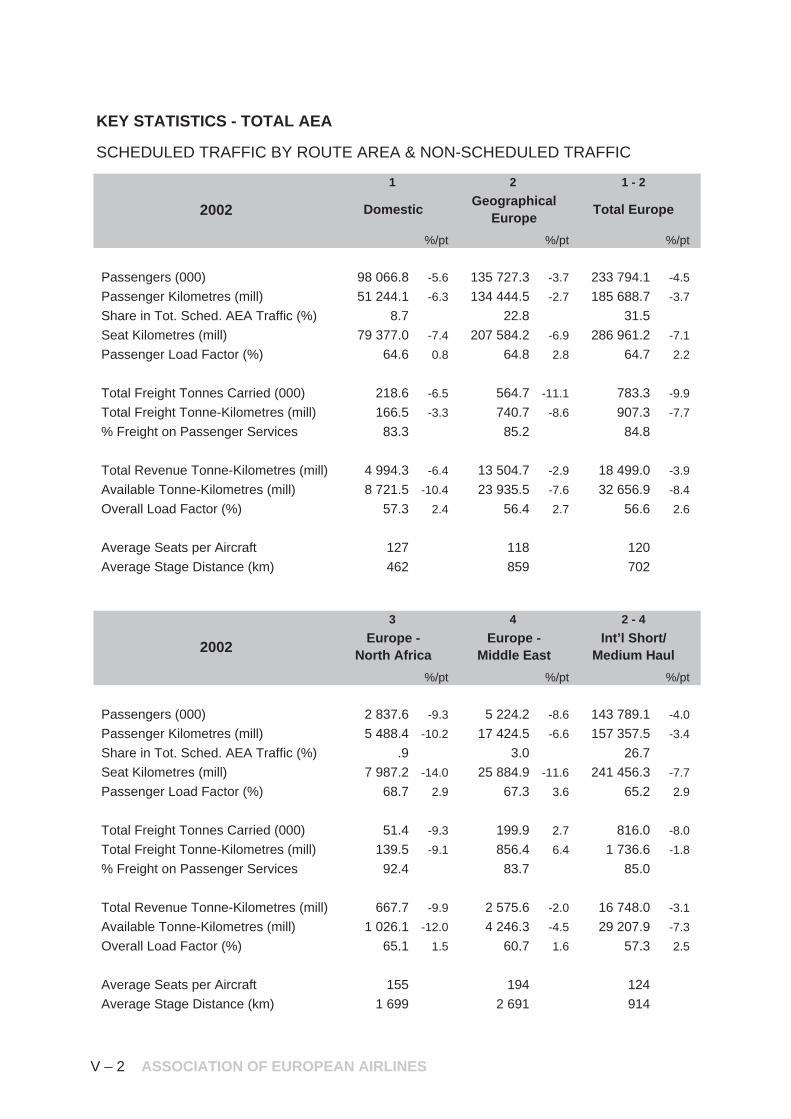
KEY STATISTICS - TOTAL AEA
2002
%/pt %/pt %/pt
2001 DO EU ET
Passengers (000) 98 066.8 -5.6 135 727.3 -3.7 233 794.1 -4.5
Passenger Kilometres (mill) 51 244.1 -6.3 134 444.5 -2.7 185 688.7 -3.7
Share in Tot. Sched. AEA Traffic (%) 8.7 22.8 31.5
Seat Kilometres (mill) 79 377.0 -7.4 207 584.2 -6.9 286 961.2 -7.1
Passenger Load Factor (%) 64.6 0.8 64.8 2.8 64.7 2.2
Total Freight Tonnes Carried (000) 218.6 -6.5 564.7 -11.1 783.3 -9.9
Total Freight Tonne-Kilometres (mill) 166.5 -3.3 740.7 -8.6 907.3 -7.7
% Freight on Passenger Services 83.3 85.2 84.8
Total Revenue Tonne-Kilometres (mill) 4 994.3 -6.4 13 504.7 -2.9 18 499.0 -3.9
Available Tonne-Kilometres (mill) 8 721.5 -10.4 23 935.5 -7.6 32 656.9 -8.4
Overall Load Factor (%) 57.3 2.4 56.4 2.7 56.6 2.6
Average Seats per Aircraft 127 118 120
Average Stage Distance (km) 462 859 702
2002
%/pt %/pt %/pt
NF EM IE
Passengers (000) 2 837.6 -9.3 5 224.2 -8.6 143 789.1 -4.0
Passenger Kilometres (mill) 5 488.4 -10.2 17 424.5 -6.6 157 357.5 -3.4
Share in Tot. Sched. AEA Traffic (%) .9 3.0 26.7
Seat Kilometres (mill) 7 987.2 -14.0 25 884.9 -11.6 241 456.3 -7.7
Passenger Load Factor (%) 68.7 2.9 67.3 3.6 65.2 2.9
Total Freight Tonnes Carried (000) 51.4 -9.3 199.9 2.7 816.0 -8.0
Total Freight Tonne-Kilometres (mill) 139.5 -9.1 856.4 6.4 1 736.6 -1.8
% Freight on Passenger Services 92.4 83.7 85.0
Total Revenue Tonne-Kilometres (mill) 667.7 -9.9 2 575.6 -2.0 16 748.0 -3.1
Available Tonne-Kilometres (mill) 1 026.1 -12.0 4 246.3 -4.5 29 207.9 -7.3
Overall Load Factor (%) 65.1 1.5 60.7 1.6 57.3 2.5
Average Seats per Aircraft 155 194 124
Average Stage Distance (km) 1 699 2 691 914
Europe - North Africa
3
SCHEDULED TRAFFIC BY ROUTE AREA & NON-SCHEDULED TRAFFIC
DomesticGeographical
EuropeTotal Europe
1 2 1 - 2
Europe - Middle East
Int’l Short/ Medium Haul
4 2 - 4
V – 2 ASSOCIATION OF EUROPEAN AIRLINES

%/pt %/pt %/pt %/pt
NA MA SA AF
23 956.7 -8.6 5 474.9 -2.0 2 925.6 -7.9 6 695.0 7.4
163 905.2 -8.7 41 666.4 -3.2 25 013.3 -13.0 44 029.8 2.6
27.8 7.1 4.2 7.5
204 959.3 -15.2 52 968.6 -2.2 32 872.6 -15.5 57 675.2 4.6
80.0 5.7 78.7 -0.8 76.1 2.2 76.3 -1.5
1 280.5 -8.1 156.3 -1.4 202.8 -6.7 350.7 9.5
9 173.7 -5.8 1 287.3 -0.8 1 664.8 -13.5 2 515.0 9.0
70.6 79.9 51.9 58.9
25 125.5 -7.9 5 221.6 -2.8 4 053.3 -13.3 6 752.4 4.4
35 457.0 -12.2 7 863.2 -0.2 6 225.7 -11.6 9 872.5 6.0
70.9 3.3 66.4 -1.8 65.1 -1.3 68.4 -1.1
272 329 262 295
6 335 6 246 6 505 4 975
%/pt %/pt %/pt %/pt
AE IC TO CT
12 642.9 0.1 52 018.7 -3.8 293 874.7 -4.5 8 865.5 5.3
106 804.9 -1.0 381 746.6 -5.1 590 348.2 -4.8 19 638.1 7.9
18.1 64.7 100.0
132 671.2 -5.8 481 610.3 -9.3 802 443.6 -8.7 24 302.2 9.3
80.5 3.9 79.3 3.5 73.6 3.0 80.8 -1.1
1 546.5 3.4 3 537.6 -1.4 4 572.2 -2.9 55.0 26.4
14 005.6 4.7 28 647.4 0.0 30 550.6 -0.1 395.2 26.7
36.5 52.3 54.3 8.4
24 496.0 2.4 65 679.6 -3.1 87 421.9 -3.3 2 231.9 12.6
32 117.5 -3.1 91 577.6 -6.3 129 507.0 -6.8 3 230.5 14.1
76.3 4.1 71.7 2.4 67.5 2.5 69.1 -0.9
290 284 188 173
6 537 6 142 1 184 1 762
8
Europe - Far East/Australasia
Total Long Haul Total Scheduled Non-Scheduled
9 5 - 9 1 - 9
Europe - Sub Saharan Africa
6 75
North Atlantic Mid Atlantic South Atlantic
ASSOCIATION OF EUROPEAN AIRLINES V - 3
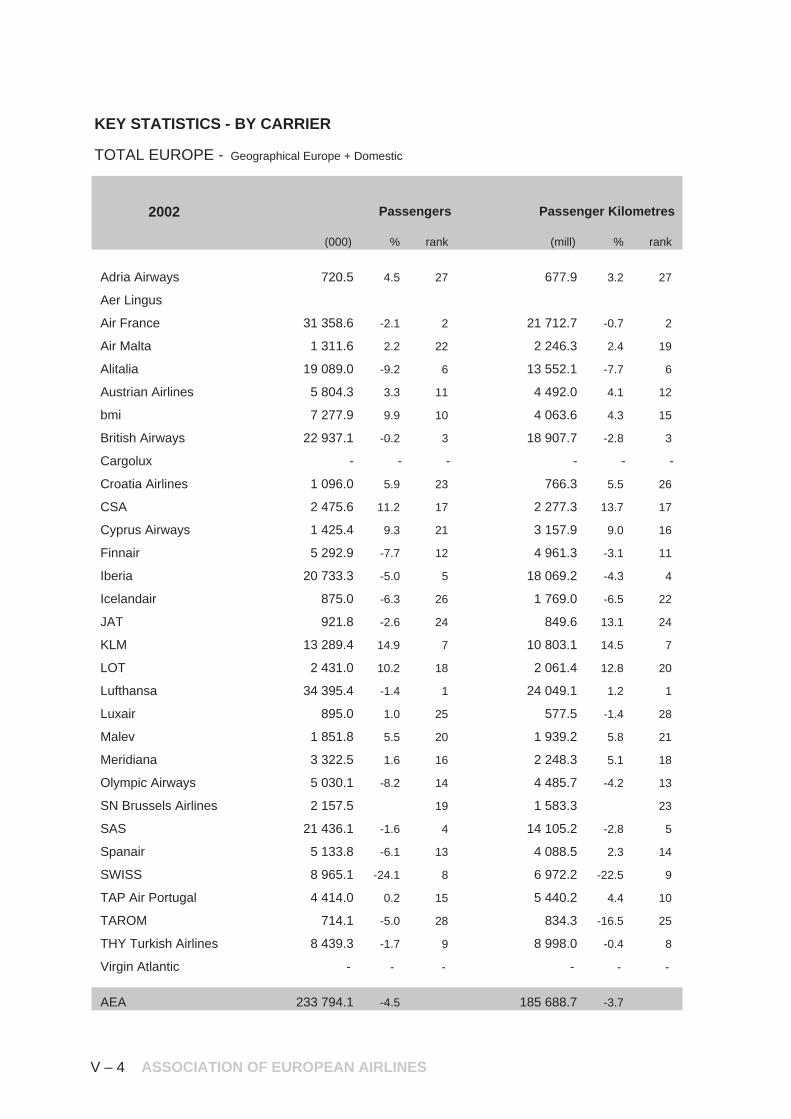
KEY STATISTICS - BY CARRIER
2002
(000) % rank (mill) % rank2001
Adria Airways 720.5 4.5 27 677.9 3.2 27
Aer Lingus
Air France 31 358.6 -2.1 2 21 712.7 -0.7 2
Air Malta 1 311.6 2.2 22 2 246.3 2.4 19
Alitalia 19 089.0 -9.2 6 13 552.1 -7.7 6
Austrian Airlines 5 804.3 3.3 11 4 492.0 4.1 12
bmi 7 277.9 9.9 10 4 063.6 4.3 15
British Airways 22 937.1 -0.2 3 18 907.7 -2.8 3
Cargolux - - - - - -
Croatia Airlines 1 096.0 5.9 23 766.3 5.5 26
CSA 2 475.6 11.2 17 2 277.3 13.7 17
Cyprus Airways 1 425.4 9.3 21 3 157.9 9.0 16
Finnair 5 292.9 -7.7 12 4 961.3 -3.1 11
Iberia 20 733.3 -5.0 5 18 069.2 -4.3 4
Icelandair 875.0 -6.3 26 1 769.0 -6.5 22
JAT 921.8 -2.6 24 849.6 13.1 24
KLM 13 289.4 14.9 7 10 803.1 14.5 7
LOT 2 431.0 10.2 18 2 061.4 12.8 20
Lufthansa 34 395.4 -1.4 1 24 049.1 1.2 1
Luxair 895.0 1.0 25 577.5 -1.4 28
Malev 1 851.8 5.5 20 1 939.2 5.8 21
Meridiana 3 322.5 1.6 16 2 248.3 5.1 18
Olympic Airways 5 030.1 -8.2 14 4 485.7 -4.2 13
SN Brussels Airlines 2 157.5 19 1 583.3 23
SAS 21 436.1 -1.6 4 14 105.2 -2.8 5
Spanair 5 133.8 -6.1 13 4 088.5 2.3 14
SWISS 8 965.1 -24.1 8 6 972.2 -22.5 9
TAP Air Portugal 4 414.0 0.2 15 5 440.2 4.4 10
TAROM 714.1 -5.0 28 834.3 -16.5 25
THY Turkish Airlines 8 439.3 -1.7 9 8 998.0 -0.4 8
Virgin Atlantic - - - - - -
AEA 233 794.1 -4.5 185 688.7 -3.7
Passengers Passenger Kilometres
TOTAL EUROPE - Geographical Europe + Domestic
V – 4 ASSOCIATION OF EUROPEAN AIRLINES

2002
(mill) % rank (%) pt rank
1 206.9 8.1 27 56.2 -2.6 23 Adria Airways
Aer Lingus
33 405.2 -0.6 2 65.0 0.0 9 Air France
3 214.2 7.5 22 69.9 -3.5 4 Air Malta
20 854.9 -8.0 6 65.0 0.3 10 Alitalia
7 433.5 1.6 12 60.4 1.5 20 Austrian Airlines
6 492.4 0.7 15 62.6 2.2 15 bmi
28 105.3 -10.3 3 67.3 5.1 7 British Airways
- - - - - - Cargolux
1 406.2 0.7 24 54.5 2.5 26 Croatia Airlines
3 530.5 14.5 19 64.5 -0.5 12 CSA
4 242.5 4.9 16 74.4 2.8 1 Cyprus Airways
8 604.0 -8.8 10 57.7 3.4 22 Finnair
26 268.1 -6.4 4 68.8 1.5 5 Iberia
2 526.4 -8.2 23 70.0 1.3 3 Icelandair
1 401.5 9.9 25 60.6 1.7 19 JAT
14 517.7 7.8 7 74.4 4.4 2 KLM
3 781.1 -9.2 17 54.5 10.6 25 LOT
36 836.2 -4.7 1 65.3 3.8 8 Lufthansa
1 080.2 -0.8 28 53.5 -0.3 27 Luxair
3 263.3 -2.0 21 59.4 4.4 21 Malev
3 585.7 -7.2 18 62.7 7.3 14 Meridiana
7 168.7 -6.1 13 62.6 1.3 16 Olympic Airways
3 494.7 20 45.3 28 SN Brussels Airlines
22 348.6 -9.7 5 63.1 4.5 13 SAS
6 677.3 -0.1 14 61.2 1.4 17 Spanair
12 415.2 -19.8 9 56.2 -2.0 24 SWISS
8 433.7 7.5 11 64.5 -1.9 11 TAP Air Portugal
1 369.8 -22.6 26 60.9 4.4 18 TAROM
13 297.7 -4.8 8 67.7 3.0 6 THY Turkish Airlines
- - - - - - Virgin Atlantic
286 961.2 -7.1 64.7 2.2 AEA
Available Seat Kilometres Passenger Load Factor
ASSOCIATION OF EUROPEAN AIRLINES V - 5

2002
(000) % rank (mill) % rank
Adria Airways 720.5 4.5 29 677.9 3.2 28
Aer Lingus
Air France 43 421.2 0.9 2 98 508.3 2.8 2
Air Malta 1 399.0 -0.4 23 2 305.5 -0.4 23
Alitalia 21 860.7 -10.8 6 29 617.6 -18.0 6
Austrian Airlines 7 070.3 0.8 11 13 794.3 -2.1 11
bmi 7 486.6 11.2 10 5 303.0 16.9 15
British Airways 34 008.9 -1.6 3 99 123.2 -4.1 1
Cargolux - - - - - -
Croatia Airlines 1 104.6 6.2 25 784.4 6.4 27
CSA 2 800.6 9.4 19 3 841.1 7.7 18
Cyprus Airways 1 641.9 9.2 22 3 275.4 8.7 19
Finnair 5 838.3 -5.4 12 8 462.3 6.7 13
Iberia 23 888.1 -4.4 4 40 464.3 -2.3 5
Icelandair 1 198.9 -11.7 24 3 187.6 -14.2 20
JAT 987.2 -0.8 26 972.5 16.9 26
KLM 19 956.2 8.5 7 59 181.3 0.3 4
LOT 2 892.8 8.3 18 5 165.7 5.1 16
Lufthansa 43 915.2 -0.4 1 93 642.6 2.5 3
Luxair 895.0 1.0 28 577.5 -1.4 29
Malev 2 098.8 2.7 21 3 076.1 -1.2 21
Meridiana 3 322.5 1.6 17 2 248.3 5.1 24
Olympic Airways 5 567.2 -9.2 13 7 548.1 -10.5 14
SN Brussels Airlines 2 341.8 20 2 606.1 22
SAS 22 896.4 -0.7 5 24 170.2 5.3 8
Spanair 5 162.2 -9.1 15 4 264.6 -24.7 17
SWISS 11 315.8 -27.0 8 21 828.9 -33.6 9
TAP Air Portugal 5 439.2 2.5 14 11 257.1 8.9 12
TAROM 920.4 -9.0 27 1 564.4 -15.1 25
THY Turkish Airlines 9 915.7 0.1 9 15 725.7 4.6 10
Virgin Atlantic 3 808.7 -7.2 16 27 174.0 -4.4 7
AEA 293 874.7 -4.5 590 348.2 -4.8
Passengers Passenger Kilometres
TOTAL SCHEDULED
V – 6 ASSOCIATION OF EUROPEAN AIRLINES

2002
(mill) % rank (%) pt rank
1 206.9 8.1 28 56.2 -2.6 26 Adria Airways
Aer Lingus
129 469.6 1.2 2 76.1 1.2 4 Air France
3 332.9 1.9 24 69.2 -1.6 16 Air Malta
41 694.7 -18.2 6 71.0 0.1 9 Alitalia
19 561.4 -4.7 11 70.5 1.9 12 Austrian Airlines
8 380.9 11.1 15 63.3 3.2 20 bmi
136 225.9 -8.7 1 72.8 3.5 7 British Airways
- - - - - - Cargolux
1 438.1 1.4 27 54.5 2.5 27 Croatia Airlines
5 443.9 6.3 18 70.6 0.9 11 CSA
4 479.4 4.3 21 73.1 3.0 5 Cyprus Airways
12 933.4 -1.0 13 65.4 4.7 19 Finnair
55 370.7 -5.4 5 73.1 2.3 6 Iberia
4 423.1 -15.0 22 72.1 0.7 8 Icelandair
1 663.2 13.9 26 58.5 1.5 25 JAT
73 813.7 -2.9 4 80.2 2.6 2 KLM
7 440.0 -10.8 16 69.4 10.5 14 LOT
121 458.7 -4.4 3 77.1 5.2 3 Lufthansa
1 080.2 -0.8 29 53.5 -0.3 28 Luxair
4 882.7 -8.0 20 63.0 4.3 21 Malev
3 585.7 -7.2 23 62.7 7.3 22 Meridiana
11 415.0 -12.5 14 66.1 1.5 18 Olympic Airways
5 419.3 19 48.1 29 SN Brussels Airlines
34 096.2 -4.0 7 70.9 6.3 10 SAS
7 000.5 -25.7 17 60.9 0.8 24 Spanair
31 508.2 -33.4 9 69.3 -0.2 15 SWISS
16 198.5 6.5 12 69.5 1.5 13 TAP Air Portugal
2 535.0 -17.5 25 61.7 1.8 23 TAROM
22 893.4 -4.1 10 68.7 5.7 17 THY Turkish Airlines
33 492.2 -10.2 8 81.1 4.9 1 Virgin Atlantic
802 443.6 -8.7 73.6 3.0 AEA
Available Seat Kilometres Passenger Load Factor
ASSOCIATION OF EUROPEAN AIRLINES V - 7

2002
(000) % rank (mill) % rank
Adria Airways 4.6 10.7 25 4.5 10.1 26
Aer Lingus
Air France 647.2 3.3 2 4 861.1 4.9 2
Air Malta 8.1 -14.3 23 13.6 -26.8 23
Alitalia 210.5 -7.6 6 1 389.0 -9.2 6
Austrian Airlines 71.0 2.5 12 396.0 11.3 11
bmi 18.2 7.0 17 57.6 74.2 18
British Airways 614.4 3.1 3 4 123.7 4.8 3
Cargolux 448.6 3.6 5 3 939.8 8.8 5
Croatia Airlines 3.9 -5.6 26 2.7 -2.4 28
CSA 14.6 8.2 20 27.3 5.8 21
Cyprus Airways 16.4 0.6 19 40.4 1.0 20
Finnair 48.1 10.4 14 215.2 26.1 13
Iberia 179.6 -8.2 8 792.8 -6.4 9
Icelandair 30.9 -18.3 16 90.9 -17.7 15
JAT 3.8 8.0 28 4.4 10.2 27
KLM 521.9 2.6 4 3 992.3 2.9 4
LOT 17.1 -4.6 18 66.7 -2.6 17
Lufthansa 1 028.2 -2.7 1 7 166.7 -0.1 1
Luxair 0.2 -21.1 30 0.2 5.6 30
Malev 10.4 -29.5 21 25.2 -31.6 22
Meridiana 2.1 -22.3 29 1.4 -22.1 29
Olympic Airways 34.9 -12.9 15 79.8 -16.0 16
SN Brussels Airlines 7.8 24 46.1 19
SAS 129.2 6.9 9 701.5 13.0 10
Spanair 8.3 1.2 22 11.3 -56.9 24
SWISS 197.7 -29.6 7 1 027.8 -32.1 7
TAP Air Portugal 49.1 -8.3 13 194.1 -6.5 14
TAROM 3.8 -11.6 27 8.4 -5.9 25
THY Turkish Airlines 118.7 13.4 11 375.6 10.8 12
Virgin Atlantic 122.9 -8.7 10 894.6 -6.1 8
AEA 4 572.2 -2.9 30 550.6 -0.1
TOTAL SCHEDULED - Passenger & All-Cargo Services
Freight Tonnes Carried Freight Tonne-Kilometres
V – 8 ASSOCIATION OF EUROPEAN AIRLINES

2002
(mill) % rank (mill) % rank
65.5 3.7 29 131.8 8.1 29 Adria Airways
Aer Lingus
13 925.5 3.5 2 19 440.2 2.5 3 Air France
207.5 -2.3 24 512.1 26.9 24 Air Malta
4 367.6 -15.3 6 6 250.8 -14.3 6 Alitalia
1 858.7 2.7 12 2 679.2 -5.5 12 Austrian Airlines
492.7 23.1 17 967.4 -1.8 17 bmi
13 096.1 -1.8 3 20 925.5 -7.3 2 British Airways
3 939.8 8.8 7 5 387.1 21.8 7 Cargolux
74.0 5.9 28 157.8 2.4 28 Croatia Airlines
377.2 7.8 20 600.6 4.2 22 CSA
338.4 7.8 21 531.8 4.6 23 Cyprus Airways
993.3 10.7 14 1 895.1 5.9 14 Finnair
4 483.3 -3.0 5 7 674.1 -4.0 5 Iberia
404.7 -14.8 18 648.9 -15.1 21 Icelandair
93.9 18.9 27 194.4 13.5 27 JAT
10 111.1 1.3 4 12 800.0 -2.4 4 KLM
581.2 3.4 16 977.6 -9.0 16 LOT
16 795.7 1.4 1 23 017.7 -4.9 1 Lufthansa
52.3 -1.4 30 103.0 -2.3 30 Luxair
305.6 -4.7 22 651.0 -6.8 20 Malev
203.7 4.8 25 397.9 -7.3 26 Meridiana
797.7 -11.9 15 1 480.7 -13.4 15 Olympic Airways
280.8 23 713.4 18 SN Brussels Airlines
3 131.6 6.6 10 4 578.8 -3.2 10 SAS
395.2 -26.3 19 683.2 -26.1 19 Spanair
3 231.4 -32.5 9 5 147.2 -28.8 9 SWISS
1 224.7 5.9 13 2 130.1 5.6 13 TAP Air Portugal
150.8 -14.6 26 405.6 -18.4 25 TAROM
2 008.6 6.3 11 3 132.4 -9.8 11 THY Turkish Airlines
3 433.1 -5.3 8 5 291.3 -11.2 8 Virgin Atlantic
87 421.9 -3.3 129 507.0 -6.8 AEA
Available Tonne-Kilometres Revenue Tonne-Kilometres
ASSOCIATION OF EUROPEAN AIRLINES V - 9

2002
(%) pt rank
Adria Airways 49.7 -2.1 24
Aer Lingus
Air France 71.6 0.7 4
Air Malta 40.5 -12.1 28
Alitalia 69.9 -0.8 5
Austrian Airlines 69.4 5.6 6
bmi 50.9 10.3 22
British Airways 62.6 3.5 13
Cargolux 73.1 -8.7 2
Croatia Airlines 46.9 1.5 27
CSA 62.8 2.1 11
Cyprus Airways 63.6 1.9 10
Finnair 52.4 2.3 20
Iberia 58.4 0.6 16
Icelandair 62.4 0.2 14
JAT 48.3 2.2 25
KLM 79.0 2.9 1
LOT 59.5 7.1 15
Lufthansa 73.0 4.5 3
Luxair 50.8 0.5 23
Malev 46.9 1.0 26
Meridiana 51.2 5.9 21
Olympic Airways 53.9 0.9 19
SN Brussels Airlines 39.4 29
SAS 68.4 6.3 7
Spanair 57.8 -0.2 17
SWISS 62.8 -3.5 12
TAP Air Portugal 57.5 0.1 18
TAROM 37.2 1.7 30
THY Turkish Airlines 64.1 9.7 9
Virgin Atlantic 64.9 4.0 8
AEA 67.5 2.5
TOTAL SCHEDULED - Passenger & All-Cargo Services
Overall Load Factor
V – 10 ASSOCIATION OF EUROPEAN AIRLINES
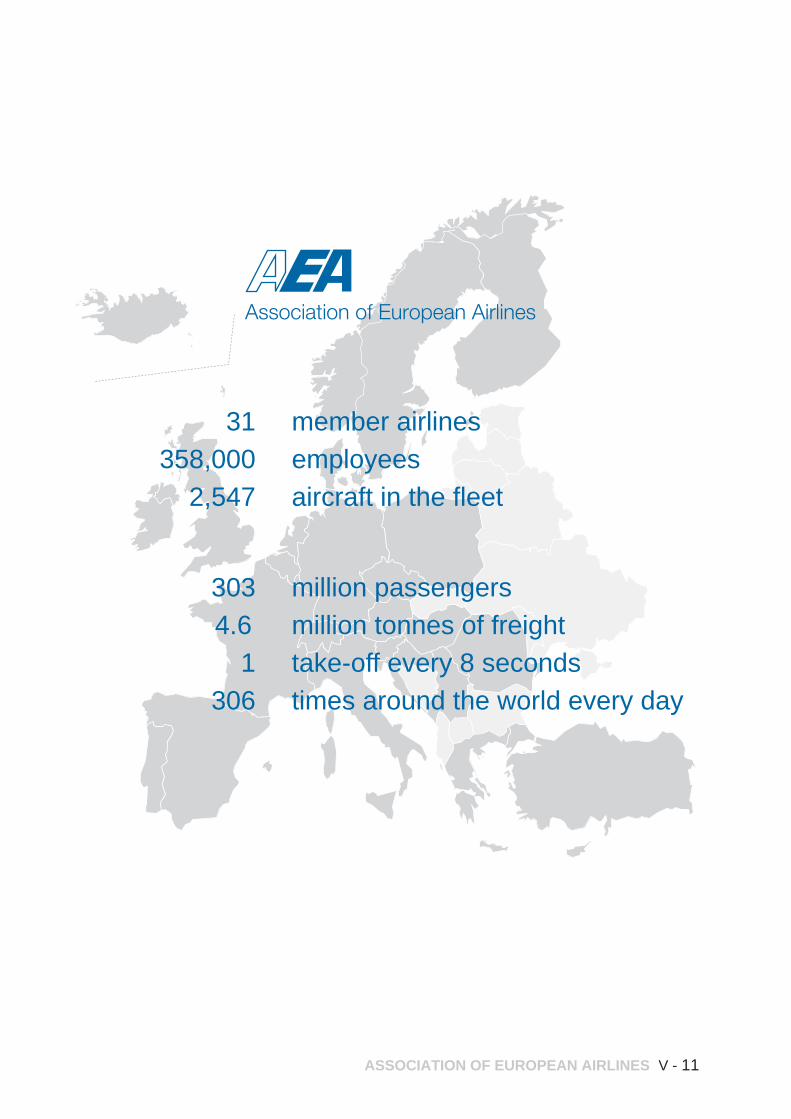
31358,000
2,547
member airlinesemployeesaircraft in the fleet
3034.6
1306
million passengersmillion tonnes of freighttake-off every 8 secondstimes around the world every day
Association of European Airlines
ASSOCIATION OF EUROPEAN AIRLINES V - 11

WHAT DO WE MEAN BY … ?
V - 12 ASSOCIATION OF EUROPEAN AIRLINES
MEMBERS OF THE AEA JP Adria Airways EI Aer Lingus AF Air France KM Air Malta AZ Alitalia OS Austrian Airlines BD bmi BA British Airways CV Cargolux Airlines International OU Croatia Airlines OK CSA Czech Airlines CY Cyprus Airways AY Finnair IB Iberia FI Icelandair JU JAT Airways KL KLM LO LOT Polish Airlines LH Lufthansa LG Luxair MA Malev Hungarian Airlines IG Meridiana OA Olympic Airways SK SAS JK Spanair SN SN Brussles Airlines LX SWISS TP TAP Air Portugal RO TAROM TK Turkish Airlines VS Virgin Atlantic Airways AREA/ROUTE DEFINITIONS The data refer to the scheduled operations of AEA member airlines, broken down between the following groups of routes. It should be noted that each route is allocated in its entirety to one region from station of origin to final destination, except for the Atlantic where first point of entry determines the route allocation. Numbering corresponds to that found in the Key Statistics section. 1. Domestic & Territorial: scheduled services commencing and terminating within the boundries of a State by an air carrier whose principal place of business is in that State, or on routes between a State and territories belonging to it, or between two such territories even tough a stage may cross international waters or over the territory of another State and carry international traffic on intermediate stages. In the case of multinational airlines owned by partner States, traffic within each partner State is reported as Domestic and all other traffic as international. 2. Geographical Europe: includes all scheduled international routes originating and terminating within the region comprising geographical Europe and
European Russia up to the Urals (longitude 55°E), including Iceland, Turkey, Azores, Canary Islands, Madeira and Cyprus. 1-2 Total Europe: the sum of Domestic & Territorial and cross-border Geographical Europe. 3. Europe-North Africa: scheduled services between Europe and Algeria, Egypt, Libya, Morocco, Sudan and Tunisia. 4. Europe-Middle East: scheduled terminating services between Europe and Bahrain, Iran, Iraq, Israel, Jordan, Kuwait, Lebanon, Muscat, Oman, Qatar, Saudi Arabia, Syria, UAE, Republic of Yemen. 2-4 International Short/Medium Haul: the sum of Geographical Europe, North Africa and Middle East. 5. North Atlantic: scheduled services between Europe and the Americas via gateways in Continental USA and Canada. 6. Mid Atlantic: scheduled services between Europe and the Americas via gateways in the Caribbean (plus Bermuda), Central America or the South American mainland north of Brazil. 7. South Atlantic: scheduled services between Europe and the Americas via gateways in, or south of, Brazil. 8. Europe-Sub Saharan Africa: scheduled services between Europe and Africa, excluding those countries classed as North Africa (see above). 9. Europe-Far East and Australasia: scheduled services between Europe and points east of the Middle East region, including trans-Polar and trans-Siberian flights. 5-9 Total Long-haul: the sum of North, Mid- and South Atlantic, Sub-Saharan Africa, Far East/Australasia and ‘Other long-haul’ routes not covered above. Total International: the sum of International Short/Medium Haul and Total Long-haul. 1-9 Total Scheduled Traffic: the sum of International Short/Medium Haul and Total Long-haul plus Domestic & Territorial. Non-Scheduled: see below. Systemwide: Total Scheduled and Non-Scheduled traffic. STATISTICAL DEFINITIONS Reporting Methodology: For the statistical data included in the data tables in this Yearbook, the reporting guideline applicable from 2001 data is as

ASSOCIATION OF EUROPEAN AIRLINES V - 13
follows: All operational and traffic items should be reported by the operating carrier, including those performed by code-shared, franchised or pooled services, blocked-off charter, blocked-space arrangements, joint services and leased aircraft services. In this context the term operating carrier refers to the carrier whose flight number is being used for air traffic control purposes. In terms of data coverage, airline mainline data may also include data for subsidiaries, franchisees or daughter companies. For 2001 data, following subsidiaries and/or franchisees are reported to the AEA annual data collection by the participating airlines:
• Air France (AF): Brit Air, British European, Compagnie Corse Méditerranée (CCM), City Jet, Régional (merger of Regional Airlines, Flandre Air and Proteus).
• Alitalia (AZ): Alitalia Team (until Aug 2002) and Alitalia Express.
• Austrian Airlines Group (OS): Austrian Airlines AG, Lauda Air, Tyrolean Airways. Tyrolean Airways including former Rheintalflug wef 1st Oct 2002.
• British Airways (BA): BA CitiExpress [Brymon Airways, British Regional Airlines or BRAL (wef 1st Apr 2002), Manx Airlines (wef 1st Sept 2002)] and CityFlyer Express (incorporated in BA mainline).
• bmi (BD): BD Commuter, bmi baby. • Icelandair (FI): Icelandair Cargo, Icelandair Charter
& Lease. • Spanair (JK): AeBal (Aerolineas de Baleares). • KLM (KL): KLM CityHopper, KLM uk. • Lufthansa (LH): Lufthansa Cargo, Lufthansa
CityLine,Team Lufthansa (Augsburg Airways, Cimber Air, Cirrus Air, Contact Air, Eurowings and Rheinthalflug).
• LOT (LO): wetlease operations on Eurolot. • Malev (MA): Malev Express. • SAS (SK): wetlease operations on SK Commuter
and Swedair. • SNBA (SN): wetlease operations on Birdy. • SWISS (LX): Europe Continental Airways. (ECA).
Scheduled Services: Flights scheduled and performed for remuneration according to a published timetable, or so regular or frequent as to constitute a recognisably systematic series, which are open to direct booking by members of the public. Extra flights occasioned by overflow traffic from scheduled flights and preparatory revenue flights on planned air services are also considered to be scheduled services. Non-scheduled services: Are defined as ‘Non-scheduled services’: charter flights and special flights performed for remuneration on an irregular basis, including empty flights and blocked-off charters, other than those reported under scheduled services. Blocked-off charters: when the whole capacity of an aircraft is reserved for charter sale on flights published
as scheduled but carried out as charter flights on the same or similar routing and timetable. Revenue Passengers Carried: A passenger for whose transportation an air carrier receives commercial remuneration. This includes, for example, (i) passengers travelling under publicly available promotional offers (for example “two-for-one”) or loyalty programmes (for example redemption of frequent flyer points); (ii) passengers travelling as compensation for denied boarding; (iii) passengers travelling at corporate discounts; (iv) passengers travelling on preferential fares (government, seamen, military, youth, student etc). Are excluded, for example, (i) persons travelling free; (ii) persons travelling at a fare or discount available only to employees of air carriers or their agents or only for travel on the business of the carriers; (iii) infants who do not occupy a seat. Revenue Freight: All freight counted on a point-to-point basis (in metric tonnes) covered by air waybills for which remuneration is received. Freight carried on trucking services is not included. Distances: Airport-to-Airport great circle distances are used. Revenue Passenger-Kilometres (RPK): One fare-paying passenger transported one kilometre. RPK's are computed by multiplying the number of revenue passengers by the kilometres they are flown. Available Seat-Kilometres (ASK): The total number of seats available for the transportation of revenue passengers multiplied by the number of kilometres which those seats are flown. Passenger Load Factor %: The percentage of seating capacity which is actually sold and utilised. Computed by dividing revenue passenger-kilometres flown by available seat-kilometres flown on revenue passenger services. Revenue Tonne-Kilometres (RTK): One tonne of revenue traffic transported one kilometre. Revenue tonne-kilometres are computed by multiplying metric tonnes of revenue traffic (passenger, freight and mail) by the kilometres which this traffic is flown. Passenger tonne-kilometres are calculated using standard weights (including baggage) which may differ between airlines and between domestic/short/long-haul. Available Tonne-Kilometres (ATK): The total number of metric tonnes available for the transportation of passengers, freight and mail multiplied by the number of kilometres which this capacity is flown. Overall Load Factor %: The percentage of total capacity available for passengers, freight and mail which is actually sold and utilised. Computed by dividing total revenue tonne-kilometres actually flown by total available tonne-kilometres.

V - 14 ASSOCIATION OF EUROPEAN AIRLINES
Yield: The average amount of revenue received per revenue tonne-kilometre. Passenger yield: passenger revenue per RPK. Unit Cost: The average operating cost incurred per available tonne-kilometre. Operating Ratio: The relationship between operating revenues and operating expenses. The latter may be inclusive or exclusive of net interest. Breakeven Load Factor: The load factor at which operating revenues will cover operating costs. Unit cost divided by yield. AIR FREEDOM RIGHTS 1st freedom: to overfly one country en-route to another. 2nd freedom: to make a technical stop in another country. 3rd freedom: to carry passengers from the home country to another country. 4th freedom: to carry passengers to the home country from another country. 5th freedom: to carry passengers between two countries by an airline of a third on a route with origin/destination in its home country. 6th freedom: to carry passengers between two countries by an airline of a third on two routes connecting in its home country. 7th freedom: to carry passengers between two countries by an airline of a third on a route outside its home country. 8th freedom or cabotage: to carry passengers within a country by an airline of another country on a route with origin/destination in its home country. 9th freedom or Stand-Alone cabotage: to carry passengers within a country by an airline of another country. True domestic: to carry passengers by an airline in its home country. ABBREVIATIONS AAPA: Association of Asia Pacific Airlines, with headquarters in Kuala Lumpur. ATC: Air Traffic Control
CAA: Civil Aviation Authority. CFMU: Central Flow Management Unit, of Eurocontrol. CODA: Central Office for Delay Analysis. DGCA: Directorate General of Civil Aviation. ECAC: European Civil Aviation Conference, with headquarters in Paris. EIA: Energy Information Administration of the US governments’s Department of Energy. EU: European Union: (from 1958) Belgium, France, Germany (west), Italy, Luxembourg, Netherlands, (from 1973) Denmark, Ireland, United Kingdom, (from 1981), Greece, (from 1986) Portugal, Spain, (from 1995) Austria, Finland and Sweden. The following candidate countries are due to join in 2004: Cyprus, the Czech Republic, Estonia, Hungary, Latvia, Lithuania, Malta, Poland, the Slovak Republic and Slovenia. Membership of Bulgaria and Romania is scheduled for 2007. Eurocontrol: European Organisation for the Safety of Air Navigation. IACA: International Air Carrier Association: worldwide membership of leisure (non-scheduled) air carriers. IATA: International Air Transport Association, with headqarters in Geneva and Montreal. ICAO: International Civil Aviation Organisation, with headquarters in Montreal, Canada. OAG: Official Airline Guide, of the Reed Elsevier plc Group. DIRECTORATES GENERAL OF THE EUROPEAN COMMISSION Agriculture Competition Economic and Financial Affairs Education and Culture Employment and Social Affairs Energy and Transport (DG Tren) Enterprise Environment Fisheries Health and Consumer Protection Information Society Internal Market Joint Research Centre Justice and Home Affairs Regional Policy Research Taxation and Customs Union

cargolux
Association of European AirlinesAvenue Louise 350
1050 Brussels, BelgiumTel. + 32 (0)2 639 89 89Fax + 32 (0)2 639 89 [email protected]
www.aea.be