Year-end report 2017 Investment AB Latour · Latour –a mixed investment company Focus on...
14
Year-end report 2017 Investment AB Latour
Transcript of Year-end report 2017 Investment AB Latour · Latour –a mixed investment company Focus on...

Year-end report 2017
Investment AB Latour

Latour – a mixed investment company
Focus on long-term value creation
LATOUR
WHOLLY-OWNED OPERATIONS
HULTAFORS GROUP
LATOUR INDUSTRIES
NORD-LOCK GROUP
SWEGON
PART-OWNED OPERATIONS
DIAMORPH
NEUFFER
OXEON
TERRATECH
INVESTMENT PORTFOLIO
ASSA ABLOY
FAGERHULT
HMS NETWORKS
LOOMIS
NEDERMAN
SECURITAS
SWECO
TOMRA
TROAX
ALIMAK GROUP

Highlights in the investment portfolio
Total return for the portfolio
The total return including share price growth and dividend, for each investmentcompany compared with the SIXRX benchmark index.
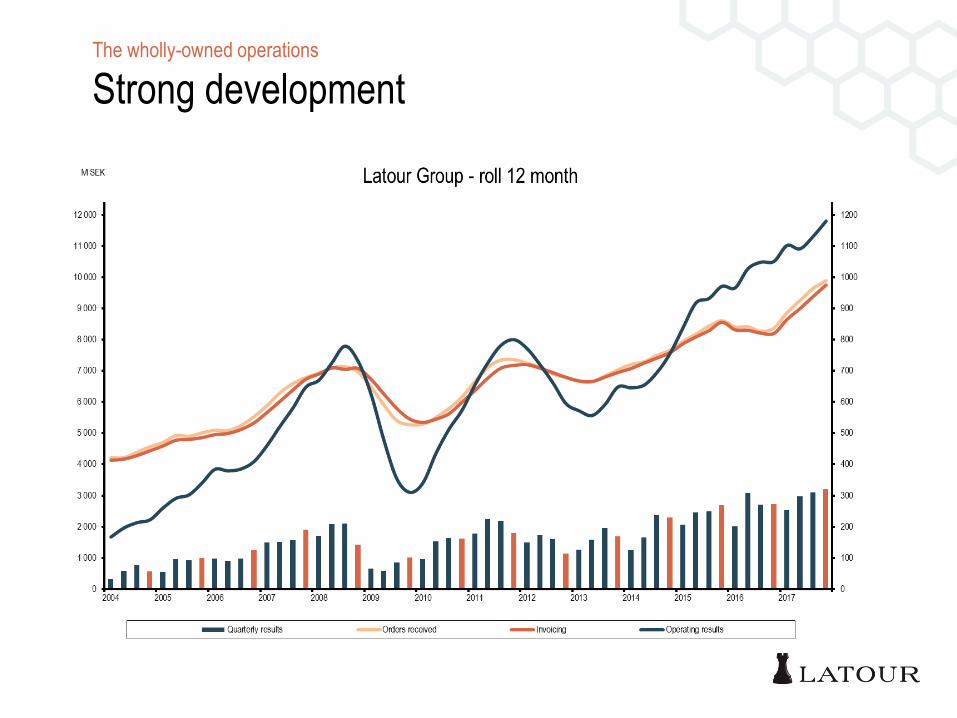
The wholly-owned operations
Strong development

The wholly-owned operations
Transactions during the year

SEK m Q4 2017 Q4 2016
Net sales 542 498
Operating result 92 95
Operating margin % 17.0 19.1
0
50
100
150
200
250
300
0
500
1000
1500
2000
2500
3000
2013 2014 2015 2016 2017
Net sales
Operating result
Development net sales and result, SEK M
Business area Hultafors Group
Solid organic growth

Development net sales and result, SEK M
0
50
100
150
200
250
0
500
1000
1500
2000
2500
2013 2014 2015 2016 2017
Net sales
Operating result
Business area Latour Industries
Strong net sales
SEK m Q4 2017 Q4 2016
Net sales 706 477
Operating result 55 35
Operating margin % 7.8 7.2

Development net sales and result, SEK M
0
50
100
150
200
250
300
350
400
0
250
500
750
1000
1250
1500
1750
2000
2013 2014 2015 2016 2017
Net sales
Operating result
Business area Nord-Lock Group
Strong organic growth
SEK m Q4 2017 Q4 2016
Net sales 268 240
Operating result 76 61
Operating margin % 28.3 25.6

Development net sales and result, SEK M
0
50
100
150
200
250
300
350
400
450
500
0
500
1000
1500
2000
2500
3000
3500
4000
4500
5000
2013 2014 2015 2016 2017
Net sales
Operating result
Business area Swegon
Transformation journey continues
SEK m Q4 2017 Q4 2016
Net sales 1 130 1 063
Operating result 98 81
Operating margin % 8.7 7.6
WHOLLY-OWNED
OPERATIONS
PART-OWNED
OPERATIONS
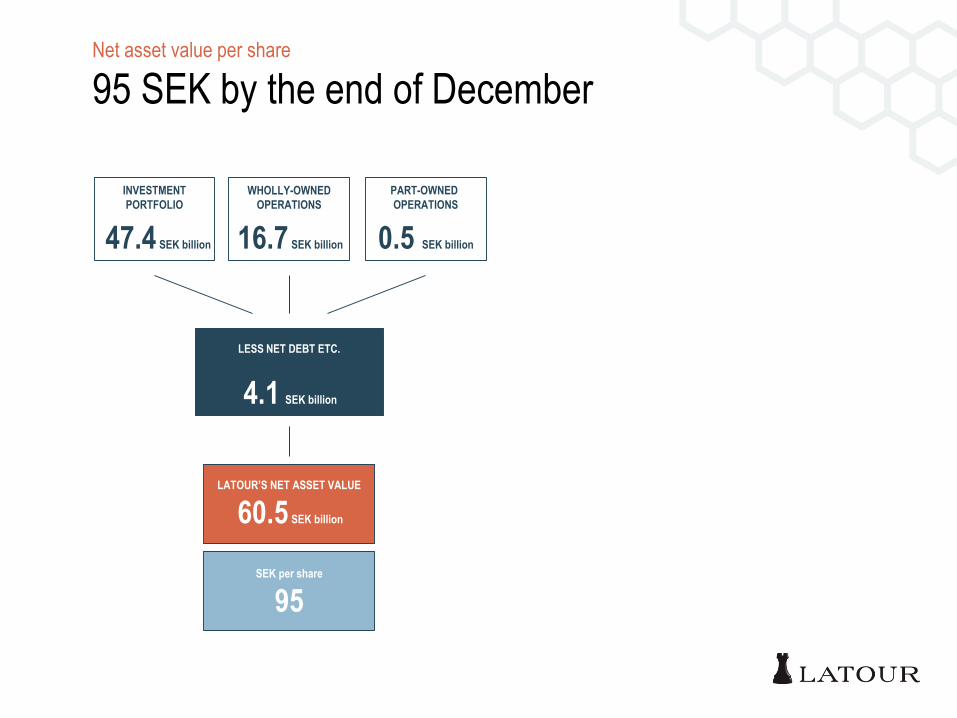
47.4 SEK billion 16.7 SEK billion 0.5 SEK billion
LESS NET DEBT ETC.
4.1 SEK billion
LATOUR’S NET ASSET VALUE
60.5 SEK billion
SEK per share
95
Net asset value per share
95 SEK by the end of December
INVESTMENT
PORTFOLIO

Long-term perspective
Financial targets
Annual growth >10%Operating margin >10%Return on operating capital 15 - 20%

Distribution policy
Actual yearly dividends 2008 – 2017SEK (adjusted for split 4:1 in June 2017)
100% of received dividends from
Investment Portfolio
40-60% of net profit from wholly-
owned operations
0.94
0.69
0.94
1.5*
1.25
1.381.5
1.69
2.00
Financial performance and outlook
Dividend increase
2.25**
* Extra dividend** Proposed dividend
0
0,5
1
1,5
2
2,5
2008 2009 2010 2011 2012 2013 2014 2015 2016 2017

Net sales outside the Nordic region
International growth with proprietary products
8 % 86 %6 %
20 %
57 %
2003 2017

Investment AB Latour
Q&A